sensors & transducers journal, vol. 130, issue 7, july 2011, pp. 77-90 sensors...
TRANSCRIPT

Sensors & Transducers Journal, Vol. 130, Issue 7, July 2011, pp. 77-90
77
SSSeeennnsssooorrrsss &&& TTTrrraaannnsssddduuuccceeerrrsssISSN 1726-5479© 2011 by IFSA
http://www.sensorsportal.com
Switching and Release Time Analysis of Electrostatically Actuated Capacitive RF MEMS Switches
1, 2 S. Shekhar, 2 K. J. Vinoy, 3 G. K. Ananthasuresh
1Centre for Nano Science and Engineering, 2Department of Electrical Communication Engineering, 3Department of Mechanical Engineering, Indian Institute of Science, Bangalore, India
Tel.: +91- 80-2293-2853 E-mail: [email protected]
Received: 24 May 2011 /Accepted: 22 July 2011 /Published: 29 July 2011 Abstract: This paper explains the reason behind pull-in time being more than pull-up time of many Radio Frequency Micro-Electro-Mechanical Systems (RF MEMS) switches at actuation voltages comparable to the pull-in voltage. Analytical expressions for pull-in and pull-up time are also presented. Experimental data as well as finite element simulations of electrostatically actuated beams used in RF-MEMS switches show that the pull-in time is generally more than the pull-up time. Pull-in time being more than pull-up time is somewhat counter-intuitive because there is a much larger electrostatic force during pull-in than the restoring mechanical force during the release. We investigated this issue analytically and numerically using a 1D model for various applied voltages and attribute this to energetics, the rate at which the forces change with time, and softening of the overall effective stiffness of the electromechanical system. 3D finite element analysis is also done to support the 1D model-based analyses. Copyright © 2011 IFSA. Keywords: RF MEMS, Pull-in time, Release time, Frequency pull-in effect. 1. Introduction A microelectromechanical switch is one of the important radio frequency microelectromechanical systems (RF-MEMS) devices. The well-known reasons for the popularity of MEMS switches are low insertion loss, high isolation, low power consumption, and high linearity as compared to semiconductor switches (e.g., p-i-n diodes, field effect transistors (FETs), etc.) even at very high frequencies [1-3]. However, switching time is one of the major concerns with MEMS switches [2]. Thus, the timing analysis considered in this paper is of importance in the design of electrostatically actuated RF switches.
Sensors & Transducers Journal, Vol. 130, Issue 7, July 2011, pp. 77-90
78
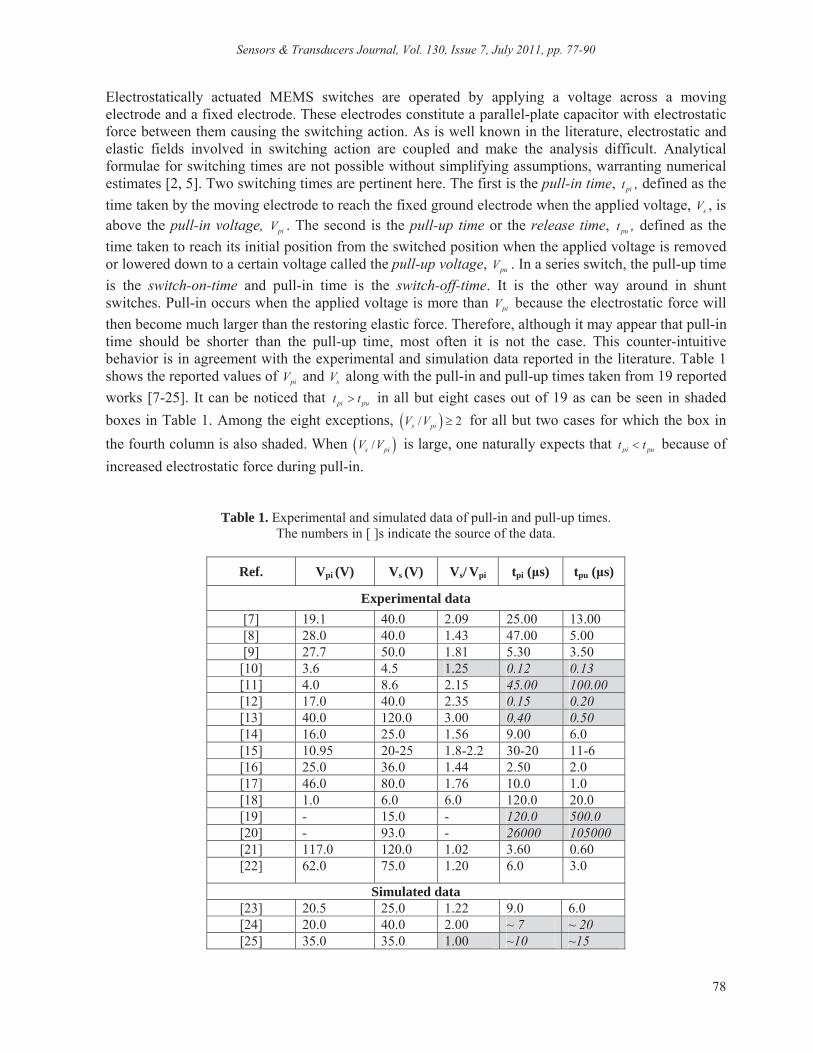
Electrostatically actuated MEMS switches are operated by applying a voltage across a moving electrode and a fixed electrode. These electrodes constitute a parallel-plate capacitor with electrostatic force between them causing the switching action. As is well known in the literature, electrostatic and elastic fields involved in switching action are coupled and make the analysis difficult. Analytical formulae for switching times are not possible without simplifying assumptions, warranting numerical estimates [2, 5]. Two switching times are pertinent here. The first is the pull-in time, pit , defined as the time taken by the moving electrode to reach the fixed ground electrode when the applied voltage, sV , is above the pull-in voltage, piV . The second is the pull-up time or the release time, put , defined as the time taken to reach its initial position from the switched position when the applied voltage is removed or lowered down to a certain voltage called the pull-up voltage, puV . In a series switch, the pull-up time is the switch-on-time and pull-in time is the switch-off-time. It is the other way around in shunt switches. Pull-in occurs when the applied voltage is more than piV because the electrostatic force will then become much larger than the restoring elastic force. Therefore, although it may appear that pull-in time should be shorter than the pull-up time, most often it is not the case. This counter-intuitive behavior is in agreement with the experimental and simulation data reported in the literature. Table 1 shows the reported values of piV and sV along with the pull-in and pull-up times taken from 19 reported works [7-25]. It can be noticed that pi put t in all but eight cases out of 19 as can be seen in shaded boxes in Table 1. Among the eight exceptions, / 2s piV V for all but two cases for which the box in the fourth column is also shaded. When /s piV V is large, one naturally expects that pi put t because of increased electrostatic force during pull-in.
Table 1. Experimental and simulated data of pull-in and pull-up times. The numbers in [ ]s indicate the source of the data.
Ref. Vpi (V) Vs (V) Vs/ Vpi tpi ( s) tpu ( s)
Experimental data [7] 19.1 40.0 2.09 25.00 13.00 [8] 28.0 40.0 1.43 47.00 5.00 [9] 27.7 50.0 1.81 5.30 3.50
[10] 3.6 4.5 1.25 0.12 0.13 [11] 4.0 8.6 2.15 45.00 100.00 [12] 17.0 40.0 2.35 0.15 0.20 [13] 40.0 120.0 3.00 0.40 0.50 [14] 16.0 25.0 1.56 9.00 6.0 [15] 10.95 20-25 1.8-2.2 30-20 11-6 [16] 25.0 36.0 1.44 2.50 2.0 [17] 46.0 80.0 1.76 10.0 1.0 [18] 1.0 6.0 6.0 120.0 20.0 [19] - 15.0 - 120.0 500.0 [20] - 93.0 - 26000 105000 [21] 117.0 120.0 1.02 3.60 0.60 [22] 62.0 75.0 1.20 6.0 3.0
Simulated data [23] 20.5 25.0 1.22 9.0 6.0 [24] 20.0 40.0 2.00 ~ 7 ~ 20 [25] 35.0 35.0 1.00 ~10 ~15
Sensors & Transducers Journal, Vol. 130, Issue 7, July 2011, pp. 77-90
79
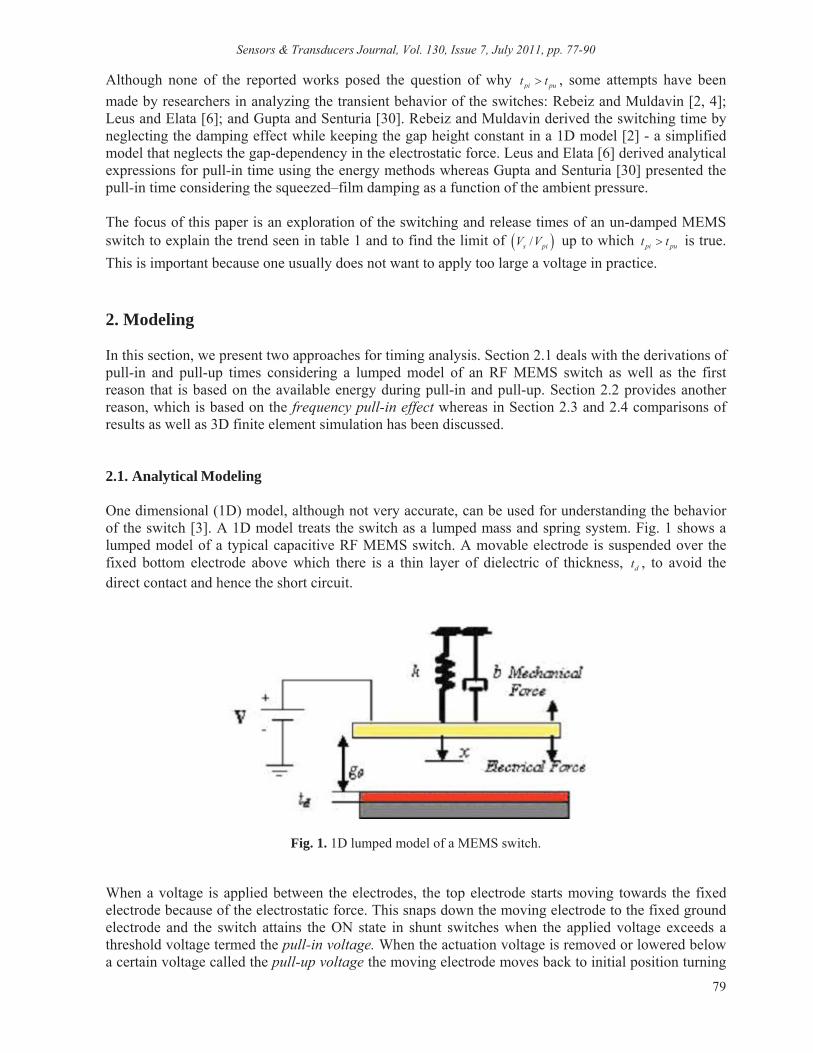
Although none of the reported works posed the question of why pi put t , some attempts have been made by researchers in analyzing the transient behavior of the switches: Rebeiz and Muldavin [2, 4]; Leus and Elata [6]; and Gupta and Senturia [30]. Rebeiz and Muldavin derived the switching time by neglecting the damping effect while keeping the gap height constant in a 1D model [2] - a simplified model that neglects the gap-dependency in the electrostatic force. Leus and Elata [6] derived analytical expressions for pull-in time using the energy methods whereas Gupta and Senturia [30] presented the pull-in time considering the squeezed–film damping as a function of the ambient pressure. The focus of this paper is an exploration of the switching and release times of an un-damped MEMS switch to explain the trend seen in table 1 and to find the limit of /s piV V up to which pi put t is true. This is important because one usually does not want to apply too large a voltage in practice. 2. Modeling In this section, we present two approaches for timing analysis. Section 2.1 deals with the derivations of pull-in and pull-up times considering a lumped model of an RF MEMS switch as well as the first reason that is based on the available energy during pull-in and pull-up. Section 2.2 provides another reason, which is based on the frequency pull-in effect whereas in Section 2.3 and 2.4 comparisons of results as well as 3D finite element simulation has been discussed. 2.1. Analytical Modeling One dimensional (1D) model, although not very accurate, can be used for understanding the behavior of the switch [3]. A 1D model treats the switch as a lumped mass and spring system. Fig. 1 shows a lumped model of a typical capacitive RF MEMS switch. A movable electrode is suspended over the fixed bottom electrode above which there is a thin layer of dielectric of thickness, dt , to avoid the direct contact and hence the short circuit.
Fig. 1. 1D lumped model of a MEMS switch. When a voltage is applied between the electrodes, the top electrode starts moving towards the fixed electrode because of the electrostatic force. This snaps down the moving electrode to the fixed ground electrode and the switch attains the ON state in shunt switches when the applied voltage exceeds a threshold voltage termed the pull-in voltage. When the actuation voltage is removed or lowered below a certain voltage called the pull-up voltage the moving electrode moves back to initial position turning

Sensors & Transducers Journal, Vol. 130, Issue 7, July 2011, pp. 77-90
80
the switch OFF condition. As we can see from the lumped modeling, RF MEMS switches are inertia-limited (acceleration limited) systems which makes the switching speed low as compared to the semiconductor switches (p-i-n, FET). The switching time is obtained by using the dynamic equation of motion given by 22
02 2
0
12 ( )
se
d
r
AVd x dxm b kx Ftdtdt g x
, (1)
where eF is the electrostatic force, m is the effective mass, b is the damping coefficient, and k is the stiffness of the beam. For a fixed-fixed beam with a force distributed over the overlapping area of the beam, k is given by [2]: 3
332 8 (1 )Ewt wtk
ll , (2)
where E is the Young’s modulus, is the Poisson’s ratio, is the residual stress, and l , w and t are the length, width, and thickness of the beam, respectively. This equation was solved numerically for a capacitive shunt RF MEMS switch whose material and geometrical parameters are specified in Table 2. The switching and release times are shown in Fig. 2 and 3. When / 1s piV V , the elastic restoring force is no longer balanced by the downward electrostatic force. Then, the top electrode snaps down to the bottom electrode.
Table 2. Material and geometrical parameters of the switch.
Electrode length 300 μm Electrode Width 80 m Pull-down electrode length 80 m Thickness 1 m Gap height 3 m Dielectric constant 7.6 Young’s modulus gold 80 GPa Density of gold 19320 kg/m3 Poisson’s ratio 0.41
As it is well known, this instability occurs when the displacement is greater than 1/3rd of the initial gap. Therefore, the pull-in voltage for 1D lumped model can be estimated by equating the electrostatic force and the elastic restoring force at 0(1/ 3)x g and their derivatives with respect to x . 2
02
00
2( )s
e sAV
F F kxg x
(3)
2
03
00
( )sAV
kg x
(4)
By solving equations (3) and (4), we get 0(1/ 3)x g and the pull-in voltage as

Sensors & Transducers Journal, Vol. 130, Issue 7, July 2011, pp. 77-90
81
3
0
0
827pi
kgV
A (5)
0 5 10 15 200
0.5
1
1.5
2
2.5
3
3.5
Time [us]
Dis
plac
emen
t [um
]
Vs = VpiVs = 1.2VpiVs = 1.4VpiVs = 1.6VpiVs = 1.8VpiVs = 2.0Vpi
0 20 40 60 80 100-1
0
1
2
3
Time [us]
Dis
plac
emen
t [um
]
Vs=Vpu=0.3167VVs = 0.3166VVs = 0.3165VVs = 0.18VVs = 0.0V
(a)
(b)
Fig. 2. (a) Switching and (b) release time simulation of a capacitive shunt MEMS switch for different Vs and Vpu.
The analytical expressions of the switching and release times are obtained from the dynamic equation of motion. Equation (1) is modified for the case of no damping (i.e. 0b ) with initial conditions: 0x and 0dx dt at 0t : 22
02 2
0
12 ( )
se
AVd xm kx Fdt g x
(6)
By noting that dxu x
dt (7)
2
2d x du du dx duu x u u
dt dx dt dtdt (8)
Eq. (5) can be written as 2
02
0
12
sAVmu kx
g x (9)
2
02
0
12
sAVmu kx
g x (10)

Sensors & Transducers Journal, Vol. 130, Issue 7, July 2011, pp. 77-90
82
22 0
20
12
sAVdu d ku u u xdt dt mm g x
(11)
By integrating the preceding Eq. (11) with respect to t and integrating both sides of the resulting equation, we get 0
2 20 20 0
0 0( )
g
pis s
dxtAV AVk x
m g x m mg
(12)
For comparison, the formula for pit given in [2] by assuming constant gap (i.e., the nonlinearity in terms of x is ignored in Eq. (9)) was
, (13)
where 0 /k m . Fig. 3 shows the values of p it computed using Eq. (12) and Eq. (9) for different values of sV . Considerable discrepancy between the two is apparent from the Fig. 3.
6 8 10 12 14 16 181
1.2
1.4
1.6
1.8
2
Nor
amal
ized
vol
tage
, Vs/
Vp
Time [us]
Rebeiz pull-in time [equation-8]Analytical pull-in time [equation-9]
Fig. 3. Comparison between p it given by equations (8) and (9) for different values of sV .
An analytical expression for the release time can be derived by using the energy method. With 0sV , the total energy at any time t can be equated to the total energy at the pulled-in condition to get 2 2 2
01 1 12 2 2
m x kx kg (14)
and from which we can obtain the pull-up time.

Sensors & Transducers Journal, Vol. 130, Issue 7, July 2011, pp. 77-90
83
0
14put
f , (15)
where 0 /f k m . The preceding result is not surprising because the electrode moves a quarter of its cyclical motion to reach the undeformed state for the first time. Fig. 4 shows the displacement of the moving electrode on the same plot for a switch whose specifications are presented in Table 2, solid line shows the displacement during pull-in for s piV V = 18.71 V and dashed line shows pull-up for s puV V = 0.31 V. It can be seen that pit = 18.37 μs and put = 17.17 μs. If we were to use sV = 0 during pull-up, put would have been less than 17.17 μs.
5 10 15 200
0.5
1
1.5
2
2.5
3
3.5
Time [us]
Dis
plac
emen
t [um
]
Pull-up time = 17.17 usPull-in time = 18.37 us
Fig. 4. Switching and release simulation of a capacitive shunt switch.
Fig. 5 juxtaposes the elastic force with the electrostatic force. Even though the electrostatic force in all three cases exceeds the restoring spring force eventually, it should be noted that it starts from a low value and then increases with x . On the other hand, the restoring force starts from a high value and then decreases with decreasing x . Thus, more momentum is available during pull-up than that during pull-in. This is one explanation for pit being more than put . Of course, this conclusion depends on sV used for pull-in. This analysis is presented later in Section 2.3. 2.2. Frequency Pull-in Effect Electrostatic force acts as a negative spring. This force increases with the applied voltage which causes more deformation as a result of which the effective stiffness of the structure also changes. This change in effective stiffness shifts the natural frequency of the electromechanical system. The natural frequency and the applied voltage are related as [3, 30] 2
03
0
sA Vkgf
m (16)

Sensors & Transducers Journal, Vol. 130, Issue 7, July 2011, pp. 77-90
84
Indeed, at pull-in voltage, the natural frequency of the system approaches zero. This is known as frequency pull-in effect [30] as can be seen in Fig. 6.
0 1 2 3 40
1
2
3
4
5
x 10-5
Displacement [um]
Forc
e [N
]
Fs = KxVs > VpiVs = VpiVs < Vpi
Fig. 5. Elastic force ( kx ) shown as a solid black line and electrostatic forces at three voltages: below piV , equal to piV , and above piV , shows using curves.
0 5 10 15 2020
40
60
80
100
120
140
160
Applied Voltage [Volts]
Freq
uenc
y [K
Hz]
Fig. 6. The frequency pull-in effect. Whenever the effective natural frequency is low, the system oscillates slowly. This also implies that the position changes more slowly for a system with low stiffness as opposed to a system with high stiffness. Therefore, for a system whose stiffness decreases with position, the rapidity of the change in position is slowed down. Consequently, it will take more time for a system to traverse a particular value of the displacement if its stiffness (and hence the natural frequency) becomes zero. This is true for the 1D model of the electrostatically actuated switch as it is evident from Eq. (16) and Fig. 6. This explains why pit is more than put unless the applied voltage is much more than the pull-in voltage as discussed in the next.
Sensors & Transducers Journal, Vol. 130, Issue 7, July 2011, pp. 77-90
85
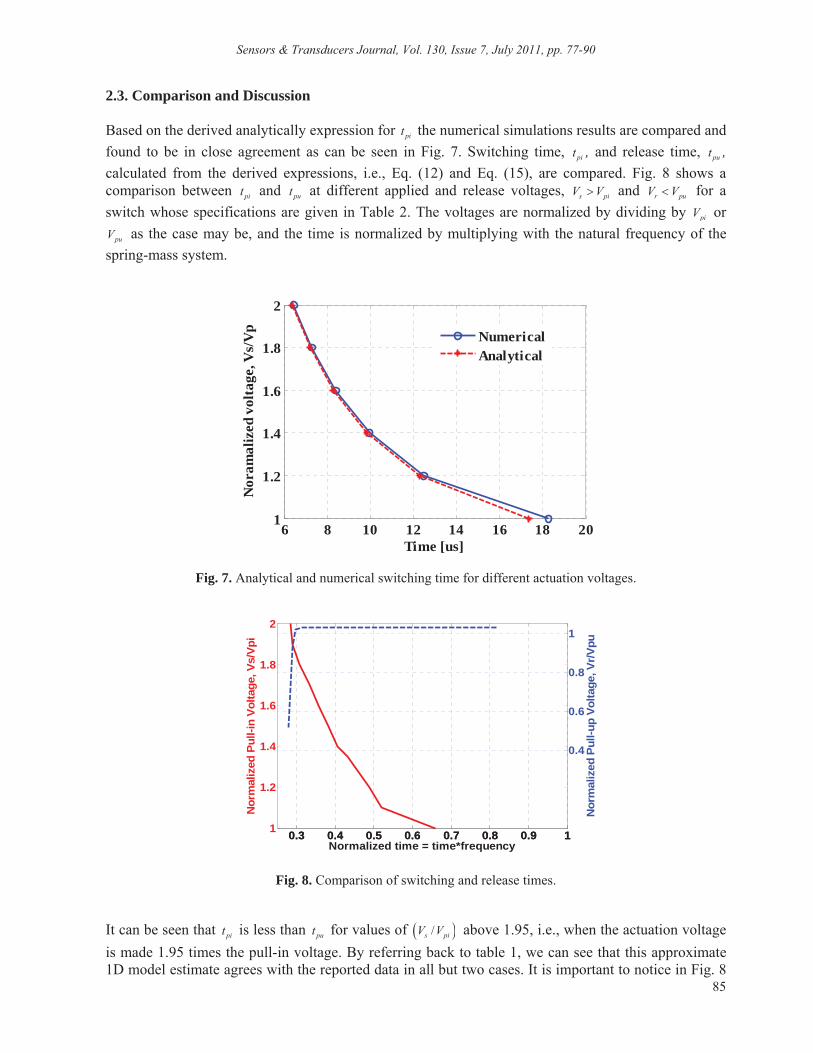
2.3. Comparison and Discussion Based on the derived analytically expression for pit the numerical simulations results are compared and found to be in close agreement as can be seen in Fig. 7. Switching time, pit , and release time, put , calculated from the derived expressions, i.e., Eq. (12) and Eq. (15), are compared. Fig. 8 shows a comparison between pit and put at different applied and release voltages, s piV V and r puV V for a switch whose specifications are given in Table 2. The voltages are normalized by dividing by piV or
puV as the case may be, and the time is normalized by multiplying with the natural frequency of the spring-mass system.
6 8 10 12 14 16 18 201
1.2
1.4
1.6
1.8
2
Time [us]
Nor
amal
ized
vol
tage
, Vs/
Vp
NumericalAnalytical
Fig. 7. Analytical and numerical switching time for different actuation voltages.
0.3 0.4 0.5 0.6 0.7 0.8 0.9 11
1.2
1.4
1.6
1.8
2
Nor
mal
ized
Pul
l-in
Volta
ge, V
s/Vp
i
Normalized time = time*frequency0.3 0.4 0.5 0.6 0.7 0.8 0.9 1
0.4
0.6
0.8
1
Nor
mal
ized
Pul
l-up
Volta
ge, V
r/Vpu
Fig. 8. Comparison of switching and release times.
It can be seen that pit is less than put for values of /s piV V above 1.95, i.e., when the actuation voltage is made 1.95 times the pull-in voltage. By referring back to table 1, we can see that this approximate 1D model estimate agrees with the reported data in all but two cases. It is important to notice in Fig. 8
Sensors & Transducers Journal, Vol. 130, Issue 7, July 2011, pp. 77-90
86
that when /s piV V is just more than unity, pit is lot more than put for 0rV . So, we expect to see
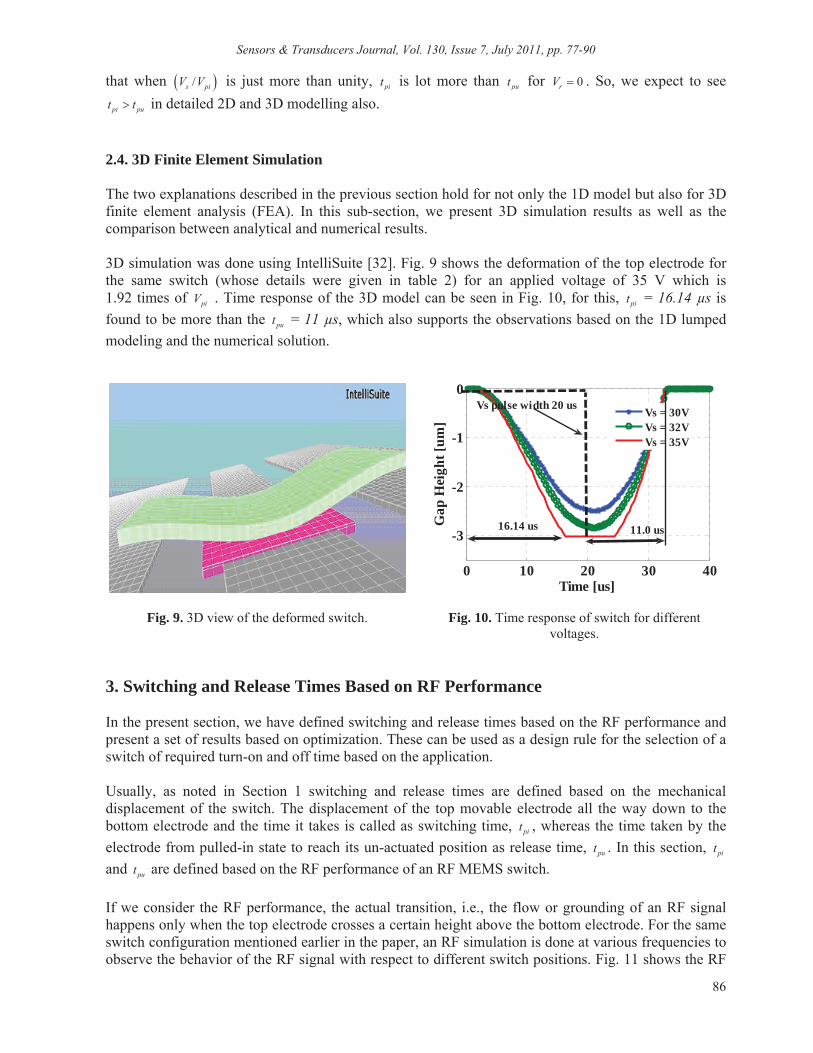
pi put t in detailed 2D and 3D modelling also. 2.4. 3D Finite Element Simulation The two explanations described in the previous section hold for not only the 1D model but also for 3D finite element analysis (FEA). In this sub-section, we present 3D simulation results as well as the comparison between analytical and numerical results. 3D simulation was done using IntelliSuite [32]. Fig. 9 shows the deformation of the top electrode for the same switch (whose details were given in table 2) for an applied voltage of 35 V which is 1.92 times of piV . Time response of the 3D model can be seen in Fig. 10, for this, pit = 16.14 μs is found to be more than the put = 11 μs, which also supports the observations based on the 1D lumped modeling and the numerical solution.
0 10 20 30 40
-3
-2
-1
0
Time [us]
Gap
Hei
ght [
um]
Vs = 30VVs = 32VVs = 35V
Vs pulse width 20 us
16.14 us 11.0 us
Fig. 9. 3D view of the deformed switch.
Fig. 10. Time response of switch for different voltages.
3. Switching and Release Times Based on RF Performance In the present section, we have defined switching and release times based on the RF performance and present a set of results based on optimization. These can be used as a design rule for the selection of a switch of required turn-on and off time based on the application. Usually, as noted in Section 1 switching and release times are defined based on the mechanical displacement of the switch. The displacement of the top movable electrode all the way down to the bottom electrode and the time it takes is called as switching time, pit , whereas the time taken by the electrode from pulled-in state to reach its un-actuated position as release time, put . In this section, pit and put are defined based on the RF performance of an RF MEMS switch. If we consider the RF performance, the actual transition, i.e., the flow or grounding of an RF signal happens only when the top electrode crosses a certain height above the bottom electrode. For the same switch configuration mentioned earlier in the paper, an RF simulation is done at various frequencies to observe the behavior of the RF signal with respect to different switch positions. Fig. 11 shows the RF

Sensors & Transducers Journal, Vol. 130, Issue 7, July 2011, pp. 77-90
87
performance of a capacitive shunt switch of 0g = 3 μm. As can be seen in the figure, there is no significant change in the S-parameter even for the displacement of 0 / 3g , the transition in the RF signal is observed only when the top electrode is at a height of less than 0.5 μm from the fixed bottom electrode depending on the operating frequency. It has been observed that at a frequency of 10 GHz losses are 12.20 dB and 0.11 dB when the top and bottom electrodes are at 0.01 μm 1 μm. At 30 GHz and are found to be 33.39 dB and 0.5 dB. Similarly, for 35 GHz losses have been found to be 48.00 dB and 0.79 dB. All simulations are done in high frequency structure simulator (HFSS), a finite element based fullwave electromagnetic simulator [33].
0 0.2 0.4 0.6 0.8 10
10
20
30
40
50
Displacement [um]
Inse
rtio
n L
oss
[dB
]
10 GHz20 GHz25 GHz30 GHz35 GHz
Fig. 11. Simulation results of insertion loss a shunt switch with respect to different gap heights. Therefore, if we defined the transition time based on the loss between 0.5 dB to 15 dB, the switch can be treated as ON for the loss i.e., insertion loss of 0.5 dB or less and OFF at the 15 dB or more. RF results based on the loss with respect to the position of the top electrode above the bottom electrode are compared with pit and put , which have been defined on the basis of mechanical displacement, we have found that pi put t . These results also support our 1D lumped model as well as 3D FEA analysis. As we see from the derived model, pit depends on various geometrical parameters such as the length, L , the width, w , the thickness, t , of the membrane, the gap, 0g , and the applied actuation voltage, sV . These results are presented in the form of 3D plots which can be used for the selection of appropriate dimensions of the switch as well as the actuation voltage for a particular application. Fig. 12 shows pit as a function of the gap height and the length of the membrane. For a given gap height pit increases with increase in the membrane length as the stiffness decreases and hence the pull-in-voltage that is why it takes long for switching. There is trade off between gap height and the length; we can not have a very long or a very low height switch. Variation in pit with thickness and membrane length is shown in Fig. 13(a). For a given thickness, the switching time decrease with increase in the membrane length. Similarly, the effect of other geometrical parameters such as the electrode width, the actuation voltage and the gap height can be seen in Fig. 13(b)-14.

Sensors & Transducers Journal, Vol. 130, Issue 7, July 2011, pp. 77-90
88
300400
500600
3
3.5
420
30
40
Length [um]Gap [um]Ti
me
[us]
Fig. 12. Switching time as a function of gap height and the membrane length.
200300
400500
600
0.40.6
0.81
18
20
22
24
Length [um]Thickness [um]
Tim
e [u
s]
20
4060
1.5
2
2.510
20
30
40
Applied voltage [V]Gap [um]
Tim
e [u
s]
(a)
(b)
Fig. 13. Switching time as a function of (a) thickness and length , (b) the applied voltage and the gap height.
200300
400500
600
2040
608012
14
16
18
20
2224
Length [um]Applied voltage [V]
Tim
e [u
s]
50
100150
200250
3
3.5
420
22
24
26
28
30
32
Width [um]Gap [um]
Tim
e [u
s]
(a)
(b)
Fig. 14. Switching time as a function of (a) the applied voltage and the membrane length; (b) gap height and actuation electrode width.

Sensors & Transducers Journal, Vol. 130, Issue 7, July 2011, pp. 77-90
89
A comparative study has been made on the dependency of pit on various geometrical parameters and it has been found that the effect of membrane length and the thickness on the switching time is more compared to other parameters such as the gap, the electrode width, the dielectric type and thickness. Although, by applying voltage higher than the pull-in voltage switching time, pit , can made faster but penalty can be paid in the form of inclusion of an extra circuitry as well as the reliability of the switch.
4. Conclusion Timing analysis, as noted in the introduction, is crucial for designing RF MEMS switches because the time for achieving ON or OFF states is a major concern. We have noticed that experimental and simulation data on the pull-in and pull-up times of micromachined switches indicate that generally it takes more time to pull in than it takes to pull up. There are only a very few exceptions to this. Even in those cases, the applied voltage is substantially more than the corresponding pull-in voltage. We noted the fact that pull-in time is more than the pull-up time is somewhat counter-intuitive because there is much more cumulative electrostatic force during pull-in than the restoring elastic force during pull-up. To explain this apparent anomaly, we derived analytical expressions for the 1D model of the switch and showed that this observation is indeed true. Two explanations were offered. First, the available electrostatic energy for pull-in is much more the elastic energy available for pulling up. Second, we noted that the decrease in the effective stiffness of the electromechanical system also influences the time for pull-in because it slows down the moving electrode. Our 3D simulation also confirms this observation. Our analysis did not consider damping; considering it is the next step. 5. References [1]. K. E. Petersen, Micromechanical membrane switches on silicon, IBM J. Res. Develop., Vol. 23, Issue 4,
1979, pp. 376-385. [2]. G. M. Rebeiz, RF MEMS Theory Design and Technology, Wiley, New York, 2003. [3]. G. K. Ananthasuresh, K. J. Vinoy, S. Gopalakrishnan, K. N. Bhat and V. K. Aatre, Micro and Smart
Systems, Wiley, India, 2010. [4]. G. M. Rebeiz and J. B. Muldavin, RF MEMS switches and switch circuits, IEEE Microw. Mag., Vol. 2,
Issue 4, 2001, pp. 59-71. [5]. J. J. Yao, RF MEMS from a device perspective, J. Micromech. Microeng., Vol. 10, 2000, pp. 9-38. [6]. V. Leus and D. Elata, On the Dynamic Response of Electrostatic MEMS Switches, IEEE J. MEMS,
Vol. 17, Issue 1, 2008, pp. 236-243. [7]. J. Kim, J. Park, C. Baek and Y. Kim, The SiOG-Based Single-Crystalline Silicon (SCS) RF MEMS Switch
With Uniform Characteristics, IEEE J. MEMS, Vol. 13, Issue 6, 2004, pp. 1036-1042. [8]. Yu, Jian and Shi, High isolation series-shunt RF MEMS switch, Sensors, Vol. 9, Issue 6, 2009,
pp. 4455-4464. [9]. Z. J. Yao, S. Chen, S. Esheman, C. Goldsmith, Micromachined low-loss microwave switches, IEEE J.
MEMS, Vol. 8, Issue 2, 1999, pp. 129-134. [10]. S. D Lee, B. C. Jun, H. C. Park, An RF MEMS switch with low-actuation voltage and high reliability,
IEEE J. MEMS, Vol. 15, Issues 6, 2006, pp. 1605-1611. [11]. H. Niemine, T. Veijola, T. Ryhanen, V. Ermolov, Transient capacitance measurement of MEM capacitor,
Sensors and Actuators A, Vol. 117, Issue 2, 2005, pp. 267-272. [12]. A. Verger, A. Pothier, C. Guines, A. Crunteanu, P. Blondy, A. Broue, F. Courtade and O. Vendier,
Sub-hundred nanosecond electrostatic actuated RF MEMS switched capacitors, J. Micromech. Microeng., Vol. 20, Issue 6, 2010, pp. 064011.
[13]. Benjamin Lacroix, Arnaud Pothier, Aurelian Crunteanu, Christophe Cibert, Frédéric Dumas-Bouchiat, and Pierre Blondy, Sub-Microsecond RF MEMS switched capacitors, IEEE Transaction on Microwave Theory and Techniques, Vol. 55, Issue 6, 2007, pp. 1314-1321.

Sensors & Transducers Journal, Vol. 130, Issue 7, July 2011, pp. 77-90
90
[14]. J. M. Huang, K. M. Liew, C. H. Wong, S. Rajendran, M. J. Tan, and A. Q. Liu, Mechanical design and optimization of capacitive micromachined switch, Sensors and Actuators A, Vol. 93, 2001, pp. 273– 285.
[15]. R. E. Strawser, K. D. Leedy, R. Cortez, J. L. Ebel, S. R. Dooley, V. M. Bright, Influence of metal stress on RF MEMS capacitive switches, Sensors and Actuators A, Vol. 134, Issue 2, 2007, pp. 600-605.
[16]. Subrata Halder, Cristiano Palego, Zhen Peng, James C. M. Hwang, David I. Forehand and C. L. Goldsmith, Compact RF model for transient characteristics of MEMS capacitive switches, IEEE Transactions on Microwave Theory and Techniques, Vol. 57, Issue 1, 2009, pp. 237-242.
[17]. Sedaghat and G. M. Rebeiz, Variable spring constant high contact force RF MEMS switch, in Proceedings of the IEEE MTT –S International Microwave Symposium, CA, USA, 23-28 May, 2010.
[18]. Bonvick R L, Stupar P A and DeNatale J, A hybrid approach to low-voltage MEMS switches, in Proceedings of the 12th International Conference on Solid Stale Sensors, Actuators and Microsystems, CA, USA, 8-12 June, 2003, pp. 859 – 862.
[19]. S. Kang, H. C. Kim and K. Chun, A low-loss single-pole four-throw RF MEMS switch driven by a double stop comb drive, J. Micromech. Microeng., Vol. 19, Issue 3, 2009, pp. 035011.
[20]. K. S. Kiang, M. H. Chong and M. Kraft, A novel low cost spring-less RF MEMS switch Prototype, in Proceedings of the Eurosensors XXIV, Linz, Austria September 5-8, 2010, pp. 1462-1465.
[21]. A. Fruehling, R. Pimpinella, R. Nordin, and D. Peroulis, A single-crystal silicon DC 40 GHz RF MEMS switch, IEEE MTT-S IMS Dig., Boston, MA, Jun. 2009, pp. 1633–1636.
[22]. C. D. Patel and G. M. Rebeiz, An RF-MEMS switch with mN contact forces, in Proceedings of the IEEE MTT-S Int. Microw Symp. Dig., Anaheim, CA, 2010, pp. 1242–1245.
[23]. J. M. Huang, K. M. Liew, C. H. Wong, M. Tan and A. Q. Liu, Mechanical design and optimization of capacitive micromachined switch, Sensors and Actuators A, Vol. 93, 2001, pp. 273-285.
[24]. Xun-Jun He Bo-Shi Jin Qun Wu Jing-Hua Yin, Time response and dynamic behavior of electrostatic driven RF MEMS capacitive switches for Phase Shifter Applications, in Proceedings of the IEEE Antennas and Propagation Society International Symp, Albuquerque, NM, 9-14 July, 2006, pp. 1965-1968.
[25]. A. Eriksson, Mechanical model of an electrostatically actuated shunt switch, in Proceedings of the COMSOL Multiphysics User's Conference, Stockholm, 2005.
[26]. S. Afrang and E. Abbaspour-Sani, A low voltage MEMS structure for an RF capacitive switches, Progress in Electromagnetics Research, Vol. 65, 2006, pp. 157-167.
[27]. A. Kundu, S. Sethi, N. C. Mondal, B. Gupta, S. K. Lahiri, H. Saha, Analysis and optimization of two movable plates RF MEMS switch for simultaneous improvement in actuation voltage and switching time, Microelectronics Journal, Vol. 41, 2010, pp. 257-265.
[28]. Haslina, Miskam and Korakkottil, Design and Simulation of Microelectromechanical System Capacitive Shunt Switches, American Journal of Engineering and Applied Sciences, Vol. 2, Issue 4, 2009, pp. 655-660.
[29]. R. K. Gupta, S. D. Senturia, Pull-in dynamics as a measure of the ambient pressure, in Proceedings of the IEEE International Conference on Micro Electro Mechanical Systems, Piscataway, NJ, 1997, pp. 290-294.
[30]. G. K. Ananthasuresh, R. K. Gupta and S. D. Senturia, An approach to macromodeling of MEMS for nonlinear dynamic simulation, in Proceedings of the ASME International Conference of Mechanical Engineering Congress and Exposition (MEMS), Atlanta, GA, 1996, pp. 401-407.
[31]. MATLAB Reference Guide 2006, version 7.3. The Math Works Inc. [32]. IntelliSuite, version 8.51, http://www.intellisensesoftware.com [33]. HFSSTM V. 10.0, http://www.ansoft.com
___________________ 2011 Copyright ©, International Frequency Sensor Association (IFSA). All rights reserved. (http://www.sensorsportal.com)