sensor-enabled real-world awareness for management ... · 3.4 dsl in the bpmn model ... displays an...
TRANSCRIPT

Sensor-Enabled Real-World Awareness for Management Information Systems
SERAMIS
Project Deliverable D4.7 –
Report on Process Monitoring for RFID-based Business Processes
Project acronym: SERAMIS Project full title: Sensor-Enabled Real-World Awareness for Management
Information Systems
Grant agreement no.: 612052
Doc. Ref.: D4.7 Responsible Beneficiary : WUV Author(s): Andreas Solti (WUV), Alexander Weinhard (UNIWUE)
List of contributors:
Reviewers: Giovanni Romagnoli (UniPR), Cleopatra Bardaki (AUEB) Contractual Delivery Date: 2016-10-31 Actual Delivery Date: 2016-11-30 Status: Final Version and date 1.0 V1.0 / 2016-11-27
Project co-funded by the European Commission within the Seventh Framework Pro-gramme (2007-2013)
PU Dissemination Level
PU Public PP Restricted to other programme participants (including the Commission Services) RE Restricted to a group specified by the Consortium (including the Commission Services) CO Confidential, only for members of the Consortium (including the Commission Services)

2
Executive Summary
As part of the business process management lifecycle, the process monitoring phase plays an important role in understanding the current performance issues of processes and improving the processes in subsequent process improvement cycles. Therefore, process monitoring ca-pabilities are typically included in state of the art business process management suites. The generation of reports on the business level is straight forward in this case, because the process models are created by business experts and are executed by the system directly. This is not the case, however, in service processes, as in brick-and-mortar retailers. Here, employees and customers perform their respective processes on their own. They are not guided by a process aware information system, but instead follow their own intuition (customers) or follow lose managerial orders (e.g., employees). With the increased spread of sensing infrastructures and widely available and low-cost solu-tions for tagging items, a rich pool of fine-grained position and movement information awaits analysis. To understand business processes from sensor event data is a non-trivial task. In this deliverable, we propose to draw on contextual information that is available in (or can simply be added to) business process models and generate complex event patterns that tap into the sensor event data stream. When the raw event stream is matched by the patterns, we emit aggregated business events on the abstraction level of business processes. The resulting business events can be associated to the business process models, and subsequently be used to monitoring the processes for performance and also deviations.

3
Table of Contents
Executive Summary .................................................................................................................. 2
Table of Contents ...................................................................................................................... 3
1 Introduction ....................................................................................................................... 4
2 Preliminary Concepts ........................................................................................................ 6
2.1 Business Process Models ........................................................................................... 6
2.2 Location-aware Business Process Models ................................................................. 7
2.3 Process Monitoring .................................................................................................... 8
2.4 Sensor Data Stream .................................................................................................... 9
2.5 Complex Event Processing ...................................................................................... 10
3 Sensor-Based Process Monitoring.................................................................................. 11
3.1 STEP 1: Preparing the location event stream .......................................................... 12
3.2 STEP 2: Complex Event Processing on Location Data ........................................... 12
3.3 Domain Specific Language for Location Information ............................................. 12
3.3.1 DSL: Location Definitions ........................................................................... 13
3.3.2 DSL: Conditions ........................................................................................... 14
3.4 DSL in the BPMN Model ........................................................................................ 15
4 Implementation in Apache Flink ................................................................................... 17
4.1 Turning Raw Sensor Events into Positions .............................................................. 17
4.2 Turning Position Events into Business Events ........................................................ 19
5 Evaluation ........................................................................................................................ 22
5.1 Ability to detect business events .............................................................................. 22
5.2 Storage saving .......................................................................................................... 23
5.3 Process Discovery .................................................................................................... 23
5.4 Discussion ................................................................................................................ 25
6 Conclusion ........................................................................................................................ 26
7 References ........................................................................................................................ 27

4
1 Introduction
Organizations need to monitor their business processes, if they want to be able to react to un-foreseen delays of execution. Furthermore, improvements to business processes can only be achieved by measuring the current performance, and contrasting it to the performance before. Process participants typically execute the business processes of an organization with the help of process aware information systems (PAIS). These systems log execution traces of the pro-cesses. Such traces can be readily associated to the business process models that govern the execution. In the retail setting, or in general, when people work without immediate information systems, gathering performance information is a challenge, because the link between process model and process data is missing. Current practices include asking the process participants about the process performance, laborious manual monitoring by watching the process, or ex-post analysis of cases. Due to the widespread availability of sensors and the introduction of the internet of things (IoT), novel means to allow monitoring in manual-work type processes emerged. First tech-niques to use sensor information (e.g., RFID position data) for tracking the progress and path of business process instances exist [1],[2], [3]. These deal with the healthcare setting [1], [2], the logistic setting [3], or with monitoring ship or pedestrian trajectories[4], but a business process oriented monitoring solution targeted at the retail domain is missing. In this deliverable, we will fill this gap and propose a location-aware business process moni-toring architecture and implementation that allows us to derive process-relevant events from raw-level input. The focus of the approach is on scalability, extensibility, and real-time pro-cessing, which explains the choice for the underlying stream-processing framework Apache Flink1.
1Apache Flink® is an open source platform for distributed stream processing. https://flink.apache.org/

5
The remainder of this deliverable is structured as follows. Section 2 introduces preliminary concepts, on which the approach is built. Next, Section 3 explains the general approach and the domain specific language that we propose for capturing location information and simple logics in process models. Section 4 outlines the open-source implementation of the frame-work that is built with Apache Flink to support fast event processing. Particular domain spe-cific details for brick-and-mortar retailers are highlighted. Then in Section 5, we evaluate the approach with real data from a RFID real-time locating system. Section 6 concludes the deliv-erable.

6
2 Preliminary Concepts
The proposed monitoring solution for monitoring RFID streams from the business perspective is using concepts, which we will introduce in this section.
2.1 Business Process Models
Process models are typically graphical models that capture events and activities in the process that are coordinated to fulfil a business goal. Process analysts also often capture responsibili-ties and data objects involved in performing certain activities. Sometimes also the systems involved are described. Figure 1 displays an example process model that captures expected browsing behaviour. The process model starts with the customer entering the store. Then, the customer browses the store for interesting items. When the customer finished browsing, she might have found garments of interest. If not, she leaves the store, otherwise, she picks up the garment of interest. After picking it up, the customer can continue browsing, move to the fit-ting room to try on the garment, or skip the fitting room. If there is a buying intention, the customer buys the garment and leaves. If there is no buying intention, the garment is dropped somewhere and the customer can decide to continue browsing the store, or leave it.
Figure 1: Customer process model for a retail store that exhibits garments and has a fitting room.
Note that this example process model does not cover all eventualities, as in reality, the cus-tomers have many more choices. For example, they can decide to stop the process anywhere, or also to skip the activity “Try on garment” and buy an item right away. Furthermore, the customers can also decide to steal an item. It is not always the aim of process models to cap-ture all potential process variants, especially, when there are no limitations in the continua-

7
tion. Rather, process models are used to capture the essence and more relevant parts of the process.
The discipline of conformance checking can be used to detect deviations between process models and real execution traces. These deviations can be shown and quantified to see in how far reality matches the prescribed behaviour [5].
2.2 Location-aware Business Process Models
Typical process modelling languages (e.g., business process model and notation (BPMN), or event driven process chains (EPC)) do not treat location information as core information, and do not offer specific modelling constructs to capture location information. Researchers de-fined multiple ways to combine location information with business process models. Concep-tual ideas are presented in Zhu et al. [6]. Decker et al. present rather technical concepts that restrict execution to only be allowed at given locations [7].
Despite these preliminary efforts, there is no standard for annotating locations to business process models, so far. To maintain interoperability and easy integration, we use plain text annotations that can be added to activities in the BPMN. We use the annotations to model locations in the process, as shown in Figure 2. For example, the “Try on garment” activity is conducted in the “fitting room” (i.e., there is an annotation element with the text “fitting room” associated with the activity).
Figure 2: Customer process enriched with location information. Location information is added as BPMN text annotations to activities.
Additionally, we allow the users to refer to the names of more complex patterns, which we indicate with trailing brackets. This extended flexibility allows us to define location based

8
triggers and capture location information from the context of the case. For example, later in a report we can answer the question of how often customers misplace items after taking items to the fitting room. The pattern logic is encapsulated in the patterns outside the model, but the link is established for monitoring progress or checking conformance between models and event data.
2.3 Process Monitoring
In the business process management lifecycle [8], cf. Figure 3, process monitoring and con-trolling is the phase after the process has been implemented according to a process model. Through monitoring, we gain insights into the process in terms of its performance. Of particu-lar interest are delays caused by process instances that are stuck waiting for an action of a participant. In these cases, some corrective action must be taken, otherwise we risk to fall behind a given due date in the process. In the worst case, the process cannot be completed in time. This can lead to displeased or lost customers, and perhaps even bad publicity when cus-tomers complain about the bad quality of service to friends, to consumer protection, or in so-cial media.
Figure 3: Business process management lifecycle, as introduced in [8].

9
Next to performance insights, we also gain insights about the conformity of the measured ex-ecution with the designed models. Deviation in behaviour, allowed data values, or duration specifications in the model can be quantified and potentially aligned in the next iteration. One option is to correct the model, if it was wrong or incomplete at some parts. Another option is to establish more guidelines and restrictions on the execution of the process to avoid deviating behaviour.
In the BPM lifecycle, as shown in Figure 3, we would use these insights as a selection criteria on which process to focus in the next iteration of the lifecycle. That is, we would discover the as-is business process model, analyse it to find weaknesses and assess their impact, redesign the process for potential improvements, and implement it to close the cycle.
2.4 Sensor Data Stream
Smart devices and sensors are available in abundance and for affordable prices. These smart sensors enable novel processes and use cases and propel the rise of the ubiquitous computing paradigm. The retail sector is adopting the technology as it steadily matures. Many companies offer sensor based solutions for monitoring the processes of brick-and-mortar retailers. The gathered information can be used to analyse customer flows, turnover rates or inventory movements and inventory accuracy.
An example sensor data stream is shown in Table 1.
Table 1: Sample raw sensor readings of a RFID RTLS system.
ID EPC Reader Antenna RSSI Time
1 urn:epc:tag:gid-96:20840240.40354.100013 1.15 4 -67 2016-10-24 16:58:36.0
2 urn:epc:tag:gid-96:84842650.50027.100016 1.15 8 -65 2016-10-24 16:58:39.0
3 urn:epc:tag:gid-96:90260358.60123.100001 1.15 7 -71 2016-10-24 16:58:40.0
4 urn:epc:tag:gid-96:34949950.30034.100006 1.15 3 -59 2016-10-24 16:58:41.0
5 urn:epc:tag:gid-96:34861659.20023.100001 1.15 7 -69 2016-10-24 16:58:41.0
6 urn:epc:tag:gid-96:45263053.60132.100001 1.15 6 -63 2016-10-24 16:58:44.0

10
2.5 Complex Event Processing
Complex Event Processing (CEP) [9] allows us to define patterns over event streams that are continuously monitored. In contrast to event processing, the patterns are allowed to have complex structure, that is, they can be composed by logical formulas and hierarchically con-sist of further patterns. Also, the idea is that these patterns are evaluated in real-time and their results are reintegrated in the event stream, such that other CEP patterns can react on the oc-currence of complex events. In a nutshell, CEP allows us a stream of events to flexibly listen to arbitrarily complex event patterns.

11
3 Sensor-Based Process Monitoring
Figure 4: Big picture of the proposed Sensor-based Process Monitoring Solution
The big picture of the monitoring approach is given in Figure 4. On the left of the figure, smart devices, sensors, or cameras generate an event stream. This event stream is the first input to our approach. The second input is the location-aware process models. From those, we can derive or activate complex event processing (CEP) patterns. The patterns are matched to the stream of events and whenever there is a hit, a new business event is generated and insert-ed into the stream. Naturally, it is possible to completely discard the raw event stream and only consider the business events for subsequent analysis.
Figure 5: Zooming in on the Stream processing steps done by the CEP engine.
STEP 1translate
to position data
Raw Sensor Events
STEP 2apply
complex event
patterns
Location Events
STEP 3align to process model
Business Events

12
3.1 STEP 1: Preparing the location event stream
The sensor event stream needs to be prepared for the CEP patterns from the process models, however. This is done in STEP 1, as depicted in Figure 5. We assume that the raw sensor event stream, as exemplified in Table 1, can be translated to position events. These position events are associated with actors. Actors can be for example RFID tags, forklifts, cleaning robots, or natural persons. The translation can be done in various ways (e.g., trilateration of raw signal reads [10], image processing of video streams [11]) and results in position events. Note that in the context for RFID locating systems, the translation can be done within the CEP-framework. That is, based on stream processing with a given window size, we can aver-age the raw reads of a given EPC with trilateration to smoothen outliers in the reads while creating position events.
The output of STEP 1 is a position event stream that stores the identifiers of the actors, their position as point coordinates in the projection space (e.g., a floor map), and a timestamp that encodes, when the actor was seen/sensed to be at that position. The position stream is then subject to (further) complex event processing in STEP 2.
3.2 STEP 2: Complex Event Processing on Location Data
In this second step, we apply the location-based complex event patterns that we derived from the process models. In the process models, we propose to use a domain specific language.
3.3 Domain Specific Language for Location Information
We propose to use a domain specific language (DSL) for annotating business process models with location information. The focus is on simplicity. Therefore, we use two simple conven-tions. Elements of the language can be one of:
Location: A location is stored as plain text annotation. For example, “fitting room”, “point of sales”, etc.
Condition: A condition is stored as a function call with brackets in an annotation. For example, “startsMoving()”, “stopsMoving()”, etc.
The locations are references to external location definitions. This decoupling ensures that we can continue monitoring the processes, if we rearrange our store layout and do not need to

13
change the process models. Locations and conditions can be arbitrarily complex patterns that need to be defined by domain experts.
3.3.1 DSL: Location Definitions
Without loss of generality, we project locations into a two-dimensional plane to be able to display them on a screen. The principles that we discuss for 2D-locations can easily be ex-tended to the third dimension, if the area of interest is also partitioned in the vertical axis.
In a 2D-map, we can define locations as 2D-shapes. For example, we define basic circular, rectangular, and polygonal locations. We further allow composition of complex locations as shown in Figure 6. In this example, the pattern works from bottom up. Each basic location pattern is translated to a containment query.
The logical “fitting room” location is either (OR) the rectangular shape of “fitting room 1”, or the square shape of “fitting room 2”, or the polygonal shape of “fitting room 3”. The pattern of the location “fitting room” is thus defined as “fitting room 1” or “fitting room 2” or “fitting room 3”.
Figure 6: Sketch of the composite location pattern “fitting room”
Compositional operators are OR (the union of areas), AND (the intersection of areas) and NOT (negation of an area). It is possible to create a logical tree of areas in this way. For ex-ample to define the sales floor, we could use the pattern: AND (NOT “fitting room”, NOT “point of sale”) and we would get the remainder of the shop area without the fitting rooms and the points of sale. Here, “fitting room” is a composite pattern that is OR(“fitting room 1”, “fit-ting room 2”, “fitting room 3”) as shown in Figure 6. This demonstrates the nested nature of the complex location definitions.
By default, but without loss of generality, we are only interested in “containment” patterns for locations. That is, whenever an actor’s position event is in a position that is inside the location pattern, we emit a location event. In practice, it might be useful to define a catch-all location
fitting room
1
fitting room
2
fitting room
3
fitting room
<OR>
14
that is the negation of all the specifically defined locations. In brick-and-mortar retail shops, this would be the “shop floor” pattern, as described above.
3.3.2 DSL: Conditions
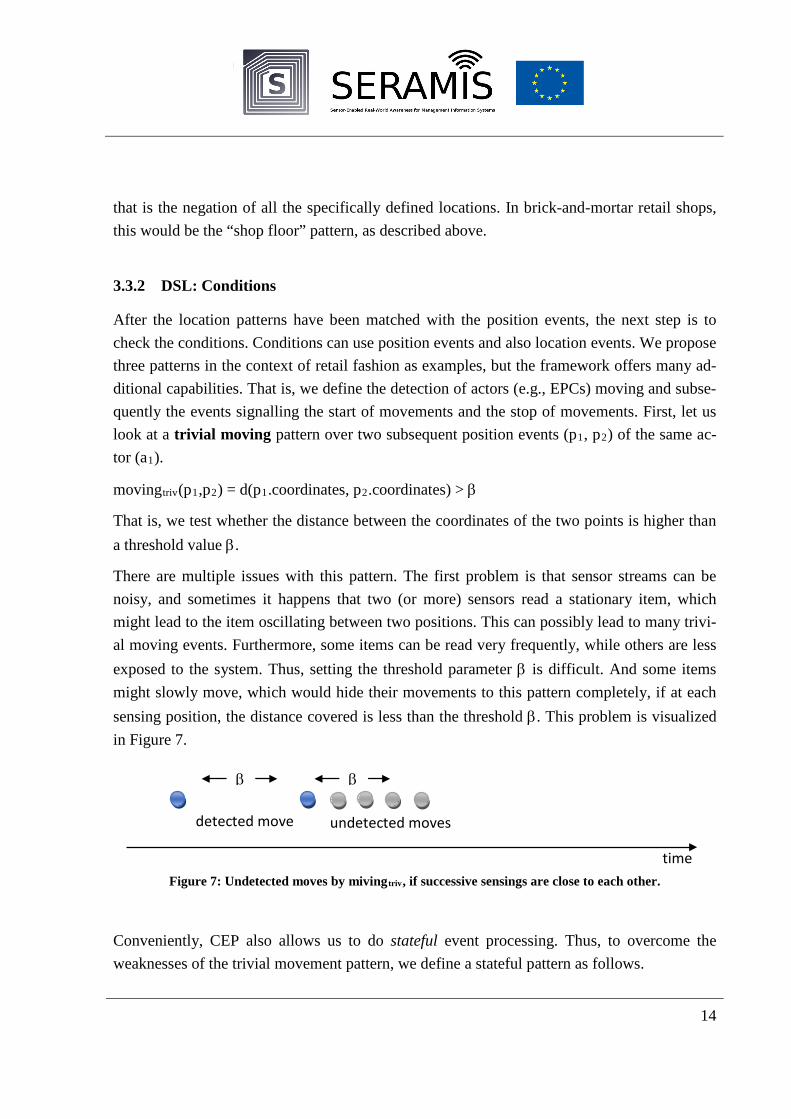
After the location patterns have been matched with the position events, the next step is to check the conditions. Conditions can use position events and also location events. We propose three patterns in the context of retail fashion as examples, but the framework offers many ad-ditional capabilities. That is, we define the detection of actors (e.g., EPCs) moving and subse-quently the events signalling the start of movements and the stop of movements. First, let us look at a trivial moving pattern over two subsequent position events (p1, p2) of the same ac-tor (a1).
movingtriv(p1,p2) = d(p1.coordinates, p2.coordinates) > β
That is, we test whether the distance between the coordinates of the two points is higher than a threshold value β.
There are multiple issues with this pattern. The first problem is that sensor streams can be noisy, and sometimes it happens that two (or more) sensors read a stationary item, which might lead to the item oscillating between two positions. This can possibly lead to many trivi-al moving events. Furthermore, some items can be read very frequently, while others are less exposed to the system. Thus, setting the threshold parameter β is difficult. And some items might slowly move, which would hide their movements to this pattern completely, if at each sensing position, the distance covered is less than the threshold β. This problem is visualized in Figure 7.
Figure 7: Undetected moves by mivingtriv, if successive sensings are close to each other.
Conveniently, CEP also allows us to do stateful event processing. Thus, to overcome the weaknesses of the trivial movement pattern, we define a stateful pattern as follows.
time
β β
detected move undetected moves

15
movingstate(p1, p2, s) = � d(p1, p2) > β, if s. movingd(s. first, p2) > β, if ! s. moving
This means that we store whether the item is currently moving in the state s of the processor, and depending on whether the item is moving, we either compare to the last position (when moving) or to the first position that was recorded, when the item stopped moving. This way, we can make sure that slowly drifting away from a position is detected, when the threshold is passed. In contrast to before, the movement is detected in case of slowly changing positions as shown in Figure 8.
Figure 8: Stateful movement detection allows to capture incremental movements.
Once this stateful movement pattern is applied to the data, we can build on top of this new output stream and define the boundaries of movements as follows:
startsMoving(m1,m2) = !m1.moving ∧ m2.moving
Here, the startsMoving() pattern creates a new startsMoving sM event, whenever the item started to move (i.e., it was not moving, but then it moved). Consequently, the pattern of pickUpItem() can formulated by the following pattern.
pickUpItem(M,startsMoving) = ∀𝑚𝑚 ∈ 𝑀𝑀 (!𝑚𝑚.𝑚𝑚𝑚𝑚𝑚𝑚𝑚𝑚𝑚𝑚𝑚𝑚)
Here, M is the set of events in a time window that can be set based on the infrastructure and shop specifics. For example, if we assume that items are stationary with a high probability before being picked up, we could set the threshold to 1 hour.
These examples shall illustrate the flexibility and modular composability of events and pat-terns within the CEP framework.
3.4 DSL in the BPMN Model
We reuse the existing annotation elements of BPMN (that is, the square bracket connected with dashed arcs to the elements). Annotations can contain text. The BPMN specification is designed to be interchangeable between tools and defines an Extensible Markup Language
time
β β

16
(XML) based serialisation of its elements. Therefore, the corresponding xml fragment for the annotation of the “Try on garment” activity in Figure 2 could look as shown in Table 2.
In Table 2, we see a task in line 50 with the id “act:1” that has the name “Try on garment”. Line 54 shows that there is an association between the element with the id “tA:123” and the element with id “act:1”. In line 55, we can find a textAnnotation element with the id “tA:123”. That is, from the model, we can parse that the textAnnotation “tA:123” (that has the text-element “fitting room” as a child) is associated to the activity “Try on garment”.
1: <?xml version="1.0" encoding="UTF-8"?> 2: <definitions> 3: <process id="proc:1" name="Customer"> [omitted] ... 50: <task completionQuantity="1" id="act:1" name="Try on garment"> 51: <incoming>arc:12 </incoming> 52: <outgoing>arc:13</outgoing> 53: </task> 54: <association associationDirection="None" id="assoc:1" sourceRef="tA:123" tar-getRef="act:1"/> 55: <textAnnotation id="tA:123" textFormat="text/plain"> 56: <text>fitting room</text> 57: </textAnnotation> [omitted] ... 530: </process> 531: </definitions>
Table 2: Sample XML serialisation focusing on text annotations.

17
4 Implementation in Apache Flink
To demonstrate feasibility of the approach, we implemented the patterns in Apache Flink. Latter is an open source platform for distributed stream and batch data processing2. The de-sign decision to choose this particular framework is based availability as open source (that means it is extensible) and native support for distributed processing of large data streams. Apache Flink supports deployment on local machines, on a cluster of computers, or in the cloud for maximal flexibility.
4.1 Turning Raw Sensor Events into Positions
First, we tap into the stream of events of the RFID system: StreamExecutionEnvironment env = StreamExecutionEnvironment.getExecutionEnvironment();
DataStream<TemporalSenseEvent> dataStream = env.addSource(new UDPTextStream<String>()).map(new SensorReading());
The UDPTextStream class implements the SourceFunction interface of Apache Flink. It reads input from a socket, into which the sensor data is sent. The SensorReading class implements The MapFunction interface of Flink. It maps a sensor read event from its String representation into its object representation for future processing.
The next part is to split (i.e., partition) the stream into many logical streams per RFID-tag. That is, for each tracked item in the system, we create its own stream.
DataStream<TemporalPosition> positionDataStream = dataStream.keyBy(tse -> tse.getId()) .window(ProcessingTimeSessionWindows.withGap(Time.seconds(secondsGap))) .apply(new LocationProcessor());
The keyBy() function does the job of partitioning the stream and expects a means to extract the identifier of the stream from an event. We can simply use the EPC of the RFID tags as key.
On the separated streams, we can use different window types. Window types determine how many events are grouped into a single window that is then processed in a batch. We distin-guish tumbling windows and sliding windows. Tumbling windows have a given size that can
2 https://ci.apache.org/projects/flink/flink-docs-release-1.1/

18
be defined as either a determined number of events, or all the events in a given span. Session windows are a special type of tumbling windows, where the size is dynamic and is defined by a boundary condition). Sliding windows allow to reuse parts of the events of a previous win-dow. An example is to define a window of 5 minutes and after processing the contents, slide the window 1 minute forward. The latter allows for averaging low level reads. Figure 9 dis-plays a selection of different types of windowing options available in Apache Flink.
Figure 9: Different types of windows that can be defined on events.
Session windows group subsequent reads into one window, until there is a gap of a given time (secondsGap variable). The type of window to be used depends on the sensing architecture specifications. It can happen that the sensor infrastructure sends for every tracked item an update every 3 seconds. In that case, a session window with a session boundary of less than 3 seconds would select only individual events. While a session window with a bigger boundary that 3 would select the entire stream as one window. In a real time setting, this would be dis-astrous, as the window would be growing and growing without being processed. In such a setting, a more rigid window size is preferable.
Given the events of a window, any locating technology can be used to find the most likely position in the centre of the window. Trivially, a weighted average of sensor readings accord-ing to sensor read strengths can be used as a baseline, but also more sophisticated locating technologies based on fingerprinting can be used for this purpose [12].
Tumbling(2):
Tumbling(3):
Session(1min):
Sliding(4,2):
Sliding(5m,1m): <- 1min ->
>1min >1min <1min
8:59 9:00 9:01 9:02 9:03 9:04 9:05 9:06 time

19
In our case, we focus on a stream of the sensing events of one particular tag and pass windows of consecutive reads to the LocationProcessor class. Latter uses a centre of gravity (i.e., trilateration-based) algorithm to compute the aggregate position of the tag.
The output of this step is a data stream of TemporalPosition events. These events have coordinates, a timestamp and the item id (i.e., EPC in the RFID case).
4.2 Turning Position Events into Business Events
The position events can be converted to the business events as defined in by the rules in Sec-tion 3.3.2. For example, in Apache Flink, the pattern to detect trivial movements looks like the following.
Pattern<TemporalPosition, ?> positionPattern = Pattern.<TemporalPosition>begin("from") .subtype(TemporalPosition.class) .next("to") .subtype(TemporalPosition.class);
// Create a pattern stream from consecutive positions PatternStream<TemporalPosition> tempPatternStream = CEP.pattern(positionDataStream, positionPattern);
// Generate movement events for each matched pattern DataStream<MovingTrivial> trivialMovementStream = tempPatternStream.select( (Map<String, TemporalPosition> pattern) -> { TemporalPosition from = pattern.get("from"); TemporalPosition to = pattern.get("to"); if (EuclideanDistance.distance(from, to) > BETA) { return new MovingTrivial(from, to); } return NotMovingTrivial (from, to); );
So, we first define a pattern to listen to any subsequent positions of an item. Then, we create a stream of this pattern. Finally, we select those that really constitute trivial movements (i.e., where the positions are further apart than a given threshold beta) as MovingTrivial events and those movements that fall below the threshold BETA.
Based on the data stream of trivial movements, the definition of further patterns is straight-forward. We illustrate the definition of the startsMoving() pattern.
Pattern.<IBusinessEvent> begin("nomove") .subtype(NotMovingState.class) .next("move").subtype(MovingState.class);

20
So, this pattern matches a stream of already processed moving events, and it matches the pat-tern of two consecutive events (.begin() followed by .next()). The events must be of a certain type such that the complex event pattern matches. Whenever this pattern matches, we create a StartsMoving event and pass to it the id and the position of the tag, when it starts moving. We can extract this information of the MovingState event.
... MovingState move = (MovingState)pattern.get("move"); return new StartsMoving(move);
Location events are easily detected by a containment query of the location shape associated with the location. This is best delegated to the shapes associated with a location.
Pattern.<TemporalPosition> begin("Fitting Room").subtype(TemporalPosition.class).where(evt -> { Point2D evtLocation = new Point2D(evt.getX(), evt.getY()); return location.contains(evtLocation) });
The Location can be arbitrarily complex as shown in the UML class diagram in Figure 10. It follows the Composite design pattern [13]. That is, a Location can be composed of other locations (CompositeLocation) and thus effectively forms a tree. In this tree, the PlainLocations are the leaf nodes that can be composed hierarchically.
Figure 10: Class diagram of locations and shapes for specifying business locations on a map.

21
An example is the logical composition of different fitting rooms to a logical location called “fitting room”.
Such patterns are applied to the stream of events with chosen window sizes and create new streams of events, to which yet novel higher level patterns can be applied. Effectively, this allows us to flexibly define a pattern hierarchy to bridge the gap of sensor events to business events. Finally, the filter operations should be applied to the processed event streams to select the events of interest and store them in a database, or in the form of event logs. Latter are used in process mining [14] for discovering process models, checking the conformance to existing process models, or enrich process models with execution information that can be extracted from the event logs.

22
5 Evaluation
We trust the chosen implementation framework to be efficient and scalable and the focus of the evaluation is therefore rather on the conceptual side. That means, we are interested in how well the proposed complex event patterns work in a real retail shop to identify the respective business events.
We evaluate two questions:
1. To what extent can the RTLS detect position events that reflect business events? 2. How much storage do we save by only storing business events?
5.1 Ability to detect business events
Due to sensor inaccuracies and given platform-dependent time lags between sensor events, even a simple pattern like “fitting room” cannot always be detected by the RFID real-time locating system. Here, we consider the setting that customers take certain items into a fitting room.
We performed the following experiment three hours before the shop was opened. We selected 120 items and moved them to random locations in the shop floor, including the fitting room. 33 items were moved to fitting rooms. From these 33 items, we know that they are in a fitting room. To test whether the items are also visible to the real time locating system, we insert the RTLS raw events into the monitoring framework and are interested in the number of items that are observed in the fitting room. We consider only these 120 “controlled” items, but the RTLS reads on the day of experiment 13884 items in total.
It turns out that the system detected 14 of the 33, which results in a recall value of 0.42. This means that only 42 percent of the items were detected with a detection window of two hours. The resulting items included 19 false positives, which were items not put into fitting rooms. These constitute a precision of 0.47. Table 3 summarises the experiment results.
In fitting room not in fitting room Total:
Detected as “fitting room”(P) 14 (TP) 16 (FP) 30
Undetected (N) 19 (FN) 71 (TN) 90
33 87 Total: 120

23
Table 3: Result table of location event detection for the fitting room location
Overall, the resulting recall and precision values are less promising than expected. Partly, the low recall of items in the fitting room can be explained by the capabilities of the RTLS, which reach their limits in a brick-and-mortar retail store with approximately 15 thousand RFID en-abled items.
5.2 Storage saving
By only storing business events at the very end of the processing pipeline, we can drastically reduce the amount of storage required to enable historical recording within RTLSs. The num-ber of positive movements in contrast to stationary reads is in fact negligible. Taking 11.225.939 raw sensor readings and applying CEP patterns to only store movements and sta-tionary positions of items that moved results in 16.211 events. This corresponds to a compres-sion to 0,144% of the number of events (i.e., this is a compression factor of 692. So for exam-ple instead of 2 days of data, organisations employing this technique can store four years of data). Looking at all the events including the stationary items, we get 32.338 events. Howev-er, the events of items that do not move do not need to be repeated, and there is only one event for them, as long as they do not move. In the example data, 80% of the items are sta-tionary and have but a single event (e.g., sales floor).
5.3 Process Discovery
Even, when there is no initial business process model, we can gain insights into the processed event stream. Do achieve that, we rely on process discovery techniques of the tool disco3. In total we get
3 https://fluxicon.com/disco/

24
Figure 11: Result of applying a process discovery technique on the processed event data.
An example result of a process discovery algorithm on the data of two days is shown in Fig-ure 11. We see that most of the events are movements on the sales floor, and do not move. If we exclude these cases from the picture, we get the situation, as shown in Figure 12.
Figure 12: Discovered model with filter showing only events that moved.

25
5.4 Discussion
The low accuracy of the RFID real time locating system at hand makes precise formulation of complex event patterns difficult, and robust and simple patterns are preferable. Partly, the limited read rate at our example store can be explained by the fact that the RTLS had to be hidden behind the ceiling to be absolutely invisible to customers. Customer experience is most important for retailers, which makes it imperative to hide technical elements that do support the aesthetics of the shop.
Nevertheless, the feasibility of using low level RFID events as source, lifting them to position and subsequently to movement and location events is evident in this evaluation. Most im-portantly, we provided an efficient implementation that is able to process the event stream in real time with the computing power of a desktop computer. By relying on complex event pro-cessing, the framework is general enough to detect any location-based pattern. The CEP tech-nology has a successful record of applications and proved versatile in multiple scenarios.
The framework along with sample CEP patterns is provided as open-source project on GitHub4.
4 https://github.com/seramis-project/sensor2process

26
6 Conclusion
In this deliverable, we have tackled the problem of lifting the low level sensor events to high level business events with the help of contextual data in process models and location defini-tions. We employ a powerful complex event processing engine that is able to handle large amounts of sensor events in real-time, effectively reducing the required storage and enabling monitoring of processes on the business process models.
The resulting business events can be used for real-time conformance checking, performance monitoring or also in process discovery projects.

27
7 References
[1] A. Senderovich, A. Rogge-Solti, A. Gal, J. Mendling and A. Mandelbaum, “The ROAD from Sensor Data to Process Instances via Interaction Mining,” in International Conference on Advanced Information Systems Engineering, 2016.
[2] C. Fernandez-Llatas, A. Lizondo, E. Monton, J.-M. Benedi and V. Traver, “Process mining methodology for health process tracking using real-time indoor location systems,” Sensors, vol. 15, no. 12, pp. 29821-29840, 2015.
[3] C. Cabanillas, A. Baumgrass, J. Mendling, P. Rogetzer and B. Bellovoda, “Towards the enhancement of business process monitoring for complex logistics chains,” International Conference on Business Process Management, pp. 305-317, 2013.
[4] L. Etienne, T. Devogele and A. Bouju, “Spatio-Temporal Trajectory Analysis of Mobile Object Following the Same Itinerary,” Advances in Geo-Spatial Information Science, vol. 10, pp. 47-57, 2012.
[5] A. Rozinat and W. van der Aalst, “Conformance checking of processes bases on monitoring real behavior,” Information Systems, vol. 33, no. 1, pp. 64-95, 2008.
[6] X. Zhu, J. Recker, G. Zhu and F. M. Santoro, “Exploring location-dependency in process modeling,” Business Process Management Journal, vol. 20, no. 6, pp. 794-815, 2014.
[7] M. Decker, H. Che, A. Oberweis, P. Stürzel and M. Vogel, “Modeling Mobile Workflows with BPMN,” in Ninth International Conference on Mobile Business, 2010.
[8] M. Dumas, M. La Rosa, J. Mendling and H. Reijers, Fundamentals of Business Process Management, Springer, 2013.
[9] D. Luckham, The Power of Events, Addison-Wesley Reading, 2002.
[10] S. S. Saab and Z. S. Nakad, “A standalone RFID indoor positioning system using passive tags,” IEEE Transactions on Industrial Electronics, vol. 58, no. 5, pp. 1961--1970, 2011.
[11] K.-H. Lin and C.-C. Wang, “Stereo-based simultaneous localization, mapping and moving object tracking,” in IEEE/RSJ International Conference on Intelligent Robots

28
and Systems (IROS), 2010.
[12] S. Ting, S. K. Kwok, A. H. Tsang and G. T. Ho, “The study on using passive RFID tags for indoor positioning,” International journal of engineering business management, vol. 3, no. 1, pp. 9-15, 2011.
[13] E. Gamma, R. Helm, R. Johnson and J. Vlisssides, Design Patterns: Elements of Reusable Object Oriented Software, Prentice Hall, 1994.
[14] W. M. Aalst van der, Process Mining - Discovery, Conformance and Enhancement of Business Processes, Springer Berlin-Heidelberg, 2011.
[15] A. Baumgrass, N. Herzberg, A. Meyer and M. Weske, “BPMN extension for business process monitoring,” EMISA, pp. 85-98, 2014.