sensitivity, specificity, and predictive values of ... specificity, and predictive values of...
TRANSCRIPT

Sensitivity, Specificity, and Predictive Values of Diagnostic and Screening Tests

Objectives
Review characteristics of suitable screening tests. Discuss the importance of sensitivity and specificity in
screening tests. Examine how positive predictive values, negative predictive
values, and disease prevalence affect the sensitivity and specificity of screening tests.
2

Key Terms
Primary prevention Secondary prevention Sensitivity Specificity Cutoff point Positive predictive value Negative predictive value Prior probability
3

Prevention
Primary Prevention Reduction of risk (Behavior change, alteration of
environmental risk, prophylaxis, etc.).
Secondary Prevention: Early detection of disease in the sub clinical stages (screening
tests, periodic health exams, etc.).
Tertiary Prevention Treatment of clinically-apparent disease to reduce
complications.
4

Screening
Use of laboratory testing on asymptomatic persons to detect diseases whose morbidity and mortality can be reduced by early detection and treatment.
Characteristics of diseases suitable for screening: Common enough to justify the effort. Significant morbidity if untreated. Effective therapy is available. Treatment in the asymptomatic phase provides benefits over
treatment in early symptomatic phase. Characteristics of suitable screening tests:
Low-cost and low-risk. Patient acceptability. Should be abnormal in almost all patients who have disease
(i.e. test should have good sensitivity).
5
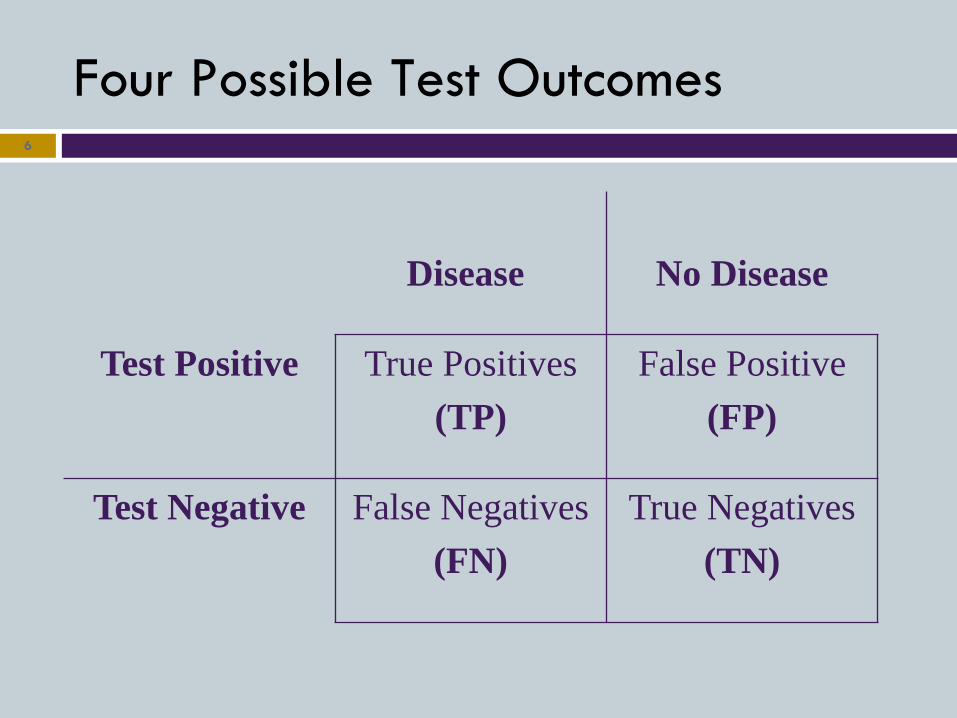
Four Possible Test Outcomes 6
Disease
No Disease
Test Positive True Positives (TP)
False Positive (FP)
Test Negative False Negatives (FN)
True Negatives (TN)

Sensitivity
The probability that a test will be positive in a patient with disease. True positive rate
7
TP TP + FN

CA-125 Protein as a Marker for Ovarian Cancer
8
Disease
No Disease
Test Positive 101 310
Test Negative 9 1540

TP TP + FN
101
101 + 9
.92 = 92% sensitivity
9
CA-125 Protein as a Marker for Ovarian Cancer

Sensitivity
A sensitive test is usually positive when disease is present (few false negatives).
When many patients with disease have a negative test (false negatives) the sensitivity decreases. The test’s utility as a screening test is diminished because the test fails to identify asymptomatic patients.
10
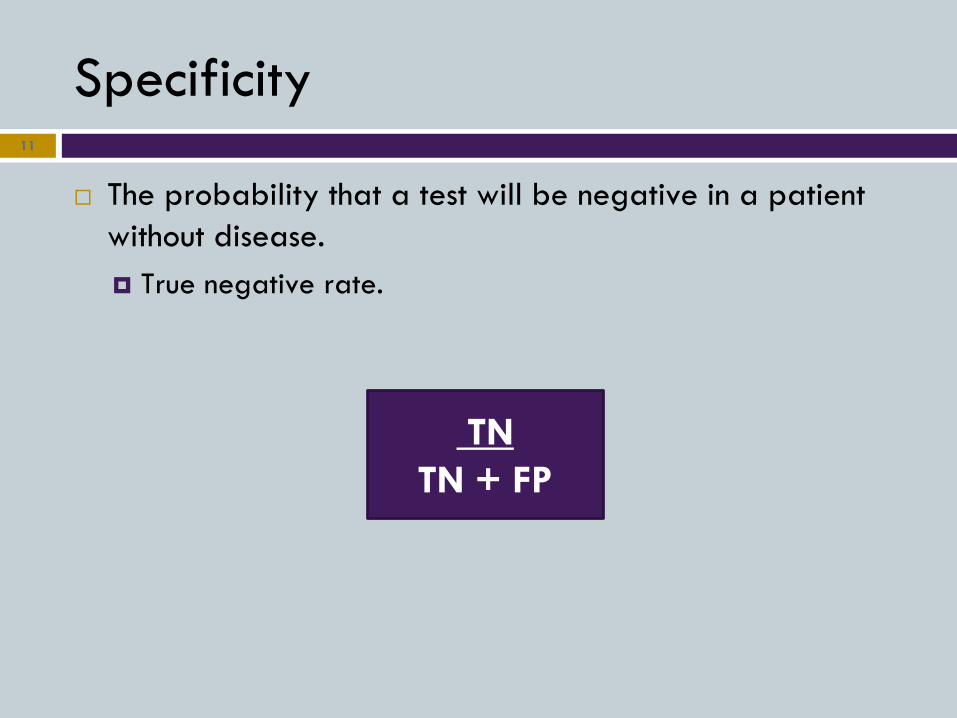
Specificity
The probability that a test will be negative in a patient without disease. True negative rate.
11
TN TN + FP

CA-125 Protein as a Marker for Ovarian Cancer
12
Disease
No Disease
Test Positive 101 310
Test Negative 9 1540

TN TN + FP
1540
1540 + 310
.83 = 83% sensitivity
13
CA-125 Protein as a Marker for Ovarian Cancer

Specificity
A specific test is usually negative in disease free patients (few false positives).
When many disease free patients have a positive test (false positives), the specificity decreases. Utility as a screening test may diminish because it results in
too many needless work-ups.
14

Cutoff Points
1. How is the threshold for a positive test established? Ideal test would have 100% sensitivity and 100% specificity
(no false negatives and no false positives). In such a situation the cutoff point (value above or below
which a test is considered abnormal or positive) would be easily assigned.
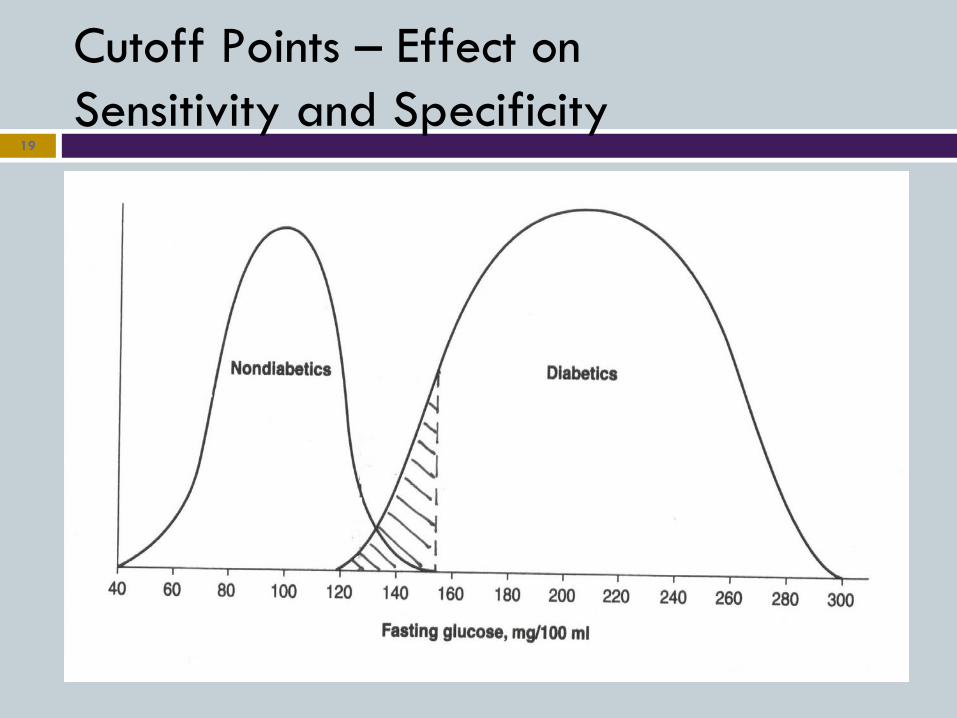
However, there is usually some overlap between results in a population with disease and a population without disease and choosing a cutoff point is not always readily apparent.
2. Does this have an effect on the sensitivity and specificity of the test?
15

Cutoff Points 16
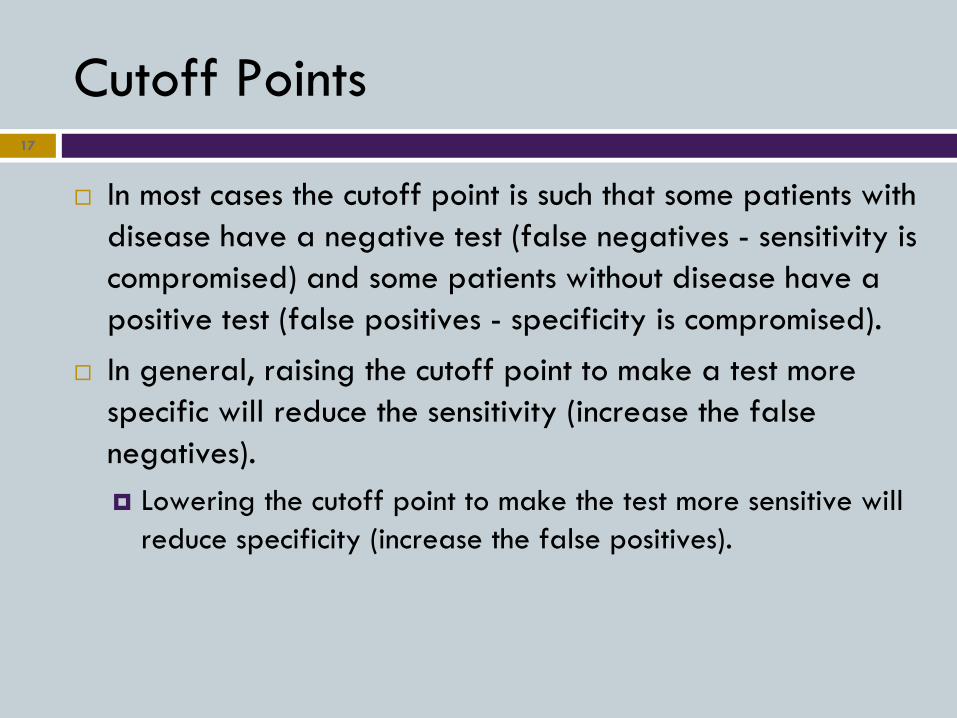
Cutoff Points
In most cases the cutoff point is such that some patients with disease have a negative test (false negatives - sensitivity is compromised) and some patients without disease have a positive test (false positives - specificity is compromised).
In general, raising the cutoff point to make a test more specific will reduce the sensitivity (increase the false negatives). Lowering the cutoff point to make the test more sensitive will
reduce specificity (increase the false positives).
17
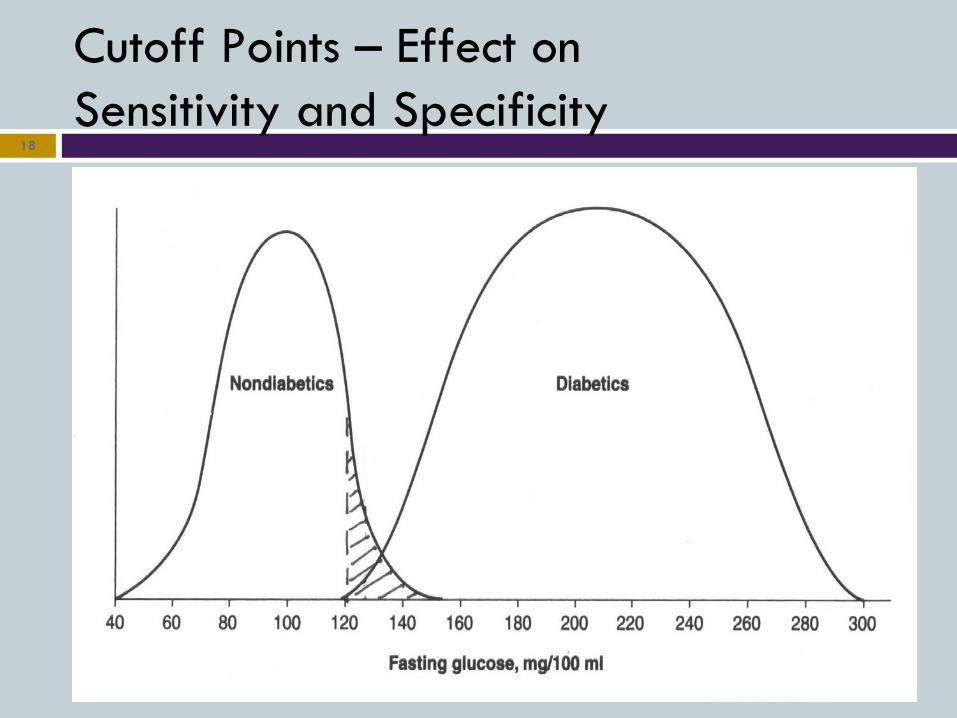
Cutoff Points – Effect on Sensitivity and Specificity
18
Cutoff Points – Effect on Sensitivity and Specificity
19

Choosing a Cutoff Point 20

Sensitivity and Specificity vs. Predictive Values Sensitivity and specificity are intrinsic characteristics of a
test and do not change regardless of the patient or population being tested.
Correct interpretation (predictive value) of a positive or negative test will vary depending on the particular patient or population being tested.
Task of the clinician: determine the likelihood of disease given a positive test (positive predictive value), or the likelihood that disease is not present given a negative test (negative predictive value). Must understand the concept of predictive values.
21

Positive Predictive Values (PPV)
The probability that a patient with a positive test actually has disease.
22
TP TP + FP
A test with higher specificity (fewer false positives) will have a higher PPV in a given population.
For any given test, as disease prevalence in the population being tested increases, the PPV of that test will also increase.

Positive Predictive Values (PPV)
Test with 90% Sensitivity and 90% Specificity in a Population with Disease Prevalence of 1% PPV = .08 (8%)
23
Disease
No Disease
Test Positive 9 99
Test Negative 1 891

Positive Predictive Values (PPV)
Test with 90% Sensitivity and 90% Specificity in a Population with Disease Prevalence of 10% PPV = .5 (50%)
24
Disease
No Disease
Test Positive 90 90
Test Negative 10 810

Negative Predictive Values (NPV)
A test with higher sensitivity (fewer false negatives) will have a higher NPV in a given population.
For a given test, as disease prevalence in the population being tested decreases, the NPV of that test will increase.
25
TN TN + FN

Prior Probability
Pre-test probability; Bayes Theorem A given test will have a higher positive predictive value in
those patients with a higher prior probability of disease.
26
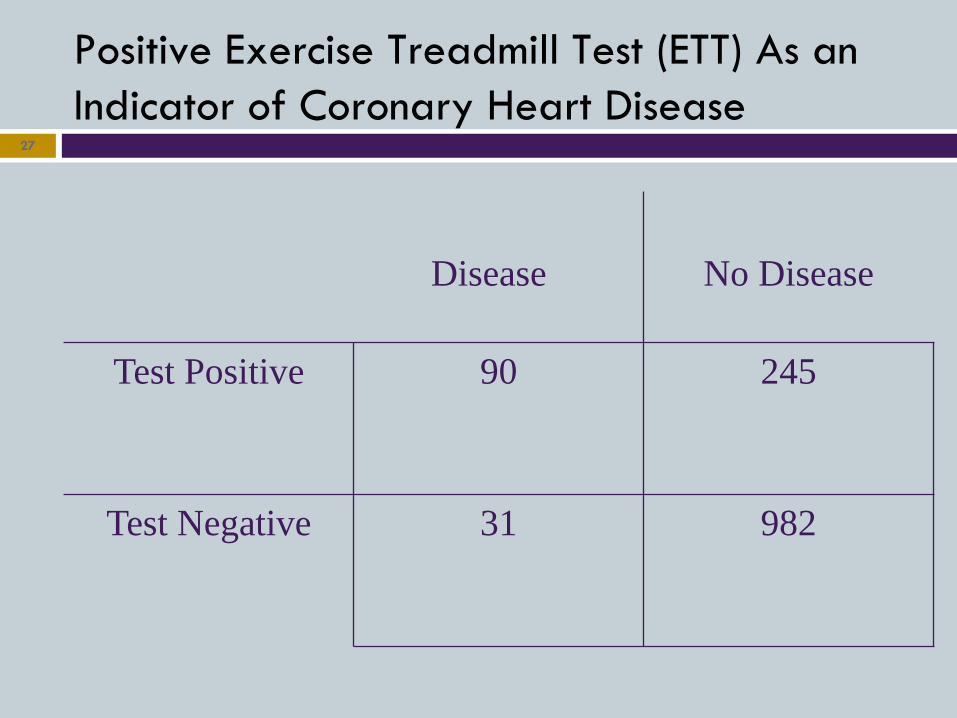
Positive Exercise Treadmill Test (ETT) As an Indicator of Coronary Heart Disease
27
Disease
No Disease
Test Positive 90 245
Test Negative 31 982

TP TP + FN
90
90 + 31
.74 = 74% sensitivity
28
Positive Exercise Treadmill Test (ETT) As an Indicator of Coronary Heart Disease

Positive Exercise Treadmill Test (ETT) As an Indicator of Coronary Heart Disease
29
Disease
No Disease
Test Positive 90 245
Test Negative 31 982

TN TN + FP
982
982 + 245
.80 = 80% specificity
30
Positive Exercise Treadmill Test (ETT) As an Indicator of Coronary Heart Disease

“Classic Findings”
Q: What is the classic history in a patient with the acute coronary syndrome? A: Crushing, retrosternal chest pain that radiates to the jaw or shoulder, associated with nausea and diaphoresis. Q: What do we really mean by ‘classic’? A: In most cases, we mean specific, not sensitive.
31

Summary
When sensitivity decreases, the test’s utility as a screening test is diminished because the test fails to identify asymptomatic patients.
When specificity decreases, the test’s utility as a screening test may diminish because it results in too many needless work-ups.
32
IF • Prevalence (prior
probability) increases…
• Prevalence decreases…
• Specificity increases…
• Sensitivity increases…
THEN
• PPV increases; NPV decreases
• PPV decreases; NPV increases
• PPV increases
• NPV increases

Acknowledgements
Richard DiCarlo, MD Rebecca Frey, PhD Stacey Holman, MD Richard Tejedor, MD Murtuza Ali, MD
33