sensient technologies corporation 2013 annual · pdf fileinvested in new technology within our...
TRANSCRIPT
i n n o v a t i o n i n s i d e
A
NN U
A
L
R
EP O
R
T
K E N N E T H P . M A N N I N G
“sensient continues to succeed across all lines
of our business by emphasizing technology-based
products that enable our customers to excel in
highly competitive markets.”

sensient technologies corporation
is a leading global developer,
manufacturer and marketer of
advanced color, avor and fragrance
systems. Sensient uses state-of-the-
art technologies at facilities around
the world to develop and manufacture
customized food and beverage
systems; pharmaceutical colors,
coatings and excipients; cosmetic
color and ingredient systems;
household and industrial product
formulations; inkjet inks; and other
specialty colors and chemicals.
Years ended December 31, 2013 2012 % Change
Results of operationsRevenue $1,467,550 $1,459,050 1%Operating Income 172,362 191,208 (10%)Operating Income before Restructuring* 204,097 191,208 7%Net Income 113,295 123,908 (9%)Net Income before Restructuring* 135,254 123,908 9%
Per common shareNet Earnings: Basic Diluted 2.27 2.49 (9%) Diluted before Restructuring* 2.71 2.49 9% Dividends 0.91 0.87 5%Book Value 24.72 23.09 7%
Other informationCapital Expenditures $ 104,246 103,806 Depreciation and Amortization 52,016 48,352 Total Debt $ $ Number of Shareholders of Record 2,675 2,783 Average Common Shares Outstanding: Basic 49,755 49,596 Diluted 49,934 49,822
f i n a n c i a l h i g h l i g h t sin thousands except per share and shareholder data
1
Sensient Technologies Corporation 2013
Non-GAAP Financial Measures in MD&A section) for a reconciliation of these measures to GAAP and a discussion of why the Company is presenting this information.

Sensient’s dividend has risen by 28%
-dence in the Company’s sustained performance and strategic direction. In 2013, Sensient’s total shareholder return, with reinvestment of dividends, was 39%.
Opening the New Flavors & Fragrances Group HeadquartersIn September 2013, Sensient completed the relocation of the Flavors & Fragrances Group head-quarters to the Chicago suburb of Hoffman Estates.
At the new location, we have built state-of-the art R&D facilities, laboratories and pilot production capabilities. We can now showcase our complete product line to current and potential customers.
Chicago is a global city that serves as a hub for multinational food and beverage manufacturers. We are closer to key customers, and O’Hare Airport enables convenient access to markets around the world.
The Chicago metropolitan area also offers a strong pool of industry talent. Sensient now has improved access to skilled and experienced employees who are critical to our future growth.
operations around three key customer segments: savory, sweet and bever-ages. By focusing our technical and commercial efforts on these seg-ments, Sensient is better able to
leverage our existing expertise and deliver innovation to our customers.
We see substantial opportunities
fragrances. We will achieve sales and margin growth by emphasizing
and fragrance systems and continuing to move away from basic ingredients.
Restructuring and ExpansionIn 2013, Sensient completed an important restructuring that stream-lines our operations. This worldwide
The Company consolidated opera-tions at facilities in North America and Europe to eliminate redundancies
the same time, we made strategic investments in facilities to increase production capacity and R&D capabilities. In 2013, we completed the expansion of our digital ink facility in Morges, Switzerland, and we invested in new technology within our food and beverage color business.
Over the last several years, Sensient has made a number of strategic investments across the Company that have expanded our capabilities. We will continue to invest in each of our business segments to broaden our product line with new technologies.
A Strong Product PortfolioSensient is achieving sustained growth on the depth of our product
A Strong PerformanceSensient’s earnings in 2013, excluding the impact of restructuring costs, increased 9% over the 2012 result to $135 million, or $2.71 per share. The Company’s strategic focus on higher-margin, technology-based products will continue to deliver strong earnings growth in 2014.
Consolidated 2013 revenue reached an all-time high of $1.5 billion. Cash ow from operating activities, as
reported, was $153.6 million, an increase of 10% over 2012. Adjusted to remove the impact of this year’s
operating activities increased by 19%. This year’s strong performance represents our fourth consecutive year of record revenue and earnings.
The Color Group performed espe-
7% from 2012. The Company’s digital inks, pharmaceutical and cosmetics businesses achieved substantial growth and have robust sales pipelines. In Europe and Latin America, high-performance color systems for foods and beverages recorded strong sales as well.
in strengthening the operations of the Flavors & Fragrances Group, and we expect to see growth
segment moving forward.
On April 25, 2013, Sensient announced an increase in our quarterly dividend to 23 cents per share, for an annual-ized dividend of 92 cents per share.
Sensient Technologies Corporation achieved record revenue and earnings in 2013. We are well positioned for future growth across all areas of the Company.
2
letter to shareholders
F E B R U A R Y 1 , 2 0 1 4
portfolio. We offer industry-leading
for manufacturers of foods and beverages and household products. We also offer pharmaceutical excipients, cosmetic ingredients, industrial inks and a range of other industrial products.
Our products stand out in competitive markets because they offer distinct advantages to our customers. Sensient’s line of digital inks enables high-quality, customized printing on both textiles and hard surfaces. We recently introduced a line of water-based digital inks called ElvaJet® Alpha. These environmentally friendly inks enable textile and clothing companies to dramatically reduce energy and water consumption.
Specialty systems for foods and beverages remain a key component of Sensient’s product mix. The
customers to formulate products to meet growing consumer preferences for healthier foods. Sensient’s proprietary salt-reduction solutions allow manufacturers to produce high-quality processed foods with
-ment and masking technologies add sweetness and remove bitter notes in lower-calorie foods and beverages.
Sensient’s all-natural color solutions for foods and beverages enable manufacturers to meet growing consumer demand for naturally sourced products. We offer the widest spectrum of natural colors
available in the marketplace. Through intensive R&D, we continue to narrow the performance gap between natural
food colors.
Innovation and Product DevelopmentSensient is in the business of innovation. All of our units emphasize technology-based products that provide a competitive advantage. We better serve our customers and improve our margins by continuously delivering innovation.
Sensient has very strong product development expertise. Through strategic investments and operational changes, we have streamlined the path from product development to commercialization. We help custom-ers extend their existing brands as well as create entirely new products.
We will continue to emphasize a core strategy of investing in innovation and product development. The Company maintains exceptional R&D facilities at locations around the world. Sensient’s
enable us to respond quickly when opportunities arise to acquire or license new technologies or innova-tive product lines.
Positioned for the FutureWhen I joined this Company more than a quarter century ago, we were a commodity food business with little
-tional revenue. Today, we are a global innovation business with operations
on six continents. More than half of our revenue comes from sales outside the United States.
Sensient has a strong presence in all major industrialized nations. We also have substantial operations in key emerging markets, including China, Latin America, Eastern Europe and Africa. New and upgraded facilities in Brazil and the Republic of South Africa will serve local manufacturers who are meeting the needs of their nation’s growing consumer class. We see substantial opportunities for growth across all lines of our business, in locations around the world.
In July 2013, the Company announced the election of Sensient’s President
Manning to the position of President
February 2, 2014. I look forward to guiding Sensient through a successful transition in my new capacity as the Company’s Chairman of the Board.
The future of Sensient remains very promising. Our focus on developing and delivering innovative solutions for the global marketplace will drive ongoing growth. I am very optimistic about the next chapter for Sensient.
Sincerely,
Kenneth P. Manning
3
Sensient Technologies Corporation 2013
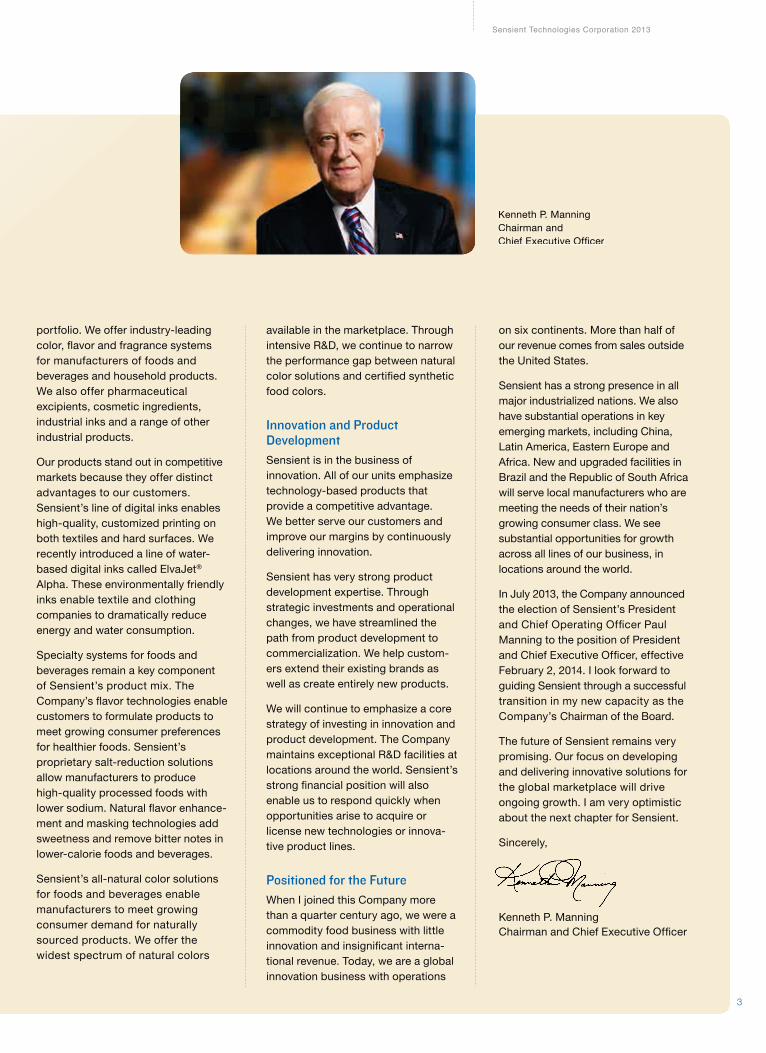
Kenneth P. Manning Chairman and

6
strategic advantages
• Industry expertise in color customization and product development at locations around the world
• Broadest product lines of natural and synthetic color systems for foods, beverages, pharmaceuticals, nutraceuticals and household products
• Comprehensive line of inks, including pigment dispersions, sublimation inks, and technical and purified dyes
• Strong R&D capabilities that deliver a steady pipeline of new products
• Exceptional product safety programs
groupcolorsensient is a leading developer and manufacturer of advanced color systems, specialty chemicals and sophisticated ingredients used in the production of foods and beverages, cosmetics, pharmaceuticals, digital inks, household goods and industrial products.
Tablet Coating Development— Innovative coating systems are developed, refined and customized by Sensient’s pharmaceutical unit.
Unique Drying and Processing Technologies— High-value color formulations are dried for milling,
customization and further production.
b uu s i n e ss ss s p r o f i l e
4

Beverage Formulation Expertise— Sensient’s beverage lab formulates natural and certified color solutions for high-impact beverage applications.
Advanced Emulsion and Dispersion Technology— Sensient combines process technology and expertise to develop the industry’s widest color spectrum of high-performance emulsions and dispersions.
Micro-Emulsion Production— Sensient’s advanced ana-lytical capabilities in micro-emulsion technology enable the development of uniform particle-sized color chemicals and other ingredients.
revenueby product
line
5%
55%
Pharmaceutical Colors and Coatings
Inkjet and Specialty Inks and Colors
Other Technical Colors
Cosmetic Ingredients
Food and Beverage Colors
15%
3%
22%
5
bb u s i n ee ss s p r o f if i l e
8
• Worldwide product development and manufacturing capabilities
• Extensive lines of customizable flavor systems for all areas of food processing
• Advanced technologies for extraction, dehydration, distillation and compounding
• Highly respected scientific and technical expertise
• World-leading product safety programs
• Vertical integration that enables the production of complex, customized solutions
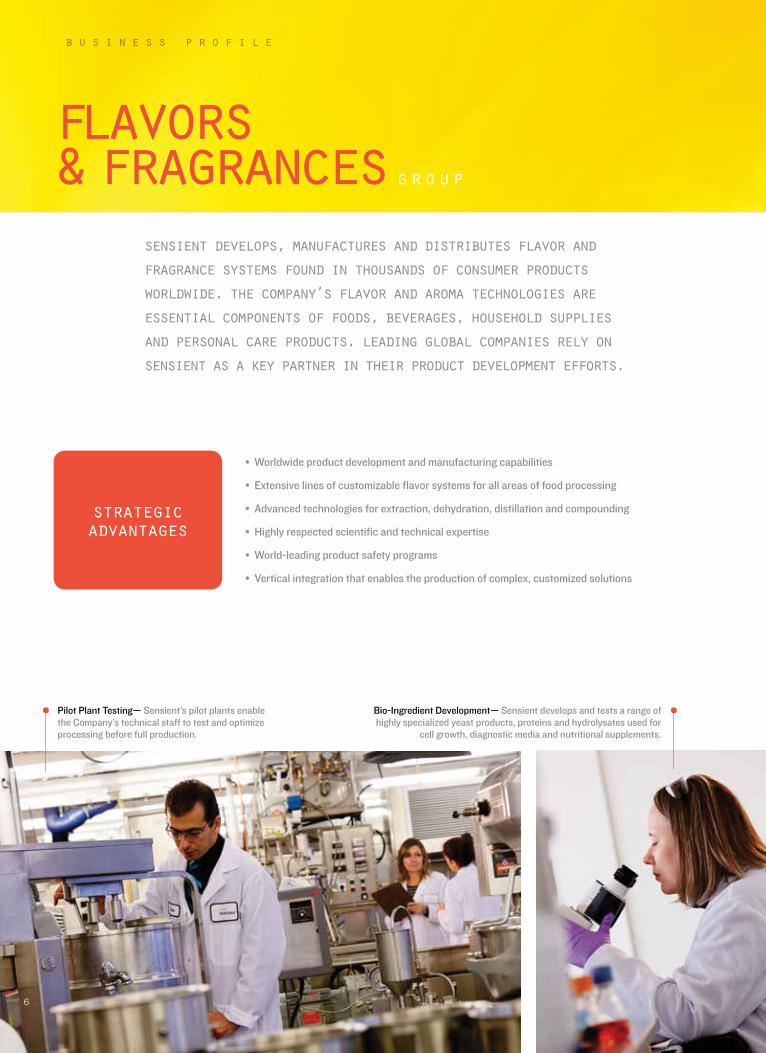
flavors & fragrances
sensient develops, manufactures and distributes flavor and fragrance systems found in thousands of consumer products worldwide. the company’s flavor and aroma technologies are essential components of foods, beverages, household supplies and personal care products. leading global companies rely on sensient as a key partner in their product development efforts.
Bio-Ingredient Development— Sensient develops and tests a range of highly specialized yeast products, proteins and hydrolysates used for
cell growth, diagnostic media and nutritional supplements.
Pilot Plant Testing— Sensient’s pilot plants enable the Company’s technical staff to test and optimize processing before full production.
group
strategic advantages
6

10%
8% 19%
26%
27% 10%
Sensory Evaluation Laboratories— At locations around the world, Sensient uses expert sensory panels to assess flavor systems.
Culinary Services— At test kitchens, Sensient works closely with customers to develop new products with authentic flavor profiles.
State-of-the-Art Flavor Laboratories— Flavorists, technicians and applications personnel work collaboratively to screen, develop and refine flavor systems for beverage, sweet and savory applications.
revenueby product
line
7
Natural Ingredients
Fragrances
Other Flavors
Beverage Flavors
Savory Flavors
Sweet Flavors

S T. LO U I S , M I SS O U R I • F I N L A N D • H O N G KO N G • C H I C AG O, I L L I N O I S • I N D O N E S I A • R O M A N I A •
C A L I F O R N I A • C O S TA R I C A • H U N G A RY • C H I N A • P H I L I P P I N E S • P O L A N D • M E X I C O • F R A N C E
C A N A D A • B R A Z I L • S O U T H K O R E A • N E T H E R L A N D S • S PA I N • T H A I L A N D • S O U T H A F R I C A
U N I T E D K I N G D O M • M I LWA U K E E , W I S C O N S I N • A U S T R A L I A • S W I T Z E R L A N D • S I N G A P O R E •
GERMANY • SWEDEN • JAPAN • ITALY • INDIA • NEW ZEAL AND • BELGIUM • CZECH REPUBLIC
locations
nations
global reach
8

•
sensient is a leading innovator in
the development of natural and synthetic
systems used by multinational and
regional manufacturers of thousands
of consumer and industrial products.
our proprietary technologies form the
foundation of many of the world’s
best-known brands for foods, bever-
ages, cosmetics, pharmaceuticals,
digital printing and other products.
Sensient Technologies Corporation 2013
9
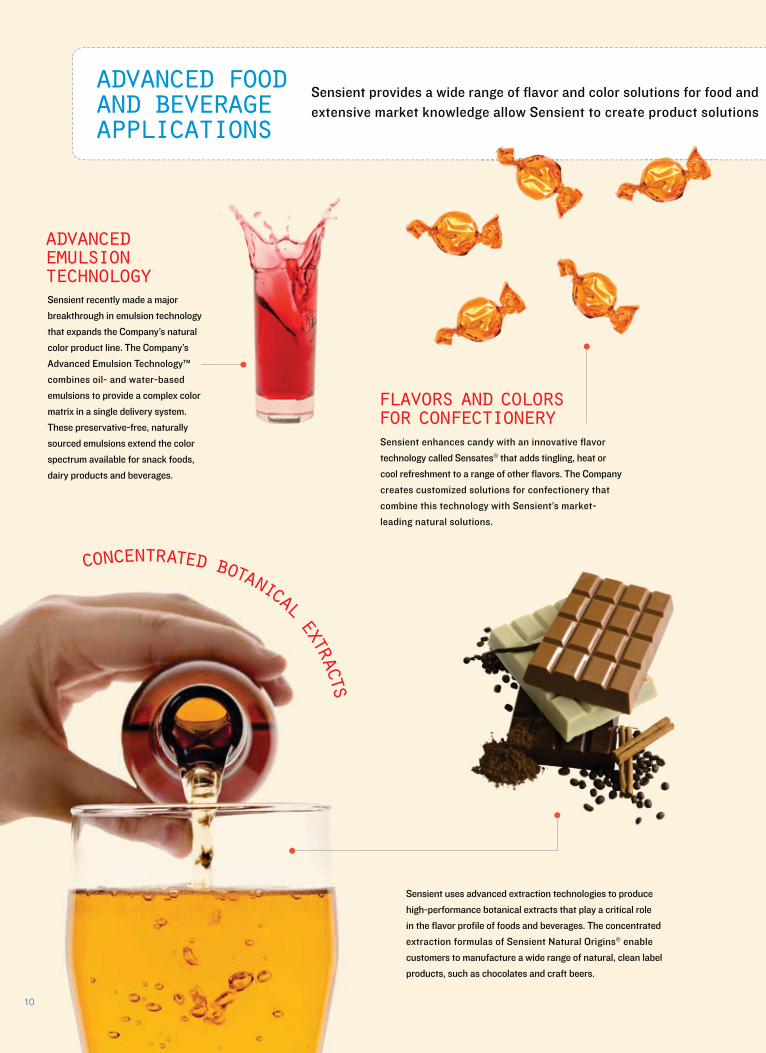
advanced food and beverage applications
Sensient provides a wide range of flavor and color solutions for food and extensive market knowledge allow Sensient to create product solutions
Sensient uses advanced extraction technologies to produce
high-performance botanical extracts that play a critical role
in the flavor profile of foods and beverages. The concentrated
extraction formulas of Sensient Natural Origins® enable
customers to manufacture a wide range of natural, clean label
products, such as chocolates and craft beers.
Sensient recently made a major
breakthrough in emulsion technology
that expands the Company’s natural
color product line. The Company’s
Advanced Emulsion Technology™
combines oil- and water-based
emulsions to provide a complex color
matrix in a single delivery system.
These preservative-free, naturally
sourced emulsions extend the color
spectrum available for snack foods,
dairy products and beverages.
advanced emulsion technology
concentrated botanical extracts
10
Sensient enhances candy with an innovative flavor
technology called Sensates® that adds tingling, heat or
cool refreshment to a range of other flavors. The Company
creates customized solutions for confectionery that
combine this technology with Sensient’s market-
leading natural solutions.
flavors and colors for confectionery
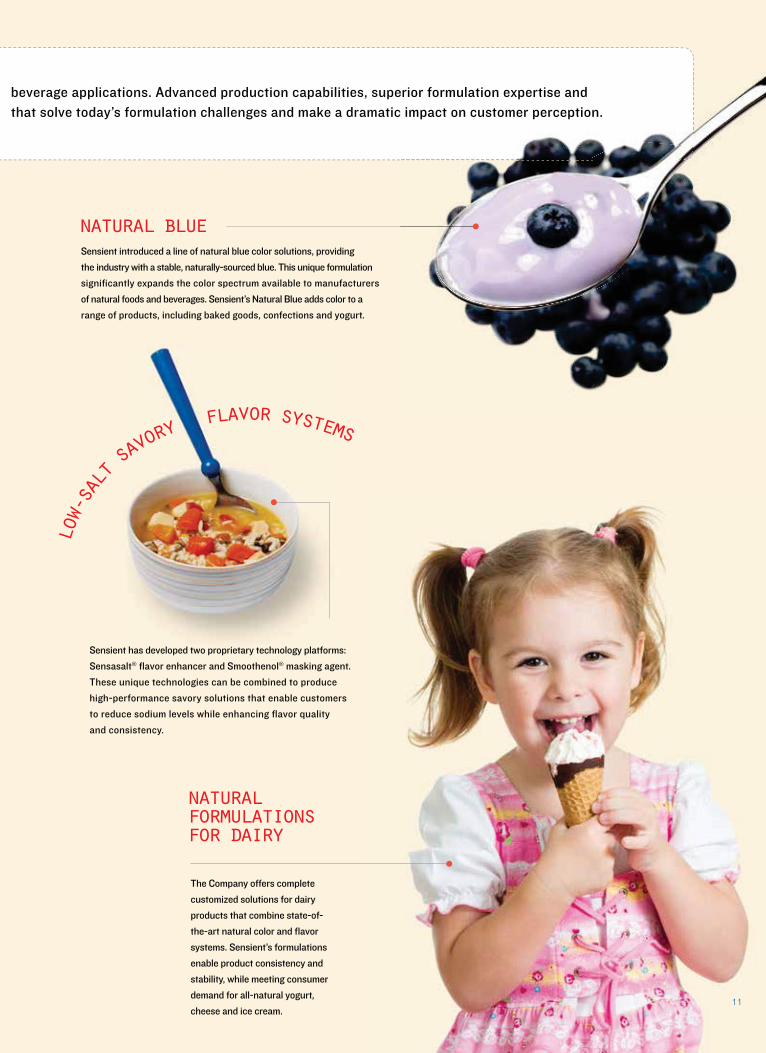
beverage applications. Advanced production capabilities, superior formulation expertise and that solve today’s formulation challenges and make a dramatic impact on customer perception.
Sensient introduced a line of natural blue color solutions, providing
the industry with a stable, naturally-sourced blue. This unique formulation
significantly expands the color spectrum available to manufacturers
of natural foods and beverages. Sensient’s Natural Blue adds color to a
range of products, including baked goods, confections and yogurt.
natural blue
low-salt
savory
flavor systems
erior formulation expertise and c impact on customer perception.
The Company offers complete
customized solutions for dairy
products that combine state-of-
the-art natural color and flavor
systems. Sensient’s formulations
enable product consistency and
stability, while meeting consumer
demand for all-natural yogurt,
cheese and ice cream.
natural formulations for dairy
11
Sensient has developed two proprietary technology platforms:
Sensasalt® flavor enhancer and Smoothenol® masking agent.
These unique technologies can be combined to produce
high-performance savory solutions that enable customers
to reduce sodium levels while enhancing flavor quality
and consistency.

innovative systems for global products
Sensient develops, manufactures and markets high-performance
and industrial products. All of Sensient’s businesses are global in
Sensient provides industry-leading
color, coating, flavor and ingredient
systems for the pharmaceutical
and nutraceutical industries. The
Company’s versatile and customizable
pharmaceutical products include
natural preservative-free coatings,
customizable certified colorants,
flavor-masking systems and
functional excipients.
pharmaceutical colors, coatings, flavors and masking agents
Sensient develops high-performance color and ink systems
for a range of digital printing applications. The Company’s
Sensijet® Ultra dispersions enable high-quality printing on
a range of substrates for diverse applications including
furniture, flooring, skis, snowboards and sportswear.
cosmetic and personal careingredientsSensient is a world-leading innova-
tor in the development of colors
and ingredient systems used in
the manufacture of cosmetics and
fragrances. The Company’s products
provide high-performance hues to
color cosmetics. Sensient also offers
the most efficient solubilizer of oils in
formulations and the most efficient
UV filters to protect against fading
associated with UV exposure.
color
s and inks
for industrial applications
and mas
cts. All of Sensient’s businesses are glo
Sensient develo
for a range of d
Sensijet® Ultra d
a range of subs
furniture, floor
color
s andinks
for industrial applications
12

bio-ingredient systems for vaccinessystems foSensient manufactures complex bio-
ingredient systems that are essential for the
high-yield production of certain vitamins
and pharmaceuticals, including vaccines
and antibiotics. The Company’s bio-ingredient
technology contributes to the manufacture
of seasonal influenza vaccine and other
bio-pharmaceutical applications.
color, fragrance and ingredient systems used in a range of consumer
scope and offer opportunities for significant growth.
water-based inkjet inks for textilesSensient’s breakthrough ElvaJet® Alpha technology platform enables
direct printing onto virtually any polyester fabric or textile using
innovative water-based inks. These environmentally friendly inks
enable manufacturers to minimize energy and water usage and reduce
CO2 emissions by up to 90 percent.
Sensient provides specialty fragrance systems for household
products such as laundry detergent and fabric softeners. The
Company’s micro-encapsulation technology releases complex
fragrance compounds over time, enabling clothing and linens to
remain fresh for days. Sensient also offers household product
solutions that neutralize odors and provide disinfectant properties.
fragrances for fabric care
r
Sensient manufacture
ingredient systems that
high-yield production o
and pharmaceuticals, in
and antibiotics. The Com
technology contributes
of seasonal influenza v
bio-pharmaceutical app

T A B L E O F C O N T E N T S
Management’s Discussion & Analysis of Operations & Financial Condition 15
Consolidated Statements of Earnings 23
Consolidated Statements of Comprehensive Income 24
Consolidated Balance Sheets 25
Consolidated Statements of Cash Flows 26
Consolidated Statements of Shareholders’ Equity 27
Notes to Consolidated Financial Statements 28
Management’s Report on Internal Control Over Financial Reporting 41
Report of Independent Registered Public Accounting Firm 41
Report of Independent Registered Public Accounting Firm on Internal Control Over Financial Reporting 42
Quarterly Data 43
Common Stock Prices and Dividends 43
Company Stock Performance 43
Five Year Review 44
Directors & Officers 46
Investor Information inside back cover
14

15
Management’s Discussion & Analysis of Operations & Financial Condition
O V E R V I E W
In 2013, Sensient Technologies Corporation (the “Company”) reported revenue of approximately $1.5 billion, reaching a new high for the fourth consecutive year. The Company successfully completed restructuring activities during the year, which included relocating the Flavors & Fragrances Group headquarters to Chicago as well as consolidating facilities and positions throughout the Company. Before the impact of restructuring costs, 2013 earnings per share, operating income, and cash flows from operating activities were also all-time highs. The Company’s increased gross profit margins and operating margins, before the impact of the restructuring costs, were driven by both the continued focus on higher margin business and cost reduction.
Diluted earnings per share were $2.27 in 2013 and $2.49 in 2012. The 2013 result includes 44 cents per share of restruc-turing costs. Earnings per share for 2013 before restructuring costs were $2.71, a 9% increase. Revenue was $1.47 billion in 2013 and $1.46 billion in 2012. Lower sales of non-strategic products, including OEM inkjet ink products, were replaced by higher margin products. Operating income was $172.4 mil-lion in 2013, and included $31.7 million of restructuring costs.
Operating income before restructuring costs was $204.1 mil-lion, an increase of 7% over 2012 operating income of $191.2 million. Operating margin in 2013 was 11.7%, which includes a 220 basis point impact from restructuring. Operating margin before restructuring costs in 2013 was 13.9%, an increase of 80 basis points from 13.1% in 2012.
Cash flows from operating activities were $153.6 million in 2013 and $139.4 million in 2012. Before the impact of restructuring costs, 2013 cash flows from operating activities were $166.4 million, an increase of 19.4% from 2012. The Company issued more than $125 million of long-term debt to refinance maturing notes and bank debt at the end of 2013. The new debt will reduce Sensient’s borrowing costs, and reflects the confidence investors have in Sensient’s strong balance sheet and future earnings. Sensient’s total debt to capital ratio was 22.2% at December 31, 2013, compared to 23.5% at December 31, 2012. Debt to EBITDA was 1.58 at December 31, 2013. Before restructuring costs, debt to EBITDA at December 31, 2013, was 1.39, an improvement from 1.48 at December 31, 2012.
Additional information on the results is included below.
N O N - G A A P F I N A N C I A L M E A S U R E S
The table below reconciles the reported 2013 results to those results before the impact of restructuring costs, which are non-GAAP financial measures. The company has included non-GAAP financial measures to remove the costs related to the restructuring plan and provide investors with a view of operating performance excluding the restructuring costs.
Reported Restructuring Adjusted Reported ($’s in thousands) 2013 Impact 2013 2012
Cost of products sold 991,648 1,840 989,808 995,907 Selling and administrative expenses 303,540 29,895 273,645 271,935Operating income 172,362 (31,735) 204,097 191,208
Earnings before income taxes 156,215 (31,735) 187,950 174,307Income taxes 42,920 (9,776) 52,696 50,399
Gross margin 32.4% 32.6% 31.7%Selling and administrative expenses 20.7% 18.6% 18.6%Operating margin 11.7% 13.9% 13.1%
Gross Margin
0910111213
30.7%30.7%
31.4%31.7%
32.4%

16
Management’s Discussion & Analysis of Operations & Financial Condition (continued)
R E S U L T S O F O P E R A T I O N S
2013 vs. 2012
Sensient’s revenue was approximately $1.5 billion in both 2013 and 2012. Revenue in the Flavors & Fragrances Group was $881.3 million in 2013 and $875.3 million in 2012. Color Group revenue was $494.0 million in 2013 and $499.2 million in 2012. Corporate & Other revenue, which includes the Company’s operations in the Asia Pacific region, China and certain flavor operations in Central and South America, was $150.4 million in 2013 and $145.6 million in 2012. Foreign currency translation increased consolidated revenue in 2013 by approximately 0.1%. Additional information on group results can be found in the Segment Information section.
The Company’s gross margin was 32.4% in 2013, an increase of 70 basis points from 31.7% in 2012. The 2013 gross margin before the impact of restructuring costs was 32.6%. The impact of increased selling prices and favor-able product mix more than offset higher manufacturing costs in 2013.
Selling and administrative expense as a percent of revenue was 20.7% in 2013 compared to 18.6% in 2012. The increase in selling and administrative expenses during 2013 was attributable to the Company’s restructuring costs recorded in 2013. Selling and administrative expense as a percent of revenue before the impact of restructuring costs in 2013 was 18.6%.
Operating income was $172.4 million in 2013 compared to $191.2 million in 2012. Before the $31.7 million of total restructuring costs, operating income for 2013 was $204.1 million, an increase of 6.7% from the prior year. Additional information on group results can be found in the Segment Information section.
Interest expense decreased 4.5% to $16.1 million in 2013 from $16.9 million in 2012. The decrease was due to lower average interest rates partially offset by higher average outstanding debt balances.
The effective income tax rate was 27.5% in 2013 and 28.9% in 2012. The effective tax rates for both 2013 and 2012 were reduced by discrete items, including the favorable resolu-tion of prior years’ tax matters. In addition, the 2013 rate was impacted by restructuring costs. In total, these discrete items and the impact of restructuring costs reduced the effective tax rate for 2013 and 2012 by 2.0% and 2.2%, respectively.
2013 2012
Rate before restructuring and discrete items 29.5% 31.1%Restructuring impact (0.3%)Discrete items (1.7%) (2.2%)Reported effective tax rate 27.5% 28.9%
The effective tax rate for 2014 is expected to be between 31.0% and 32.0% prior to the recording of any discrete items.
S E G M E N T I N F O R M A T I O N
The Company determines its operating segments based on information utilized by the chief operating decision maker to allocate resources and assess performance. The Company’s reportable segments consist of the Flavors & Fragrances Group and the Color Group. The results of three additional operating segments, the Asia Pacific Group, the China Group and Flavors Central & South America, are reported in the Corporate & Other segment. Beginning in 2013, the Company moved certain of its cosmetic and pharmaceutical operations in Asia Pacific and China into the Color Group to consolidate management of those operations. The prior year results have been restated as a result of this change.
Flavors & Fragrances Revenue for the Flavors & Fragrances Group was $881.3 million in 2013 and $875.3 million in 2012. The Group reported higher selling prices ($15.4 million) and the favorable impact of foreign currency translation ($4.2 million), partially reduced by lower volumes ($13.6 million). Higher selling prices were reported in both natural ingredi-ents and traditional flavors. The lower volumes were driven by natural ingredients in North America partially offset by higher volumes in traditional flavors.
Gross margins were 25.6% of revenue in both 2013 and 2012. The impact of higher selling prices offset an increase in manufacturing costs.
The Flavors & Fragrances Group operating income was $122.4 million in 2013 and $123.0 million in 2012. The
Revenue ( In Bi l l ions)
0910111213
$1.20$1.33
$1.43$1.46$1.47

17
Sensient Technologies Corporation 2013
decrease in operating income was primarily related to operations in Europe ($4.8 million), partially offset by higher operating income in North America ($4.2 million). The lower profit in Europe was driven by higher employee costs related to selling and technical personnel and other costs, partially offset by the impact of higher volume. The higher profit in North America was primarily due to higher selling prices partially offset by the impact of lower volumes and higher raw material costs. Operating income as a percent of reve-nue was 13.9% in 2013 and 14.1% in 2012 primarily for the reasons discussed above.
Color The Color Group revenue was $494.0 million in 2013 and $499.2 million in 2012. The decrease in revenue was primarily driven by lower sales of non-food colors ($9.4 mil-lion), partially offset by higher sales of food and beverage colors ($3.7 million). The lower sales of non-food colors were driven by lower volumes of OEM inkjet products as a result of the termination of a supply agreement by a major customer in early 2013. The Group has been replacing non-strategic products such as these with higher margin, value-added products.
Gross margin for the Color Group increased 230 basis points to 40.4% in 2013 from 38.1% in 2012. Higher selling prices, favorable product mix and favorable raw material costs were the primary reasons for the improved margins. The 2013 results reflect the Group’s strategy to focus on higher margin products and eliminate non-strategic business.
Color Group operating income in 2013 increased 7.5% to $103.6 million from $96.4 million in 2012. The increase in operating income was primarily attributable to food and bev-erage colors ($3.8 million) and non-food colors ($2.9 million). The higher operating income from food and beverage colors was primarily due to the impact of favorable volumes and raw material costs. The increase in operating income for non-food colors was primarily due to favorable product mix and raw material costs. Operating income as a percent of revenue increased 170 basis points to 21.0% in 2013 from 19.3% in 2012 primarily due to the reasons described above.
Corporate & Other The Corporate & Other segment includes the Asia Pacific region, China and certain of the Company’s flavor businesses in Central and South America, combined with the corporate office expenses.
Revenue for the Corporate & Other segment was $150.4 million and $145.6 million in 2013 and 2012, respectively. The increase was primarily related to higher volumes in Asia Pacific.
The Corporate & Other segment reported operating losses of $53.6 million and $28.2 million in 2013 and 2012, respec-tively. Before the impact of restructuring costs, the Corporate & Other segment reported operating losses of $21.9 million in 2013. The improvement in results before the impact of restructuring costs was primarily due to profit on higher volumes and favorable product mix in Asia Pacific and China and lower corporate expenses. Group perfor-mance is evaluated on operating income of the respective business units before restructuring charges which are reported in the Corporate & Other segment.
2012 vs. 2011
Sensient’s revenue was $1.46 billion in 2012 and $1.43 billion in 2011. Revenue in the Flavors & Fragrances Group was $875.3 million in 2012, an increase of 2.1% from $857.5 million in 2011. Color Group revenue was $499.2 million in 2012 and $496.8 million in 2011. Corporate & Other revenue, which includes the Company’s operations in the Asia Pacific region, China and certain flavor opera-tions in Central and South America, increased 8.9% in 2012. Foreign currency translation decreased consoli-dated revenue in 2012 by approximately 2.6%. Additional information on group results can be found in the Segment Information section.
The Company’s gross margin was 31.7% in 2012, an increase of 30 basis points from 31.4% in 2011. The impact of increased selling prices and favorable product mix more than offset higher raw material costs in 2012.
Selling and administrative expense as a percent of revenue was 18.6% in 2012 compared to 18.1% in 2011. The increase in selling and administrative expenses during 2012 was pri-marily attributable to the Company’s continued expansion of its sales force to penetrate new and existing markets.
Operating income was $191.2 million in 2012 compared to $190.8 million in 2011. The increase was due to the increased revenue and gross margin discussed above. Additional information on group results can be found in the Segment Information section.
Interest expense decreased 13.1% to $16.9 million in 2012 from $19.4 million in 2011. The decrease is due to lower average interest rates partially offset by higher average outstanding debt balances.
The income tax rate was 28.9% in 2012 and 29.7% in 2011. The effective tax rates for both 2012 and 2011 were reduced by discrete items, including the favorable resolution of prior

18
Gross margin for the Color Group increased 260 basis points to 38.1% in 2012 compared to 35.5% in 2011. Higher selling prices and favorable product mix more than offset increased raw material and manufacturing costs. The 2012 results reflect the Group’s strategy to focus on higher margin products and eliminate lower margin business.
Color Group operating income increased 4.2% to $96.4 million from $92.5 million in 2011. The increase in operating income was primarily attributable to higher sales of food and beverage colors ($6.7 million) and non-food colors ($0.6 mil-lion), partially reduced by the unfavorable impact of foreign exchange rates ($3.4 million). The higher operating income from food and beverage colors was primarily due to the impact of higher selling prices and favorable product mix. The increase in operating income for non-food colors was primarily due to the higher volumes, higher selling prices and favorable product mix, partially reduced by unfavorable raw material and manufacturing costs. Operating income as a percent of revenue increased 70 basis points to 19.3% from 18.6% in 2011 primarily due to the reasons described above.
Corporate & Other Revenue for the Corporate & Other segment was $145.6 million and $133.6 million in 2012 and 2011, respectively. The increase was primarily related to higher volumes in Asia Pacific.
The Corporate & Other segment reported operating losses of $28.2 million and $31.1 million in 2012 and 2011, respectively. The improvement in results was primarily due to the profit on higher volumes in Asia Pacific and lower expenses.
L I Q U I D I T Y A N D F I N A N C I A L P O S I T I O N
The Company’s financial position remains strong, enabling it to meet cash requirements for operations, acquisitions, capi-tal expansion programs, share repurchases and dividend payments to shareholders. The Company intends to fund working capital requirements, principal and interest pay-ments, acquisitions and other liabilities with cash provided by operations, to the extent available, and short-term and long-term borrowings under new and existing credit facilities.
The Company’s ratio of debt to total capital improved to 22.2% at December 31, 2013, compared to 23.5% and 24.2% at December 31, 2012 and 2011, respectively. The improvement in 2013 resulted primarily from an increase in equity driven by 2013 net income.
years’ tax matters. In total, these discrete items reduced the effective tax rate for 2012 and 2011 by 2.2% and 2.5%, respectively.
2012 2011
Rate before discrete items 31.1% 32.2%Discrete items (2.2%) (2.5%)Reported effective tax rate 28.9% 29.7%
S E G M E N T I N F O R M A T I O N
Flavors & Fragrances Revenue for the Flavors & Fragrances Group was $875.3 million in 2012 and $857.5 million in 2011. The Group reported an increase in volumes ($27.2 million) and higher selling prices ($12.0 million), partially reduced by the unfavorable impact of foreign currency translation ($21.5 million). Higher selling prices were reported primarily in traditional flavors. The higher volumes were driven by both traditional flavors and natural ingredients in North America.
Gross margins were 25.6% of revenue in 2012 and 26.7% in 2011. The decrease was primarily due to higher raw material costs in natural ingredients.
The Flavors & Fragrances Group operating income was $123.0 million in 2012 and $129.4 million in 2011. The decrease in operating income was related to operations in North America ($4.8 million), Europe ($1.4 million) and the unfavorable impact of foreign currency translation ($1.7 million), partially offset by higher operating income in Mexico ($1.4 million). The lower profit in North America was driven by the higher raw material costs in natural ingredients. The lower profit in Europe was primarily due to higher costs. The higher profit in Mexico was due to favorable product mix combined with higher volumes and selling prices. Operating income as a percent of revenue was 14.1% in 2012 and 15.1% in 2011 primarily for the reasons discussed above.
Color The Color Group revenue was $499.2 million in 2012 and $496.8 million in 2011. The increase in revenue was driven by higher sales of non-food colors ($15.3 million) and higher sales of food and beverage colors ($4.9 million), par-tially offset by the unfavorable impact of foreign currency translation ($17.8 million). The higher sales of both food and beverage colors and non-food colors were driven by higher volumes and higher selling prices.
Management’s Discussion & Analysis of Operations & Financial Condition (continued)

19
Sensient Technologies Corporation 2013
Net cash provided by operating activities was $153.6 million in 2013, $139.4 million in 2012 and $142.9 million in 2011. Operating cash flow provided the primary source of funds for operating needs, acquisitions, capital expenditures, share-holder dividends, share repurchases and net debt repay-ments. The increase in net cash provided by operating activities in 2013 was primarily due to a lower use of working capital partially offset by lower earnings due to the restruc-turing program. The decrease in cash from operating activi-ties in 2012 was primarily due to a higher use of working capital partially offset by the impact of higher earnings.
Net cash used in investing activities was $98.2 million in 2013, $102.7 million in 2012 and $74.0 million in 2011. Capital expenditures were $104.2 million in 2013, $103.8 million in 2012 and $72.2 million in 2011.
Net cash used in financing activities was $48.2 million in 2013, $48.8 million in 2012 and $52.9 million in 2011. The Company had a net reduction in debt of $3.7 million in 2013, a net increase in debt of $15.9 million in 2012 and a net reduction in debt of $14.2 million in 2011. In 2012, Sensient purchased $23.2 million of Company stock.
The Company has paid uninterrupted quarterly cash divi-dends since commencing public trading in its stock in 1962. The Company’s quarterly dividend was 23 cents per share beginning in the second quarter of 2013 when it was
increased from 22 cents per share. Dividends paid per share were 91 cents in 2013, 87 cents in 2012 and 84 cents in 2011. Total dividends paid were $45.5 million, $43.4 mil-lion and $42.0 million in 2013, 2012 and 2011, respectively.
In 2013 and 2011, the Company was able to finance capital expenditures and dividend payments and still reduce debt levels. In 2012, the Company used cash provided by oper-ating activities to fund most of its capital expenditures, dividend payments and purchases of Company stock. The Company maintains debt levels it considers prudent based on its cash flows, interest coverage and percentage of total debt to total capital.
The impact of inflation on both the Company’s financial position and its results of operations has been minimal and is not expected to significantly affect 2014 results.
I S S U E R P U R C H A S E S O F E Q U I T Y S E C U R I T I E S
There were no purchases of Company stock in 2013 or 2011. Sensient purchased 0.6 million shares of Company stock in 2012 for a total cost of $23.2 million. On April 27, 2001, the Board approved a share repurchase program under which the Company is authorized to repurchase up to 5.0 million shares of Company stock in addition to amounts remaining from prior Board authorizations. As of December 31, 2013, 2.4 million shares were available to be repurchased under existing authorizations. The Company’s share repurchase program has no expiration date.
C R I T I C A L A C C O U N T I N G P O L I C I E S
In preparing the financial statements in accordance with accounting principles generally accepted in the U.S., man-agement is required to make estimates and assumptions that have an impact on the asset, liability, revenue and expense amounts reported. These estimates can also affect supplemental information disclosures of the Company,
Debt to Total Capital (At December 31)
0910111213
32.0%26.2%
24.2%23.5%
22.2%
Capital Expenditures/Depreciation ( In Mi l l ions)
09
10
11
12
13
$47.7$40.9
$42.1
$44.8
$47.0
$55.8
$72.2
$103.8
$50.7$104.2
Dividends Paid Per Share
0910111213
$0.76$0.79
$0.84$0.87
$0.91

20
Management’s Discussion & Analysis of Operations & Financial Condition (continued)
including information about contingencies, risk and financial condition. The Company believes, given current facts and circumstances, that its estimates and assumptions are reasonable, adhere to accounting principles generally accepted in the U.S. and are consistently applied. Inherent in the nature of an estimate or assumption is the fact that actual results may differ from estimates and estimates may vary as new facts and circumstances arise. The Company makes routine estimates and judgments in determining the net realizable value of accounts receivable, inventories, property, plant and equipment, and prepaid expenses. Management believes the Company’s most critical account-ing estimates and assumptions are in the following areas:
Revenue Recognition The Company recognizes revenue (net of estimated discounts, allowances and returns) when title passes, the customer is obligated to pay the Company and the Company has no remaining obligations. Such rec-ognition typically corresponds with the shipment of goods.
Goodwill Valuation The Company reviews the carrying value of goodwill annually utilizing several valuation methodologies, including a discounted cash flow model. The Company com-pleted its annual goodwill impairment test under Accounting Standards Codification (“ASC”) 350, Intangibles – Goodwill
and Other, in the third quarter of 2013. In conducting its annual test for impairment, the Company estimates the fair value for each of its reporting units and compares each of these values to the net book value of each reporting unit. Fair value is estimated using both a discounted cash flow analy-sis and an analysis of comparable company market values. If the fair value of a reporting unit exceeds its net book value, no impairment exists. The Company has three reporting units that had goodwill recorded and were tested for impairment. The Flavors & Fragrances reporting unit and the Asia Pacific reporting unit had fair values that were over 100% above their respective net book values. The fair value of the Color reporting unit had a fair value that was over 80% above its net book value. Changes in estimates of future cash flows caused by items such as unforeseen events or changes in market conditions could negatively affect the reporting units’ fair value and result in an impairment charge.
Income Taxes The Company estimates its income tax expense in each of the taxing jurisdictions in which it oper-ates. The Company is subject to a tax audit in each of these jurisdictions, which could result in changes to the estimated tax expense. The amount of these changes would vary by jurisdiction and would be recorded when
probable and estimable. These changes could impact the Company’s financial statements. Management has recorded valuation allowances to reduce the Company’s deferred tax assets to the amount that is more likely than not to be realized. Examples of deferred tax assets include deductions, net operating losses and tax credits that the Company believes will reduce its future tax payments. In assessing the future realization of these assets, manage-ment has considered future taxable income and ongoing tax planning strategies. An adjustment to the recorded valuation allowance as a result of changes in facts or circumstances could result in a significant change in the Company’s tax expense. The Company does not provide for deferred taxes on unremitted earnings of foreign sub-sidiaries which are considered to be invested indefinitely.
Commitments and Contingencies The Company is subject to litigation and other legal proceedings arising in the ordi-nary course of its businesses or arising under provisions related to the protection of the environment. Estimating lia-bilities and costs associated with these matters requires the judgment of management, who rely in part on information from Company legal counsel. When it is probable that the Company has incurred a liability associated with claims or pending or threatened litigation matters and the Company’s exposure is reasonably estimable, the Company records a charge against earnings. The Company recognizes related insurance reimbursement when receipt is deemed probable. The Company’s estimate of liabilities and related insurance recoveries may change as further facts and circumstances become known.
M A R K E T R I S K F A C T O R S
The Company is exposed to market risks, including changes in interest rates, currency exchange rates and commodity prices. To manage the volatility relating to these exposures on a consolidated basis, the Company nets the exposures to take advantage of natural offsets. The Company also enters into various derivative transactions for some of the remaining exposures pursuant to the Company’s policies covering hedging practices. The financial impacts of these hedging instruments are offset by corresponding changes in the underlying exposures being hedged.
The Company does not hold or issue derivative financial instruments for trading purposes. Note 1 and Note 5 to the Consolidated Financial Statements include a discussion of the Company’s accounting policies for financial instruments.

21
Sensient Technologies Corporation 2013
A key part of the Company’s strategy is to expand into new geographic markets. Because the Company manufactures and sells its products throughout the world, it is exposed to movements in foreign currency exchange rates. The major foreign currency exposures involve the markets in Western Europe, Mexico and Canada. The primary purpose of the Company’s foreign currency hedging activities is to protect against the volatility associated with foreign currency sales, purchases of materials, and other assets and liabilities cre-ated during the normal course of business. The Company generally utilizes foreign exchange contracts with durations of less than 12 months that may or may not be designated as cash flow hedges under ASC 815, Derivatives and
Hedging. The net fair value of these instruments, based on dealer quotes, was an asset of $0.2 million at December 31, 2013, and was negligible at December 31, 2012. At December 31, 2013, the potential gain or loss in the fair value of the Company’s outstanding foreign exchange contracts, assuming a hypothetical 10% fluctuation in the currencies of such contracts, would be approximately $3.0 million. However, any change in the value of the contracts, real or hypothetical, would be significantly offset by a corre-sponding change in the value of the underlying hedged items. In addition, this hypothetical calculation assumes that each exchange rate would change in the same direction relative to the U.S. dollar.
The Company has certain debt denominated in Swiss Francs and Euros. These non-derivative debt instruments act as partial hedges of the Company’s Swiss Franc and Euro net asset positions. The potential increase or decrease in the annual U.S. dollar interest expense of the Company’s outstanding foreign currency-denominated debt, assuming a hypothetical 10% fluctuation in the cur-rencies of such debt, would be approximately $0.2 mil-lion at December 31, 2013. However, any change in interest expense from fluctuations in currency, real or hypothetical, would be significantly offset by a corre-
sponding change in the value of the foreign income before interest. In addition, this hypothetical calculation assumes that each exchange rate would change in the same direction relative to the U.S. dollar.
The Company manages its debt structure and interest rate risk through the use of fixed rate and floating rate debt and through the use of derivatives. The Company’s primary exposure is to interest rates in the U.S. and Western Europe. At December 31, 2013, the potential increase or decrease in annual interest expense, assuming a hypothetical 10% fluctuation in interest rates of floating rate debt, would be approximately $0.1 million.
The Company is the purchaser of certain commodities, such as corn, sugar, soybean meal and fruits. The Company generally purchases these commodities based upon market prices that are established with the vendor as part of the purchase process. In general, the Company does not use commodity financial instruments to hedge commodity prices due to a high correlation between the commodity cost and the ultimate selling price of the Company’s products. On occasion, the Company may enter into non-cancelable forward purchase contracts, as deemed appropriate, to reduce the effect of price fluctuations on future manufacturing requirements.
C O N T R A C T U A L O B L I G A T I O N S
The Company is subject to certain contractual obligations, including long-term debt, operating leases, manufacturing purchases and pension benefit obligations. The Company has unrecognized tax benefits of $5.3 million as of December 31, 2013. However, the Company cannot make a reasonably reliable estimate of the period of potential cash settlement of the liabilities and, therefore, has not included unrecognized tax benefits in the following table of significant contractual obligations as of December 31, 2013.
P A Y M E N T S D U E B Y P E R I O D
(in thousands) Total 1 year 2-3 years 4-5 years > 5 years
Interest payments on long-term debt 53,436 12,762 23,446 12,874 4,354Operating lease obligations 17,624 7,473 8,196 1,758 197Manufacturing purchase Pension funding obligations 61,631 22,906 15,885 4,555 18,285Total contractual obligations $609,539 $154,129 $168,611 $136,398 $150,401

22
N E W P R O N O U N C E M E N T S
On January 1, 2013, the Company adopted ASU No. 2013-02, Comprehensive Income (Topic 220): Reporting of
Amounts Reclassified Out of Accumulated Other
Comprehensive Income, which requires companies to report the effect on the line items for significant items reclassified out of other comprehensive income to net income, prospec-tively. The Company has included this disclosure in Note 8 of these Consolidated Financial Statements. The adoption of this ASU had no impact on the Company’s financial condition or results of operations.
On January 1, 2013, the Company adopted ASU No. 2012-02, Intangibles – Goodwill and Other (Topic 350): Testing
Indefinite-Lived Intangible Assets for Impairment. This ASU gives companies the option to perform a qualitative assessment to determine whether further indefinite-lived intangible asset impairment testing is necessary. If, as result of the qualitative assessment, it is determined that it is more likely than not that an indefinite-lived intangible asset is impaired, the quantitative impairment test is required. Otherwise no further testing is required. The adoption of this ASU had no impact on the Company’s financial condition or results of operations.
O F F - B A L A N C E S H E E T A R R A N G E M E N T S
The Company had no off-balance sheet arrangements as of December 31, 2013.
F O R W A R D - L O O K I N G S T A T E M E N T S
This document contains forward-looking statements that reflect management’s current assumptions and estimates of future economic circumstances, industry conditions, Company performance and financial results. Forward-looking statements include statements in the future tense, statements referring to any period after December 31, 2013, and statements including the terms “expect,” “believe,” “anticipate” and other similar terms that express
Management’s Discussion & Analysis of Operations & Financial Condition (continued)
expectations as to future events or conditions. The Private Securities Litigation Reform Act of 1995 provides a safe harbor for such forward-looking statements. Such forward-looking statements are not guarantees of future perfor-mance and involve known and unknown risks, uncertainties and other factors that could cause actual events to differ materially from those expressed in those statements. A variety of factors could cause the Company’s actual results and experience to differ materially from the anticipated results. These factors and assumptions include the pace and nature of new product introductions by the Company’s customers; the Company’s ability to successfully imple-ment its growth strategies; the outcome of the Company’s various productivity-improvement and cost-reduction efforts or other restructuring or relocation activities; changes in costs of raw materials and energy; industry and economic factors related to the Company’s domestic and international business; competition from other suppliers of colors, flavors and fragrances; growth or contraction in markets for products in which the Company competes; terminations and other changes in customer relationships; industry acceptance of price increases; currency exchange rate fluctuations; cost and availability of credit; and the matters discussed above including the critical accounting policies described therein. The Company does not under-take to publicly update or revise its forward-looking state-ments even if experience or future changes make it clear that any projected results expressed or implied therein will not be realized.

23
Sensient Technologies Corporation 2013
Consolidated Statements of Earnings
( in thousands except per share amounts) Years ended December 31, 2013 2012 2011
Revenue $1,467,550 $1,459,050
Cost of products sold 991,648 995,907 981,137
Selling and administrative expenses 303,540 271,935 258,829
Operating Income 172,362 191,208 190,823
Interest expense 16,147 16,901 19,439
Earnings Before Income Taxes 156,215 174,307 171,384
Income taxes 42,920 50,399 50,900
Net Earnings $ $ 123,908
Earnings per share:
$ 2.28
$ 2.27
Average common shares outstanding:
49,755 49,596 49,746
49,934 49,822 49,937
See notes to consolidated financial statements.

24
Consolidated Statements of Comprehensive Income
( in thousands) Years ended December 31, 2013 2012 2011
Net earnings $113,295 $123,908 )
Unrealized (loss) gain on cash flow hedges, arising during the period net of tax of $71, $471 and $356, respectively (212) (1,212) 914)
Reclassification adjustment for cash flow hedges included in net income, net of tax of $21, $335 and $272, respectively 78 862 (699)
Pension adjustment, net of tax of $3,675, $1,040 and $2,536, respectively 5,294 (2,216) 3,652)
Tax effect on losses previously recorded in other comprehensive income 16,836
Foreign currency translation on net investment hedges (4,020) (1,251) 2,532
Tax effect of current year activity on net investment hedges 1,810
Foreign currency translation on long term intercompany loans 5,781 (1,540) 752
Other foreign currency translation 1,856 22,984 (31,569)
Total Comprehensive Income $123,882 $158,371 )
See notes to consolidated financial statements.

25
Sensient Technologies Corporation 2013
Consolidated Balance Sheets
2013 2012
AssetsCurrent Assets:
$ 19,836 $ 15,062
of $4,327 and $3,045, respectively 233,751 237,626474,452 442,714
38,079 41,79923,707 14,153
Total current assets 789,825 751,354Other assets 47,786 47,685Intangible assets – at cost, less accumulated amortization of $15,634 and $14,353, respectively 10,546 11,578Goodwill 457,269 451,318Property, Plant and Equipment:
56,343 53,387374,388 339,732751,267 735,237
55,236 41,999 1,237,234 1,170,355
(671,926) (655,647) 565,308 514,708Total assets $1,870,734 $1,776,643
Liabilities and Shareholders’ EquityCurrent Liabilities:
$ 99,117 $ 96,28332,669 27,16278,579 56,9465,478 3,7977,050 20,048
Total current liabilities 222,893 204,236Deferred income taxes 19,956 13,032Other liabilities 8,539 10,971Accrued employee and retiree benefits 28,538 60,527Long-term debt 348,124 333,979Shareholders’ Equity:
issued 53,954,874 shares 5,396 5,396
105,119 98,2531,217,874 1,150,092
(91,707) (95,258)6,002 (4,585)
1,242,684 1,153,898Total liabilities and shareholders’ equity $1,870,734 $1,776,643
See notes to consolidated financial statements.

26
Consolidated Statements of Cash Flows
2013 2012 2011
Cash Flows from Operating ActivitiesNet earnings $113,295 $123,908 $120,484Adjustments to arrive at net cash provided by operating activities:
52,016 48,352 46,0998,430 10,086 7,819
695 (869) (4,323)(6,178) 2,916 (3,138)
3,466 (15,158) (5,095)(30,217) (23,125) (28,391)
616 (9,405) (1,825)3,606 225 6,2995,384 (1,209) 3,075
(100) (1,689) (3,148)2,540 5,334 5,021
Net cash provided by operating activities 153,553 139,366 142,877
Cash Flows from Investing Activities Acquisition of property, plant and equipment (104,246) (103,806) (72,200)Proceeds from sale of assets 6,225 1,364 2,076Acquisition of new businesses, net of cash acquired Other investing activities (208) (242) (207)Net cash used in investing activities (98,229) (102,684) (74,037)
Cash Flows from Financing ActivitiesProceeds from additional borrowings 194,973 73,903 184,074Debt payments (198,686) (58,052) (198,259)Purchase of treasury stock Dividends paid (45,513) (43,426) (41,968)Proceeds from options exercised and other equity transactions 1,007 1,957 3,205Net cash used in financing activities (48,219) (48,772) (52,948)Effect of exchange rate changes on cash and cash equivalents (2,331) 4,297 (7,292)Net increase (decrease) in cash and cash equivalents 4,774 (7,793) 8,600Cash and cash equivalents at beginning of year 15,062 22,855 14,255Cash and cash equivalents at end of year $ 19,836Cash paid during the year for:
$ 16,16847,436 53,492 55,570
Capitalized interest 1,875 1,601 1,240
See notes to consolidated financial statements.
27
Sensient Technologies Corporation 2013
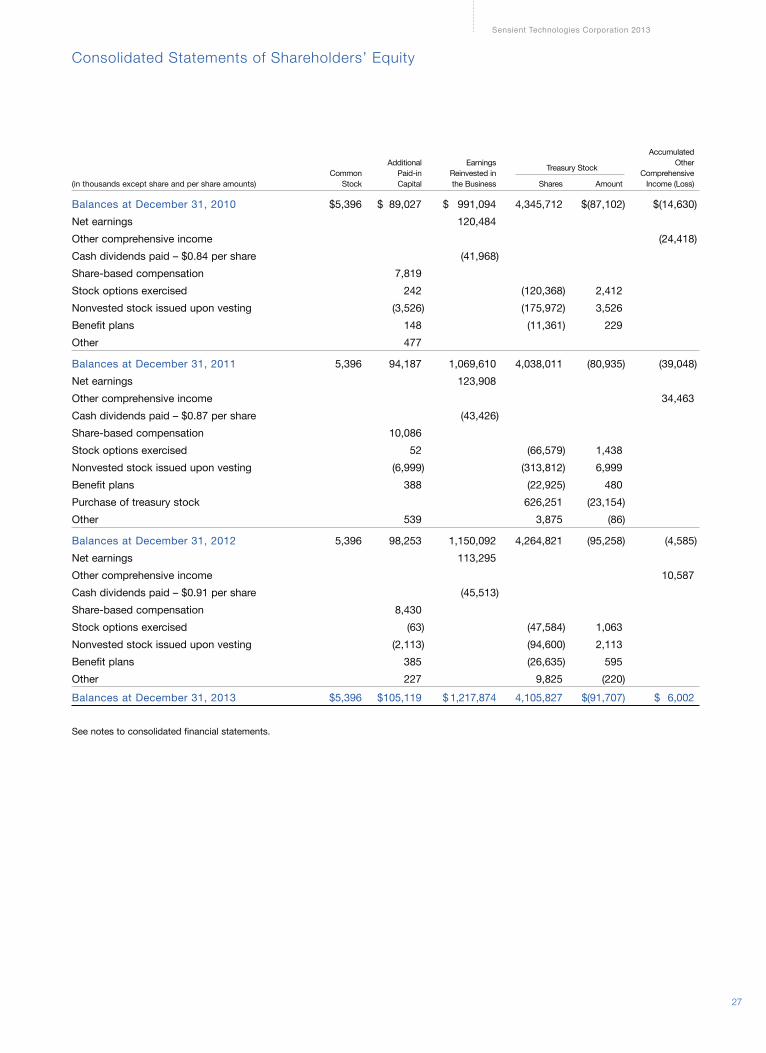
Consolidated Statements of Shareholders’ Equity
Accumulated Additional Earnings Other Common Paid-in Reinvested in Comprehensive(in thousands except share and per share amounts) Stock Capital the Business Shares Amount Income (Loss)
Balances at December 31, 2010 $5,396 $ 89,027 $ 991,094 4,345,712 $(87,102) $(14,630)Net earnings 120,484 Other comprehensive income (24,418)Cash dividends paid – $0.84 per share (41,968) Share-based compensation 7,819 Stock options exercised 242 (120,368) 2,412Nonvested stock issued upon vesting (3,526) (175,972) 3,526Benefit plans 148 (11,361) 229Other 477
Balances at December 31, 2011 5,396 94,187 1,069,610 4,038,011 (80,935) (39,048)Net earnings 123,908 Other comprehensive income 34,463 Cash dividends paid – $0.87 per share (43,426) Share-based compensation 10,086 Stock options exercised 52 (66,579) 1,438Nonvested stock issued upon vesting (6,999) (313,812) 6,999Benefit plans 388 (22,925) 480Purchase of treasury stock 626,251 (23,154)Other 539 3,875 (86)
Balances at December 31, 2012 5,396 98,253 1,150,092 4,264,821 (95,258) (4,585)Net earnings 113,295 Other comprehensive income 10,587Cash dividends paid – $0.91 per share (45,513) Share-based compensation 8,430 Stock options exercised (63) (47,584) 1,063Nonvested stock issued upon vesting (2,113) (94,600) 2,113 Benefit plans 385 (26,635) 595 Other 227 9,825 (220) Balances at December 31, 2013
See notes to consolidated financial statements.
Treasury Stock
28
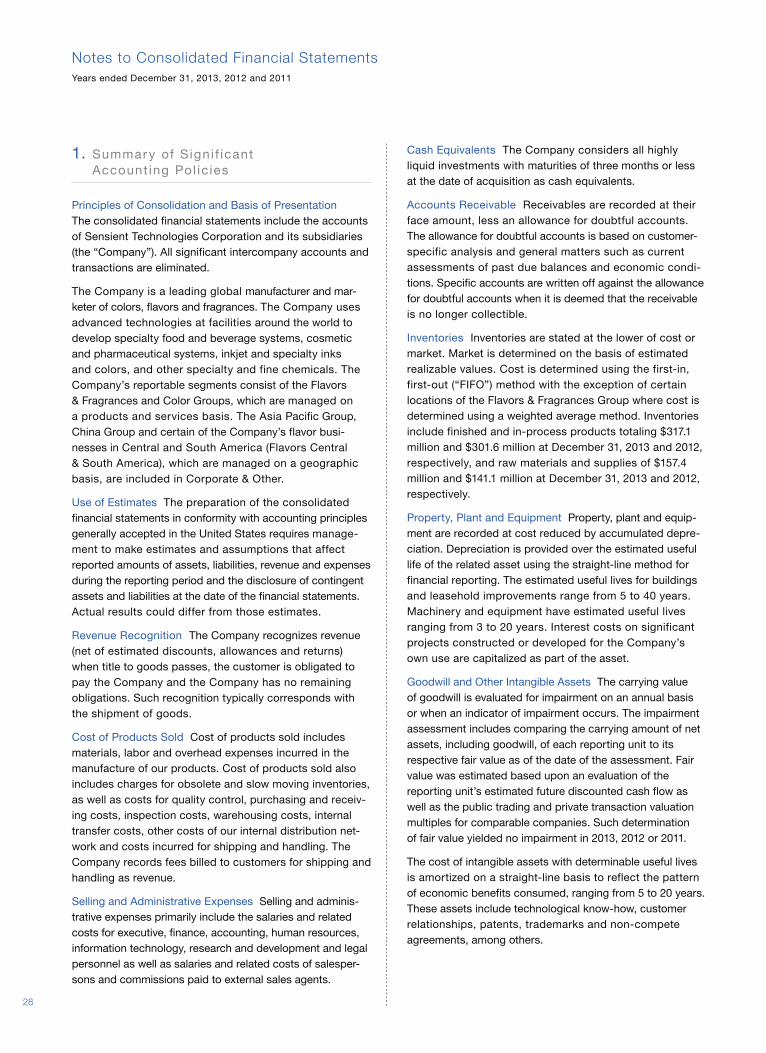
Notes to Consolidated Financial Statements Years ended December 31, 2013, 2012 and 2011
1. Summar y of S igni f icant Account ing Pol ic ies
Principles of Consolidation and Basis of Presentation The consolidated financial statements include the accounts of Sensient Technologies Corporation and its subsidiaries (the “Company”). All significant intercompany accounts and transactions are eliminated.
The Company is a leading global manufacturer and mar-keter of colors, flavors and fragrances. The Company uses advanced technologies at facilities around the world to develop specialty food and beverage systems, cosmetic and pharmaceutical systems, inkjet and specialty inks and colors, and other specialty and fine chemicals. The Company’s reportable segments consist of the Flavors & Fragrances and Color Groups, which are managed on a products and services basis. The Asia Pacific Group, China Group and certain of the Company’s flavor busi-nesses in Central and South America (Flavors Central & South America), which are managed on a geographic basis, are included in Corporate & Other.
Use of Estimates The preparation of the consolidated financial statements in conformity with accounting principles generally accepted in the United States requires manage-ment to make estimates and assumptions that affect reported amounts of assets, liabilities, revenue and expenses during the reporting period and the disclosure of contingent assets and liabilities at the date of the financial statements. Actual results could differ from those estimates.
Revenue Recognition The Company recognizes revenue (net of estimated discounts, allowances and returns) when title to goods passes, the customer is obligated to pay the Company and the Company has no remaining obligations. Such recognition typically corresponds with the shipment of goods.
Cost of Products Sold Cost of products sold includes materials, labor and overhead expenses incurred in the manufacture of our products. Cost of products sold also includes charges for obsolete and slow moving inventories, as well as costs for quality control, purchasing and receiv-ing costs, inspection costs, warehousing costs, internal transfer costs, other costs of our internal distribution net-work and costs incurred for shipping and handling. The Company records fees billed to customers for shipping and handling as revenue.
Selling and Administrative Expenses Selling and adminis-trative expenses primarily include the salaries and related costs for executive, finance, accounting, human resources, information technology, research and development and legal personnel as well as salaries and related costs of salesper-sons and commissions paid to external sales agents.
Cash Equivalents The Company considers all highly liquid investments with maturities of three months or less at the date of acquisition as cash equivalents.
Accounts Receivable Receivables are recorded at their face amount, less an allowance for doubtful accounts. The allowance for doubtful accounts is based on customer-specific analysis and general matters such as current assessments of past due balances and economic condi-tions. Specific accounts are written off against the allowance for doubtful accounts when it is deemed that the receivable is no longer collectible.
Inventories Inventories are stated at the lower of cost or market. Market is determined on the basis of estimated realizable values. Cost is determined using the first-in, first-out (“FIFO”) method with the exception of certain locations of the Flavors & Fragrances Group where cost is determined using a weighted average method. Inventories include finished and in-process products totaling $317.1 million and $301.6 million at December 31, 2013 and 2012, respectively, and raw materials and supplies of $157.4 million and $141.1 million at December 31, 2013 and 2012, respectively.
Property, Plant and Equipment Property, plant and equip-ment are recorded at cost reduced by accumulated depre-ciation. Depreciation is provided over the estimated useful life of the related asset using the straight-line method for financial reporting. The estimated useful lives for buildings and leasehold improvements range from 5 to 40 years. Machinery and equipment have estimated useful lives ranging from 3 to 20 years. Interest costs on significant projects constructed or developed for the Company’s own use are capitalized as part of the asset.
Goodwill and Other Intangible Assets The carrying value of goodwill is evaluated for impairment on an annual basis or when an indicator of impairment occurs. The impairment assessment includes comparing the carrying amount of net assets, including goodwill, of each reporting unit to its respective fair value as of the date of the assessment. Fair value was estimated based upon an evaluation of the reporting unit’s estimated future discounted cash flow as well as the public trading and private transaction valuation multiples for comparable companies. Such determination of fair value yielded no impairment in 2013, 2012 or 2011.
The cost of intangible assets with determinable useful lives is amortized on a straight-line basis to reflect the pattern of economic benefits consumed, ranging from 5 to 20 years. These assets include technological know-how, customer relationships, patents, trademarks and non-compete agreements, among others.

29
Sensient Technologies Corporation 2013
Impairment of Long-lived Assets The Company reviews long-lived assets for impairment whenever events or changes in business circumstances indicate that the carry-ing amount of the assets may not be fully recoverable. The Company performs undiscounted cash flow analyses to determine if potential impairment exists. If impairment is determined to exist, any related impairment loss is calcu-lated based on the difference between fair value and carry-ing value. Impairment losses were recorded as a result of the Company’s 2013 restructuring program. See Note 12, Restructuring Charges, for additional information.
Financial Instruments The Company may use derivative financial instruments for the purpose of hedging currency and interest rate exposures which exist as part of ongoing business operations. As a policy, the Company does not engage in speculative or leveraged transactions, nor does the Company hold or issue financial instruments for trading purposes.
Hedge effectiveness is determined by how closely the changes in the fair value of the hedging instrument offset the changes in the fair value or cash flows of the hedged item. Hedge accounting is permitted only if the hedging relation-ship is expected to be highly effective at the inception of the transaction and on an ongoing basis. Any ineffective portions are recognized in earnings immediately.
Interest Rate Hedging The Company is exposed to interest rate risk through its corporate borrowing activities. The objective of the Company’s interest rate risk management activities is to manage the levels of the Company’s fixed and floating interest rate exposure to be consistent with the Company’s preferred mix. The interest rate risk management program may include entering into interest rate swaps, which qualify as fair value hedges, when there is a desire to modify the Company’s exposure to interest rates. Gains or losses on fair value hedges are recognized in earnings, net of gains and losses on the fair value of the hedged instruments.
Cash Flow Hedges The primary objectives of the foreign exchange risk management activities are to understand and mitigate the impact of potential foreign exchange fluctua-tions on the Company’s financial results and its economic well-being. Generally, these risk management transactions involve the use of foreign currency derivatives to protect against exposure resulting from recorded accounts receiv-able and payable. The Company may utilize forward exchange contracts, generally with maturities of less than 12 months, which qualify as cash flow hedges. These foreign exchange contracts are intended to offset the effect of exchange rate fluctuations on recorded intercompany receivables and payables. Gains and losses on these instruments are deferred in accumulated other comprehen-sive income (loss) (“OCI”) until the underlying transaction is recognized in earnings.
The Company’s existing cash flow hedges are highly effective. As a result, any current impact on earnings due to cash flow hedge ineffectiveness is immaterial.
Net Investments Hedging The Company may enter into foreign-denominated debt to be used as a non-derivative instrument to hedge the Company’s net investment in foreign subsidiaries. The change in the carrying amount of the foreign-denominated debt on the Company’s books, attributable to changes in the spot foreign exchange rate, is a hedge of the net investment in its foreign subsidiaries. Changes in the fair value of debt designated as a net investment hedge are recorded in foreign currency translation in OCI.
Commodity Purchases The Company purchases certain commodities in the normal course of business that result in physical delivery of the goods and, hence, are excluded from Accounting Standards Codification (“ASC”) 815, Derivatives and Hedging.
Translation of Foreign Currencies For all significant foreign operations, the functional currency is the local currency. Assets and liabilities of foreign operations are translated into U.S. dollars at current exchange rates. Revenue and expense accounts are translated into U.S. dollars at average exchange rates prevailing during the year. Adjustments resulting from the translation of foreign accounts into U.S. dollars are recorded in foreign cur-rency translation in OCI. Transaction gains and losses that occur as a result of transactions denominated in non-functional currencies are included in earnings and were not significant during the three-year period ended December 31, 2013.
Share-Based Compensation Share-based compensation expense is recognized during the vesting period of each award as summarized in Note 6, Share-Based Compensation.
Income Taxes The Company recognizes a current tax liability or asset for the estimated taxes payable or refund-able on tax returns for the current year and a deferred tax liability or asset for the estimated future tax effects attrib-utable to temporary differences and carryforwards. The measurement of current and deferred tax liabilities and assets is based on provisions of enacted tax law. Deferred tax assets are reduced, if necessary, by the amount of any tax benefits for which the utilization of the asset is not considered likely.
Earnings Per Share The difference between basic and diluted earnings per share (“EPS”) is the dilutive effect of stock options and nonvested stock. Diluted EPS assumes that nonvested stock has vested and all dilutive stock options, for which the average market price exceeds the exercise price (in-the-money), are exercised. Stock options for which the exercise price exceeds the average

30
market price (out-of-the-money) have an anti-dilutive effect on EPS, and accordingly, are excluded from the calculation. Weighted-average common shares for the computation of EPS were:
(in thousands) 2013 2012 2011
Basic weighted-average shares outstanding 49,755 49,596 49,746Diluted weighted-average shares outstanding 49,934 49,822 49,937
In 2013, 2012 and 2011 there were no anti-dilutive stock options. All earnings per share amounts are presented on a diluted basis unless otherwise noted.
Accumulated Other Comprehensive Income (Loss) Accumulated OCI is composed primarily of foreign cur-rency translation, pension liability and unrealized gains or losses on cash flow hedges. See Note 8, Accumulated Other Comprehensive Income, for additional information.
Research and Development Research and development costs are recorded in selling and administrative expenses in the year they are incurred. Research and development costs were $34.5 million, $34.7 million and $33.2 million during the years ended December 31, 2013, 2012 and 2011, respectively.
Advertising Advertising costs are recorded in selling and administrative expenses as they are incurred. Advertising costs were $1.6 million, $2.2 million and $2.4 million during the years ended December 31, 2013, 2012 and 2011, respectively.
Environmental Liabilities The Company records liabilities related to environmental remediation obligations when estimated future expenditures are probable and reasonably estimable. Such accruals are adjusted as further information becomes available or as circumstances change. Estimated future expenditures are discounted to their present value when the timing and amount of future cash flows are fixed and readily determinable. Recoveries of remediation costs from other parties, if any, are recognized as assets when their receipt is assured.
Subsequent Events The Company performed an evaluation of subsequent events through the date these financial state-ments were issued and no such events were identified.
New Pronouncements On January 1, 2013, the Company adopted ASU No. 2013-02, Comprehensive Income (Topic 220): Reporting of Amounts Reclassified Out of Accumulated Other Comprehensive Income, which requires companies to report the effect on the line items for signifi-cant items reclassified out of other comprehensive income to net income, prospectively. The Company has included this disclosure in Note 8 of these Consolidated Financial Statements. The adoption of this ASU had no impact on the Company’s financial condition or results of operations.
On January 1, 2013, the Company adopted ASU No. 2012-02, Intangibles – Goodwill and Other (Topic 350): Testing Indefinite-Lived Intangible Assets for Impairment. This ASU gives companies the option to perform a qualitative assessment to determine whether further indefinite-lived intangible asset impairment testing is necessary. If, as a result of the qualitative assessment, it is determined that it is more likely than not that an indefinite-lived intangible asset is impaired, the quantitative impairment test is required. Otherwise no further testing is required. The adoption of this ASU had no impact on the Company’s financial condition or results of operations.
2. Acquis i t ions
There were no acquisitions during 2013 and 2012.
In 2011, the Company acquired the remaining outstanding stock of Les Colorants Wackherr do Brasil (“Les Colorants”), a distributor of cosmetic ingredients in Brazil, for $4.6 million, which is net of the cash acquired.
Prior to the acquisition, the Company owned 50% of Les Colorants, a non-controlling interest. ASC 805, Business Combinations, requires that upon acquiring a controlling interest, the acquirer remeasure its previously held interest in the acquiree at its acquisition date fair value and recognize the gain or loss in earnings. The Company revalued its previ-ously held interest in Les Colorants using a market approach and recognized a pre-tax gain of $3.6 million in earnings in the fourth quarter of 2011, included in selling and administra-tive expense in the Corporate & Other segment in the Consolidated Statement of Earnings. There is no tax impact of the gain. The final allocation of the purchase price for Les Colorants combined with the revaluation of the previously held interest resulted in goodwill and intangibles of $8.7 mil-lion. This acquisition has been accounted for as a purchase and the results of the entity’s full operations have been included in the consolidated financial statements in the Color segment since the date of acquisition.
Also in 2011, the Company completed the acquisition of the remaining outstanding stock of LCW Polska, a cos-
Poland. Prior to the acquisition, the Company owned 75% of LCW Polska. The acquisition is not material to the Company’s consolidated financial statements.
3. Goodwi l l and Intangible Assets
At December 31, 2013 and 2012, goodwill is the only intangible asset that is not subject to amortization. The following table summarizes intangible assets with determinable useful lives by major category as of December 31, 2013 and 2012:
Notes to Consolidated Financial Statements (continued) Years ended December 31, 2013, 2012 and 2011

31
Sensient Technologies Corporation 2013
4. Debt
Long-term Debt Long-term debt consisted of the following unsecured obligations at December 31:
(in thousands) 2013 20123.66% senior notes due November 2023 $ 75,000 $ 3.06% Euro-denominated senior notes due November 2023 52,566 4.47% senior notes due November 2018 25,000 25,0004.14% senior notes due November 2017 25,000 25,0004.91% senior notes due through May 2017 99,000 110,0003.77% senior notes due November 2016 25,000 25,0007.31% senior notes due November 2013 25,0005.85% Euro-denominated senior notes due November 2013 25,508Long-term revolving loan agreement 43,982 95,419Various other notes 2,576 3,052 348,124 333,979Less current maturities Total long-term debt $348,124 $333,979
In April 2013, the Company entered into an agreement to issue $75 million and €38 million in ten-year, fixed-rate, senior notes at fixed coupon rates of 3.66% and 3.06%, respectively. These notes were issued in November 2013 and proceeds have been used to repay maturing notes and bank debt.
The Company has a $350 million revolving loan facility that will mature in April 2016. Interest rates on borrowings
under the credit facility are at LIBOR plus a margin based on the Company’s leverage ratio. The credit facility is used for liquidity needs.
The borrowings under the long-term revolving loan agreement had an average interest rate of 1.54% and 1.67% for the years ended December 31, 2013 and 2012, respectively.
The aggregate amounts of contractual maturities on long-term debt each year for the five years subsequent to December 31, 2013, are as follows: 2014, $12.4 million; 2015, $11.9 million; 2016, $80.3 million; 2017, $91.0 million; and 2018, $25.0 million.
The Company has approximately $12.4 million of long-term debt that matures in 2014. It is the Company’s intention to refinance these maturities under the long-term revolving loan agreement and accordingly, that maturing debt has been classified as long-term debt in the Consolidated Balance Sheet.
The Company has $299.7 million available under the revolving loan agreement and $41.4 million available under other lines of credit from several banks at December 31, 2013.
Substantially all of the senior loan agreements contain restrictions concerning interest coverage, borrowings, investments and tangible net worth amounts. The Company is in compliance with all of these restrictions at December 31, 2013. The following table summarizes the Company’s most restrictive loan covenants calculated in accordance with the applicable agreements as of December 31, 2013:
Weighted (in thousands except Average 2013 2012weighted average Amortization Accumulated Accumulatedamortization years) Years Cost Amortization Cost Amortization
Technological know-how 20.0 $ 8,606 Customer relationships 20.0 7,944 (4,359) 7,871 (3,866)Patents, trademarks, non-compete agreements and other 18.8 9,630 (5,947) 9,617 (5,645)Total finite-lived intangibles 19.6 $26,180 $(15,634) $25,931 $(14,353)
Amortization of intangible assets was $1.3 million in 2013, $1.4 million in 2012 and $1.3 million in 2011. Estimated amor-tization expense each year for the five years subsequent to December 31, 2013, is $1.3 million in 2014 and $1.2 million in each year from 2015 through 2018.
The changes in goodwill for the years ended December 31, 2013 and 2012, by reportable business segment, were as follows:
(in thousands) Flavors & Corporate
Fragrances Color & Other ConsolidatedBalance as of December 31, 2011 $132,692 $307,379 $4,294 $444,365Currency translation impact 3,092 4,271 (410) 6,953Balance as of December 31, 2012 $135,784 $311,650 $3,884 $451,318Currency translation impact 853 5,673 (575) 5,951Balance as of December 31, 2013 $136,637 $317,323 $3,309 $457,269

32
(dollars in thousands) Actual Required
Debt to EBITDA (Maximum) 1.40 3.50Net Worth (Minimum) $1,242,684 $625,000Interest Coverage (Minimum) 8.01 2.00
The Company has stand-by and trade letters of credit out-standing of $6.3 million and $7.5 million as of December 31, 2013 and 2012, respectively.
Short-term Borrowings The Company’s short-term borrow-ings consisted of the following items at December 31:
(in thousands) 2013 2012
Uncommitted loans $16,950Loans of foreign subsidiaries 2,450 3,098Total $20,048
The weighted-average interest rates on short-term borrowings were 2.16% and 1.98% at December 31, 2013 and 2012, respectively.
5. Der ivat ive Instruments and Hedging Act iv i t y
The Company may use derivative instruments for the purpose of hedging currency, commodity and interest rate exposures, which exist as part of ongoing business opera-tions. As a policy, the Company does not engage in specula-tive or leveraged transactions, nor does the Company hold or issue financial instruments for trading purposes. Hedge effectiveness is determined by how closely the changes in the fair value of the hedging instrument offset the changes in the fair value or cash flows of the hedged transaction. Hedge accounting, which generally results in the deferral of deriva-tive gains and losses until such time as the underlying trans-action is recognized in net earnings, is permitted only if the hedging relationship is expected to be highly effective at the inception of the transaction and on an ongoing basis. Any ineffective portions are recognized in earnings immediately.
The Company manages its exposure to foreign exchange risk by the use of forward exchange contracts to reduce the effect of fluctuating foreign currencies on short-term foreign currency denominated intercompany transactions, non-functional currency raw material purchases, non-functional currency sales and other known foreign currency exposures. These forward exchange contracts generally have maturities of less than twelve months. The Company also uses certain debt denominated in foreign currencies to manage the Company’s net asset positions of its foreign subsidiaries. The Company’s primary hedging activities and their account-ing treatment are summarized below:
Forward Exchange Contracts The forward exchange con-tracts that have been designated as hedges are accounted for as cash flow hedges. The Company had $29.6 million
and $18.9 million of forward exchange contracts, designated as hedges, outstanding as of December 31, 2013 and 2012, respectively. Due to the short-term nature of these con-tracts, the results of these transactions are not material to the financial statements. In addition, the Company utilizes forward exchange contracts that are not designated as cash flow hedges and the results of these transactions are also not material to the financial statements.
Net Investment Hedges The Company has certain debt denominated in Euros and Swiss Francs. These debt instru-ments have been designated as partial hedges of the Company’s Euro and Swiss Franc net asset positions. Changes in the fair value of this debt attributable to changes in the spot foreign exchange rate are recorded in foreign cur-rency translation in OCI. As of December 31, 2013 and 2012, the total value of the Company’s Euro and Swiss Franc debt designated as net investment hedges was $96.5 million and $55.0 million, respectively. For the years ended December 31, 2013 and 2012, the impact of foreign exchange rates on these debt instruments has increased debt by $4.0 million and $1.3 million, respectively, and these amounts have been recorded as foreign currency translation in OCI.
Concentrations of Credit Risk Counterparties to forward exchange contracts consist of large international financial institutions. While these counterparties may expose the Company to potential losses due to the credit risk of non-performance, losses are not anticipated. Concentrations of credit risk with respect to trade accounts receivable are lim-ited by the large number of customers, generally short pay-ment terms and their dispersion across geographic areas.
6. Share-Based Compensat ion
The Company has various stock plans under which employ-ees and directors may be granted nonvested stock which vests over a time period, except as noted below to those employees who have reached age 65 and vest immediately. The 2007 Stock Plan also allows for the granting of non-qual-ified stock options or incentive stock options. Upon vesting, the stock options allow the participant to purchase common stock at 100% of the market price on the day the options were granted. No options were granted in 2013, 2012 or 2011. As of December 31, 2013, there were 1.2 million shares available to be granted as nonvested stock under existing stock plans.
Stock options became exercisable over a three-year vesting period, or earlier upon retirement, and expire 10 years from the date of grant. Expense for stock options was recog-nized on a straight-line basis over three years from the date of grant or over the period from the date of grant until the participant was retirement-eligible, whichever was less. Treasury shares are issued for nonvested stock awards and for the exercise of stock options.
Notes to Consolidated Financial Statements (continued) Years ended December 31, 2013, 2012 and 2011
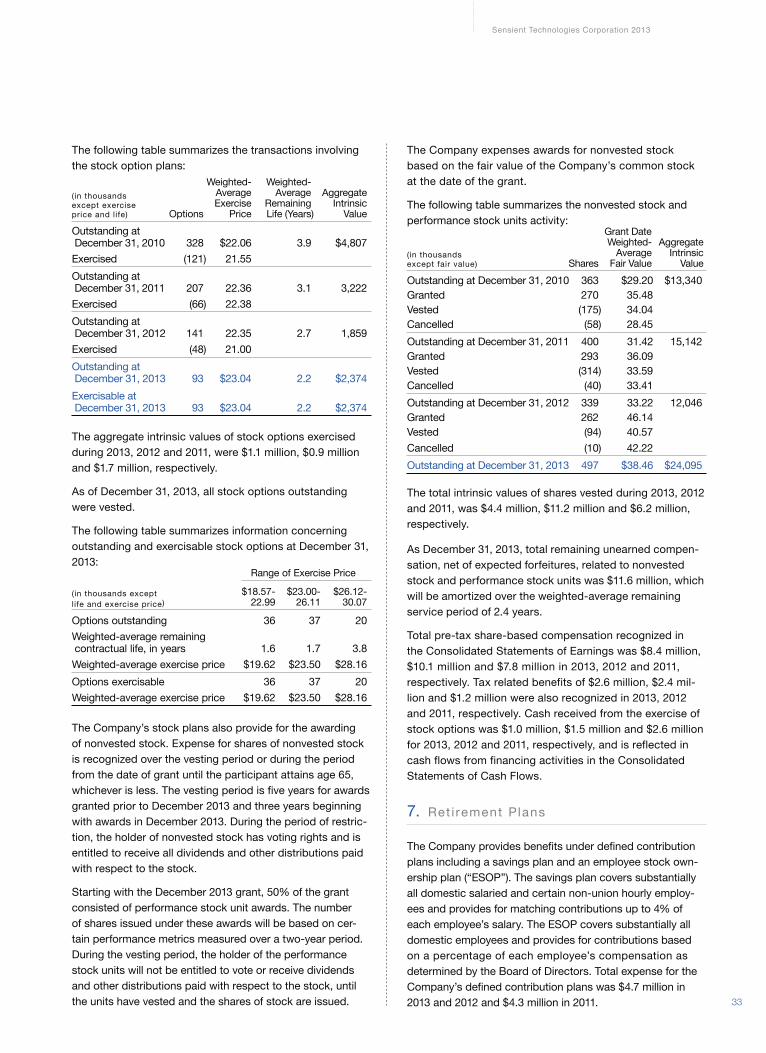
33
Sensient Technologies Corporation 2013
The following table summarizes the transactions involving the stock option plans: Weighted- Weighted- (in thousands Average Average Aggregate except exercise Exercise Remaining Intrinsic price and life) Options Price Life (Years) ValueOutstanding at
Exercised (121) 21.55 Outstanding at
Exercised (66) 22.38 Outstanding at
Exercised (48) 21.00Outstanding at
Exercisable at
The aggregate intrinsic values of stock options exercised during 2013, 2012 and 2011, were $1.1 million, $0.9 million and $1.7 million, respectively.
As of December 31, 2013, all stock options outstanding were vested.
The following table summarizes information concerning out standing and exercisable stock options at December 31, 2013: Range of Exercise Price
(in thousands except $18.57- $23.00- $26.12- life and exercise price) 22.99 26.11 30.07
Options outstanding 36 37 20Weighted-average remaining
Weighted-average exercise price $19.62 $23.50 $28.16Options exercisable 36 37 20Weighted-average exercise price $19.62 $23.50 $28.16
The Company’s stock plans also provide for the awarding of nonvested stock. Expense for shares of nonvested stock is recognized over the vesting period or during the period from the date of grant until the participant attains age 65, whichever is less. The vesting period is five years for awards granted prior to December 2013 and three years beginning with awards in December 2013. During the period of restric-tion, the holder of nonvested stock has voting rights and is entitled to receive all dividends and other distributions paid with respect to the stock.
Starting with the December 2013 grant, 50% of the grant consisted of performance stock unit awards. The number of shares issued under these awards will be based on cer-tain performance metrics measured over a two-year period. During the vesting period, the holder of the performance stock units will not be entitled to vote or receive dividends and other distributions paid with respect to the stock, until the units have vested and the shares of stock are issued.
The Company expenses awards for nonvested stock based on the fair value of the Company’s common stock at the date of the grant.
The following table summarizes the nonvested stock and performance stock units activity: Grant Date Weighted- Aggregate (in thousands Average Intrinsic except fair value) Shares Fair Value ValueOutstanding at December 31, 2010 363 $29.20 $13,340Granted 270 35.48Vested (175) 34.04Cancelled (58) 28.45Outstanding at December 31, 2011 400 31.42 15,142Granted 293 36.09 Vested (314) 33.59Cancelled (40) 33.41Outstanding at December 31, 2012 339 33.22 12,046Granted 262 46.14Vested (94) 40.57Cancelled (10) 42.22Outstanding at December 31, 2013 497 $38.46 $24,095
The total intrinsic values of shares vested during 2013, 2012 and 2011, was $4.4 million, $11.2 million and $6.2 million, respectively.
As December 31, 2013, total remaining unearned compen-sation, net of expected forfeitures, related to nonvested stock and performance stock units was $11.6 million, which will be amortized over the weighted-average remaining service period of 2.4 years.
Total pre-tax share-based compensation recognized in the Consolidated Statements of Earnings was $8.4 million, $10.1 million and $7.8 million in 2013, 2012 and 2011, respectively. Tax related benefits of $2.6 million, $2.4 mil-lion and $1.2 million were also recognized in 2013, 2012 and 2011, respectively. Cash received from the exercise of stock options was $1.0 million, $1.5 million and $2.6 million for 2013, 2012 and 2011, respectively, and is reflected in cash flows from financing activities in the Consolidated Statements of Cash Flows.
7. Ret i rement Plans
The Company provides benefits under defined contribution plans including a savings plan and an employee stock own-ership plan (“ESOP”). The savings plan covers substantially all domestic salaried and certain non-union hourly employ-ees and provides for matching contributions up to 4% of each employee’s salary. The ESOP covers substantially all domestic employees and provides for contributions based on a percentage of each employee’s compensation as determined by the Board of Directors. Total expense for the Company’s defined contribution plans was $4.7 million in 2013 and 2012 and $4.3 million in 2011.

34
Although the Company intends for these defined contribu-tion plans to be the primary retirement benefit for most employees, the Company also has several defined benefit plans. The funded status of the defined benefit plans was as follows at December 31:
(in thousands) 2013 2012
Benefit obligation at beginning of year $76,957 $ 67,211Service cost 3,260 2,583Interest cost 2,557 2,659Foreign currency exchange rate changes (703) 799Benefits paid (5,194) (3,045)Actuarial (gain) loss (4,295) 6,750Benefit obligation at end of year 72,582 76,957Plan assets at beginning of year 35,141 30,969Company contributions 5,701 4,075Foreign currency exchange rate changes (539) 973Benefits paid (5,258) (3,045)Actual gain on plan assets 2,077 2,169Plan assets at end of year 37,122 35,141Funded status $(35,460) $(41,816)Accumulated benefit obligation $ 68,391 $ 70,230
Amounts recognized in the Consolidated Balance Sheets at
(in thousands) 2013 2012
$(40,350) $(52,825)Prepaid expenses and other current assets 4,890 11,009Net liability $(35,460) $(41,816)
Components of annual benefit cost:
(in thousands) 2013 2012 2011
Service cost $3,260 $2,583 $2,419Interest cost 2,557 2,659 2,778Expected return on plan assets (1,689) (1,428) (1,520)Amortization of prior service cost 172 1,971 3,112Recognized actuarial loss 3,203 799 1,388Settlement expense 1,177 – –Defined benefit expense $8,680 $6,584 $8,177
Weighted-average liability assumptions as of December 31: 2013 2012
Discount rate 3.91% 3.27%Expected return on plan assets 5.12% 4.76%Rate of compensation increase 4.59% 4.01%
Weighted-average cost assumptions for the year ended December 31: 2013 2012
Discount rate 3.27% 4.27%Expected return on plan assets 4.76% 5.00%Rate of compensation increase 4.01% 4.11%
The aggregate amounts of benefits expected to be paid from defined benefit plans in each of the next five years sub-sequent to December 31, 2013, which include employees’ expected future service, are as follows: 2014, $21.7 million; 2015, $13.0 million; 2016, $2.9 million; 2017, $2.4 million; 2018, $2.2 million; and $18.3 million in total for the years 2019 through 2023.
The Company expects to contribute $22.9 million to defined benefit plans in 2014.
Amounts at December 31 in accumulated other comprehen-sive income were as follows:(in thousands) 2013 2012
Prior service cost $1,182 $ 1,362Unrecognized net actuarial loss 7,944 17,031
The pension adjustments, net of tax, recognized in OCI, were as follows:(in thousands) 2013 2012 2011
Net actuarial gain (loss) arising during the period $3,180 $(3,947) $885 Amortization of actuarial loss, included in defined benefit expense 2,006 526 866Amortization of prior service cost, included in defined benefit expense 108 1,205 1,901Pension adjustment, net of tax $5,294 $(2,216) $3,652
The estimated prior service cost and actuarial gain for the defined benefit plans that will be amortized from accumulated other comprehensive loss into periodic benefit cost during 2014 are $0.2 million and $0.6 million, respectively.
The investment objectives and target allocations for the Company’s pension plans related to the assets of the plans are reviewed on a regular basis. The investment objectives for the pension assets are to maximize the return on assets while maintaining an overall level of risk appropriate for a retirement fund and ensuring the availability of funds for the payment of retirement benefits. The levels of risk assumed by the pension plans are determined by market conditions, the rate of return expectations and the liquidity requirements of each pension plan. The actual asset allocations of each pension plan are reviewed on a regular basis to ensure that they are in line with the target allocations.
The Company is required to categorize pension plan assets based on the following fair value hierarchy:Level 1: Observable inputs that reflect quoted prices (unadjusted) for identical assets or liabilities in active markets.Level 2: Inputs other than quoted prices included in Level 1 that are observable for the asset or liability through corrobora-tion with observable market data. Level 3: Unobservable inputs that reflect the reporting entity’s own assumptions.
Notes to Consolidated Financial Statements (continued) Years ended December 31, 2013, 2012 and 2011

35
Sensient Technologies Corporation 2013
8. Accumulated Other Comprehensive Income
The following tables summarize the changes in Accumulated Other Comprehensive Income (Loss) (“OCI”) for 2013:
Foreign Cash Flow Pension Currency (in thousands) Hedges Items Items TotalBalance as of
Other comprehensive income before
from OCI 78 2,114 2,192Balance as of December 31, 2013 $ (99) $ (6,768) $12,869 $ 6,002(a) Cash Flow Hedges and Pension Items are net of tax.
See Note 7, Retirement Plans, for more information on the pension items reclassified out of OCI and into Selling and Administrative expenses in the Statement of Earnings during 2013. See Note 5, Derivative Instruments and Hedging Activity, for additional information on the Company’s cash flow hedges.
9. Income Taxes
The provision for income taxes was as follows:
(in thousands) 2013 2012 2011
Currently payable: $21,252 $22,394 $28,480
3,065 3,024 2,84524,781 22,065 22,713
49,098 47,483 54,038Deferred (benefit) expense:
(5,125) 170 (5,669)502 603 (274)
(1,555) 2,143 2,805 (6,178) 2,916 (3,138)Income taxes $42,920 $50,399 $50,900
The tax effects of temporary differences that give rise to significant portions of deferred tax assets and liabilities consisted of the following:
(in thousands) 2013 2012
Deferred tax assets: Benefit plans $17,375 Liabilities and reserves 11,499 9,140 Operating loss and credit carryovers 51,292 48,441 Other 17,151 16,096 Gross deferred tax assets 101,090 91,052 Valuation allowance (43,048) (41,049) Deferred tax assets 58,042 50,003Deferred tax liabilities: Property, plant and equipment (21,139) (19,430) Other assets (1,411) (2,784) Other (31,741) (26,668) Deferred tax liabilities (54,291) (48,882)Net deferred tax assets
Fair Value Measurements at Fair Value Measurements at Fair Value December 31, 2013 Fair Value December 31, 2012 as of Using Fair Value Hierarchy as of Using Fair Value Hierarchy December 31, December 31, (in thousands) 2013 Level 1 Level 2 Level 3 2012 Level 1 Level 2 Level 3
Equity Funds Domestic
International Fixed
Total assets
(a) (a)
The following table presents the Company’s pension plan assets by asset category as of December 31, 2013 and 2012:
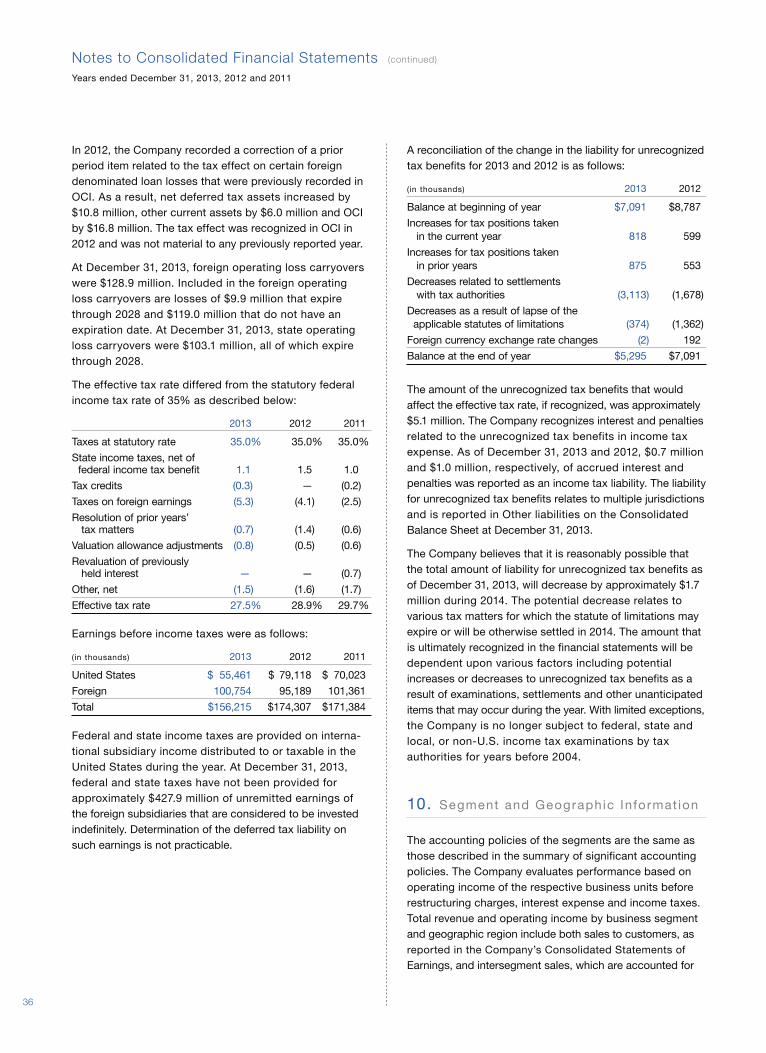
36
In 2012, the Company recorded a correction of a prior period item related to the tax effect on certain foreign denominated loan losses that were previously recorded in OCI. As a result, net deferred tax assets increased by $10.8 million, other current assets by $6.0 million and OCI by $16.8 million. The tax effect was recognized in OCI in 2012 and was not material to any previously reported year.
At December 31, 2013, foreign operating loss carryovers were $128.9 million. Included in the foreign operating loss carryovers are losses of $9.9 million that expire through 2028 and $119.0 million that do not have an expiration date. At December 31, 2013, state operating loss carryovers were $103.1 million, all of which expire through 2028.
The effective tax rate differed from the statutory federal income tax rate of 35% as described below:
2013 2012 2011
Taxes at statutory rate 35.0% 35.0% 35.0%State income taxes, net of federal income tax benefit 1.1 1.5 1.0Tax credits Taxes on foreign earnings (5.3) (4.1) (2.5)Resolution of prior years’ tax matters (0.7) (1.4) (0.6)Valuation allowance adjustments (0.8) (0.5) (0.6)Revaluation of previously held interest Other, net (1.5) (1.6) (1.7)Effective tax rate 27.5% 28.9% 29.7%
Earnings before income taxes were as follows:
(in thousands) 2013 2012 2011
United States $ 55,461 Foreign 100,754 95,189 101,361Total $156,215 $174,307 $171,384
Federal and state income taxes are provided on interna-tional subsidiary income distributed to or taxable in the United States during the year. At December 31, 2013, federal and state taxes have not been provided for approximately $427.9 million of unremitted earnings of the foreign subsidiaries that are considered to be invested indefinitely. Determination of the deferred tax liability on such earnings is not practicable.
A reconciliation of the change in the liability for unrecognized tax benefits for 2013 and 2012 is as follows:
(in thousands) 2013 2012
Balance at beginning of year $7,091 $8,787Increases for tax positions taken in the current year 818 599Increases for tax positions taken in prior years 875 553Decreases related to settlements with tax authorities (3,113) (1,678)Decreases as a result of lapse of the applicable statutes of limitations (374) (1,362)Foreign currency exchange rate changes (2) 192Balance at the end of year $5,295 $7,091
The amount of the unrecognized tax benefits that would affect the effective tax rate, if recognized, was approximately $5.1 million. The Company recognizes interest and penalties related to the unrecognized tax benefits in income tax expense. As of December 31, 2013 and 2012, $0.7 million and $1.0 million, respectively, of accrued interest and penalties was reported as an income tax liability. The liability for unrecognized tax benefits relates to multiple jurisdictions and is reported in Other liabilities on the Consolidated Balance Sheet at December 31, 2013.
The Company believes that it is reasonably possible that the total amount of liability for unrecognized tax benefits as of December 31, 2013, will decrease by approximately $1.7 million during 2014. The potential decrease relates to various tax matters for which the statute of limitations may expire or will be otherwise settled in 2014. The amount that is ultimately recognized in the financial statements will be dependent upon various factors including potential increases or decreases to unrecognized tax benefits as a result of examinations, settlements and other unanticipated items that may occur during the year. With limited exceptions, the Company is no longer subject to federal, state and local, or non-U.S. income tax examinations by tax authorities for years before 2004.
10. Segment and Geographic Informat ion
The accounting policies of the segments are the same as those described in the summary of significant accounting policies. The Company evaluates performance based on operating income of the respective business units before restructuring charges, interest expense and income taxes. Total revenue and operating income by business segment and geographic region include both sales to customers, as reported in the Company’s Consolidated Statements of Earnings, and intersegment sales, which are accounted for
Notes to Consolidated Financial Statements (continued) Years ended December 31, 2013, 2012 and 2011

37
Sensient Technologies Corporation 2013
at prices that approximate market prices and are eliminated in consolidation. Corporate & Other revenue consists primar-ily of flavor, fragrances and color products sold by the Asia Pacific Group, China Group and Flavors Central & South America Group.
Assets by business segment and geographic region are those assets used in the Company’s operations in each segment and geographic region. Segment assets reflect the allocation of goodwill to each segment. Corporate & Other assets consist primarily of property and investments.
Segment Information The Company determines its operating segments based on information utilized by the chief operating decision maker to allocate resources and assess performance. The Company’s reportable segments consist of Flavors & Fragrances and Color and are both managed on a products and services basis. The Company’s
Flavors & Fragrances segment produces flavor and fragrance products that impart a desired taste, texture, aroma or other characteristic to a broad range of consumer and other products. The Color segment produces natural and synthetic color systems for pharmaceuticals, foods and beverages; colors and formulations for cosmetics; and technical colors for industrial applications and digital imaging. Three addi-tional segments, Asia Pacific, China and Flavors Central & South America are managed on a geographic basis and included in Corporate & Other.
Beginning in the first quarter of 2013, the results of operations for the Company’s cosmetic and pharmaceutical businesses in Asia Pacific and China, previously reported in the Corporate & Other segment, are reported in the Color segment. Results for 2012 and 2011 have been restated to reflect this change.
Flavors & Corporate(in thousands) Fragrances Color & Other Consolidated
2013Revenue from external customers $845,672 $473,281 $148,597 $1,467,550Intersegment revenue 35,626 20,691 1,847 58,164Total revenue 881,298 493,972 150,444 1,525,714Operating income (loss) 122,410 103,601 (53,649) 172,362 Interest expense Earnings (loss) before income taxes 122,410 103,601 (69,796) 156,215Assets 897,216 790,531 182,987 1,870,734Capital expenditures 59,040 39,273 5,933 104,246Depreciation and amortization 27,458 18,664 5,894 52,016
2012Revenue from external customers $837,549 $477,385 $144,116 $1,459,050Intersegment revenue 37,732 21,825 1,464 61,021Total revenue 875,281 499,210 145,580 1,520,071Operating income (loss) 122,997 96,406 (28,195) 191,208Interest expense Earnings (loss) before income taxes 122,997 96,406 (45,096) 174,307Assets 860,395 744,200 172,048 1,776,643Capital expenditures 49,781 46,003 8,022 103,806Depreciation and amortization 27,021 15,499 5,832 48,352
2011Revenue from external customers $821,933 $476,958 $131,898 $1,430,789Intersegment revenue 35,527 19,833 1,728 57,088Total revenue 857,460 496,791 133,626 1,487,877Operating income (loss) 129,436 92,518 (31,131) 190,823Interest expense Earnings (loss) before income taxes 129,436 92,518 (50,570) 171,384Assets 803,844 699,017 151,303 1,654,164Capital expenditures 34,999 30,121 7,080 72,200Depreciation and amortization 26,743 14,125 5,231 46,099

38
Geographic Information The Company has manufacturing facilities or sales offices in North America, South America, Europe, Asia, Australia and Africa.
(in thousands) 2013 2012 2011
Revenue from external customers:North America $ 784,658 Europe 382,464 371,658 405,312Asia Pacific 191,343 199,849 190,404Other 109,085 101,624 97,919Consolidated $1,467,550
Long-lived assets:North America $531,005Europe 506,352 472,865 456,248Asia Pacific 32,148 35,891 35,151Other 11,404 12,050 11,239Consolidated $1,080,909
Sales in the United States, based on the final country of destination of the Company’s products, were $592.6 million, $598.5 million and $561.9 million in 2013, 2012 and 2011, respectively. No other country of destination exceeded 10% of consolidated sales. Total long-lived assets in the United States amounted to $389.7 million, $360.1 million and $345.1 million at December 31, 2013, 2012 and 2011, respectively.
Product Information The Company’s revenue summarized by product portfolio is as follows:(in thousands) 2013 2012 2011Traditional Flavors & Fragrances $ 744,934 Natural Ingredients 244,155 252,941 240,844Food & Beverage Colors 307,301 310,739 317,880Non-Food Colors 229,324 231,226 218,703Intersegment Revenue (58,164) (61,021) (57,088)Consolidated $1,467,550
11. Fa i r Va lue Measurements
ASC 820, Fair Value Measurements and Disclosures, defines fair value for financial assets and liabilities, establishes a framework for measuring fair value in Generally Accepted Accounting Principles (“GAAP”) and expands disclosures about fair value measurements. As of December 31, 2013 and 2012, the Company’s only assets and liabilities subject to this standard are forward contracts, investments in a money market fund and municipal bonds, and defined benefit plan assets (See Note 7, Retirement Plans, for additional infor-mation on the defined benefit plan assets). The net fair value of the forward exchange contracts based on current pricing obtained for comparable derivative products (Level 2 inputs) was an asset of $0.2 million at December 31, 2013 and was
negligible at December 31, 2012. The fair value of the invest-ments based on December 31, 2013 and 2012, market quotes (Level 1 inputs) was an asset of $19.8 million and $20.3 million, respectively.
The carrying values of the Company’s cash and cash equivalents, trade accounts receivable, accounts payable, accrued expenses and short-term borrowings approximated fair values as of December 31, 2013 and 2012.
The fair value of the Company’s long-term debt, including current maturities, is estimated using discounted cash flows based on the Company’s current incremental borrowing rates for similar types of borrowing arrangements (Level 2 inputs). The carrying value of the long-term debt at December 31, 2013 and 2012, was $348.1 million and $334.0 million, respectively. The fair value of the long-term debt at December 31, 2013 and 2012, was approximately $351.0 million and $354.4 million, respectively.
12. Restructur ing Charges
The Company recorded restructuring costs of $31.7 million ($22.0 million after tax) in 2013 related to the 2013 restructur-ing program to relocate the Flavors & Fragrances Group headquarters to Chicago, as well as a profit improvement plan across all segments of the Company.
Detail of the 2013 restructuring costs and the line items in which it was recorded in the Corporate & Other segment are as follows: Selling & Cost of (in thousands) Administrative Products Sold TotalEmployee separations $ 18,081 $ $18,081Long-lived asset impairment 4,176 Gain on asset sales (3,019) (3,019)Write-down of inventory 1,840 1,840Other costs 10,657 Total $29,895 $1,840 $31,735
The following table summarizes the 2013 restructuring costs by segment:(in thousands) 2013Flavors $22,284Color 7,065Corporate & Other 2,386Total $31,735
The Company does not expect restructuring costs in 2014 to be material.
The following table summarizes the accrual for the restructuring and other charges for the twelve months
Notes to Consolidated Financial Statements (continued) Years ended December 31, 2013, 2012 and 2011

39
Sensient Technologies Corporation 2013
ended December 31, 2013, which is recorded in Other accrued expenses: Employee Assets Related (in thousands) Separations and Other Total
Balance as of December 31, 2012 $ $ $ Restructuring costs 18,081 13,654 31,735 Gain on sale of assets 3,019 3,019Cash spent (13,505) (9,069) (22,574)Reduction of assets (6,016) (6,016)Translation adjustment (14) (14)Balance as of December 31, 2013 $ 4,562 $ 1,588 $ 6,150
In the fourth quarter of 2011, the company recorded a restructuring charge of $4.8 million ($3.7 million net of tax) related to a plan to improve the profitability and efficiency of selected operations. The restructuring charge mainly included severance and other employee separation costs. In 2012, approximately $1.8 million of payments were applied to the restructuring reserve.
13. Commitments and Cont ingencies
Leases
The Company leases certain facilities and equipment under operating lease arrangements. Aggregate minimum rental commitments at December 31, 2013, for all noncancelable operating leases with an initial lease term greater than one year for the years ending December 31 are as follows: 2014, $7.5 million; 2015, $5.3 million; 2016, $2.9 million; 2017, $1.1 million; 2018, $0.7 and $0.2 million thereafter.
Rent expense totaled $10.7 million, $10.8 million and $11.7 million during the years ended December 31, 2013, 2012 and 2011, respectively.
Commercial Litigation
Cherry Blossom Litigation
Cherry Blossom LLC, a Traverse City, Michigan contractor that had produced cherry products for the Company, ceased operations in May 2009. At the time, Cherry Blossom had physical possession of brined cherries belonging to the Company with a book value of approximately $0.5 million. Despite the Company’s demands, Cherry Blossom refused to permit the Company to take possession of the cherries for processing elsewhere.
In June 2009, the Company sued Cherry Blossom in the Circuit Court of Grand Traverse County, Michigan, seeking an order for return of the cherries. Cherry Blossom’s asset based lender, Crossroads Financial (which claimed to be owed over $1.4 million) (“Crossroads”), intervened and
claimed a senior lien on the cherries. The Circuit Court denied the Company’s request for immediate possession and permitted Cherry Blossom to retain and process the cherries. The Circuit Court later held that Crossroads had a senior lien on the cherries and was entitled to receive the proceeds from the sale of the cherries. The Circuit Court also denied the Company’s cross claims against Crossroads to recoup certain overpayments that the Company made to Cherry Blossom/Crossroads and to recoup payments made by the Company to the United States Department of Labor on Cherry Blossom’s/Crossroads’ behalf. The Company appealed these adverse decisions of the Circuit Court.
Crossroads asserted a claim against the Company for money damages in an undetermined amount. Crossroads claimed that it had a lien on all of Cherry Blossom’s accounts receivable from the Company and that the Company had performed a number of offsets against its accounts payable to Cherry Blossom in derogation of Crossroads’ rights as lienholder. The Circuit Court denied Crossroads’ claims for money damages against the Company. Crossroads appealed this adverse decision of the Circuit Court.
The Michigan Court of Appeals heard oral argument on the appeals on September 10, 2013. On October 31, 2013, the Court issued its decision affirming the trial court in all respects, including the denial of the Crossroad claim to recover over $1.4 million from the Company. The Company and Crossroads both had the right to petition the Michigan Supreme Court to review the decision of the Court of Appeals. Neither party, however, sought Supreme Court review, and the case is now concluded.
Cherry Blossom counterclaimed against the Company, alleging that Cherry Blossom had purchased exclusive rights to certain proprietary cherry processing formulas used in the Company’s cherry product. Cherry Blossom sought a preliminary injunction against the Company’s delivery of copies of the formulas to any third party. The Court denied Cherry Blossom’s motion regarding the formulas and eventually dismissed Cherry Blossom’s claims. The Company also initiated a suit against Cherry Blossom in the United States District Court for the Western District of Michigan seeking a declaratory judgment that the Company has the right to use the cherry processing formulas. Because Cherry Blossom subsequently filed a petition in bankruptcy, the Federal District Court closed the matter. This closing was for administrative purposes only and did not constitute a decision on the merits.
Christopher Hubbell, a principal of Cherry Blossom, person-ally filed a petition for bankruptcy. The Company originally

40
opposed the bankruptcy petition to the extent Hubbell sought a discharge of the Company’s alleged damages arising from his own fraudulent acts connected to Cherry Blossom’s granting of an allegedly superior interest in the Company’s cherries to Crossroads. The Company and Hubbell filed a joint motion to dismiss the Company’s claims against Hubbell without prejudice pending the Michigan state court action. The Bankruptcy Court granted the motion. Under the terms of the dismissal, if the state courts had determined that the Company was liable to Crossroads, the Company would have had 60 days to reopen the adver-sary proceeding and pursue its claims against Hubbell. Since neither the Company nor Crossroads pursued Supreme Court review and the state case is now concluded, the dismissal of the Company’s claims against Hubbell in his personal bankruptcy proceeding has become with prejudice.
Vega v. Sensient Dehydrated Flavors LLC
On January 3, 2013, Thomas Vega, a now former employee, filed (but did not serve) a Class Action Complaint in San Francisco County Superior Court against Sensient Dehydrated Flavors LLC. On February 11, 2013, Vega filed and served a First Amended Complaint (“Complaint”) against the Company and a Company supervisor. Vega alleges that the Company failed to provide alleged class members with meal periods, compensation for the alleged absence of meal periods, and accurate wage statements, in violation of the California labor code. The alleged class includes all employees paid on an hourly basis and forklift operators. The Complaint seeks damages, back wages, injunctive relief, penalties, interest, and attorneys’ fees for the members of the alleged class. The Complaint alleges that the total damages and costs “do not exceed a[n] aggregate of $4,999,999.99.”
The Complaint alleges two causes of action. The first cause of action is for “Unfair Competition.” The plaintiff’s theory is that the Company, by allegedly not complying with state wage and hour laws, had an unfair competitive advantage against other employers who were complying with those laws. The main strategic reason that plaintiffs plead this cause of action is that the statute of limitations is four years.
The second cause of action is for alleged substantive violations of the California labor code provisions governing wages, hours, and meal periods.
On March 13, 2013, the parties filed a joint stipulation and proposed order to remove the case from San Francisco County Superior Court to Stanislaus County Superior Court. On April 18, 2013, the Court granted the request.
On October 7, 2013, following a private mediation, the parties signed a Memorandum of Understanding in which they agreed to resolve the action for a maximum of $275,000 on a claims made basis. On December 5, 2013, the settlement was presented to the Stanislaus County Superior Court. The Court granted preliminary approval of the settlement and scheduled a final approval hearing for March 14, 2014.
Other Claims and Litigation
The Company is involved in various other claims and litigation arising in the normal course of business. In the judgment of management, which relies in part on information from Company counsel, the ultimate resolution of these actions will not materially affect the consolidated financial statements of the Company except as described above.
Notes to Consolidated Financial Statements (continued) Years ended December 31, 2013, 2012 and 2011

41
Sensient Technologies Corporation 2013
The management of Sensient Technologies Corporation is responsible for establishing and maintaining adequate internal control over financial reporting. It is management’s policy to maintain a control-conscious environment through an effective system of internal accounting controls. These controls are supported by the careful selection of competent and knowledgeable personnel and by the communication of standard accounting and reporting policies and procedures throughout the Company. These controls are designed to provide reasonable assurance regarding the reliability of financial reporting and the preparation of financial statements for external purposes in accordance with generally accepted accounting principles.
Management has assessed the effectiveness of the Company’s internal control over financial reporting as of December 31, 2013. In making its assessment of internal control over financial reporting, management used the crite-ria set forth by the Committee of Sponsoring Organizations of the Treadway Commission in Internal Control – Integrated Framework. Based on that assessment, management has concluded that the Company’s internal control over financial reporting was effective as of December 31, 2013.
The Company’s independent registered public accounting firm has issued its report on the Company’s internal control over financial reporting. This report appears on page 42.
Management’s Report on Internal Control Over Financial Reporting
To The Board of Directors and Shareholders ofSensient Technologies CorporationMilwaukee, Wisconsin
We have audited the accompanying consolidated balance sheets of Sensient Technologies Corporation and subsidiaries as of December 31, 2013 and 2012, and the related consolidated statements of earnings, comprehensive income, shareholders’ equity, and cash flows for each of the three years in the period ended December 31, 2013. These financial statements are the responsibility of the Company’s management. Our responsibility is to express an opinion on these financial statements based on our audits.
We conducted our audits in accordance with the standards of the Public Company Accounting Oversight Board (United States). Those standards require that we plan and perform the audit to obtain reasonable assurance about whether the financial statements are free of material misstatement. An audit includes examining, on a test basis, evidence supporting the amounts and disclosures in the financial statements, assessing the accounting principles used and significant estimates made by management, as well as evaluating the overall financial statement presentation. We believe that our audits provide a reasonable basis for our opinion.
In our opinion, the financial statements referred to above present fairly, in all material respects, the consolidated financial position of Sensient Technologies Corporation and subsidiaries at December 31, 2013 and 2012, and the consolidated results of their operations and their cash flows for each of the three years in the period ended December 31, 2013, in conformity with U.S. generally accepted accounting principles.
We also have audited, in accordance with the standards of the Public Company Accounting Oversight Board (United States), Sensient Technologies Corporation’s internal control over financial reporting as of December 31, 2013, based on criteria established in Internal Control – Integrated Framework issued by the Committee of Sponsoring Organizations of the Treadway Commission (1992 Framework) and our report dated February 28, 2014 expressed an unqualified opinion thereon.
Milwaukee, WisconsinFebruary 28, 2014
Report of Independent Registered Public Accounting Firm

42
Report of Independent Registered Public Accounting Firm on Internal Control Over Financial Reporting
To The Board of Directors and Shareholders ofSensient Technologies CorporationMilwaukee, Wisconsin
We have audited Sensient Technologies Corporation’s internal control over financial reporting as of December 31, 2013, based on criteria established in Internal Control – Integrated Framework issued by the Committee of Sponsoring Organizations of the Treadway Commission (1992 Framework) (the “COSO criteria”). Sensient Technologies Corporation’s management is responsible for maintaining effective internal control over financial reporting, and for its assessment of the effectiveness of internal con-trol over financial reporting included in the accompanying Management’s Report on Internal Control Over Financial Reporting. Our responsibility is to express an opinion on the Company’s internal control over financial reporting based on our audit.
We conducted our audit in accordance with the standards of the Public Company Accounting Oversight Board (United States). Those standards require that we plan and perform the audit to obtain reasonable assurance about whether effective internal control over financial reporting was maintained in all material respects. Our audit included obtaining an understanding of internal control over financial reporting, assessing the risk that a material weakness exists, testing and evaluating the design and operating effectiveness of internal control based on the assessed risk, and performing such other procedures as we considered necessary in the circumstances. We believe that our audit provides a reasonable basis for our opinion.
A company’s internal control over financial reporting is a process designed to provide reasonable assurance regarding the reliability of financial reporting and the preparation of financial statements for external purposes in accordance with generally accepted accounting princi-ples. A company’s internal control over financial reporting includes those policies and procedures that (1) pertain to the maintenance of records that, in reasonable detail, accurately and fairly reflect the transactions and disposi-
tions of the assets of the company; (2) provide reasonable assurance that transactions are recorded as necessary to permit preparation of financial statements in accor-dance with generally accepted accounting principles, and that receipts and expenditures of the company are being made only in accordance with authorizations of management and directors of the company; and (3) pro-vide reasonable assurance regarding prevention or timely detection of unauthorized acquisition, use, or disposition of the company’s assets that could have a material effect on the financial statements.
Because of its inherent limitations, internal control over financial reporting may not prevent or detect misstatements. Also, projections of any evaluation of effectiveness to future periods are subject to the risk that controls may become inadequate because of changes in conditions, or that the degree of compliance with the policies or procedures may deteriorate.
In our opinion, Sensient Technologies Corporation main-tained, in all material respects, effective internal control over financial reporting as of December 31, 2013, based on the COSO criteria.
We also have audited, in accordance with the standards of the Public Company Accounting Oversight Board (United States), the consolidated balance sheets of Sensient Technologies Corporation as of December 31, 2013 and 2012, and the related consolidated statements of earnings, comprehensive income, shareholders’ equity, and cash flows for each of the three years in the period ended December 31, 2013 and our report dated February 28, 2014, expressed an unqualified opinion thereon.
Milwaukee, WisconsinFebruary 28, 2014

43
Sensient Technologies Corporation 2013
2008 2009 2010 2011 2012 2013
Sensient Technologies Corporation $100 $113 $162 $171 $164 $228
S&P Midcap Specialty Chemicals Index 100 156 217 254 348 435
S&P Midcap Food Products Index 100 114 142 171 181 257
S&P 500 Index 100 126 145 148 171 226
Standard & Poor’s and S&P are registered trademarks of Standard & Poor’s Financial Services, LLC.
Sensient Technologies Corporation
S&P Midcap Specialty Chemicals Index
S&P Midcap Food Products Index
S&P 500 Index
Quarterly Data
2008 2009 2010 2011 2012 2013
Net Earnings Per Share(in thousands except per Gross Net share amounts) (unaudited) Revenue Profit Earnings Basic Diluted
2013First Quarter $365,640 $117,137 $21,439 $0.43 $0.43Second Quarter 378,806 122,521 32,282 0.65 0.65Third Quarter 371,993 120,059 31,525 0.63 0.63Fourth Quarter 351,111 116,185 28,049 0.56 0.56
2012First Quarter $365,660 $115,332 $28,906 $0.58 $0.58Second Quarter 367,777 119,955 34,905 0.70 0.70Third Quarter 369,371 117,593 32,876 0.66 0.66Fourth Quarter 356,242 110,263 27,221 0.55 0.55
Market Price Dividends High Low Per Share
2013 First Quarter $39.39 $35.54 $0.22Second Quarter 42.38 35.59 0.23Third Quarter 48.15 39.96 0.23Fourth Quarter 53.35 46.75 0.23
2012First Quarter $41.08 $35.43 $0.21Second Quarter 39.25 34.14 0.22Third Quarter 37.92 34.26 0.22Fourth Quarter 38.02 33.13 0.22
Company Stock Performance
This graph compares the cumulative total shareholder return for the Company’s common stock over the last five years to the total returns on the Standard & Poor’s Midcap Specialty Chemicals Index (the “S&P Midcap Specialty Chemicals Index”), the Standard & Poor’s Midcap Food Products Index (the “S&P Midcap Food Products Index”) and the Standard & Poor’s 500 Stock Index (the “S&P 500 Index”). The graph assumes a $100 investment made on December 31, 2008, and reinvestment of dividends. The stock performance shown on the graph is not necessarily indicative of future price performance.
Common Stock Prices and Dividends
$450
$350
$250
$150
$50

44
(in thousands except employee and per share data) Years ended December 31, 2013 2012
Summary of OperationsRevenue $1,467,550 100.0% Cost of products sold 991,648 67.6 995,907 68.3 Selling and administrative expenses 303,540 20.7 271,935 18.6 Operating income 172,362 11.7 191,208 13.1 Interest expense 16,147 1.1 16,901 1.2 Earnings before income taxes 156,215 10.6 174,307 11.9 Income taxes 42,920 2.9 50,399 3.5 Net earnings Earnings per share:
$ 2.28 2.27 $ 2.49
Other Related DataDividends per share, declared and paid Average common shares outstanding:
49,755 49,596 49,934 49,822
Book value per common share $ 24.72Price range per common share 35.54-53.35 33.13-41.08 Share price at December 31 48.52 35.56 Capital expenditures 104,246 103,806 Depreciation 50,716 46,992 Amortization 1,300 1,360 Total assets 1,870,734 1,776,643 Long-term debt 348,124 333,979 Total debt 355,174 354,027 Shareholders’ equity 1,242,684 1,153,898 Return on average shareholders’ equity 9.5% 11.3% Total debt to total capital 22.2% 23.5% Employees 4,130 3,983
The 2013 results include a charge of $31.7 million ($22.0 million after tax, or $0.44 per share) related to the 2013 restructuring program related to the relocation of the Flavors & Fragrances Group headquarters to Chicago, as well as a profit improvement plan across all segments of the Company.
The 2011 results include a charge of $4.8 million ($3.7 million after tax, or $0.07 per share) related to the Company’s plan to improve the profitability and efficiency of selected operations. The 2011 results also include a gain of $3.6 million ($3.6 million after tax, or $0.07 per share) related to the revaluation of the Company’s non-controlling interest in a subsidiary.
The 2010 results include a credit of $1.5 million ($0.9 million after tax, or $0.02 per share) for additional insurance proceeds received on the 2009 environmental claims.
The 2009 results include charges for the settlement of environmental claims and related legal expenses, net of insurance reimbursements, of $11.3 million ($6.9 million after tax, or $0.14 per share).
Five Year Review

45
Sensient Technologies Corporation 2013
2011 2010 2009
981,137 68.6 919,821 69.3 832,382 69.3258,829 18.1 233,782 17.6 222,067 18.5190,823 13.3 174,577 13.1 146,963 12.219,439 1.4 20,384 1.5 23,788 2.0
171,384 12.0 154,193 11.6 123,175 10.350,900 3.6 47,049 3.5 36,614 3.0
107,144 8.1% $ 86,561 7.2%
$ 1.78
49,746 49,138 48,379 49,937 49,424 48,641
20.87 $30.15-39.69 24.76-37.61 18.42-29.07
37.90 36.73 26.30 72,200 55,823 47,716 44,771 42,109 40,881 1,328 1,314 1,302
1,654,164 1,599,268 1,591,691 312,422 324,360 388,852 335,396 349,810 428,033
1,049,210 983,785 908,695 11.4% 11.6% 10.0% 24.2% 26.2% 32.0%
3,887 3,618 3,570
46
B O A R D O F D I R E C T O R S
Kenneth P. Manning, 72Chairman and Chief Executive OfficerSensient Technologies CorporationElected Director in 1989 (2, 6)
Hank Brown, 74President EmeritusUniversity of ColoradoElected Director in 2004 (1, 4, 5)
Edward H. Cichurski, 72Retired, Former PartnerPricewaterhouseCoopersElected Director in 2013 (1, 5, 6)
Fergus M. Clydesdale, Ph.D., 77Distinguished Professor, Department of Food Science, and Director of the Food Science Policy Alliance at theUniversity of Massachusetts – AmherstElected Director in 1998 (2, 3, 4, 6)
James A.D. Croft, 76ChairmanBartlodge LimitedElected Director in 1997 (1, 2, 3, 6)
William V. Hickey, 69Retired, Former President and Chief Executive OfficerSealed Air CorporationElected Director in 1997 (1, 2, 4, 5)
Paul Manning, 39President and Chief Operating OfficerSensient Technologies CorporationElected Director in 2012 (2, 5, 6)
Elaine R. Wedral, Ph.D., 69Retired, Former PresidentNestle’s Research and DevelopmentWorldwide Food Service SystemsElected Director in 2006 (5, 6)
Essie Whitelaw, 66Retired, Former Senior Vice President, OperationsWisconsin Physician ServicesElected Director in 1993 (3, 4, 6)
E L E C T E D O F F I C E R S
Kenneth P. Manning, 72Chairman and Chief Executive OfficerWith the Company 26 years
John F. Collopy, 44Vice President and TreasurerWith the Company 14 years
Christopher M. Daniels, 40Vice President, Human ResourcesWith the Company 14 years
Michael C. Geraghty, 52President, Color GroupWith the Company 2 years
John L. Hammond, 67Senior Vice President, General Counsel and Secretary With the Company 16 years
Richard F. Hobbs, 66Senior Vice President and Chief Financial Officer With the Company 40 years
Jeffrey T. Makal, 50Vice President, Controller and Chief Accounting OfficerWith the Company 17 years
Richard J. Malin, 47Assistant Controller With the Company 22 years
John J. Manning, 45Vice President and Assistant General CounselWith the Company 1 year
Paul Manning, 39President and Chief Operating OfficerWith the Company 4 years
Stephen J. Rolfs, 49Senior Vice President, AdministrationWith the Company 16 years
Robert J. Wilkins, 57President, Asia Pacific GroupWith the Company 10 years
A P P O I N T E D O F F I C E R S
Douglas L. Arnold, 50Vice President, Administrative ServicesWith the Company 16 years
Leroy C. Watson, 40Vice President, TaxationWith the Company 8 years
Directors & Officers
C O M M I T T E E S
1 Audit Committee2 Executive Committee3 Compensation and
Development Committee4 Nominating and Corporate
Governance Committee5 Finance Committee6 Advisory Committee

World Headquarters777 East Wisconsin AvenueMilwaukee, Wisconsin 53202-5304(414) 271-6755(800) 558-9892Fax: (414) 347-4788E-mail: [email protected] site: www.sensient.com
Transfer Agent and RegistrarWells Fargo Bank Minnesota, N.A.Shareowner Services P. O. Box 64854St. Paul, Minnesota 55164-0854(800) 468-9716Web site: www.wellsfargo.com/shareownerservices
Common StockSensient Technologies Corporation Common Stock is traded on the New York Stock Exchange. Ticker symbol: SXT.
There were 2,662 shareholders of record of Common Stock as of January 31, 2014.
Annual Meeting of ShareholdersThe Annual Meeting of Shareholders is scheduled to be held at 2:00 p.m. (CDT) on Thursday, April 24, 2014, at Trump International Hotel, 401 N. Wabash Avenue, Chicago, Illinois.
Annual Report and Proxy StatementThe Company’s annual report and proxy statement are available online at www.sensient.com/financial/annualreport_and_proxy.htm.
Form 10-KThe Company’s annual report filed with the Securities and Exchange Commission on Form 10-K is avail-able without charge from the Company’s Investor Relations Department and on its web site at www.sensient.com.
In accordance with New York Stock Exchange rules and pursuant to Rule 13a-14 under the Securities Exchange Act of 1934, Paul Manning, as the Company’s Chief Executive Officer, and
Richard F. Hobbs, as the Company’s Chief Financial Officer, have certified the quality of the Company’s public disclosure in an exhibit to the Company’s Annual Report on Form 10-K for the year ended December 31, 2013.
DividendsQuarterly dividends are typically paid on the first business day of March, June, September and December.
Automatic Dividend Reinvestment PlanThe Sensient Technologies Corporation Dividend Reinvestment Plan provides shareholders with a convenient, economical way to increase their ownership of Sensient Technologies Corporation Common Stock. Through the plan, shareholders can automatically reinvest their dividends to acquire additional shares and make supplemental stock purchases without paying fees or commissions. An enrollment form and brochure describing the plan can be obtained by contacting the plan adminis-trator, Wells Fargo Bank Minnesota, N.A. at (800) 468-9716, or the Company’s Investor Relations Department at (414) 347-3827.
Investor RelationsCommunications concerning the transfer of shares, lost certificates, duplicate mailings or change of address should be directed to the transfer agent.
Other shareholder information, such as news releases and information regarding corporate governance, is available on the Company’s web site: www.sensient.com. Shareholders can also register to receive notification via e-mail when new information is added to the site. The Company’s web address is provided as an inactive textual reference only, and the contents of the web site are not incorporated in or otherwise to be regarded as part of this annual report.
Other requests for information should be directed to the Company’s Investor Relations Department at (414) 347-3827.
Investor Information

S e n s i e n t T e c h n o l o g i e s C o r p o r a t i o n
777 East Wisconsin AvenueMilwaukee, WI 53202-5304www.sensient.com