sensation seeking and daily activities as determinants of
TRANSCRIPT

University of RichmondUR Scholarship Repository
Master's Theses Student Research
5-1988
Sensation seeking and daily activities asdeterminants of criminal behaviorRebecca S. Fulper
Follow this and additional works at: http://scholarship.richmond.edu/masters-theses
This Thesis is brought to you for free and open access by the Student Research at UR Scholarship Repository. It has been accepted for inclusion inMaster's Theses by an authorized administrator of UR Scholarship Repository. For more information, please [email protected].
Recommended CitationFulper, Rebecca S., "Sensation seeking and daily activities as determinants of criminal behavior" (1988). Master's Theses. Paper 533.

Abstract
This study looks at sensation seeking and daily
activities as possible determinants of criminal behavior
within the age range of 15 to 30. A male offender and a male
nonoffender population between the ages of 15 and 18 were
compared on two questionnaires; Zuckerman's Sensation Seeking
Scale, Form VI, (SSS) and the Daily Activities Questionnaire
(DAQ). The design consisted of one independent variable with
two levels and multiple dependent variables. The research
hypotheses indicated that the juvenile offender group would
score higher on both Disinhibition subscales of the SSS and
lower on the DAQ (Intention - Disinhibition (IDIS);
Experience - Disinhibition (EDIS)). A multivariate analysis
of variance and a discriminant function analysis were
performed on the data. The results indicated that the
offenders scored significantly lower on the IDIS scale than
the nonoffenders. F statistics are as follows: EDIS
!(1,84)=.620, E > .05; IDIS - !(1,84)=5.666, E < .05; DAQ -
!(1,84)=2.998, E > .05. The results of the SSS and DAQ
suggest that there is not a difference between the groups in
the activities in which they have already engaged, but there
is a difference in the activities in which they intend to
engage in the future.
"Sensation Seeking and Daily Activities as
Determinants of Criminal Behavior"
by
Rebecca S. Fulper
0& Jay' 7 Dat"e Dr.C!ames Tromater, Committee Chairperson
Dr. Andrew Newcomb, Committee Member
Dr. Committee Member 3';~'~fr , Dat

SENSATION SEEKING AND DAILY ACTIVITIES
AS DETERMINANTS OF CRIMINAL BEHAVIOR
By
REBECCA S. FULPER
B.S., Mississippi State University, 1981
A Thesis
Submitted to the Graduate Faculty
of the University of Richmond
in Candidacy
for the degree of
MASTER OF ARTS
in
Psychology
May, 1988
Richmond, Virginia
LIBRARY
UNIVERSITY OF RICHMOND
VIRGINIA 23173

Sensation Seeking in Offenders
Sensation Seeking and Daily Activities as
Determinants of Criminal Behavior
The study of crime and identification of a criminal
personality has been perhaps one of the more frustrating
areas of research for the social sciences. Attempts to
explain criminality through psychological, sociological,
environmental, biological, or demographic factors have been
for the most part unsuccessful and inconsistent. Research
strongly indicates that a combination of some or all of these
factors provides the best explanation and grounds for
possible prediction of criminal behavior (Wilson &
Herrnstein, 1985).
Of the many variables that have been cited for having
possible relationships to criminal propensity - age, sex,
race, socioeconomic status (SES), labor force, schools,
religion, family life, and genetic influences (Lampe, 1978) -
there is one that appears to stand unaffected even when
other variables are controlled. This is the age variable
(Tittle, 1980; Hirschi & Gottfredson, 1983; Wilson &
Herrnstein, 1985). Some researchers question if there is any
better predictor of criminal propensity than age (Hirschi &
Gottfredson, 1983).
Crime statistics and research show that people are more
likely to engage in criminal behavior in the age range
1

Sensation Seeking in Offenders
2
of 15 to 30 (Wilson & Herrnstein, 1985; Hirschi &
Gottfredson, 1983; West & Farrington, 1973; Greenberg, 1985).
Wilson and Herrnstein (1985) cited the 1980 Uniform Crime
Report arrests to show that persons between 15 and 30 years
of age were arrested for over 65% of the property crimes in
the United States, even though they only comprise
approximately 25% of the total population. This indicates
that a small percentage of our population is accounting for a
large percentage of property or nonviolent crimes.
The relationship of culture, gender, and race to the
criminally active age range of 15 to 30 have all been
studied. In general the research indicates that regardless
of culture, gender, or race, persons within each of these
differA[Aent groups tend to be most criminally active between
the ages of 15 to 30, with the peak age averaging around 16.
Though the age range for the commission of crimes is about
the same for these three groups, there is a difference in the
number of crimes committed comparing males to females and
blacks to whites. For instance, males are arrested for a
significantly greater number of crimes than females (Wilson &
Herrnstein, 1985), and there is a higher percentage of blacks
than whites reported in crime statistics (Laub, 1983;
Greenberg, 1985; Wilson & Herrnstein, 1985). In reviewing
self-report, the difference between blacks and whites becomes
less (Wilson & Herrnstein, 1985).

Sensation Seeking in Offenders
3
Three other factors which are often targeted in crime
research to explain criminal propensity are SES,
unemployment, and family life. Some self-report studies have
failed to find the expected negative relationship between SES
and delinquency (Hirschi, 1969; Tittle & Villemez, 1977;
Tittle, Villemez, & Smith, 1978; Loeber & Dishion, 1983).
contrary to these findings, the study by Elliot, Ageton, and
Huizinga (1978), found that delinquency was two to four times
higher among lower and working class youths than middle class
youths, but only for the more serious offenses.
Inconsistencies in the SES/delinquency research have
been explained in a couple of ways. Greenberg (1985) reports
that the negative relationship between SES and delinquency
exists mostly when delinquents with the more serious offenses
are included. Hirschi (1969) reported that the use of self
report data compared to official statistics is sometimes said
to be the reason for finding no relationship; however, his
study also looked at official statistics which also failed to
show the negative relationship. Winslow (1976) stated that
SES is not the whole picture. An important factor is where
the family/person lives; hence, a lower class youth in an
upper class neighborhood is less likey to become delinquent.
Data from other delinquency research do not fully
support the predictions that unemployed rather than employed
teenagers are more likely to engage in criminal behavior, or

Sensation Seeking in Offenders
4
that teenagers with access to legitimate funds to support
their needs will be less likely to steal (West & Farrington,
1977; Hirschi, 1969). Shannon (1982) found that unemployment
among older youths leads to delinquency, whereas the
Gottfredson study (1984) reports that it has no effect.
Greenberg (1985) looks at these inconsistencies found in
the delinquency/employment research as being due to the
failure to account for such factors as job satisfaction -
whether or not the job is meeting the needs of the person who
is doing it. In other words, if an adolescent is very
materialistic and has a low paying job, he/she is less likely
to be making enough money to meet his/her needs. The result
may be stealing on the job and getting fired or stealing from
someone else. West and Farrington (1977) found that
delinquents tend to spend their money faster than
nondelinquents and usually do not have savings accounts.
This finding supports Greenberg (1985) because it shows that
delinquents are more likely to spend their money, thereby
making it more likely not to have enough money to meet their
future needs.
Hirschi (1969) presented results from research on
delinquents and daily activities and concluded that those
adolescents who tend to have involvement in "adult"
activities, such as smoking, drinking, riding around in a
car, dating, and spending leisure time talking to friends are

Sensation Seeking in Offenders
5
more likely to become involved in delinquent acts. Just
filling an adolescent's time is not as likely to keep him/her
away from criminal behavior, as will filling their time with
something they want to do and enjoy doing.
west and Farrington (1973) report that in their study of
delinquent boys, delinquents spent little time with parents
or other family members and received little encouragement to
organize their leisure time constructively. Much of their
time was spent "on the street". They tended not to have
holidays away from home and to have fathers who did not
participate in their leisure pursuits. These findings were
consistent across all three family income levels.
west and Farrington (1977) summed up the use of leisure
time by a group of delinquents in their study as somewhat
haphazard, disorganized, and generally unconstructive.
Delinquents compared to nondelinquents spent more time away
from home, sometimes aimlessly riding around or hanging about
on the street.
The question remains, "Why does there seem to be such a
strong relationship between criminal behavior and age?".
There are many plausible theories which lack empirical
support. For example, Wilson and Herrnstein(1985) provide
the following explanations:
"Youth is the adventurous time of life; old age, the settled time. This leads not only to more youthful crime, according to this line of thought, but also to more detectable youthful crime. Older

Sensation Seeking in Offenders
people often occupy positions of trust, in which they can commit surreptitious crimes. Young people are less skilled in their work than older people hencemore likely to be caught when they break the law. Youth is a time of intense and unfulfilled passions, leading to crimes for goods and pleasures that older people either crave less or can enjoy legally. Young people suffer more unemployment, hence have not only the need but the time for illegal gains. Young people experience more inequity than older people, and tend to die young, leaving a more law-abiding population to grow old. The criminal justice system is lenient toward the very young and old, producing an apparent peak in offending in between. Young people are more exposed to the disinhibiting influences of the mass media; old people are more interested in religion, with its moral injunctions." (pp.144 - 145).
6
Marvin Zuckerman (1979) describes a personality type
which is also related to this age range and may help to
explain why the age range of 15 to 30 is so prone to criminal
behavior. This personality is called a sensation seeking
personality.
Zuckerman (1979) has summarized the findings of research
on sensation seeking and risk-taking activities. He reports
that high sensation seekers tend to engage in moderately
risky activities. They tend to volunteer for experiments
that offer the possibility of some new and unusual type of
experience. Sensation seekers are more willing to change
locales and enjoy traveling, even if risk is involved.
Negative life stresses have more impact on low sensation
seekers than high sensation seekers. These data are
consistent with a risk model of sensation seeking which
Sensation Seeking in Offenders
7
states that high sensation seekers do not perceive what
appears to be a risky situation to most people, as risky.
In order to connect sensation seeking with criminal
propensity it is important to understand the groundwork for
sensation seeking. Sensation seeking is based on the idea of
sensory reinforcement. High sensation seekers have an
internal need for stimulation which is not usually satisfied
by the daily activities common to the average person. An
internal need suggests the presence of biological factors
related to sensation seeking. This question needs much
research; however, as cited by Zuckerman (1983), studies have
indicated their presence. It is interesting to find that much
of this research shows similarities in the biological factors
of sensation seekers and criminal offenders.
There is evidence that the age range is similar for high
scores in sensation seeking and involvement in criminal
behavior. Zuckerman (1979) summarizes the research on age
and SSS Form II General Scale with samples of psychiatric
patients, normals, hospital employees, and male and female
prisoners. These studies all reach the same conclusion - a
significant negative correlation between age and sensation
seeking scores. The Farley and Cox study (1971), looked at
sensation seeking in adolescents in the age range of 14 to 17
and found little fluctuation in their scores. Zuckerman
(1979) states that age 14 is probably the lowest appropriate

Sensation Seeking in Offenders
8
age for the administration of the SSS. Additional research
supports the decline in sensation seeking scores with age and
finds that high sensation seeking scores occur at
approximately the same age range as criminal behavior, 15 to
25, (Thorne, 1971; Zuckerman, Eysenck, and Eysenck, 1978; and
Ball, Farnill, and Wangeman, 1984). The relationship between
age and sensation seeking scores is great enough that
zuckerman recommends that age be controlled statistically in
sensation seeking research if the age range exceeds one
decade.
A review of the research on personality types and
criminal offenders also reveals an interesting link between
sensation seeking and criminal behaviors. There appears to
be a relationship in the scores of sensation seekers and
criminal offenders on the Hypomania and Psychopathic Deviate
scales on the Minnesota Multiphasic Personality Inventory
(MMPI) and with the Socialization scale of the California
Personality Inventory (CPI) (Thorne, 1971; Zuckerman, 1979).
Studies using the Eysenck personality Questionnaire (EPQ)
found that there is a positive relationship between the
scores of delinquents on the Extraversion and Psychoticism
scales (Forrest, 1977; Eysenck & Saklofske, 1980);
consequently, high sensation seekers tend to score high on
the Extraversion and psychoticism scales of the EPQ
(Zuckerman, Eysenck, & Eysenck, 1978).

Sensation seeking in Offenders
9
The earlier forms of the SSS were made up of four
subscales which resulted in one total sensation seeking
score. The version used in this research also consists of
four subscales; however, these four subscales were made up of
two of the subscales from the earlier versions - the
Disinhibition scale (DIS) and the Thrill and Adventure
Seeking scale (TAS). Both of these scales have two
components - activities in the past (Experience) and
activities in the present (Intention), (Zuckerman, 1984).
This study will focus mainly on the Experience-Disinhibition
scale (EDIS) and the Intention-Disinhibition scale (lOIS) of
the SSS.
Research has consistently shown a relationship between
criminal behavior and age; however, research findings on
other suspected causal factors have unfortunately been
inconsistent. Some of these inconsistencies have been
attributed to the use of varied populations and differences
in variable controls, as has already been discussed. A major
problem in studying criminal behavior is in obtaining a known
population of offenders and nonoffenders. The offender
population can be more easily obtained by using those who
have been convicted; however, in obtaining a comparison group
of nonoffenders, one may end up with many ex-offenders
(Garabedian & Gibbons, 1970). For this reason self-report

Sensation Seeking in Offenders
10
studies are often encouraged in hopes that the offender will
reveal him/herself (Eysenck, 1977).
A factor which may cause inconsistencies in criminal
behavior studies results is satisfaction - whether or not one
is satisfied with his/her job, school, or way of life. The
proposed study will attempt to look at the daily activities
of targeted populations, as well as satisfaction with job,
school, and life in general in relation to scores on the SSS.
An attempt will be made to discriminate between male offender
and nonoffender populations between the ages of 15 and 30
years through the use of the SSS, Form VI and the Daily
Activities Questionnnaire (DAQ). This study will operate
under the premise that there will be high scoring offenders
and nonoffenders on the DIS scales of the SSS. The score on
the DAQ in relation to the DIS scores will be the key to
predicting who is at risk to become an offender.
The hypotheses to be tested are: (a) the mean sensation
seeking scores on the EDIS and the IDIS subscales will be
significantly higher for offenders than nonoffenders; (b) the
mean DAQ scores will be significantly lower for offenders
than nonoffenders; (c) the discrepancy between the mean EDIS
subscale scores and the mean IDIS subscale scores will be
significantly higher for offenders as compared to
nonoffenders. Additionally, a discriminant analysis will be
Sensation Seeking in Offenders
11
applied to classify the juveniles, and the equation will be
validated against the adult offenders.
If these hypotheses are supported, this study will have
shown that offenders tend to be high in sensation seeking and
do not engage in as many satisfying, appropriate, and
prosocial activities, whether it be through work, clubs,
school, sports, or hobbies as do the nonoffenders. This
information could be of importance to criminal rehabilitation
programs as well as to anyone who is involved in the
upbringing of our youth. Support of the research hypotheses
would indicate the need to develop an effective approach to
teaching youth how to structure their leisure time and how to
obtain satisfaction in their daily activities.
Method
Subjects
A total of 156 male subjects were included in the study;
however, only 102 of the subjects' responses were used for
the analysis. Fifteen of the subjects had to be dropped
because their age exceeded the range of 14 to 30 years of
age; six subjects had to be dropped because they left a
significant portion of their questionnaires blank; thirty-one
subjects were deleted because their scores exceeded the limit
on the lie scale of the SSS; and two subjects were randomly
dropped from the nonoffender population so that there would
be equal groups. Forty-three males between the ages of 15

Sensation Seeking in Offenders
12
and 18 years were from a private high school in Richmond,
Virginia. This school is predominately white, but it has a
wide range of socioeconomic levels. This group made up the
nonoffender population. The offenders consisted of 43 males
between the ages of 14 and 18, who were currently being held
at the Reception and Diagnostic Center in Richmond, virginia.
Also making up the offender population were 16 males between
the ages of 19 and 30 from the New Kent County field unit in
New Kent, Virginia.
Tests
zuckerman (1984) has recently developed a new Sensation
Seeking Scale (SSS), Form VI. This form concentrates on two
content areas, Thrill and Adventure Seeking (TAS) - items
which indicate a desire to engage in physical activities
involving elements of speed, danger, novelty, and defiance of
gravity; and Disinhibition (DIS) - items which indicate a
need for a release through uninhibited social activities with
or without alcohol. In the SSS, Form VI, reports of actual
experiences are separated from desired or intented future
experiences on both content areas. The four scales on Form
VI are: Experience - Thrill and Adventure Seeking (ETAS);
Experience - Disinhibition (EDIS); Intention -Thrill and
Adventure Seeking (ITAS); Intention - Disinhibition (lOIS).
Reliabilities for SSS, Form VI have been shown to be
good. Internal reliabilities range from .83 to .94 for EDIS,

Sensation Seeking in Offenders
13
ITAS, and lOIS and from .62 to .66 for ETAS. Retest
reliabilities range from .84 to .93. validity data on the
SSS show a low relationship with the Socialization scale of
the CPI and a moderate relationship with other sensation
seeking scales (Zuckerman, 1985).
Form VI is used in the present study because it has
better reliabilities than previous forms and because it has a
higher concentration on the DIS subscale, which is more
common to the offender population than the other scales
(Emmons & Webb, 1974; Blackburn, 1978; Zuckerman, 1978).
Another reason for using it is because it includes a measure
of the discrepancy between what one has done and what one
would like to do. This may prove useful in understanding why
offenders repetitively engage in criminal behaviors.
The Daily Activities Questionnaire (DAQ), developed by
this writer, is a self-report questionnaire focusing on the
subject's educational level and goals, participation in
activities and hobbies, satisfaction in school, job, and life
in general, and criminal activity. The internal reliability
for the DAQ, using the two populations in this study was
rather low. The reliabilities on the daily activities
portion of the DAQ ranged from .24 to .41, and ranged from
.40 to .53 on the satisfaction portion of the DAQ. For
information on scoring the DAQ, see a copy of the
questionnaire in the appendix section.

procedure
Sensation Seeking in Offenders
14
All subjects signed a consent form in accordance with
the ethical guidelines (American Psychological Association,
1981). Since most of the subjects used in this study were
minors, permission was obtained in the following manner: at
the private high school, the principal cosigned the consent
forms; at RDC, the research department for the Department of
Corrections for the State of Virginia gave written consent
for the juveniles to participate. The sequence of the
questionnaire administration was alternated for each testing
session, so that approximately one half of the subjects from
each group were administered the DAQ first, while the other
half were administered the SSS first.
All male juveniles present at RDC were given the
opportunity to participate in the study. The questionnaire
administration was held in the recreation room of each of the
cottages, of which there were four with an average of 15 boys
in each. Those boys choosing not to participate left the
immediate area.
The subjects at the private school were obtained from
two arbitrarily selected religion classes, a class which is
required of all of the students. The questionnaire
administration was done in two group sessions in the
classroom. Everyone agreed to participate.

Sensation seeking in Offenders
All inmates at the New Kent field unit were given the
opportunity to participate in the study. The questionnaire
administration was held in the dining hall in two sessions.
Those choosing not to participate went back to their living
quarters.
Consent forms were distributed first, then each group
was given a brief explanation before the administration of
the questionnaires as follows:
"You are being asked to participate in a research project which I must do to meet requirements for a class at school. It is very important that you are completely honest on all questions. For your protection and assurance of anonymity, please do not put your name, address, or any identifying information or marks on any papers that I give you. Please refrain from talking when I begin to hand out the questionnaires. I will tell you more about the research project after you have completed the questionnaires. There is a consent form in front of you which I would like you to read and ask me any questions concerning it that you may have. If you agree to participate, please check that response and sign the form at the bottom. If you do not wish to participate, you may do as you are instructed by your staff on-duty.".
A subject was selected from each group to gather the
consent forms and give them to me. The questionnaires were
then handed out, and each group was reminded to read the
directions and complete the questionnaires without talking.
All subjects were encouraged to be honest.
Questionnaire administration time was about 30 minutes
15
total for each group except for the groups at RDC. For some
reason it took most of these groups about 15 minutes longer.
Sensation Seeking in Offenders
16
Each subject was given a plain white envelope with the
questionnaire sequence printed on the front, and they were
asked to enclose their answer sheets. The researcher
collected these envelopes as each subject finished.
Debriefing was done subsequent to the completion of the
questionnaires for each group. It was explained to each
group that the answers of persons who have a history of being
involved in illegal activities would be compared to persons
who have no history of involvement in crime. It was also
explained that the results could be beneficial in developing
more effective rehabilitation programs, as well as preventive
programs. The researcher then opened the floor for
questions.
Results
The main design was a single factor multivariate design.
The independent variable was a two-level factor - subject
(juvenile offender or juvenile nonoffender). The dependent
variables consisted of five scores (ETAS, EDIS, ITAS, IDIS
and DAQ). A third group, adult offenders was used in the
discriminant analysis.
A multivariate analysis of variance and a discriminant
function analysis were the main analyses used in the research
project. The assumption of normality was satisfied by
checking the symmetries of each distribution curve and the
dispersion of the scores around the means of each cell

sensation Seeking in Offenders
17
(skewness and kurtosis). Skewness and kurtosis values are
listed in Table 1. The three measures of central tendancy
within each cell also appeared to be similar - another
indication of normality.
Insert Table 1 about here
A visual inspection of bivariate plots of all the
variables indicate that there was not any substantial
deviation from linearity. Correlations and two-tailed
significance values are listed in Table 2.
Insert Table 2 about here
Box's M test was done for homogeneity of variance. This
test proved to be significant with !(15,28409) = 1.963,
£ < .05. MANOVA tends to be robust when this assumption is
violated, especially if there is an equal number of subjects
in each group (Tabachnick & Fidell, 1983); therefore, it was
decided to proceed with the analysis.
To ensure that the sequence of questionnaire
administration did not have any effect on the results, a
repeated measures MANOVA was done on the data. All checks
proved to be nonsignificant at the .05 level except for the
offenders' scores on the EDIS scale.

Sensation Seeking in Offenders
18
These results are listed in Table 3. See Table 4 for
Insert Table 3 about here
means on the EDIS and lOIS scales according to sequence of
questionnaire administration. These results indicated that
the sequence had no major effect on the responses except for
the EDIS scale. However, a visual inspection of the group
Insert Table 4 about here
means suggests that there was a bigger difference in the
offenders' mean scores in reference to sequence than the
nonoffenders.
A between-subjects multivariate analysis of variance was
performed on the data. This analysis yielded a significant
difference between the groups. Using the Wilke's Lambda
multivariate test, the result was an approximate
f(5,80)=11.94386, E < .01. Univariate F-tests indicated that
the differences between the groups were significant at the
.05 level on all of the dependent variables except the EOIS
and the OAQ. Variable means and F statistics are listed in
Table 5.

Sensation Seeking in Offenders
19
Insert Table 5 about here
A two-way ANOVA was performed in order to determine for
which group the discrepancy between the mean EDIS scores and
the mean lOIS scores was greater.
Insert Figure 1 about here
A significant interaction resulted with !(1,84)=21.46,
£ < .01. The simple effects for DIS were then checked, and
the results were as follows: nonoffenders - !(1,84)=20.73,
£ < .01; offenders - !(1,84)=4.00, £ < .05. These results
indicated that the discrepancy between the EDIS and IDIS
scales was largest in the nonoffender population.
An exploratory discriminant function analysis was
performed on the data in order to determine if group
membership can be predicted from the Sensation seeking and
OAQ scores. The juvenile offender and nonoffender groups
were used in the calculation of the equation. Standardized
canonical discriminant function coefficients are listed in
Table 6 and correctly classified 82.56% of the cases

Sensation Seeking in Offenders
20
Insert Table 6 about here
(juvenile offenders and nonoffenders);furthermore, 81.3% of
the adult offender population were correctly classified. The
Group Classification table is listed in Table 7.
Insert Table 7 about here
Discussion
Research hypothesis (a) is that the juvenile offender
group would score higher on DIS scales of the SSS and was not
supported. Hypothesis (b) states that the offenders would
score significantly lower on the DAQ scale, and this was not
supported. Hypothesis (c) predicted that the discrepancy
between the mean Experience subscale scores and the mean
Intention subscale scores would be significantly greater for
offenders as compared to nonoffenders and was not supported.
The exploratory discriminant function analysis was successful
in predicting group membership in both the juvenile and adult
groups. The equation placed the juveniles in their correct
group about 83% of the time, and the adults about 81% of the
time.
In examining the data for possible explanations for
these unexpected results, one confounding factor may have

Sensation Seeking in Offenders
21
been the environment in which the offenders were at the time
of the questionnaire administration. They were incarcerated
at the time and their behaviors were being closely observed.
Because the DIS scale reflects one's experience of having
engaged or intentions to engage in different kinds of
activities, most of which revolve around sex, drugs,
drinking, or doing illegal or dangerous things without regard
for possible consequences, the offenders may have felt
inhibited from being totally honest in answering the
questions on the SSS. Despite the fact subjects were assured
that staff would not see their questionnaires, the offenders
may have felt safer to answer "good" on the SSS
questionnaire. It should be noted that the offenders' scores
were lower on the lOIS than on the EOIS, which would indicate
that their intentions are to engage in less of the behaviors
indicated on the DIS scale. This, once again, may have been
their efforts to present a "favorable" picture of themselves.
On the other hand, the offenders may have answered honestly;
therefore, the lower scores on the lOIS compared to the EOIS
may indicate that the offenders no longer wish to engage in
some of those behaviors in which they had previously engaged.
One further observation of the DIS data was the
difference in the offender group on the EOIS scale when
sequence of the questionnaire administration was taken into
account. In looking at the means of the EOIS and lOIS scales

Sensation Seeking in Offenders
22
according to questionnaire administration sequence for both
offenders and nonoffenders, both groups' scores on both
scales were lower when the DAQ was given first. The mean
scores of the nonoffenders were lowered only by a few points,
whereas the mean scores of the offenders were lowered by at
least twelve points. One possible explanation for these
results may have been in the nature of the DAQ. The DAQ was
intended to focus directly on personal data, such as
educational goals, criminal history, satisfaction in school,
job, and life in general. The offenders' reflections on
these areas may have affected their responses on the SSS.
As was discussed earlier, the juvenile offenders took
approximately 15 minutes longer to complete the
questionnaires, than the nonoffenders. Cronbach's alpha was
done on the data as an internal reliabilities check to rule
out any test taking problems. The DAQ had low reliabilities
on both sections, and the offenders proved to be considerable
lower than the nonoffenders on both of these sections as well
as the ETAS of the SSS. See Table 8 for alpha statistics.
Insert Table 8 about here
As the discriminant function analysis indicated, the
data provided correct prediction of group membership in
approximately 83% of the cases of the juveniles. When the
Sensation Seeking in Offenders
23
equation was applied to the data of adult offenders,
approximately 81% of the cases were correctly classified.
This cross validation indicates that the results for the
adult population are similar to those results for the
juvenile offenders. The percentage of correct prediction
leaves room for error about 20% of the time; therefore, these
questionnaires should be used cautiously in placing
individuals in "groups". It may be possible and helpful to
use these questionnaires to identify a population at high
risk to become involved in unlawful activity.
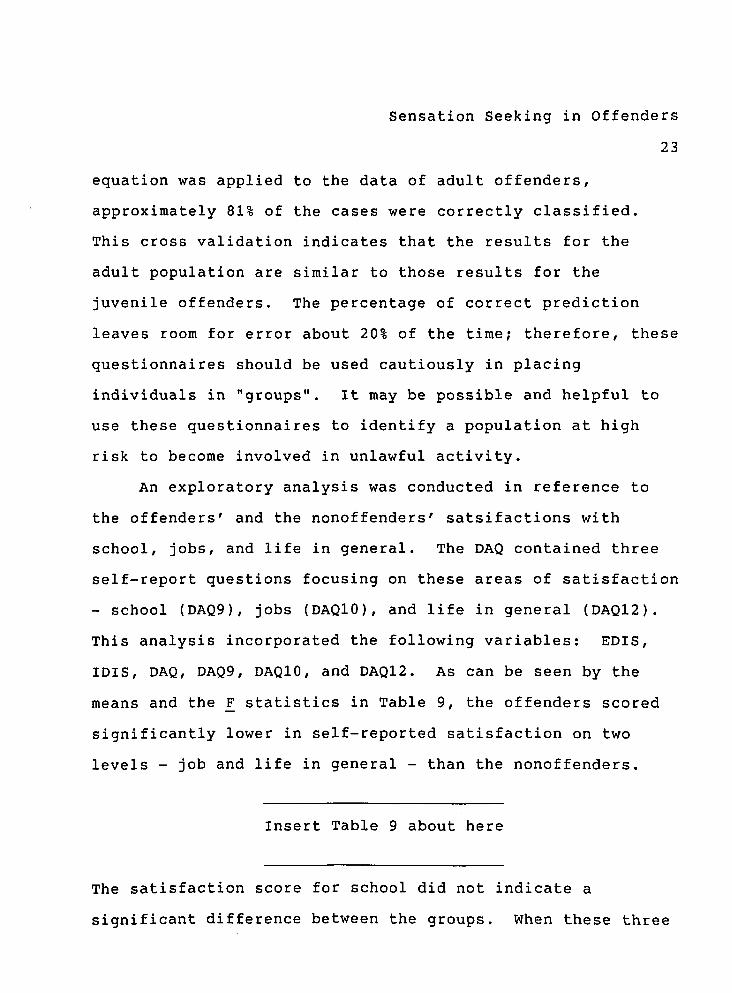
An exploratory analysis was conducted in reference to
the offenders' and the nonoffenders' satsifactions with
school, jobs, and life in general. The DAQ contained three
self-report questions focusing on these areas of satisfaction
- school (DAQ9), jobs (DAQ10), and life in general (DAQl2).
This analysis incorporated the following variables: EDIS,
IDIS, DAQ, DAQ9, DAQlO, and DAQl2. As can be seen by the
means and the F statistics in Table 9, the offenders scored
significantly lower in self-reported satisfaction on two
levels - job and life in general - than the nonoffenders.
Insert Table 9 about here
The satisfaction score for school did not indicate a
significant difference between the groups. When these three

Sensation Seeking in Offenders
24
variables were added to the exploratory discriminant function
analysis, (which no longer included the ITAS and ETAS
variables) the percentage of juvenile offender and
nonoffender cases which were correctly classified increased
to 88.4%. The percentage of adult offender cases correctly
classified remained 81.3%. See Table 10 for the
discriminant function analysis results.
Insert Table 10 about here
This exploratory research may provide support for the
research by Hirschi (1969) cited earlier in reference to
leisure time. The more important factor in Hirschi's
research was to fill the adolescent's time with something
they wanted to do - something satisfying. In the present
research the offenders reported less satisfaction with jobs
and life in general more often than the nonoffenders. This
finding appears to provide support for the underlying
assumption of the present research - the ablity to structure
one's activities so that the maximum satisfaction is derived,
will result in less criminal behavior.
The present study could have been stronger if a group of
adult nonoffenders could have been obtained, so that direct
comparisons of data of adult offenders and nonoffenders could
have been made. Another factor, which may have confounded
Sensation Seeking in Offenders
25
the results of this study, was the environment of the
offenders. The offender populations (juvenile and adult)
were incarcerated at the time of questionnaire
administration. The fact they were incarcerated and that
many privileges are conditional on good behavior, may have
affected their responses on the questionnaires. That
population would need to be obtained in a different manner,
one such that they were not under the reigns of the judicial
system at the time of questionnaire administration. One way
to accomplish this would be through the use of a self-report
questionnaire, such as the DAQ, where the question of
criminal history is asked. The drawback of this approach is
that the researcher must depend on the honesty of the
subjects in accurately admitting past criminal activity.
Also, in order to determine that these results are specific
to the age range of 15 to 30 years, a group of past offenders
beyond the age range of 15 to 30 years would need to be
obtained. Their responses on the questionnaires would then
need to be compared to offenders within the age range of 15
to 30 years.
The results of this study warrant follow-up research in
this area. To determine if the underlying assumption (that
ability to structure activities to derive maximum
satisfaction results in less criminal behavior) has any
value, a longitudinal study would have to be developed. This

Sensation Seeking in Offenders
26
study could be incorporated into the school system by
developing a part of the curriculum to revolve around the
structuring of satisfying daily activities and making it a
requirement for each student. A baseline statistic would
have to be obtained prior to the implementation of the daily
activities curriculum in order to determine the percentage of
students from that school who had become involved in criminal
behavior within the age range of 15 to 30 years. Subsequent
to the implementation of the daily activities curriculum
those students would have to be tracked through the crucial
age range of 15 to 30 years to determine the effectiveness of
the training.
In summary, the age range of 15 to 30 years accounts for
a large percentage of the crime rate. The question to be
answered was, "Why?". This study concludes that during that
age range, or at least up to age 18, offenders tend to score
lower on the lOIS and TAS scales, than the nonoffenders, and
there is no significant difference in their scores on the
EOIS and OAQ. This means that the offenders and the
nonoffenders have participated in items on the EOIS scale,
which revolve around sex, drugs, drinking, or doing illegal
or dangerous things without regard for possible consequences
at about the same rate; however, the nonoffenders plan to
engage in more of such behaviors in the future than the
offenders. The nonoffenders and the offenders also tend to

Sensation Seeking in Offenders
27
have participated in similar amounts of structured daily
activities; however, the offenders report less satisfaction
with their jobs and lives in general. In order to determine
if these results are age specific, further research is
needed.

Sensation Seeking in Offenders
28
Reference
American Psychological Association. (1981). Ethical
principles of psychologists (Revised). American
Psychologist. 36,633-638.
Ball, I.L., Farnill, D., & Wangeman, J.F. (1984). Sex and
age differences in sensation seeking: some national
comparisons. British Journal of Psychology, 75:257-265.
Blackburn, R. (1978). Electrodermal and cardiovascular
correlates of psychopathy. In R. D. Hare, & D. Schalling
(Eds.), Psychopathic behaviour: Approaches to research.
New York: Wiley.
Elliot, C. S., Ageton, S. S., and Huizinga, D. (1978).
1977 Self-reported delinquency estimates by sex, race,
class, and age. National Youth Survey Report. Boulder,
Colorado: Behavioral Research Institute.
Emmons, T. D. and webb, W. W. (1974). Subjective
correlates of emotional responsivity and stimulation
seeking in psychopaths, normals, and acting-out
neurotics. Journal of Consulting and Clinical
psychology. 42:620.
Eysenck, J. J. (1977). Comments on personality and
delinquency. Social Behavior and personality,
5(1):169-170.

Sensation Seeking in Offenders
29
Eysenck, S. B. G. & Saklofske, D. H. (1980). Personality
and antisocial behavior in delinquent and non
delinquent boys. Social Behavior and Personality,
47(3):1255-1261.
Farley, F. H. & Cox, S. o. (1971). Stimulus-seeking
motivation in adolescents as a function of age and sex.
Adolescence, 6:207-218.
Forrest, R. (1977). Personality and delinquency: a
multivariate examination of Eysenck's theory with Scottish
delinquent and non-delinquent boys. Social Behavior and
Personality, 5(1):157-167.
Garabedian, P. G. & Gibbons, D. C. (1970). Becoming
Delinquent. Chicago: Aldine Publishing Company.
Gottfredson, D. C. (1984). Youth unemployment, crime, and
schooling: a longitudinal study of a national sample.
Center for Social Organization of Schools, Report No.
352. Baltimore: John Hopkins University.
Greenberg, D. F. (1985). Age, crime, and social
explanation. American Journal of Sociology, 91(1):1-21.
Hirschi, T. (1969). Causes of Delinquency. Berkley:
University ~f California Press.
Hirschi, T. & Gottfredson, M. (1983). Age and the
explanation of crime. American Journal of Sociology,
89:552-584.

Sensation Seeking in Offenders
30
Lampe, P.E. (1978). Criminogenesis: is the criminal born
or made? Humanist, 38(5):12-15.
Laub, J. H. (1983). Urbanism, race, and crime. Journal of
Research in Crime and Delinquency, 20:183-198.
Loeber, R. and Dishion, T. (1983). Early predictors of
male delinquency: a review. Psychological Bulletin,
94:68-99.
Shannon, L. (1982). Assessing the relationship of adult
careers to juvenile careers: a summary. washington, DC:
Department of Justice.
Tabachnick, B. G., & Fidell, L. S. (1983). Using
Multivariate Statistics. New York: Harper & Row,
Publishers.
Thorne, G. L. (1971). The sensation-seeking scale with
deviant populations. Journal of Consulting and Clinical
Psychology, 37:106-110.
Tittle, C. R. (1980). Sanctions and Social Deviance: The
Question of Deterrence. New York: Praeger.
Tittle, C. R., & Villemez, W. J. (1977). Social class and
criminality. Social Forces, 56:474-502.
Tittle, C. R., Villemez, W. J., and Smith, D. A. (1978).
The myth of social class and criminality: an empirical
assessment of the empirical evidence. American
Sociological Review, 43:643-656.

Sensation Seeking in Offenders
31
West, D. J. & Farrington, D. P. (1973). Who Becomes
Delinquent? London: Heinemann Educational Books Ltd.
West, D. J. & Farrington, D. P. (1977). The Delinquent
Way of Life. London: Heinemann.
Wilson, J. Q. & Herrnstein, R. J. (1985). Crime and Human
Nature. New York: Simon and Schuster.
Winslow, R. W. (1976). Juvenile Delinquency in a Free
Society. Encino, CA: Dickenson Publishing Company, Inc.
Zuckerman, M. (1978). Sensation seeking and psychopaths.
In R. D. Hare and D. Schalling (Eds.), Psychopathic
Behavior: Approaches to Research. New York: Wiley.
Zuckerman, M. (1979). Sensation Seeking: Beyond the
Optimal Level of Arousal. Hillsdale, NJ: Lawrence Earlbaum
Associates, publishers.
Zuckerman, M. (1983). Biological Bases of Sensation-
seeking, Impulsivity, and Anxiety. Hillsdale, NJ: Lawrence
Earlbaum Associates, publishers.
zuckerman, M. (1984). Experience and desire: a new
format for sensation seeking scales. Journal of Behavioral
Assessment, 6(2):101-113.
Zuckerman, M. (1985). preliminary Manual for Form VI of
the Sensation Seeking Scale (SSS VI). (Available from
[Marvin Zuckerman, Dept. of Psychology, University of
Delaware, Newark, DE]).

Sensation Seeking in Offenders
32
Zuckerman, M., Eysenck, S., & Eysenck, H. J. (1978).
Sensation seeking in England and America: cross-cultural,
age, and sex comparisons. Journal of Consulting and
Clinical psychology, 46:139-149.

Table 1
Sensation Seeking in Offenders
33
Checks for Normality - Skewness and Kurtosis
GROUP 1 (NONOFFENDERS)
Scale Skewness / SE Skewness Kurtosis / SE Kurtosis
ETAS .335/.361 = .928 -.723/.709 = -1.02
ITAS -.418/.361 = -1.158 -.782/.709 = -1.103
EDIS .086/.361 = .238 -.514/.709 -.725
IDIS .035/ 361 = .097 -.119/.709 = -.168
DAQ -.402/.361 = -1.114 -.101/.709 = -.142
GROUP 2 (OFFENDERS)
Scale Skewness / SE Skewness Kurtosis / SE Kurtosis
ETAS .791/.361 = 2.19 .006/.709 = .008
ITAS .654/.361 = 1.812 .035/.709 = .049
EDIS -.501/.361 = -1.388 -.293/.709 = -.413
IDIS -.279/.361 = -.773 -.894/.709 = -1.261
DAQ .662/.361 = 1.834 -.179/.709 = -.253
Note. Skewness was significant only on the ETAS scale in
the Offender group.
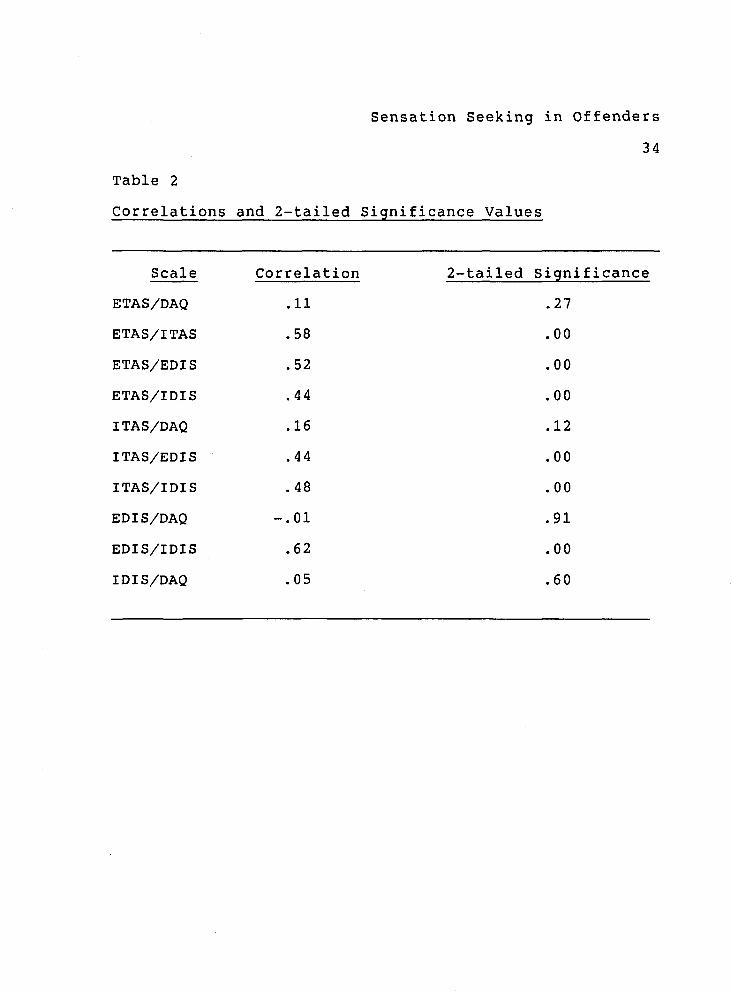
Table 2
Sensation Seeking in Offenders
34
Correlations and 2-tailed Significance Values
Scale Correlation 2-tailed Significance
ETAS/DAQ .11 .27
ETAS/ITAS .58 .00
ETAS/EDIS .52 .00
ETAS/IDIS .44 .00
ITAS/DAQ .16 .12
ITAS/EDIS .44 .00
ITAS/IDIS .48 .00
EDIS/DAQ -.01 .91
EDIS/IDIS .62 .00
IDIS/DAQ .05 .60

Table 3
Sensation Seeking in Offenders
35
Repeated Measures - Looking at Sequence Differences
GROUP 1 (NONOFFENDERS)
ETAS F(1,41) = .86, P = .359 (P > .05)
ITAS F{1,41) = 2.09, P = .156 (P > .05 )
EDIS F{1,41) = .60, P = .443 (P > .05 )
IDIS F{1,41) = .06, P = .800 (P > .05 )
DAQ F{1,41) = .00, P = .996 (P > .05)
GROUP 2 (OFFENDERS)
ETAS F{1,41) = 3.37, P = .074 (P > .05)
ITAS F{1,41) = .40, P = .531 (P > · 05)
EDIS F{1,41) = 8.43, P = .006 (P < · 05)
IDIS F{1,41) = 3.52, P = .068 (P > • OS)
DAQ F{1,41) = 1.07, P = .307 (P > • aS)
Note. The only significant F statistic is on the EDIS
scale for the offenders.

Table 4
Sensation Seeking in Offenders
36
Means for EDIS and IDIS According to Sequence of
Questionnaire Administration
GROUP SEQ U ENe E
SSS-DAQ DAQ-SSS
OFFENDERS
NONOFFENDERS
EOIS
94.86
88.59
lOIS
90.10
95.64
EOIS
79.00
85.09
lOIS
77.79
94.52

Table 5
Sensation Seeking in Offenders
37
Group Means and Univariate F-tests with (1,84) o. F.
VARIABLE MEANS
Nonoffender Offender F Statistic
Probabilit~
ETAS 23.047 19.512 14.259 .000
ITAS 42.186 34.465 14.515 .000
EOIS 86.884 89.698 .620 .433
lOIS 95.093 86.093 5.514 .021
OAQ 11. 093 9.907 2.999 .087

Table 6
Sensation Seeking in Offenders
38
Standardized Canonical Discriminant Function Coefficients
VARIABLE
ETAS
ITAS
EDIS
IDIS
DAQ
FUNCTION 1
0.68241
0.36402
-1.42312
0.98315
0.30341

Table 7
Sensation Seeking in Offenders
39
Classifications Table Resulting From Discriminant
Function Analysis
ACTUAL GROUP # OF CASES PREDICTED GROUP MEMBERSHIP
NONOFFENDER OFFENDER
NONOFFENDER 43 31 12
72.1% 27.9%
OFFENDER 43 3 40
7.0% 93.0%
Total of correctly classified cases 82.56%
ADULT OFFENDER 16 3 13
18.8% 81.3%

Table 8
Sensation Seeking in Offenders
40
Cronbach's Alpha - Reliability Analysis
Nonoffenders Offenders
DAQ(Activities) .406 .243
DAQ(Satisfaction) .529 .400
ETAS .733 .640
ITAS .889 .870
EDIS .900 .930
ITAS .901 .944

Table 9
Sensation Seeking in Offenders
41
Group Means and Univariate F-tests with (1,84) D. F. For
the Satisfaction Variables
VARIABLE MEANS
Nonoffender Offender F Statistic probability
DAQ9 .442 .186 1.38852 .242
DAQ10 .419 .000' 5.23385 .025
DAQ12 1. 070 -.930 64.74198 .000
Wilk's Lambda F{6,79)=15.88894, p < .01

Table 10
Sensation Seeking in Offenders
42
Classifications Table Resulting From Discriminant
Function Analysis (EDIS, IDIS, DAQ, DAQ9, DAQ10, DAQ12)
ACTUAL GROUP # OF CASES PREDICTED GROUP MEMBERSHIP
NONOFFENDER OFFENDER
NONOFFENDER 43 41 2
95.3% 4.7%
OFFENDER 43 8 35
18.6% 81.4%
Total of correctly classified cases 88.4%
ADULT OFFENDER 16 3 13
18.8% 81.3%
Note. The total percentage of correctly classified cases
increased; however, that increase occurred mainly in the
nonoffender group. The offender group's percentage of
correctly classified cases actually decreased.

Figure 1
Sensation Seeking in Offenders
43
Differences in Disinhibition Scores (Experience and
Intention) between offenders and nonoffenders .
99 • Nonoffenders
98 0 Offenders
97
96
95
94
93
92
91
90
89
88
87
86
85
84
83
82
EDIS lOIS

Sensation seeking in Offenders
44
INFORMED CONSENT
This is to inform you about your participation in a
research project which I am doing for my thesis. The
project consists of completing two (2) questionnaires
which are estimated to take about a total of thirty (30)
minutes to finish. The questionnaires consist of
questions about you and things that you have done and
things that you like to do. The only risks and/or
discomforts that are anticipated to occur in relation to
this project, is in answering some questions which you
may feel are personal in nature. I would like to assure
you that no one will see your answers on these
questionnaires except me and possibly the teachers who
are helping me with my thesis. In addition to this, my
project will compare the answers that you and others in
this setting give to answers that a group of people in a
different setting give; therefore, knowing precisely how
each of you answer each question is not of importance for
this project. It is very important to the results of my
research that you are as honest as possible and that you
answer all of the questions.
Aside from signing this please do not put your name
or any identifying marks on any of the papers which I
give you - this is to help assure each of you annonymity.
I promise that you will not be identified in any way as a

Sensation Seeking in Offenders
45
result of this research. I would also like to assure you
that the answers which you provide on these
questionnaires will not be used for any other purposes
except for my thesis.
I cannot tell you the precise nature of the project
right now, but I will be glad to inform each of you of
this after the questionnaires have been completed. If
you have any questions aside from this, please feel free
to ask me before the questionnaires are handed out. If
at any time during the administration of the
questionnaires you feel that you do not want to continue,
that is fine. You may discontinue participating in the
project without any hard feelings from me.
DATE Signature of Researcher

Sensation Seeking in Offenders
46
I have read the previous page and have had an
opportunity to ask questions about my participation in
the project. The description of the study identified any
discomforts or risks I might expect during and/or after
the project. I understand that my identity will be kept
confidential. My participation is entirely voluntary and
should I decide at any time during the project to end my
participation I am free to do so.
) I agree to participate in the project conducted by
Becky Fulper a graduate student at the University of
Richmond.
) I do not wish to participate in the project
DATE Signature of participant
If participant is under 18 years of age the responsible
adult should sign below.
Signature of Responsible Adult

Sensation seeking in Offenders
47
The Daily Activities Questionnaire (DAQ) was
developed to provide a checklist of the various
activities in which one engages. There are actually two
sections of the DAQ. The first section focuses on
activities in which one participates, or has participated
both in school and aside from school. The second section
focuses on one's satisfaction in school, on the job, and
in life in general. The items that were chosen are
general in nature and can be answered by anyone. This
questionnaire provides a guide for one to report any and
all activities in which he/she has engaged.

Sensation Seeking in Offenders
48
DAILY ACTIVITIES QUESTIONNAIRE
Following is a questionnaire which I would like for
you to complete. Please do not put your name or any
identifying marks on this questionnaire in order to
ensure your annonymity. The results will be used for
research purposes only. No one will see these
questionnaires except the researchers.
Because of the nature of the study, it is very
important that you be completely honest in your answers.
Please begin.
Age ___ _ Race ----Please check the highest grade in school which you have
completed:
8th grade or lower 1 year of college
9th grade 2 years of college
10th grade 3 years of college
11th grade 4 years of college
12th grade 5 years or more
Diploma? GED? Undergrad. Degree?
Vocational Certificate? Graduate Degree?
If you are still in school, check your educational goals?
High School Diploma?___ GED? Voc. School?
Military?__ Bachelor Degree?____ Grad. Degree?
*(Score 1 point for each blank checked except for the
grade level blanks.)

Sensation Seeking in Offenders
49
If presently in school, please circle the activities in
which you participate, or if not presently in school,
circle activities in which you participated when you were
in school:
Team SEorts Miscellaneous School Clubs/Org.
Football Tennis Concert Band Beta English
Baseball Swimming Marching Band FHA Math
Basketball Wrestling Color Guard FFA Science
Track Soccer Cheerleading FBLA History
Other Gymnastics Foreign Language
Other Other Other
Other Other Other
*(Score 1 point for each item circled)
Aside from school related activities, are you actively
involved in:
Any clubs or organizations? ---If yes, how many? ___ _
Any hobbies or special interest groups? ___ _
If yes, how many? ___ _
Any organized sports? ___ _
If yes, how many? ___ _
Going to church? ___ _
If yes, how often? ---*(Score 1 point for each "Yes"~ otherwise 0 points)

Sensation Seeking in Offenders
50
When you were growing up, how often did your family
(parents & brothers/sisters) engage in family activities
together within a year (movies, out to dinner, trips,
family reunions, sports, etc.)? Please circle answer.
Parentheses indicate number of times.
Never (0) Not very much (1 - 2) Sometimes (3 - 4)
Often (5 - 7) Very Often (8 - up)
*(Scoring is as follows: "Never" = 0;
"Not very much" = 1; "Sometimes" = 2; "Often" = 3;
"Very often" = 4)
Are you presently in school? ____ _
How much do or did you like school? Circle Answer
Not at all A little Okay Pretty much Very much
Are you presently employed? ____ _
How much do you like your job? Circle Answer
Not at all A little Okay Pretty much Very much
*(Scoring is as follows: "Not at all" = -2;
"A little" = -1; "Okay" = 0; "pretty much" = +1;
"Very much" = +2)
Have you ever done something that was not really legal,
for which you were not caught? Yes No
*(Score 0 points regardless of answer)
Have you ever been convicted of a crime?
If so, how many convictions? ----*(Score 0 points regardless of answer)
-----

sensation Seeking in Offenders
51
Have you ever been convicted of a violent crime? ____ _
Please list any offenses of which you have been
convicted:
*(Score 0 points regardless of answer.)
How much do you like the way your life is going at the
present time? Circle Answer
Not at all A little Okay Pretty much Very much
*(Score on the same scale, -2 to +2, as above.)
THANK YOU FOR YOUR COOPERATION!!

sensation Seeking in Offenders
52
Biography
Rebecca Fulper was born in Trenton, New Jersey, on
AprilS, 1959, and she was raised in Booneville,
Mississippi. She graduated from Booneville High School
in May 1977, and pursued a secondary education
immediately after at Mississippi State University in
Starkville, Mississippi. Rebecca obtained her Bachelor
of Arts degree from Mississippi State university in
August of 1981, and her major was psychology. She then
worked in the psychology area until 1984, when she was
accepted into the Psychology Graduate School at the
University of Richmond in Richmond, virginia. She
completed the requirements for her Master of Arts degree
in 1988.