senior secondary school in indonesia - world...
TRANSCRIPT

6/21/2010
1
Senior Secondary School in Indonesia
March 15th, 2010
Regional Conference on Benchmarking Education Systems for Results
Bangkok, Thailand
Roadmap
I. The Role of Senior Secondary Education
II. Measuring Senior Secondary Education Performance
a) Cognitive skills
b) Labor market outcomes
III. Tracking general (SMU) vs vocational (SMK)
a) Enrollment trends by track
b) Vocational curriculum
c) Labor market outcomes / employers’ perception
IV. Challenges
Increasing access to secondary
Improving skill formation
Improving the skill base
Improving the quality of teaching/learning in both tracks
Improving the relevance
Improving links with higher education

6/21/2010
2
Roadmap
I. The Role of Senior Secondary Education
II. Measuring Senior Secondary Education Performance
a) Cognitive skills
b) Labor market outcomes
III. Tracking general (SMU) vs vocational (SMK)
a) Enrollment trends by track
b) Vocational curriculum
c) Labor market outcomes / employers’ perception
IV. Challenges
Increasing access to secondary
Improving skill formation
Improving the skill base
Improving the quality of teaching/learning in both tracks
Improving the relevance
Improving links with higher education
The Role of Senior Secondary Education
Secondary education builds on the skills learned in basic education
and serves two main purposes:
a) Preparing students for higher education by increasing cognitive skills
The general track is designed mainly for this purpose
But the vocational track should also prepare students for further studies (17%
of vocational school graduates continue to higher education)
b) Providing mid-level skills for the labor market
The vocational track is geared to this purpose
But many general school graduates (60%) do not continue to higher education
Measuring the performance of the senior secondary school system
should consider both objectives

6/21/2010
3
The Role of Senior Secondary Education
While performance should measure both outcomes (cognitive and labor market), these are not only the competency of the formal education system Cognitive skills are built up overtime and depend not only on the education system, but
socioeconomic characteristics
Early grades are the most important, as learning deficits build up overtime
Learning deficits carried over cannot be compensated entirely in the secondary level
Education influences labor supply but outcomes depend also on the demand (macroeconomic trends/job creation/labor regulations)
The education system can prepare students for the labor market by providing a strong skill base
But job-specific skills are a shared responsibility
The education system cannot provide the specific skills required for all occupations
The education system can work together with firms to offer stronger linkages to improve the relevance of skills provided by the education system
But firms benefit from job-specific skills and as a consequence should bear at least part of the cost
It is important to delimit the responsibilities of senior secondary education to target policies more effectively and ensure effective linkages with labor market demands, but firms need to play a larger role in job-specific training
Roadmap
I. The Role of Senior Secondary Education
II. Measuring Senior Secondary Education Performance
a) Cognitive skills
b) Labor market outcomes
III. Tracking general (SMU) vs vocational (SMK)
a) Enrollment trends by track
b) Vocational curriculum
c) Labor market outcomes / employers’ perception
IV. Challenges
Increasing access to secondary
Improving skill formation
Improving the skill base
Improving the quality of teaching/learning in both tracks
Improving the relevance
Improving links with higher education

6/21/2010
4
Attainment is increasing (44% of 21-25 year olds who started primary school finish senior secondary school vs. only 33% of older generations)
But despite improvements in the younger generation, early drop-out is still a challenge (only 49% of students who start primary reach senior secondary school)
Regional comparisons show Indonesia with among the highest enrollment rates in primary education, but falling behind in higher levels (especially tertiary)
0 50 100 150
Tertiary
Senior Secondary
Junior Secondary
Primary
Gross Enrollment Rate (2006)
China
Thailand
Mongolia
Malaysia
Philippines
Vietnam
Cambodia
Lao PDR
Indonesia
Source: Susenas (2008)
Measuring coverage
20.0%
30.0%
40.0%
50.0%
60.0%
70.0%
80.0%
90.0%
100.0%
Starting Primary
Finish Primary
Starting JSS
Finish JSS Starting SSS
Finish SSS
21-25
31-35
41-45
In addition to improvements in attainment, PISA results show that cognitive skills
have improved in recent years
But 15 year old Indonesian students still perform far from OECD (average 500)
There are important inequalities in cognitive skills by socioeconomic characteristics
The biggest gains in scores since 2000 are in the richest deciles
320
340
360
380
400
420
440
460
1 2 3 4 5 6 7 8 9 10
PIS
A S
co
re
Socioeconomic decile
Reading 2000 Reading 2003 Reading 2006
Reading
320
340
360
380
400
420
440
460
1 2 3 4 5 6 7 8 9 10
PIS
A S
co
re
Socioeconomic decile
Math 2000 Math 2003 Math 2006
Math
Measuring cognitive skills
Source: PISA 2000-2006
6/21/2010
5
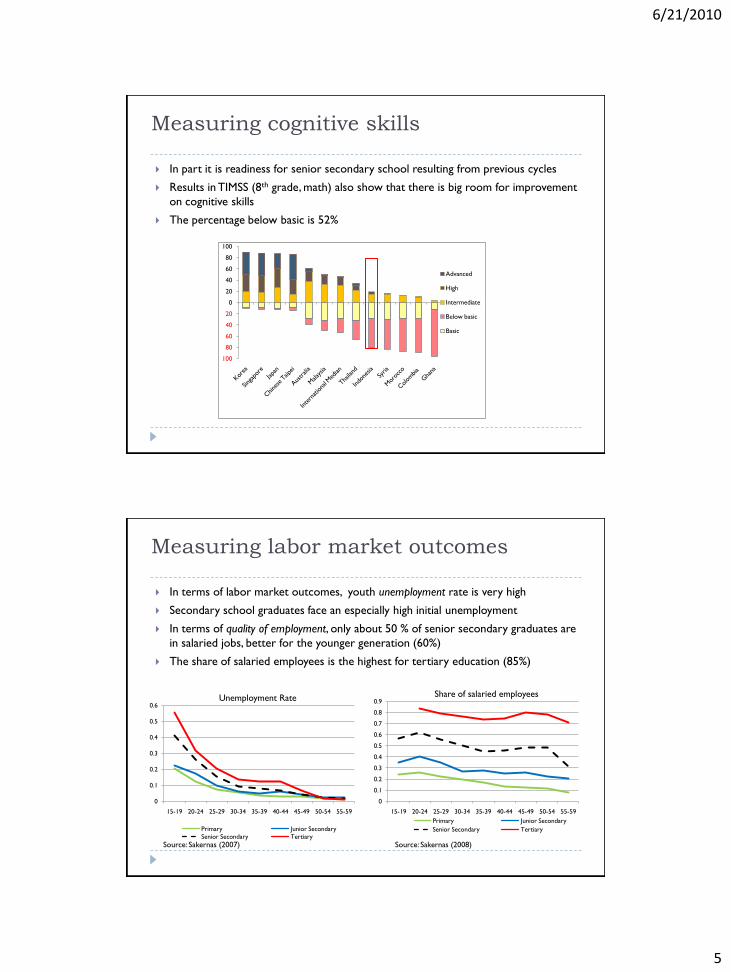
In part it is readiness for senior secondary school resulting from previous cycles
Results in TIMSS (8th grade, math) also show that there is big room for improvement
on cognitive skills
The percentage below basic is 52%
100
80
60
40
20
0
20
40
60
80
100
Advanced
High
Intermediate
Below basic
Basic
Measuring cognitive skills
0
0.1
0.2
0.3
0.4
0.5
0.6
0.7
0.8
0.9
15-19 20-24 25-29 30-34 35-39 40-44 45-49 50-54 55-59
Primary Junior Secondary
Senior Secondary Tertiary
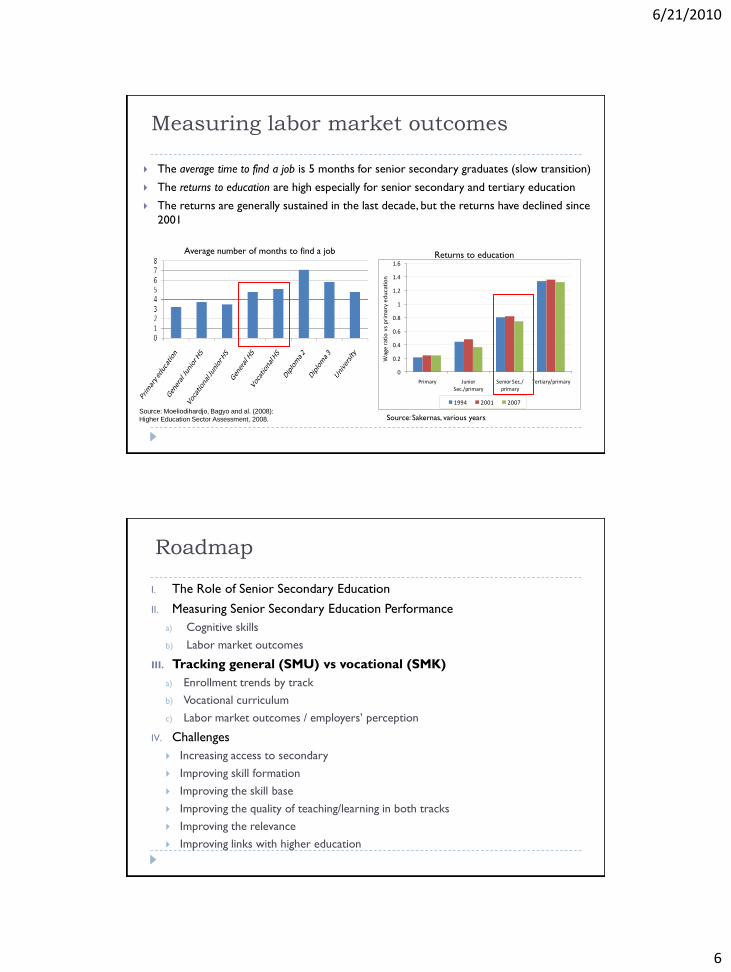
In terms of labor market outcomes, youth unemployment rate is very high
Secondary school graduates face an especially high initial unemployment
In terms of quality of employment, only about 50 % of senior secondary graduates are
in salaried jobs, better for the younger generation (60%)
The share of salaried employees is the highest for tertiary education (85%)
Unemployment Rate Share of salaried employees
Measuring labor market outcomes
Source: Sakernas (2007) Source: Sakernas (2008)
0
0.1
0.2
0.3
0.4
0.5
0.6
15-19 20-24 25-29 30-34 35-39 40-44 45-49 50-54 55-59
Primary Junior Secondary
Senior Secondary Tertiary
6/21/2010
6
The average time to find a job is 5 months for senior secondary graduates (slow transition)
The returns to education are high especially for senior secondary and tertiary education
The returns are generally sustained in the last decade, but the returns have declined since
2001
Measuring labor market outcomes
Source: Moeliodihardjo, Bagyo and al. (2008):
Higher Education Sector Assessment, 2008.
Average number of months to find a job
0
0.2
0.4
0.6
0.8
1
1.2
1.4
1.6
Primary Junior Sec./primary
Senior Sec./ primary
Tertiary/primaryW
age
rat
io v
s p
rim
ary
ed
uca
tio
n
1994 2001 2007
Returns to education
Source: Sakernas, various years
Roadmap
I. The Role of Senior Secondary Education
II. Measuring Senior Secondary Education Performance
a) Cognitive skills
b) Labor market outcomes
III. Tracking general (SMU) vs vocational (SMK)
a) Enrollment trends by track
b) Vocational curriculum
c) Labor market outcomes / employers’ perception
IV. Challenges
Increasing access to secondary
Improving skill formation
Improving the skill base
Improving the quality of teaching/learning in both tracks
Improving the relevance
Improving links with higher education

6/21/2010
7
Tracking begins in senior secondary education (at 9 years of schooling)
General track (SMA) has been 65-80% of enrollment in the past
Big push for vocational schooling since 2006 (48 % of enrollment in 2009)
Enrollment trends by track
Source: Ministry of National Education, (MoNE)
34%
36%
38%
40%
42%
44%
46%
48%
1994
1995
1996
1997
1998
1999
2000
2001
2002
2003
2004
2005
2006
2007
2008
Share of enrollment in Vocational Track Total Enrollment by Track
VET School in Indonesia
The push for VET sought to improve employability by balancing the skills of
recent graduates
Types of vocational school (6,025 total, 78% private):
Business and Management (SMEA), 47 percent of schools
Technical and Industry (STM), 39 percent
A small percentage in specific industries: Agriculture and Forestry; Community
Welfare; Tourism; Arts and Handicraft; Health and Marine.
Program Public Private Total Each Program as
Percentage of total
Business & Management 600 2415 3015 47%
Technology & Industry 534 1991 2525 39%
Tourism 121 274 395 6.10%
Agriculture & Forestry 110 90 200 3.10%
Community Welfare 39 65 104 1.60%
Art & Handicraft 52 32 84 1.30%
Marine 27 39 66 1%
Health 0 33 33 0.50%
Total 1483 4939 6422 100%
Number of Vocational and Technical Schools

6/21/2010
8
15
Student characteristics:
Vocational school is still considered a second option by many (ratio of applicants to entrants is much higher for general track)
Vocational school currently serves students with worse academic qualifications
Vocational school serves a poorer segment of the population
0 20 40 60 80 100
Public SMA
Public SMK
Private SMA
Private SMK
Percent
Share of SMA and SMK Students by Consumption Quintiles
Poorest 20% Middle 60% Richest 20%
Student characteristics
Source: MoNE
1
1.1
1.2
1.3
1.4
1.5
1.6
4.5
4.7
4.9
5.1
5.3
5.5
5.7
5.9
General Vocational General Vocational
Public Private
Rati
o o
f ap
plican
ts t
o E
ntr
an
ts
Avera
ge E
BT
AN
AS
Sco
re
Math
Ratio Aplicants/entrants
The out-of-pocket cost is higher for the vocational than for the general track
The out-of-pocket cost of attendance has increased significantly in recent years,
especially for vocational and for higher education
Public SMK has the highest operational unit cost, but it is not much higher than
public SMA. Private SMA and private SMK also have similar unit cost
The higher out-of-pocket cost of vocational school is due to the higher
percentage of private schools
Cost of attendance
0
1,000,000
2,000,000
3,000,000
4,000,000
5,000,000
6,000,000
Primary Junior Secondary
Senior Secondary:
General
Senior Secondary: Vocational
Higher EducationA
nn
ual O
ut-
of-
Po
cket
Co
st (
no
min
al
Rp
)
2006
2003
Source: Susenas 2003, 2006 education modules Source: IFLS (2007)
-
500,000
1,000,000
1,500,000
2,000,000
2,500,000
u_other u_donation u_committee u_routine
u_bop u_grant u_bos
Out-of-pocket expenditures Unit cost

6/21/2010
9
Labor market outcomes by track
The unemployment rate of graduates of both tracks is similar
Traditionally vocational school has been better at facilitating entry into the
labor market, but the differences have disappeared in recent years
The wage premium was also higher for SMK, but both have converged
The vocational school is no longer better than the general track at facilitating
labor market entry
57
91
11
31
51
71
92
1
Une
mplo
ym
ent R
ate
(%
)
19911992
19931994
19951996
19971998
19992000
20012002
20032004
20052006
2007
Year
SMA SMK
0
0.2
0.4
0.6
0.8
1
1.2
1994 1997 1999 2001 2003 2005 2007
High school general/
primary
High school
vocational/ primary
Tertiary/primary
Unemployment rate Skill premium
Source: Sakernas, various years, Di Gropello (2009),
Source: Sakernas, various years
Roadmap
I. The Role of Senior Secondary Education
II. Measuring Senior Secondary Education Performance
a) Cognitive skills
b) Labor market outcomes
III. Tracking general (SMU) vs vocational (SMK)
a) Enrollment trends by track
b) Vocational curriculum
c) Labor market outcomes / employers’ perception
IV. Challenges
Increasing access to secondary
Improving skill formation
Improving the skill base
Improving the quality of teaching/learning in both tracks
Improving the relevance
Improving links with higher education

6/21/2010
10
Still too few students reach senior secondary education, especially from poor
backgrounds and from rural areas
Improving the efficiency of the system in earlier grades is fundamental to making
secondary education more effective
Guarantee enough supply of good quality schools and evaluate possible ways to
support demand (scholarships)
9.9%17.1%
22.6%33.2%
43.8%
7.5%
12.8%
16.8%
24.0%
31.7%
0.0%
10.0%
20.0%
30.0%
40.0%
50.0%
60.0%
70.0%
80.0%
Poorest Quintile 2 Quintile 3 Quintile 4 RichestPublic Private
Gross Enrollment Rates by Consumption Quintile
Source: World Bank, Susenas (2007)
Gross Enrollment Rates Urban / Rural
66.3%
40.1%
0.0%
10.0%
20.0%
30.0%
40.0%
50.0%
60.0%
70.0%
80.0%
Urban Rural
Source: World Bank, Susenas (2007)
Increasing access to secondary
The role of the senior secondary education needs to be defined and the linkages
with the broader context strengthened
Secondary Education curriculum can provide:
Academic skills (subject-matter) are the most obvious competency of the education system
Generic skills (problem-solving or thinking skills, communication skills, team work), recent
evidence from World Bank Employer Skills Survey indicate that these are valued by employees
and the curriculum should reflect these preferences
But other skills need complementary actions/policies
Soft skills (conduct or behavior) are largely the result of previous experiences and
socioeconomic characteristics. Secondary education can partly compensate for these, but the
interventions need to occur earlier
Technical skills (occupation specific)
Transferable skills (entrepeneurship, common processes) should be part of the curriculum
Non-transferable skills are better acquired through job-specific training and job experience
and should be the competency of employers, but should have strong linkages with the formal
education sector to explore synergies
Improving skill formation

6/21/2010
11
Improving the skill base
Given the increased dynamism of the demands in the labor market, workers need more
adaptable skills instead of narrowly focused skills to facilitate life-long learning
Implications for the formal education sector:
Clear demand for basic academic skills (math and literacy) but the skill gap is more clear in generic skills
(“thinking skills”) and soft skills (“behavioral skills”)
Stronger base of thinking skills and theoretical knowledge is needed for senior secondary school graduates
Technical Skills that can be met by education sector (computer and English) should be strengthened
Curriculum should include more basic (math and literacy) and general skills in both tracks
Increase time of instruction in math and literacy in SMK
0
0.1
0.2
0.3
0.4
0.5
0.6
Basic skills Thinking skills Theoretical knowledge
Practical knowledge
Experience in same field
Skills rated as “very important” by employers
Improving the quality of both tracks
Quality of learning/teaching matters in both tracks
Graduates of both tracks feel it needs to be improved
Graduates of SMK are more concerned than graduates of SMA about the
quality of learning/teaching and quality of facilities
Some evidence that SMA graduates who do not continue to higher education
feel the general track should be more relevant for the labor market
Perception of graduates of each track of the main weaknesses
Source: World Bank Employers Skills Survey (2008)
0.0
5.0
10.0
15.0
20.0
25.0
30.0
35.0
Quality of learning/teaching Facilities Curriculum Relevance
General (SMA) Vocational (SMK)
6/21/2010
12
Improving the relevance
Employers care more about actual knowledge and experience than about the
type of degree
General track is designed for further skills acquisition in higher education, but
many students do not continue. Increasing transition is part of improving its
relevance but there are also indications that more generic skills
(thinking/problem solving) may improve its relevance
Vocational track needs to also include more basic and generic skills, in order to
be create more adaptable graduates and it should also have stronger
connection of with the private sector and local governments to identify
present and future demands
But practical training is expensive to provide outside the firm, and firms
benefit from the results of the training so firms should contribute to the
financing
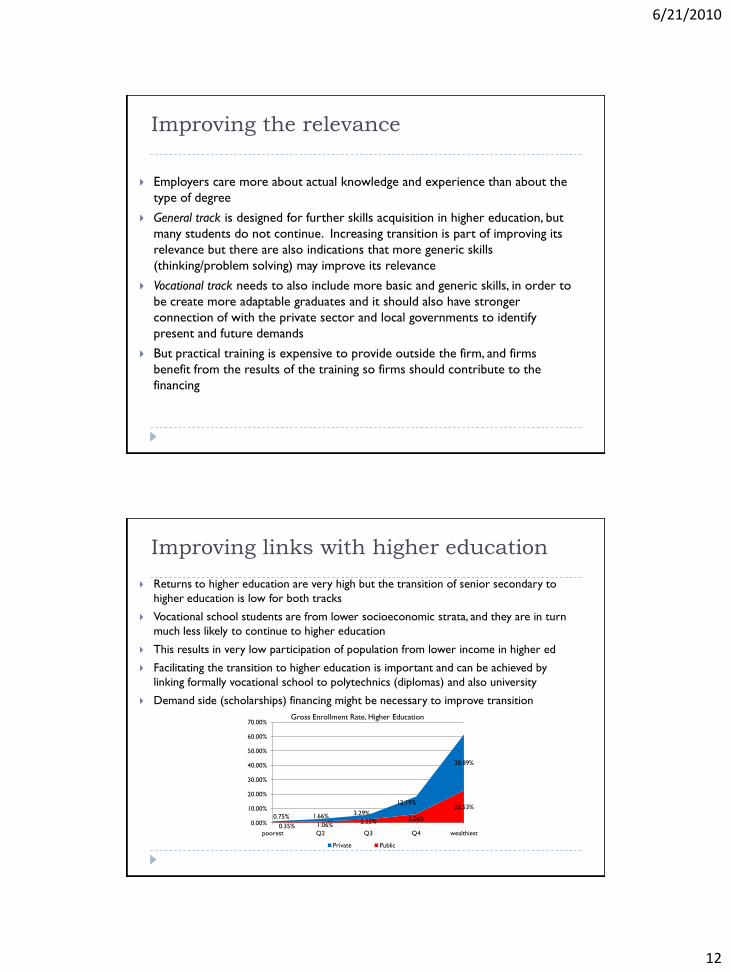
Improving links with higher education
Returns to higher education are very high but the transition of senior secondary to
higher education is low for both tracks
Vocational school students are from lower socioeconomic strata, and they are in turn
much less likely to continue to higher education
This results in very low participation of population from lower income in higher ed
Facilitating the transition to higher education is important and can be achieved by
linking formally vocational school to polytechnics (diplomas) and also university
Demand side (scholarships) financing might be necessary to improve transition
0.35% 1.06%2.35% 6.06%
22.53%
0.75% 1.66% 3.29%
12.19%
38.89%
0.00%
10.00%
20.00%
30.00%
40.00%
50.00%
60.00%
70.00%
poorest Q2 Q3 Q4 wealthiest
Private Public
Gross Enrollment Rate, Higher Education

6/21/2010
13
Measuring the performance of secondary school needs to take into account both cognitive
skills and labor market performance of graduates
The role of senior secondary education cannot be providing all the general and practical skills
demanded in the labor market, but it should provide strong basic and generic skills that
are in high demand and that can serve as a strong base for life-long learning
Tracking can work. Vocational school can be an effective option to provide mid-level skills,
but the quality and relevance of vocational school needs to be addressed
The acquisition of skills is multi-faceted and firms should take a more active role in
developing relevant practical skills that benefit them, by financing non-formal training and
providing on-the-job training (internships)
Coverage and quality of both tracks need to improve. Quality should be emphasized as
enrollments increase, and new policies need to be in place to improve efficiency and
equity (scholarships)
Higher education linkages. Transition rates from the general track are still low. There is also
a need to improve linkages of the vocational track to reduce inequality in access to higher
education. Vocational school need not be the final cycle
In summary
Thank you!
6/21/2010
14
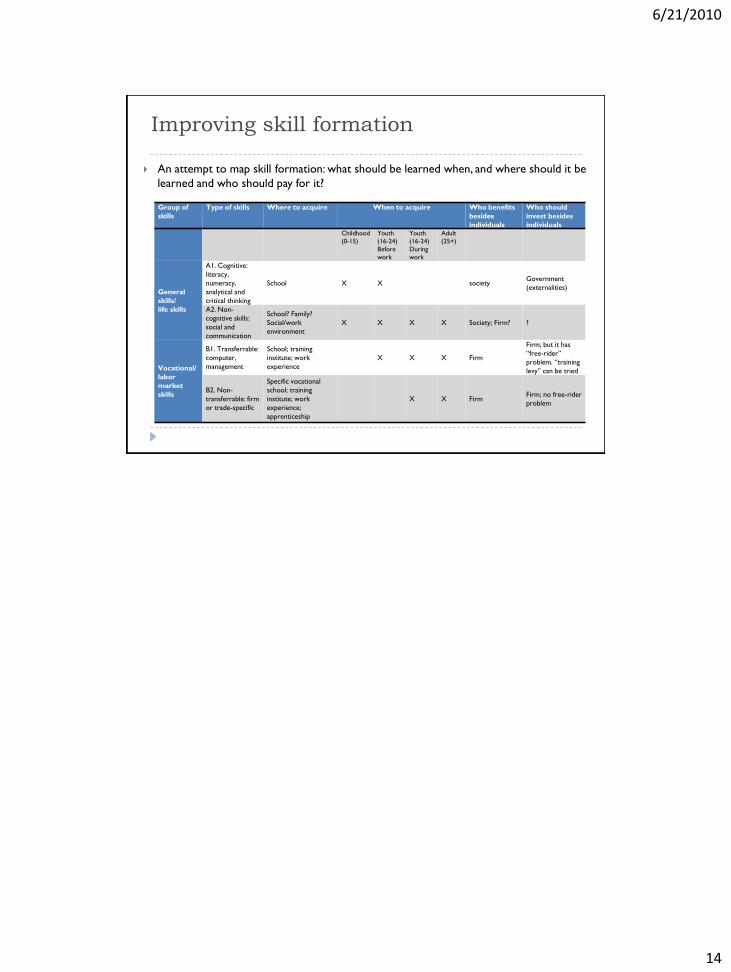
Improving skill formation
An attempt to map skill formation: what should be learned when, and where should it be
learned and who should pay for it?
Group of
skills
Type of skills Where to acquire When to acquire Who benefits
besides
individuals
Who should
invest besides
individualsChildhood
(0-15)
Youth
(16-24)
Before
work
Youth
(16-24)
During
work
Adult
(25+)
General
skills/
life skills
A1. Cognitive:
literacy,
numeracy,
analytical and
critical thinking
School X X societyGovernment
(externalities)
A2. Non-
cognitive skills:
social and
communication
School? Family?
Social/work
environment
X X X X Society; Firm? ?
Vocational/
labor
market
skills
B1. Transferrable:
computer,
management
School; training
institute; work
experience
X X X Firm
Firm; but it has
“free-rider”
problem. “training
levy” can be tried
B2. Non-
transferrable: firm
or trade-specific
Specific vocational
school; training
institute; work
experience;
apprenticeship
X X FirmFirm; no free-rider
problem