senate financial affairs committee meeting · pdf filethe material described here can be found...
TRANSCRIPT

New York University University Senate Financial Affairs Committee
Agenda
October 6, 2016
Kimmel Center 60 Washington Square South, Room 905
1. Introductions
2. Organization and Schedule of Future Meetings
3. Call for Budget Policy Topics for Discussion at Future Meetings
4. Fiscal 2017 NYU Budget
5. Other business The items listed below can be accessed on the SFAC WIKI at: https://wikis.nyu.edu/display/SFAC 1. Membership list 2. Fiscal 2018 Budget Development Schedule – Key Dates 3. List of past topical presentations 4. Fiscal 2017 Budget 5. Historical Financial Data 6. Moody’s Rating Report 7. S&P’s Rating Report 8. Fiscal 2015 Audited Financial Statements (Excerpt*)
SENATE FINANCIAL AFFAIRS COMMITTEE MEETING SCHEDULE
FALL 2017
DAY TIME LOCATION THU OCT 6, 2016 11AM Kimmel Center, Room 905 WED NOV 9, 2016 1:30PM President’s Conference Room Bobst Library, 12th Floor MON NOV 28, 2016 1:30PM Libraries’ Conference Room Bobst Library, Room 1135 Dates for Spring 2017 will be added in JAN 2017 *The entire document can be found at the WIKI under date of this meeting.

University Senate 2016-2017 Financial Affairs Committee
Name Council Email Michael Avgerinos SSC [email protected]
Akash Das SSC [email protected]
Joseph Ehrenkranz SSC [email protected]
Amanda Ezechi SSC [email protected]
Rose Liu SSC [email protected]
Joseph Onwughalu SSC [email protected]
Peter Shivery SSC [email protected]
Nicholas Economides T-FSC [email protected]
Andre Fenton T-FSC [email protected]
Maurizio Porfiri T-FSC [email protected]
Adam Ramey T-FSC [email protected]
Arun Sundararajan T-FSC [email protected]
Jamie Skye Bianco C-FSC [email protected]
Leila Jahangiri C-FSC [email protected]
Tommy Lee C-FSC [email protected]
Jon Ritter C-FSC [email protected]
Susan Stehlik C-FSC [email protected]
John DeSantis AMC [email protected]
Carrie Meconis AMC [email protected]
Meredith Rendall AMC [email protected]
Dominic Brewer Deans [email protected]
Dennis Di Lorenzo Deans [email protected]
Trevor Morrison Deans [email protected]
Robert Berne*** Senior Univ. Admin. [email protected]
Martin Dorph** Senior Univ. Admin. [email protected]
Andrew Hamilton*,** Senior Univ. Admin. [email protected]
Anthony Jiga*** Senior Univ. Admin. [email protected]
Marc Wais (For Provost)** Senior Univ. Admin. [email protected]
Names of Alternate Senators appear in italics * Committee Chair ** Ex-officio *** Advisor

Trustee Finance Committee Monday, September 26, 2016
*Senate Financial Affairs Committee Thursday, October 6, 2016
*Senate Financial Affairs Committee Wednesday, November 9, 2016
*Senate Financial Affairs Committee Monday, November 28, 2016
Trustee Finance Committee Wednesday, December 14, 2016
*Senate Financial Affairs Committee TBD
Trustee Finance Committee Tuesday, February 21, 2017Preliminary fiscal 2018 budget
*Senate Financial Affairs Committee TBD
*Senate Financial Affairs Committee TBD
Trustee Finance Committee TBD - May 2017Fiscal 2018 budget - review
*Senate Financial Affairs Committee TBD
Trustee Finance Committee Tuesday, June 12, 2017Fiscal 2018 budget - recommend and approve
Board of Trustees Wednesday, June 13, 2017
9/20/2016
Approve fiscal 2018 budget
FISCAL 2018 BUDGET PREPARATION SCHEDULE
KEY DATES
Preliminary Budget recommendations for FY18 to be submitted to the SFAC - FEB 1, 2017Final budget recommendations for FY18 to be submitted to the SFAC - MAR 31, 2017

SFAC Topical Presentations Academic Years 2014-15, and 2013-14
The material described here can be found at the SFAC WIKI under “Archives” Academic Year 2015-16 11.5.15 Post-Graduate Success (Trudy Steinfeld) On WIKI Home Page for 2015-16 11.5.15 Alumni Engagement (Brian Perillo) On WIKI Home Page for 2015-16 Academic Year 2014-15
1.21.15 Fundraising On WIKI Home Page for 2014-15 Various Meetings Divestment On WIKI Home Page for 2014-15
Academic Year 2013-14
11.26.13 Information Technology NOT AVAILABLE 1.6.14 Fringe Benefits In the minutes for the date of this meeting 2.21.14 Student Financial Aid In the minutes for the date of this meeting
Budget Recommendation Memos for FY 17
4.18.16 T-FSC On WIKI Home Page for 2015-16 3.29.16 C-FSC On WIKI Home Page for 2015-16 2.10.16 AMC On WIKI Home Page for 2015-16 3.29.16 SSC On WIKI Home Page for 2015-16

Financial Condition and Fiscal 2017 Budget
Senate Financial Affairs Committee October 6, 2016

Overview of Financial Documentation • NYU Operating and Capital budgets
– University only – Cash basis – Reviewed by Finance Committee and presented to Board each June
• Budget on NYU’s website – http://www.nyu.edu/about/news-publications/budget.html
• NYU Audited Financial Statements (Fiscal Year 9/1 – 8/31) – Includes “University” (with NYU Abu Dhabi, NYU Shanghai in NY, Global Programs),
Medical School, and NYU Hospital Corp. (Med School and NYUHC combined are NYU Langone Medical Center)
– Reviewed by Audit Committee and presented to Board each December – http://www.nyu.edu/employees/resources-and-services/financelink/accounting-and-
reporting/financial-statements.html
• Other Financial Reports Available
– NYU 990 (Tax Return) http://www.nyu.edu/employees/resources-and-services/financelink/tax.html
– Credit Reports (NYU rated AA-/Aa3)
2

Rating Agency Perspective on NYU Financial Condition
3
• NYU (University and SOM) debt is rated “Aa3” (positive outlook) and “AA-” (stable outlook) by Moody’s Investor’s Service and Standard & Poor’s, respectively.
• Rating Strengths:
o Size and scope of operations o Exceptional enrollment and student demand profile o Successful history of fundraising o Real estate assets o Strong clinical demand o Quality of management, strategy and risk management
• Rating Weaknesses:
o Relatively high leverage and low levels of financial resources relative to peers o Relatively low endowment per student o Relatively high exposure to clinical care on a consolidated basis.

University and NYU Langone Medical Center Consolidated Budget
The operating budgets that are proposed for fiscal 2017 total $9.4 billion. The budget presentation in the pages that follow is for the $3.1 billion University budget that is exclusive of the NYU Langone Medical Center.
4
University 1 2.892$ 36% 3.076$ 33% 0.184$ 6.4%School of Medicine2 2.251 28% 2.525 27% 0.274 12.2%Hospitals Center2 2.904 36% 3.840 41% 0.936 32.2%Total 8.046$ 100% 9.441$ 100% 1.395$ 17.3%
Notes
2. The fiscal 2017 budgets are expressed prior to eliminations of intra-Medical Center revenues of $ .520 billion.
Fiscal 2017 Proposed Operating Budget Compared with Fiscal 2016 Budget
FY2016 FY2017 Variance
1. All parts of New York University other than the NYU Langone Medical Center, i.e., the School of Medicine and the Hospitals Center. The Hospitals Center is comprised of Tisch Hospital; Lutheran Hospital; Rusk Institute of Rehabilitation Medicine; NYU Hospital for Joint Diseases; and the Perlmutter Clinical Cancer Center.

5
6

7

8
RevenueTuition & Fees Net of Financial Aid 1,639 57% 1,699 55% 59 4%
Undergraduate 1,166 1,229 63 Graduate & Professional 790 837 47 Non-credit 41 50 9 Summer and Other 120 131 11 Fees 82 83 0 Financial Aid (560) (630) (70)
Gifts & Pledges 126 4% 147 5% 21 17%Endowment Distribution and Other Investment Income 125 4% 132 4% 7 6%Grants and Contracts 436 15% 531 17% 95 22%Real Estate 74 3% 81 3% 6 9%Housing/Dining & Other Auxiliary Enterprises
Student Housing & Dining 300 10% 316 10% 16 5%All Other Auxiliary Operations 54 2% 43 1% (11) -20%
Dental Patient Care 47 2% 46 2% (1) -2%All Other Revenue 81 3% 81 3% (0) -1%Total Revenue 2,883 100% 3,076 100% 193 7%
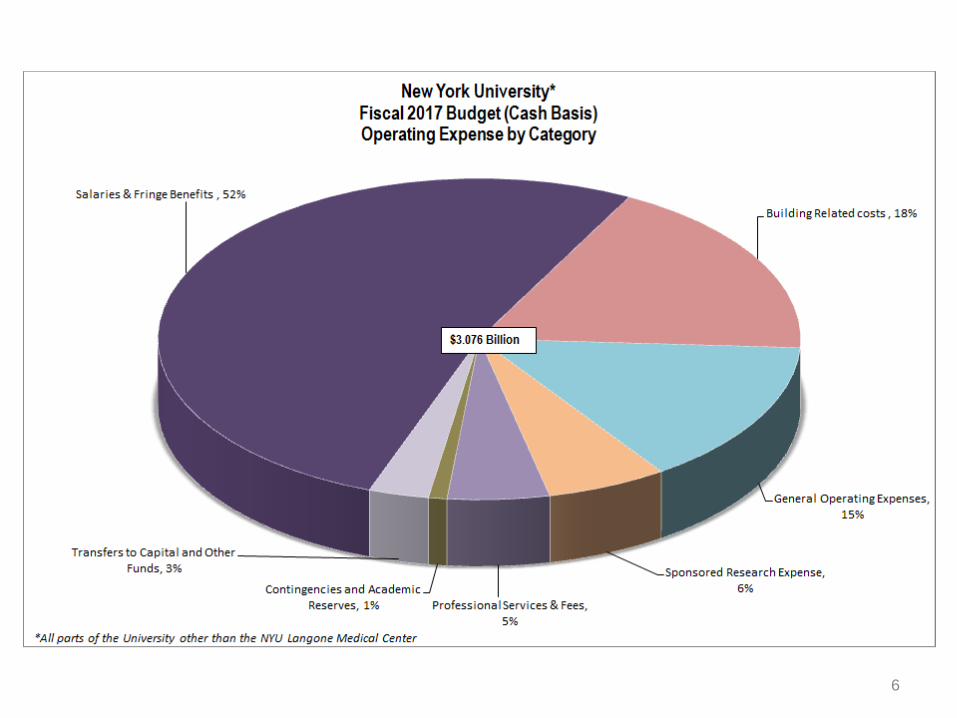
0Expense Salaries & Fringe Benefits 1,552 54% 1,605 52% 53 3%Sponsored Research Expense 115 4% 186 6% 71 62%Building Related Costs 510 18% 558 18% 48 9%General Operating Expenses 457 16% 448 15% (9) -2%Professional Services & Fees 144 5% 157 5% 13 9%Contingencies and Academic Investment Funds 15 1% 28 1% 14 94%Transfers to Capital and Other Funds 90 3% 93 3% 3 3%Total Expense 2,883 100% 3,076 100% 193 7%
*All parts of the University other than the NYU Langone Medical Center
New York UniversityFiscal 2017 Operating Budget (Cash Basis)*
(dollars in millions )
Fiscal 2016Original Budget
Fiscal 2017Proposed Budget
Increase / (Decrease)From the Prior Year

10/5/2016 9
20,566 20,969 21,327 21,269 21,638 22,252 22,603 22,973 23,526 26,287 27,437 28,273
16,047 16,477 17,013 17,454 18,286 18,243 18,119 18,557 18,448
20,749 20,802 20,639 3,391
3,428 3,443 3,466
3,480 3,457 3,512 3,461 3,536
3,540 3,503 3,479
-
10,000
20,000
30,000
40,000
50,000
60,000
2006 2007 2008 2009 2010 2011 2012 2013 2014 2015 2016 2017
Student Enrollment - 2006 through 2017*
Professional
Graduate
Undergraduate
Data Source(s): University institutional research data, as reported on the CDS. Data collected and reported as of the fall semester each year (example: fiscal 2013 data from October-November 2012).
. *2017 Enrollment data is preliminary and not as of Census. 2015 includes the addition of NYU Tandon School of Engineering
Change Change
CAGR Undergraduate 7,707 37.5% 2.9% Graduate 4,592 28.6% 2.3% Professional 88 2.6% 0.2% Total 12,387 31.0% 2.5%

Freshman Student Charges for Fiscal 2017
10
Budget % Increase Budget % IncreaseFiscal 2017 Over Prior Year Fiscal 2017 Over Prior Year
Tuition2 46,590$ 2.9% 45,180$ 3.5%Mandatory University Fee3 2,472 0.0% 1,455 0.0%Subtotal Tuition and Fees 49,062 2.7% 46,635 3.4%
Room (ex Abu Dhabi and Shanghai) 12,626 -0.2% 11,128 -0.2%Board (ex Abu Dhabi and Shanghai)4 4,932 0.0% 2,600 0.0%Subtotal Room and Board 17,558 -0.1% 13,728 -0.1%
Total Freshman Charges 66,620$ 2.0% 60,363$ 2.6%
Notes
4. $4,932 will be the annual price of the typical 300 meal per semester "flex" dining plan, which averages 19 meals per week.
Washington Square Schools and Portal
Campuses1Tandon School of
Engineering
1. The tuition and fee charges for the Abu Dhabi portal campus and for international students at the Shanghai portal campus are expected be the same as the charges for the College of Arts and Science at Washington Square. Room and board charges, however, are different than the charges at Washington Square.
3. School-based fees are in addition to the mandatory University fee and vary by school and course of study. Such fees range from a low of $50 per semester to as high as $10,214 per year for DDS students in the College of Dentistry who pay lab fees and rent their dental instruments.
2. The tuition charge for Stern and the Tisch School of the Arts will be $47,138 and $51,410, respectively, in fiscal 2017. The tuition for the Tandon School reflects the same proportinate change from plan as the tuition for all other schools. However, Tandon's rate of in tuition will continue to be higher than other schools until tuition is at parity with College of Arts and Science in FY 2021.

Undergraduate Student Charges – Comparison With 25 Private Universities
11 Revised May 5, 2016
Among the schools listed, Columbia has the highest total student charges ($68,494), Chicago is 2nd ($67,584), USC is 3rd ($66,631), Duke is 4th ($66,626), and NYU is 5th ($66,620).
Note: Data were collected from college and university websites and the Phillips-Scholarship.org and CollegeBoard.org websites
New York University 2.7% -0.1% 2.0%Washington University 3.5% 2.1% 3.1%Johns Hopkins 2.9% 4.0% 3.2%Carnegie Mellon University 3.2% 3.4% 3.3%Cornell University 3.7% 1.6% 3.3%Northeastern University 3.1% 3.9% 3.3%Emory University 3.5% 2.7% 3.4%Boston University 3.7% 2.4% 3.4%Stanford University 3.5% 3.5% 3.5%Dartmouth 3.5% 3.5% 3.5%Northwestern 3.6% 3.7% 3.6%Georgetown University 4.0% 2.7% 3.7%George Washington University 3.7% 3.7% 3.7%Duke University 4.1% 2.9% 3.8%University of Pennsylvania 3.9% 3.9% 3.9%University of Southern California 4.0% 3.6% 3.9%Harvard University 4.0% 3.7% 3.9%Yale University 3.9% 3.9% 3.9%Barnard College 4.0% 4.0% 4.0%Columbia University 4.0% 4.0% 4.0%University of Miami 4.0% 4.0% 4.0%Fordham University 4.0% 4.0% 4.0%University of Chicago 4.6% 2.2% 4.0%Brown University 4.1% 3.9% 4.1%Princeton University 4.8% 4.8% 4.8%Boston College 5.8% 2.4% 5.1%Mean 3.8% 3.3% 3.7%Median 3.9% 3.6% 3.8%Low 2.7% 0.0% 2.0%High 5.8% 4.8% 5.1%
For the 12 months ending June 2015:Higher Educ Price Index (HEPI) - Private Doctoral Institutions 2.5%CPI - All Urban Consumers 0.1%CPI - New York Metro Area Consumers 0.1%
Fiscal 2017 Percentage Change Over Fiscal 2016
Tuition & Fees
Room & Board
Total Student Charges
Fiscal 2017 Undergraduate Student Charges
NYU 49,062$ 17,558$ 66,620$
Mean 50,197$ 14,741$ 64,938$ Median 50,603$ 14,853$ 65,338$ Low 45,540$ 12,500$ 60,375$ High 55,120$ 17,558$ 68,494$
*Columns are not intended to add across to Total Student Charges
Room & Board
Total Student
Charges*Tuition &
Fees

Undergraduate Financial Aid Base Financial Aid Budget • The budget for Washington Square schools provides
for an average discount rate for all undergrads of about 25%, while the discount rate for the School of Engineering is approximately 40% in fiscal 2017.
• The discount rate for entering freshmen who receive aid across all NYU New York schools is 23.4% in fiscal 2017 (preliminary) .
Financial Aid Initiatives • The $1 billion Momentum Campaign provides new
funding to maintain, and over time increase, base financial aid budgets.
12

Undergrad Financial Aid – Comparison with 25 Private Universities
Note: Data sorted by FY15 percentage values.
Institution Name FY15 FY14 FY13 FY12Fordham University 90% 89% 92% 88%University of Miami 82% 73% 70% 69%George Washington University 77% 66% 65% 64%Northeastern University 70% 69% 71% 72%University of Chicago 61% 62% 63% 59%Princeton University 59% 62% 60% 60%University of Southern California 55% 59% 59% 62%Northwestern University 54% 54% 54% 54%Harvard University 52% 56% 58% 61%Columbia University in the City of New York 51% 46% 49% 50%New York University (excl. NYUAD/NYUSH) 51% 52% 46% 55%Carnegie Mellon University 50% 53% 54% 61%Stanford University 50% 51% 53% 55%Boston University 48% 51% 53% 49%Johns Hopkins University 48% 48% 47% 47%Yale University 48% 50% 50% 54%Barnard College 47% 45% 39% 43%University of Pennsylvania 47% 50% 51% 47%Cornell University 46% 47% 50% 52%Dartmouth College 46% 47% 44% 41%Brown University 45% 46% 46% 44%Washington University in St Louis 45% 51% 47% 47%Duke University 43% 44% 47% 49%Emory University 43% 49% 45% 53%Boston College 41% 42% 44% 42%Georgetown University 39% 41% 41% 47%Source: National Center for Education Statistics (NCES)
Percent of Freshmen Receiving Institutional Grant Aid
Institution Name FY15 FY14 FY13 FY12Harvard University 100% 100% 100% 100%Yale University 95% 93% 98% 95%Princeton University 95% 92% 83% 87%Columbia University in the City of New York 92% 84% 82% 80%Stanford University 90% 92% 87% 88%Dartmouth College 87% 86% 87% 84%Duke University 87% 84% 89% 87%University of Pennsylvania 81% 80% 81% 80%Barnard College 80% 82% 76% 79%Brown University 79% 82% 78% 75%Georgetown University 77% 79% 76% 73%Emory University 74% 68% 66% 67%Johns Hopkins University 73% 77% 83% 80%Boston College 73% 71% 71% 72%Cornell University 72% 72% 77% 79%Northwestern University 70% 70% 69% 67%Washington University in St Louis 68% 66% 67% 62%Northeastern University 67% 63% 60% 55%University of Chicago 67% 62% 64% 61%Boston University 63% 61% 61% 55%University of Southern California 62% 60% 60% 63%New York University (excl. NYUAD/NYUSH) 61% 54% 55% 42%Carnegie Mellon University 58% 56% 49% 51%University of Miami 53% 57% 58% 61%Fordham University 52% 51% 48% 46%George Washington University 51% 58% 56% 56%Source: National Center for Education Statistics (NCES)
Among Those Freshman Receiving Aid, Aid as a Percent of Tuition and Fees
In fiscal 2015, NYU awarded $84.6 million in institutional grants to 3,003 freshmen, not including NYU Abu Dhabi and NYU Shanghai
13

Freshmen Receiving Pell Grants – Comparison with 25 Private Universities
Data sorted by FY15 percentage
In general, students with a total family income up to $50,000 may be eligible for Pell Grants, though most Pell funding in institutions across the nation goes to students with a total family income below $30,000. Pell Grant maximums are established by the federal government; for fiscal 2016 the maximum is $5,775 per academic year. Some schools enroll Pell students at times other than the start of the Fall term, resulting in those students not being included in reports of full-time, first-time freshmen. For example, only 18% of the freshmen cohort at Columbia University receives Pell grants, but 30% their total undergraduate population are reported to be Pell grant recipients. This indicates that the university is admitting significant numbers of Pell-eligible students in January and as transfer students.
Full Time, First-Time Freshman Cohort
Institution Name FY15 FY14 FY13 FY12 New York University 23% 23% 20% 23%Barnard College 20% 21% 18% 20%Fordham University 20% 19% 20% 18%Brown University 19% 19% 17% 15%Columbia University in the City of New York 18% 16% 15% 16%Emory University 18% 20% 19% 21%Princeton University 18% 15% 14% 12%University of Southern California 18% 18% 18% 20%Cornell University 15% 15% 15% 17%Harvard University 15% 17% 15% 18%Stanford University 15% 15% 14% 16%University of Miami 15% 17% 18% 15%Boston University 14% 15% 15% 13%Dartmouth College 14% 14% 12% 13%Yale University 14% 11% 13% 12%Northeastern University 13% 11% 15% 13%University of Pennsylvania 13% 14% 15% 17%Boston College 12% 12% 15% 12%Duke University 12% 13% 14% 14%George Washington University 12% 14% 12% 12%Georgetown University 12% 13% 14% 16%Johns Hopkins University 12% 13% 15% 13%Northwestern University 12% 15% 14% 14%Carnegie Mellon University 11% 14% 13% 15%University of Chicago 11% 11% 12% 11%Washington University in St Louis 8% 6% 5% 6%Source: National Center for Education Statistics (NCES)
14

Sponsored Research
• Externally funded research was $220 million in FY2015, up from $121 million in 2009.
• Approximately $57 million of the $99 million increase was due to NYUAD and the merger with Tandon.
• Research revenue is offset by an equal amount of expense so that after capital and other expenses, research does not provide a direct financial benefit.
• Research does serve as a major influence in attracting top-quality faculty and students, thereby providing an indirect budgetary benefit.
15

Endowment Spending and Gifts
• NYU’s spending from endowment equals about 4% of budget, significantly less than its competitor institutions.
• Overall (including SOM) NYU’s annual fundraising totals have exceeded $600 million in each of the past two years, roughly a 50% increase since 2009.
• NYU fundraising, exclusive of the SOM has more than doubled since 2009 to $366 million in 2015.
• Of the $366 million raised by and for the University, $105 million was for endowment; $261 million was expendable.
• Of the $261 million expendable, only $112 million was unrestricted.
16

Faculty Salaries
2015-2016 Comparison Data from American Association of University Professors (AAUP). Nine-month average salaries not including Medical School: • NYU Full Professors: $205,600 (6th overall in
AAUP universe of 227 doctoral institutions)
• NYU Associate Professors: $120,200 (19th)
• NYU Assistant Professors: $115,000 (11th)
17

Historical Financial Data Fiscal 2003 – Fiscal 2015 Comparison
Senate Financial Affairs Committee October 6, 2016

Table of Contents
Overview 3
Operating Results 4
Balance Sheet Results 6
Student Enrollment 7
Employee Headcount and Base Salaries
2 10/5/2016

10/5/2016 3
The terms "New York University" and "NYU", as used throughout the presentation, refer to the University and its global sites and portal campuses, but exclude the NYU Langone Medical Center (i.e., the School of Medicine and the Hospitals), unless otherwise noted. The fiscal 2015 financial numbers include NYU Abu Dhabi and the New York-only portion of the NYU Shanghai budget.
Overview

10/5/2016 4
Operating Revenue by Category – 2003 and 2015
Data Source(s): NYU's annual operating budget reports
Net Tuition, Fees and Financial Aid,
$773.2 million, 59%
Gifts & Pledges , $63.3 million, 5%
Investment income/Endowmen
t distribution , $62.4 million, 5%
Grants, Contracts & Indirect Cost
Recovery, $82.8 million, 6%
Real Estate, $35.8 million, 3% Auxiliary
Housing/Dining, $214.4 million, 16%
All Other Revenue, $78.3 million, 6%
2003
$1,314.0 million
(dollars in millions)Change % Change CAGR
Net Tuition, Fees and Financial Aid 788.2$ 101.9% 6.0%Gifts & Pledges 64.2$ 101.4% 6.0%Investment income/Endowment distribution 54.0$ 86.5% 5.3%Grants, Contracts & Indirect Cost Recovery 77.8$ 89.7% 5.5%Real Estate 42.8$ 119.7% 6.8%Auxiliary Housing/Dining 124.1$ 57.9% 3.9%All Other Revenue 263.2$ 336.2% 13.1%Revenue Total 1,414.2$ 107.6% 6.3%
Net Tuition, Fees and
Financial Aid, $1,561.4 million,
57%
Gifts & Pledges , $127.5 million,
5%
Investment income/Endow
ment distribution ,
$116.3 million, 4%
Grants, Contracts & Indirect Cost
Recovery, $164.4 million,
6%
Real Estate, $78.6 million,
3% Auxiliary
Housing/Dining, $316.1 million,
12%
All Other Revenue, $341.5
million, 13%
2015
$2,728.2 million

10/5/2016 5
Operating Expense by Category – 2003 and 2015
Data Source(s): NYU's annual operating budget reports
Salaries and Fringe Benefits,
$1,493.2 million, 55%
Gov't and sponsored research
expenses , $112.2 million,
4%
Building Related Expenses,
$295.7 million, 11%
Service Contracts and Fees, $122.2 million, 4%
Other Non-Personnel Costs, $477.8 million,
17%
Contingencies and Academic
Reserves, $17.4 million, 1%
Capital Expenses and Transfers, $209.8 million,
8%
2015
$2,728.2 million
(dollars in millions)Change % Change CAGR
Salaries and Fringe Benefits 806.6$ 117.5% 6.7%Gov't and sponsored research expenses 42.7$ 61.4% 4.1%Building Related Expenses 94.5$ 47.0% 3.3%Service Contracts and Fees 82.4$ 207.6% 9.8%Other Non-Personnel Costs 206.9$ 76.4% 4.8%Contingencies and Academic Reserves 17.4$ N/A N/ACapital Expenses and Transfers 163.7$ 355.2% 13.5%Expense Total 1,414.2$ 107.6% 6.3%
Salaries and Fringe Benefits, $686.6
million, 52%
Gov't and sponsored research
expenses , $69.5 million, 5%
Building Related Expenses, $201.1
million, 15%
Service Contracts and Fees, $39.7
million, 3%
Other Non-Personnel Costs,
$270.9 million, 21%
Capital Expenses and Transfers,
$46.1 million, 4%
2003
$1,314.0 million

10/5/2016 6
Assets – 2003 and 2015
Data Source(s): NYU's audited financial statements
(dollars in millions)Change % Change CAGR
Cash, Cash Equivalents and Short-Term Investments 448.7$ 123.2% 6.9%Accounts and Loans Receivable, Net 297.7$ 193.1% 9.4%Contributions Receivable, Net 97.0$ 45.1% 3.1%Other Assets 97.6$ 346.6% 13.3%Deposits with Trustees (37.4)$ -47.5% -5.2%Collateral for Securities Loaned (64.4)$ -100.0% -100.0%Long-Term Investments 1,644.2$ 156.2% 8.2%Land, Buildings, and Equipment, Net 2,248.2$ 174.8% 8.8%Assets Total 4,731.6$ 145.9% 7.8%
Cash, Cash Equivalents and
Short-Term Investments,
$364.3 million, 11%
Accounts and Loans Receivable,
Net, $154.1 million, 5%
Contributions Receivable, Net,
$215.3 million, 7%
Other Assets, $28.2 million, 1%
Deposits with Trustees, $78.7
million, 2%
Collateral for Securities
Loaned, $64.4 million, 2%
Long-Term Investments ,
$1,052.5 million, 32%
Land, Buildings, and Equipment,
Net, $1,286. million, 40%
2003 Cash, Cash
Equivalents and Short-Term
Investments, $813. million, 10%
Accounts and Loans Receivable,
Net, $451.8 million, 6%
Contributions Receivable, Net,
$312.3 million, 4%
Other Assets, $125.8 million, 2%
Deposits with Trustees, $41.3
million, 0%
Long-Term Investments ,
$2,696.7 million, 34%
Land, Buildings, and Equipment,
Net, $3,534.1 million, 44%
2015
$3,244 million $7,975 million

10/5/2016 7
Liabilities and Net Assets – 2003 and 2015
Data Source(s): NYU's audited financial statements
(dollars in millions)Change % Change CAGR
Accounts Payable and Accrued Expenses 120.9$ 85.1% 4.1%Accrued Benefit and Postretirement Obligation 345.2$ N/A 10.8%Asset Retirement Obligation 164.5$ 24.2% N/ABonds and Notes Payable 1,821.8$ 500.5% 11.5%Deferred Revenue 419.7$ 696.1% 6.6%Federal Grants Refundable 17.9$ 2.6% 2.2%Permanently Restricted Net Assets 699.8$ 1086.1% 6.1%Securities Loan Agreements Payable (64.4)$ -38.8% -100.0%Temporarily Restricted Net Assets 494.3$ 55.5% 12.2%Unrestricted Net Assets 711.8$ 21.9% 5.0%Liabilities and Net Assets Total 4,731.6$ 145.9% 7.8%
Accounts Payable and
Accrued Expenses,
$317.9 million, 4%
Accrued Benefit and
Postretirement Obligation,
$487.3 million, 6%
Asset Retirement Obligation,
$164.5 million, 2%
Bonds and Notes Payable,
$2,500.6 million, 32%
Deferred Revenue,
$783.7 million, 10%
Federal Grants Refundable,
$78.2 million, 1%
Permanently Restricted Net
Assets, $1,380.7 million, 17%
Temporarily Restricted Net Assets, $660.3
million, 8%
Unrestricted Net Assets,
$1,601.8 million, 20%
2015
$7,975 million
Accounts Payable and Accrued
Expenses, $197. million, 6%
Accrued Benefit and
Postretirement Obligation, $142.1
million, 4%
Bonds and Notes Payable, $678.8
million, 21%
Deferred Revenue, $364. million, 11%
Federal Grants Refundable, $60.3
million, 2%
Permanently Restricted Net Assets, $680.8 million, 21%
Securities Loan Agreements
Payable, $64.4 million, 2%
Temporarily Restricted Net Assets, $166. million, 5%
Unrestricted Net Assets, $890. million, 28%
2003
$3,244 million

10/5/2016 8
20,566 20,965 21,327 21,269 21,638 22,252 22,603 22,973 23,526 26,287
16,047 16,477 17,013 17,454 18,286 18,243 18,119 18,557 18,448
20,749 3,391 3,428
3,443 3,466 3,480 3,457 3,512 3,461 3,536
3,540
40,004 40,870 41,783 42,189
43,404 43,952 44,234 44,991 45,510
50,576
-
10,000
20,000
30,000
40,000
50,000
60,000
FY2006 FY2007 FY2008 FY2009 FY2010 FY2011 FY2012 FY2013 FY2014 FY2015
Student Enrollment - FY2006 through FY2015
Professional
Graduate
Undergraduate
Data Source(s): University institutional research data, as reported on the CDS. Data collected and reported as of the fall semester each year (example: fiscal 2013 data from October-November 2012).
* Historical data limitations prohibit accurate school-level student enrollment reporting prior to 2006.
2015 includes the addition of NYU Tandon School of Engineering
Change % Change CAGRUndergraduate 5,721 27.8% 2.5%Graduate 4,702 29.3% 2.6%Professional 149 4.4% 0.4%Total 10,572 26.4% 1.4%

U.S. PUBLIC FINANCE
CREDIT OPINION20 May 2016
New Issue
Contacts
Karen Kedem 212-553-3614VP-Sr Credit Officer/[email protected]
Susan I Fitzgerald 212-553-6832Associate [email protected]
Michael Osborn [email protected]
New York University, NYNew Issue - Moody's assigns Aa3 to New York University'sSeries 2016A & B; outlook positive
Summary Rating RationaleMoody’s Investors Service has assigned a Aa3 rating to New York University, NY’s plannedissuance of $858 million of fixed rate revenue bonds, Series 2016 ($600 million Series 2016Atax-exempt and $258 million Series 2016B taxable). Concurrently, we affirmed the Aa3rating on $2.2 billion of NYU's rated debt outstanding. NYU's outlook is positive.
New York University’s Aa3 reflects its increasing global brand as a comprehensiveresearch university with geographically diversified locations, robust revenue growthfrom strengthening clinical demand, enhanced risk management to mitigate complexbusiness model, and highly valuable and marketable real estate not included in our wealthcalculations. The rating also reflects NYU's very high leverage and reliance on patient care forhalf of operating revenue in a very fragmented and competitive market.
Our analysis is based on a consolidated view of New York University, which include theuniversity and the NYU Hospitals Center (NYUHC). Moody's maintains an A3 rating andpositive outlook on $1.3 billion of NYUHC's rated debt.
Credit Strengths
» Relatively rapid transformation to a globally competitive, research-intensive university,with a presence in more than 40 countries
» Large size and scope of operations, $7.4 billion of operating revenue, provides diversityand economies of scale
» Substantial amount of highly marketable real estate holdings in New York City, with abook value of $4.7 billion (university and medical school only)
» Strong clinical demand contributing to robust hospital operating performance
» Significantly improved monitoring and oversight capacity for this large and complexorganization

MOODY'S INVESTORS SERVICE U.S. PUBLIC FINANCE
This publication does not announce a credit rating action. For any credit ratings referenced in this publication, please see the ratings tab on the issuer/entity page onwww.moodys.com for the most updated credit rating action information and rating history.
2 20 May 2016 New York University, NY: New Issue - Moody's assigns Aa3 to New York University's Series 2016A & B; outlook positive
Credit Challenges
» Very high leverage, including operating leases and a modest pension liability
» Exposure to the profitability of clinical care from an A3 rated organization for over half of revenue, with hospitals operating in afragmented and competitive market
» Moderate liquidity for such a large and complex organization, mitigated by modest potential calls and committed bank lines
» Complexity of business lines and diverse locations highlight the importance of coordinated oversight and skilled management
Rating OutlookThe positive outlook reflects our expectation that NYU has reached its peak borrowing and its very high leverage will begin tomoderate over time. The outlook also incorporates the expectation of continued strengthening of clinical and student demand,contributing to strong cash flow and ongoing excellent fundraising.
Exhibit 1
Robust Revenue Growth Supports Rising Debt
Source: Moody's Investors Service
Factors that Could Lead to an Upgrade
» Reduction of leverage
» Smooth presidential transition, demonstrated by ongoing fundraising success, and continued strengthening of clinical operations
Factors that Could Lead to a Downgrade
» Credit deterioration of NYUHC, particularly if operating cash flow narrows
» Further increase in financial leverage, given already high debt levels at both the university and NYUCH

MOODY'S INVESTORS SERVICE U.S. PUBLIC FINANCE
3 20 May 2016 New York University, NY: New Issue - Moody's assigns Aa3 to New York University's Series 2016A & B; outlook positive
Key Indicators
Exhibit 2
Source: Moody's Investors Service
Recent DevelopmentsRecent developments are incorporated in detailed rating considerations.
Detailed Rating ConsiderationsMarket Profile: Global Brand Bolstered by Diverse Locations and Large Research EnterpriseNew York University's relatively rapid transformation to a globally competitive research university reflects the successful alignmentof its locations, programs, and branding. Ongoing evaluation of and investments in academic offerings, student services, and facilitiescontribute to NYU's excellent strategic positioning. NYU's investments in the recently consolidated engineering school, formerlyNYU Poly, combined with New York City's initiatives to expand applied science, engineering, and technology transfer will drive strongpositive momentum.
The university has translated its multiple locations into enrollment growth and healthy increases in student-generated revenue. NYUis one of the nation's largest private universities with nearly 45,500 full-time equivalent students. Enrollment increased nearly 20%between fall 2009 and 2015, excluding students at NYU Abu Dhabi, NYU Shanghai, and its school of engineering.
One measure of NYU's strengthening reputation is the geographic diversity of its student body. In 2015, international studentscomprised 17% of undergraduate enrollment, up from 6% in 2008. As a comprehensive urban university, NYU will continue to attracta disproportionate share of enrollment from outside the US relative to the national average of 4%.
NYU's global brand extends beyond its diverse enrollment in New York City to international campuses and centers. At the forefrontof international expansion for the sector, NYU established campuses in Abu Dhabi and Shanghai, with enrollment planned to grow to3,000 and 4,200 students, respectively. NYU's financial liability for these campuses is limited due to its partnership agreements withthe Abu Dhabi and Shanghai governments. NYU's 11 international sites have academic offerings developed by NYU faculty and tailoredto take advantage of local academic strengths.
The robust growth of NYU's research profile also helps solidify its global recognition. Research and other sponsored programexpenditures nearly doubled in five years to a high $931 million in FY 2015. The growth trends are exceptional during a prolongedperiod of flat federal funding.
Operating Performance: Consistently Favorable Performance, Highly Reliant on HealthcareNYU continues its track record of favorable operations, reflecting robust performance of its healthcare operations, enhancedmonitoring tools, and improved giving. In FY 2015, the consolidated organization generated a positive but moderate operatingmargin of 2.4%. Management projects that operations for FY 2016 will be similar or stronger than FY 2015. NYU's size provides it

MOODY'S INVESTORS SERVICE U.S. PUBLIC FINANCE
4 20 May 2016 New York University, NY: New Issue - Moody's assigns Aa3 to New York University's Series 2016A & B; outlook positive
with economies of scale, particularly helpful since it operates in a high cost location. With 52% of operating revenue derived fromhealthcare operations, the profitability of NYUHC is critical to improving cash flow to support debt service.
NYUHC has generated robust and growing operating income each year, reaching near peak performance in FY 2015 with a 6.2%operating margin (including a $50 million combined “mission payment” and equity transfer to the School of Medicine). Managementattributes financial momentum to improvement in managed care rates, growth of high acuity patient volume, increased patient flowefficiencies, improved coding, and expense containment. Though outpatient is a substantial piece of NYUHC’s current clinical mixand future expansion strategies, inpatient clinical care complexity, as measured by Medicare Case Mix, was a very high 2.2 in FY 2015evidencing the center’s strong inpatient footing.
Strong patient care growth has continued in FY 2016, including the merger with Lutheran Medical Center. With approximately one-third of historic admissions to NYUHC from Brooklyn, Lutheran will further strengthen the organization's presence and differentiate itfrom peer academic medical centers that have focused expansion north of New York City.
With a focus on affordability and modest enrollment growth, the pace of increased student generated revenue will slow. For fall 2016,NYU projects the lowest tuition increase of its peers and continues to invest in growing financial aid. Funding for financial aid has beenbolstered by a $1 billion fundraising initiative. Tuition, fees, and auxiliary revenue represented 28% of NYU's operating revenue in FY2015.
Wealth and Liquidity: Substantial Marketable Real Estate Mitigates Lower Wealth MetricsThe university's substantial real estate holdings, not included in our wealth metrics, help mitigate otherwise modest measures ofrelative wealth compared to peers. In FY 2015, the university and medical school had a $4.7 billion book value for plant and equipment,rising to $7.3 billion when including NYUHC. While NYU does not have plans to monetize these real estate assets, it representssignificant financial flexibility. In FY 2015, spendable cash and investments provided a moderate 0.5 times cushion to operatingexpenses. Continued solid cash flow and improved fundraising will strengthen traditional measures of wealth over time.
Fundraising will play an increasingly important role in NYU's strategic plans, bolstering financial aid and addressing capital needs.NYU's enrollment growth and transition to a traditional residential student contribute to increased giving potential. In FY 2015, NYUhad annual gift revenue of $435 million, with FY 2016 forecasted to be in line. Continued fundraising success during a presidentialtransition will be critical to the university's upward rating momentum.
NYU's sizeable endowment has historically lagged long-term performance of peer institutions. With the recent hiring of a new chiefinvestment officer and some investment staff members, the university is focused on improving performance while maintaining arelatively liquid portfolio. As of December 31, 2015, NYU reports that half of its long-term endowment could be liquidated within 30days. The investment team is reviewing manager performance and terms and working to reduce fees and expenses.
LIQUIDITY
While strengthening, the university's own liquidity is moderate for a large, complex organization that has experienced volatility froma number of external events. At the end of FY 2015, NYU could operate for 155 days based on unrestricted cash and investments thatcould be liquidated within one month. In addition to its own liquidity, NYU has $700 million of committed bank facilities from threedifferent banks. The university's history of deftly managing extraordinary circumstances, positive operations, debt profile, and limitedleverage in its investment portfolio mitigate more moderate liquidity.
Leverage: Very High Leverage Expected to ModerateFollowing the Series 2016 debt issuance, NYU will have reached its peak long-term borrowing. Our calculations of NYU's leverageincludes capitalization of operating leases which have been used extensively by the university. NYU's spendable cash and investmentsprovide thin coverage of pro-forma total debt of 0.8 times, which falls to a narrower 0.6 times when including operating leases and arelatively modest pension liability. As noted above, leverage does not account for NYU's substantial real estate value. Management hasnot identified any additional borrowing plans at this time. NYU's pro-forma debt burden is moderate compared to its leverage, withpro-forma debt to operating revenue of 0.7 times and maximum annual pro-forma debt service coverage of 1.6 times in FY 2015.

MOODY'S INVESTORS SERVICE U.S. PUBLIC FINANCE
5 20 May 2016 New York University, NY: New Issue - Moody's assigns Aa3 to New York University's Series 2016A & B; outlook positive
DEBT STRUCTURE
An overwhelming majority of NYU's debt is issued in a fixed rate mode and amortizes, providing predictability for budgeting andhelping to reduce leverage over time. The university and hospitals center have used bank lines to fund capital projects which they laterrefund with long-term debt. NYU has diversity of counterparties and expiration dates on the lines. The bank lines are variable rate,with current rates significantly lower than what NYU budgets for fixed rate debt. While the lines have material adverse change clauses,adding liquidity risks, we anticipate relatively modest use of the lines following this debt issuance.
DEBT-RELATED DERIVATIVES
The university does not have any debt-related interest rate swap agreements.
PENSIONS AND OPEB
NYU has a modest exposure to pension and other post-employment health benefits. A majority of employees participate in a definedcontribution plan. Like many peers, the university made changes to its benefits in the wake of the recession to reduce its futureobligations. NYU also participates in multi-employer defined benefit pension plans related to certain union collective bargainingagreements. Less than 10% of total liabilities relate to pension and OPEB obligations.
Governance and Management: Strengthened Planning and Oversight Mitigate ComplexitySignificant investment in enterprise systems and risk management provide management with the tools to oversee a large and complexorganization. Over the last four years, management centralized and elevated the role of risk management, created dashboards to trackperformance, and leveraged data collection to better utilize resources. Recent investments in infrastructure to improve monitoring andoversight should contribute to operating efficiencies and nimbleness to adapt to changing market preferences. While managementcontinues to refine planning and processes, NYU has demonstrated that it can adeptly handle significant events and industry changes.
In January 2016, the university appointed a new president after the retirement of a long-serving prior president. The new president'sexperience at research intensive universities with high international enrollment should contribute to a smooth transition. Consistentwith presidential transitions, there are some new members of the leadership team, bringing fresh perspectives to complimentestablished management teams with deep institutional knowledge.
Legal SecurityThe Series 2016A and 2016B bonds are unsecured general obligations of the University and the School of Medicine.
For bonds issued through DASNY before 2008, repayment is a general obligation of the university, secured by tuition, fees, and otheruniversity revenue equal to Maximum Annual Debt Service. The Series 1998A and 2001A bonds also have a cash funded debt servicereserve fund. Given the university's strong credit rating and relatively small enhancement provided by these additional features, wehave not made a rating distinction between the series.
Use of ProceedsBond proceeds will be used to finance various capital projects, partially refund bank lines of credit, and pay the costs of issuance.
Obligor ProfileNew York University is a large, comprehensive, research-intensive university serving nearly 45,500 full-time equivalent students on itscampuses in Manhattan, Brooklyn, Abu Dhabi, and Shanghai. The university's sizeable enrollment, robust research enterprise, and highacuity academic medical center generated more than $7.2 billion in revenue in FY 2015.
MethodologyThe principal methodology used in this rating was Global Higher Education published in November 2015. Please see the RatingsMethodologies page on www.moodys.com for a copy of this methodology.

MOODY'S INVESTORS SERVICE U.S. PUBLIC FINANCE
6 20 May 2016 New York University, NY: New Issue - Moody's assigns Aa3 to New York University's Series 2016A & B; outlook positive
Ratings
Exhibit 3
New York University, NYIssue RatingRevenue Bonds, Series 2016A (Tax Exempt) Aa3
Rating Type Underlying LTSale Amount $600,000,000Expected Sale Date 06/01/2016Rating Description Revenue: 501c3 Unsecured
General ObligationRevenue Bonds, Series 2016B (Taxable) Aa3
Rating Type Underlying LTSale Amount $258,000,000Expected Sale Date 06/01/2016Rating Description Revenue: 501c3 Unsecured
General ObligationSource: Moody's Investors Service

MOODY'S INVESTORS SERVICE U.S. PUBLIC FINANCE
7 20 May 2016 New York University, NY: New Issue - Moody's assigns Aa3 to New York University's Series 2016A & B; outlook positive
© 2016 Moody's Corporation, Moody's Investors Service, Inc., Moody's Analytics, Inc. and/or their licensors and affiliates (collectively, "MOODY'S"). All rights reserved.
CREDIT RATINGS ISSUED BY MOODY'S INVESTORS SERVICE, INC. AND ITS RATINGS AFFILIATES ("MIS") ARE MOODY'S CURRENT OPINIONS OF THE RELATIVE FUTURE CREDITRISK OF ENTITIES, CREDIT COMMITMENTS, OR DEBT OR DEBT-LIKE SECURITIES, AND CREDIT RATINGS AND RESEARCH PUBLICATIONS PUBLISHED BY MOODY'S ("MOODY'SPUBLICATIONS") MAY INCLUDE MOODY'S CURRENT OPINIONS OF THE RELATIVE FUTURE CREDIT RISK OF ENTITIES, CREDIT COMMITMENTS, OR DEBT OR DEBT-LIKESECURITIES. MOODY'S DEFINES CREDIT RISK AS THE RISK THAT AN ENTITY MAY NOT MEET ITS CONTRACTUAL, FINANCIAL OBLIGATIONS AS THEY COME DUE AND ANYESTIMATED FINANCIAL LOSS IN THE EVENT OF DEFAULT. CREDIT RATINGS DO NOT ADDRESS ANY OTHER RISK, INCLUDING BUT NOT LIMITED TO: LIQUIDITY RISK, MARKETVALUE RISK, OR PRICE VOLATILITY. CREDIT RATINGS AND MOODY'S OPINIONS INCLUDED IN MOODY'S PUBLICATIONS ARE NOT STATEMENTS OF CURRENT OR HISTORICALFACT. MOODY'S PUBLICATIONS MAY ALSO INCLUDE QUANTITATIVE MODEL-BASED ESTIMATES OF CREDIT RISK AND RELATED OPINIONS OR COMMENTARY PUBLISHEDBY MOODY'S ANALYTICS, INC. CREDIT RATINGS AND MOODY'S PUBLICATIONS DO NOT CONSTITUTE OR PROVIDE INVESTMENT OR FINANCIAL ADVICE, AND CREDITRATINGS AND MOODY'S PUBLICATIONS ARE NOT AND DO NOT PROVIDE RECOMMENDATIONS TO PURCHASE, SELL, OR HOLD PARTICULAR SECURITIES. NEITHER CREDITRATINGS NOR MOODY'S PUBLICATIONS COMMENT ON THE SUITABILITY OF AN INVESTMENT FOR ANY PARTICULAR INVESTOR. MOODY'S ISSUES ITS CREDIT RATINGSAND PUBLISHES MOODY'S PUBLICATIONS WITH THE EXPECTATION AND UNDERSTANDING THAT EACH INVESTOR WILL, WITH DUE CARE, MAKE ITS OWN STUDY ANDEVALUATION OF EACH SECURITY THAT IS UNDER CONSIDERATION FOR PURCHASE, HOLDING, OR SALE.
MOODY'S CREDIT RATINGS AND MOODY'S PUBLICATIONS ARE NOT INTENDED FOR USE BY RETAIL INVESTORS AND IT WOULD BE RECKLESS AND INAPPROPRIATE FORRETAIL INVESTORS TO USE MOODY'S CREDIT RATINGS OR MOODY'S PUBLICATIONS WHEN MAKING AN INVESTMENT DECISION. IF IN DOUBT YOU SHOULD CONTACTYOUR FINANCIAL OR OTHER PROFESSIONAL ADVISER. ALL INFORMATION CONTAINED HEREIN IS PROTECTED BY LAW, INCLUDING BUT NOT LIMITED TO, COPYRIGHT LAW,AND NONE OF SUCH INFORMATION MAY BE COPIED OR OTHERWISE REPRODUCED, REPACKAGED, FURTHER TRANSMITTED, TRANSFERRED, DISSEMINATED, REDISTRIBUTEDOR RESOLD, OR STORED FOR SUBSEQUENT USE FOR ANY SUCH PURPOSE, IN WHOLE OR IN PART, IN ANY FORM OR MANNER OR BY ANY MEANS WHATSOEVER, BY ANYPERSON WITHOUT MOODY'S PRIOR WRITTEN CONSENT.
All information contained herein is obtained by MOODY'S from sources believed by it to be accurate and reliable. Because of the possibility of human or mechanical error as wellas other factors, however, all information contained herein is provided "AS IS" without warranty of any kind. MOODY'S adopts all necessary measures so that the information ituses in assigning a credit rating is of sufficient quality and from sources MOODY'S considers to be reliable including, when appropriate, independent third-party sources. However,MOODY'S is not an auditor and cannot in every instance independently verify or validate information received in the rating process or in preparing the Moody's Publications.
To the extent permitted by law, MOODY'S and its directors, officers, employees, agents, representatives, licensors and suppliers disclaim liability to any person or entity for anyindirect, special, consequential, or incidental losses or damages whatsoever arising from or in connection with the information contained herein or the use of or inability to use anysuch information, even if MOODY'S or any of its directors, officers, employees, agents, representatives, licensors or suppliers is advised in advance of the possibility of such losses ordamages, including but not limited to: (a) any loss of present or prospective profits or (b) any loss or damage arising where the relevant financial instrument is not the subject of aparticular credit rating assigned by MOODY'S.
To the extent permitted by law, MOODY'S and its directors, officers, employees, agents, representatives, licensors and suppliers disclaim liability for any direct or compensatorylosses or damages caused to any person or entity, including but not limited to by any negligence (but excluding fraud, willful misconduct or any other type of liability that, for theavoidance of doubt, by law cannot be excluded) on the part of, or any contingency within or beyond the control of, MOODY'S or any of its directors, officers, employees, agents,representatives, licensors or suppliers, arising from or in connection with the information contained herein or the use of or inability to use any such information.
NO WARRANTY, EXPRESS OR IMPLIED, AS TO THE ACCURACY, TIMELINESS, COMPLETENESS, MERCHANTABILITY OR FITNESS FOR ANY PARTICULAR PURPOSE OF ANY SUCHRATING OR OTHER OPINION OR INFORMATION IS GIVEN OR MADE BY MOODY'S IN ANY FORM OR MANNER WHATSOEVER.
Moody's Investors Service, Inc., a wholly-owned credit rating agency subsidiary of Moody's Corporation ("MCO"), hereby discloses that most issuers of debt securities (includingcorporate and municipal bonds, debentures, notes and commercial paper) and preferred stock rated by Moody's Investors Service, Inc. have, prior to assignment of any rating,agreed to pay to Moody's Investors Service, Inc. for appraisal and rating services rendered by it fees ranging from $1,500 to approximately $2,500,000. MCO and MIS also maintainpolicies and procedures to address the independence of MIS's ratings and rating processes. Information regarding certain affiliations that may exist between directors of MCO andrated entities, and between entities who hold ratings from MIS and have also publicly reported to the SEC an ownership interest in MCO of more than 5%, is posted annually atwww.moodys.com under the heading "Investor Relations — Corporate Governance — Director and Shareholder Affiliation Policy."
Additional terms for Australia only: Any publication into Australia of this document is pursuant to the Australian Financial Services License of MOODY'S affiliate, Moody's InvestorsService Pty Limited ABN 61 003 399 657AFSL 336969 and/or Moody's Analytics Australia Pty Ltd ABN 94 105 136 972 AFSL 383569 (as applicable). This document is intendedto be provided only to "wholesale clients" within the meaning of section 761G of the Corporations Act 2001. By continuing to access this document from within Australia, yourepresent to MOODY'S that you are, or are accessing the document as a representative of, a "wholesale client" and that neither you nor the entity you represent will directly orindirectly disseminate this document or its contents to "retail clients" within the meaning of section 761G of the Corporations Act 2001. MOODY'S credit rating is an opinion asto the creditworthiness of a debt obligation of the issuer, not on the equity securities of the issuer or any form of security that is available to retail investors. It would be recklessand inappropriate for retail investors to use MOODY'S credit ratings or publications when making an investment decision. If in doubt you should contact your financial or otherprofessional adviser.
Additional terms for Japan only: Moody's Japan K.K. ("MJKK") is a wholly-owned credit rating agency subsidiary of Moody's Group Japan G.K., which is wholly-owned by Moody'sOverseas Holdings Inc., a wholly-owned subsidiary of MCO. Moody's SF Japan K.K. ("MSFJ") is a wholly-owned credit rating agency subsidiary of MJKK. MSFJ is not a NationallyRecognized Statistical Rating Organization ("NRSRO"). Therefore, credit ratings assigned by MSFJ are Non-NRSRO Credit Ratings. Non-NRSRO Credit Ratings are assigned by anentity that is not a NRSRO and, consequently, the rated obligation will not qualify for certain types of treatment under U.S. laws. MJKK and MSFJ are credit rating agencies registeredwith the Japan Financial Services Agency and their registration numbers are FSA Commissioner (Ratings) No. 2 and 3 respectively.
MJKK or MSFJ (as applicable) hereby disclose that most issuers of debt securities (including corporate and municipal bonds, debentures, notes and commercial paper) and preferredstock rated by MJKK or MSFJ (as applicable) have, prior to assignment of any rating, agreed to pay to MJKK or MSFJ (as applicable) for appraisal and rating services rendered by it feesranging from JPY200,000 to approximately JPY350,000,000.
MJKK and MSFJ also maintain policies and procedures to address Japanese regulatory requirements.
REPORT NUMBER 1028279

S&P Global Ratings
Research
New Vorl{ State Dormitory Authority New York University; Private Coll/ Univ - General Obligation Primary Credit Analyst: Carolyn McLean, New York (1) 212-438-2383; [email protected]
Secondary Contact: Laura A Kuffler-Macdonald, New York ( 1) 212-438-2519; [email protected]
Table Of Contents
Rationale
Outlook
Enterprise Profile
Financial Profil e
Related Criteria And Research
WWW.STANDARDANDPOORS.COM
© S&P Global Ratings. All rights reserved. No reprint or dissemination without S&P Global Ratings' permission. See Terms of Use/Disclaimer on the last page.
MAY 20, 2016 1
1640546 1 300642892

New York State Dormitory Authority New York University; Private CoU/Univ- General Obligation Credit Profile
US$603.07 mil tax exempt rev bnds (New York Univ) ser 2016A due 07/01/2016
Long Term Rating AA-/Stable
US$254.745 mil taxable rev bnds (New York Univ) ser 20168 due 07/01/2016
Long Term Rating AA-/Stable
New York City Indl Dev Agy, New York
New York Univ, New York
New York City Indl Dev Agy (New York Univ)
Unenhanced Rating
Rationale
AA-(SPUR)/Stable
New
New
Affirmed
S&P Global Ratings assigned its 'AA-' long-term rating to the New York State Dormitory Authority's series 20 16A
tax-exempt and 20 16B taxable revenue bonds, issued on behalf of New York University (NYU). At the same time, we
affirmed our 'AA-' issuer credit rating (ICR) on NYU and the 'AA-' long-term rating on the university's existing bonds.
The outlook on all ratings is stable.
The bonds are secured by an unsecured general obligation (GO) of the academic component, which excludes the NYU
Health System, other than the School of Medicine. Our rating and analysis reflect the academic component unless
otherwise noted as the consolidated entity.
The rating reflects NYU's extremely strong enterprise profile, supported by healthy demand metrics, large and diverse
student body, and solid management team. The rating further reflects the university's strong financial profile,
supported by sufficient operating performance, fair financial resources, and solid and conservative debt. Combined,
these lead to an indicative credit rating of 'aa-' and a long term rating of 'AA-'.
With the 2016 issuance, the university's debt level increases by $400 million, which is slightly ahead of previously
disclosed plans. We believe that NYU will be able to easily absorb the additional debt at the current rating level. We
expect NYU will issue additional debt in the next two to three years to fund the Mercer Street expansion, which we
believe it will also be able to absorb at the current rating level.
The ratings reflect our view of the university's:
• Excellent enrollment and demand profile as one of the nation's largest private institutions; • Adequate financial operations for the academic component, characterized by modest deficit operating performance
on a generally accepted accounting principles (GAAP) basis and a diverse revenue stream, which, on a consolidated basis, is about 50% reliant on revenues generated by NYU Hospitals Center;
WWW.STANDARDANDPOORS.COM MAY 20, 2016 2
© S&P Global Ratings. All rights reserved. No reprint or dissemination without S&P Global Ratings' permission. See Terms of Use/Disclaimer on the I G40548 1 300u•I2H~2
last page.

New York State Dormitory Authority New York University; Private Coii/Univ - General Obligation
• Successful history offundraising, raising an impressive $618 million in fiscal 2015 despite a modest 10% alumni participation rate;
• Unique location in New York City and sizable real estate assets, as well as plans to expand and reallocate campus facilities to increase efficiencies and programs over the next two decades;
• Dynamic leadership team, which we believe has the diverse skills and ability to integrate NYU's multiple initiatives;
and
• Below-average pro forma maximum annual debt service (MADS) burden of approximately 4.2% of adjusted
operating performance for the academic component.
Offsetting factors include NYU's:
• Relatively low levels of financial resources relative to other 'AA' category comprehensive institutions, with expendable resources for the academic component;
• Modest endowment revenue as a portion of operating revenues, slightly offset by good revenue diversity generated by the health system and research program; and
• High pro forma debt of approximately $3.3 billion and additional debt plans over the next few years.
Founded in 1831, NYU is a private comprehensive, not-for-profit university in New York City with approximately
56,000 students (45,000 full-time equivalent [FTE]) in fall2015. It is one of the largest private institutions in the nation,
enrolling a broad and diverse student population from the U.S. and many other countries. NYU provides a
comprehensive array of programs through its 18 schools, colleges, and divisions. Unlike many of its peer schools and
more traditional college campuses, NYU is an urban campus, consisting of buildings primarily in and around
Washington Square in the Greenwich Village section of Manhattan. In addition to its main campus, it also has its
engineering campus in downtown Brooklyn ( the former Polytechnic University of NYU), as well as degree-granting
campuses in Abu Dhabi, opened in fall2010, and Shanghai, opened in fall 2013.
NYU's various operating units include the university, (comprised of all academic units in all locations with the
exception of the School of Medicine (SOM]), and the NYU Langone Medical Center (comprised of the NYU Hospitals
Center (NYUHC), SOM, and CCC550, a segregated cell captive company to provide self-insurance for professional
liabilities at NYUHC). The bonds outstanding are a general obligation (GO) of the university's academic component,
which is composed of the university and the SOM, but exclusive of the NYUHC and CCC550. After Jan. 1, 2014,
Polytechnic merged with NYU, and was included in our calculations of the financial strength of the obligated group.
The Health System issues its bonds separately and are secured by only the revenues of the health system. See our
analysis of the health system published May 2, 2016.
As of Aug. 31, 2015, the academic component had approximately $2.8 billion in debt and the consolidated unit had
$4.6 billion. Postissuance, excluding the fiscal2016 amortization, debt will reach approximately $3.3 billion at the
academic component and $5.2 billion at the consolidated unit. The series 2016A and 2016B bonds will fund various
capital projects, as well as refinance short-term debt on NYU's lines of credit. NYU's practice is to fund construction or
real estate acquisitions using a line of credit and roll them into long-term financing every one to two years. The
combined amount of the two series will be about $85 7 million, of which $545 million is new money (based on the debt
as of Aug. 31, 2015). The bonds are secured by a GO pledge of the university's academic component and are on parity
with existing academic component bonds. We expect the university to have about $555 million of debt on its lines of
credit during fiscal 2016, which is included in our debt calculations. The university has plans to issue long-term debt in
WWW.STANDARDANDPOORS.COM MAY 20, 2016 3
© S&P Global Ratings. All rights reserved. No reprint or dissemination without S&P Global Ratings' permission. See Terms of Use/Disclaimer on the I 640540 1 300612892 last page.

New York State D ormitory Authority New York University; Private Coli!Univ- General Obligation
the next several years for its Mercer Street building, which we will consider closer to the time of issuance.
Outlook
The stable outlook reflects our expectation that over the next two years, debt issuances will be commensurate with an
increase in financial resources, including continued strong fundraising. We expect continued break-even to positive
operating performance at the academic component on a cash basis for fiscal years 2016 and 2017. We expect demand
flexibility will remain robust and enrollment at least stable.
Downside scenario
Factors that could have negative rating implications include significant decreases in financial resources relative to
expenses and debt from current levels. Planned issuances of debt not commensurate with increases in financial
resources could pressure the rating. Although not expected, we would also view a deficit operating performance on a
cash basis or deterioration of enrollment or demand negatively.
Upside scenario
A positive rating action is unlikely during the next two years; however, we would view significantly improved surpluses
at the academic component, combined with substantially more robust financial resource ratios, favorably.
Enterprise Profile
Industry risk Industry risk addresses the higher education sector's overall cyclicality and competitive risk and growth by applying
various stress scenarios and evaluating barriers to entry, levels and trends of profitability, substitution risk, and growth
trends observed in the industry. We believe the higher education sector represents a low credit risk when compared
with other industries and sectors.
Economic fundamentals
In our view, the university has good geographic diversity; only about 29% of students are New Yorkers. As such, our
assessment of NYU's economic fundamentals is anchored by the U.S. GDP per capita.
Enrollment and demand In the past year, NYU has maintained its strong market position, with increased applications at all three campuses and
continued healthy selectivity and good student quality. Total enrollment was 56,346 in fall2015 or 45,488 FTE, with
the majority of students at its Washington Square campus. The campuses in Abu Dhabi and Shanghai also continue to
grow and enrolled about 1,715 students combined for fall2015. Approximately 46% of students are undergraduates
and the rest are graduate or professional students. NYU is one of the largest private institutions in the country, and
management expects enrollment to remain steady as demand continues to grow, particularly from international
applicants; international students currently make up nearly 25% of the student body at the New York campus.
Demand is robust, with the freshman acceptance rate at between 32% and 35% in the past five years. Selectivity was
32% in fall2015 . The average SAT score was 1340 in fall2015, consistent with NYU's continued commitment to
WWW.STANDARDA NDPOORS.COM MAY 20, 2016 4
© S&P Global Ratings. All rights reserved. No reprint or dissemination without S&P Global Ratings' permission. See Terms of Use/Disclaimer on the lG~0548 1 JOOG42892 last page.

New York State Dormitory Authority New York University; Private Co/1/Univ- General Obligation
quality. The fall 2015 matriculation rate of 32% is robust and consistent with the rating category and its peers.
Graduate and professional programs are also highly competitive. Retention has been consistently healthy as well and
was 93% in fall 2015.
NYU provides a comprehensive academic program; however, its niche is its size, diversity, and location in New York
City. NYU considers Georgetown University, Columbia University, UCLA. Cornell, University of Southern California,
University of Chicago, Boston University, Northwestern University, and University of Pennsylvania among its peers.
NYU also has degree-granting campuses in Abu Dhabi and Shanghai. Management states that demand for these
programs has been quite strong. NYU remains among the highest-priced schools in the nation: Undergraduate tuition
and fees for fall2015 totaled about $47,750. Including room and board fees, the total cost for one academic year is
$65,330. NYU has increased its financial aid packages in the past two years to make the university more accessible to
students from lower-income families, and has moderated tuition hikes as well. We believe that NYU remains a
top-choice university for many students and that although tuition and fees are high, the university maintains some
price elasticity. In an effort to meet affordability concerns, the university has announced it will lower the planned
undergraduate tuition and fees rate increase for the 2016-2017 academic year to 2.7% and freeze room and board
costs. Management states it will be able to maintain level revenue despite the lower increase in these student charges.
We view NYU's successful fundraising as a credit strength. Although NYU has not had a comprehensive campaign
since 2008, it is in a $1 billion campaign to support financial aid and has raised $584 million to date. In fiscal2015, the
university raised approximately $618 million. It appears on track to attain its goal of raising at least $500 million in
fiscal 2016. Management states the current campaign could roll into a larger capital campaign over the next few years.
Management
The university's new president, Andrew Hamilton, started in January 2016. The new president was vice chancellor at
Oxford University in the U.K prior to joining NYU. Senior management has been stable during the presidential
transition. The prior president, John Sexton, retired. We expect that the presidential transition will be smooth and
NYU will continue its plans to expand the university around Washington Square, and strengthen its international
presence, particularly in Abu Dhabi and Shanghai.
The university has robust strategic planning and a record of execution and monitoring of strategies. Over the past
several years, the university has successfully merged with Polytechnic, opened the Abu Dhabi and Shanghai campuses,
as well as moving forward with a robust affordability strategy and the new Mercer Street project. In addition, the
university has a comprehensive enterprise risk management structure, which allows for stress testing in various areas,
and also measures macro risk, including economic stability, terrorism, and cybersecurity, among others. We believe
that NYU's risk management program is best-in-class.
Financial Profile
Financial policies Financial management practices are good, in our view. Management does not budget for depreciation, but rather
budgets for principal payments and capital renewal and replacement, which we consider a proxy for depreciation
expense. Management funds half of its capital replacement needs out of the operating budget instead of with debt,
WWW.STANDARDANDPOORS.COM MAY 20,2016 5
© S&P Global Ratings. All rights reserved. No reprint or dissemination without S&P Global Ratings' permission. See Terms of Use/Disclaimer on the 16<10548 1 3006·12892 last page.

New York State Dormitory Authority New York University; Private Coii/U11iv- General Obligation
which we view as a favorable fiscal discipline. Management has not historically prepared interim statements on a
GAAP basis, although it began to do so in 2015, which we would consider a best practice. Management budgets
conservatively and assumes many contingencies, including a general operating contingency as well as reserve funds.
The college has formal policies for endowment, investments, and debt. It operates according to a multiyear strategic
plan, and has a formal reserve liquidity policy. The college meets standard annual disclosure requirements. The
financial policies assessment reflects our opinion that, while there may be some areas of risk, the organization's overall
financial policies are not likely to negatively affect its future ability to pay debt service. Our analysis of financial
policies includes a review of the organization's financial reporting and disclosure, investment allocation and liquidity,
debt profile, contingent liabilities, and legal structure and a comparison of these policies to comparable providers.
Financial performance The university produces consolidated audited financial statements, consisting of several reporting entities for NYU
such as the university, the SOM, NYU Hospitals Center, and CCC550, an offshore captive insurance corporation. The
obligated group for the university's debt is the academic component, which is composed of the university and the
SOM. Our analysis focuses on the financial performance of the academic component given that this is what is pledged
to pay back the rated bonds.
Historically, GAAP operating performance at the academic component has reflected modest deficits. In fiscal 2015, the
academic component had a $131 million deficit, or a negative 2.4% margin, reflecting negative results at both the
university and SOM. Management attributed the performance to a decrease in unrestricted fundraising proceeds,
which was offset by an increase in overall fundraising, and increased depreciation due to NYU's capital investments in
recent years. Academic component performance is weaker than the consolidated entity, which had a $88 million
adjusted operating surplus, or a 1.1% margin. The consolidated performance is supported by strong performance at
the hospital. For fiscal 2016, we expect performance at both the academic component and the consolidated unit to be
in line with historical performance.
NYU has good revenue diversity at the academic component and the consolidated unit. The academic component has
49% of revenues derived from student-generated sources (tuition and auxiliaries), 14% from grants and contracts, 25%
health care revenues, 6% private gifts and endowment income, and 6% other revenues. The breakdown at the
consolidated unit is 49% health care revenues, 33% student-generated revenues, 10% grants and contracts, 4% private
gifts and endowment income, and 4% other sources. We expect health care revenue will continue to increase as the
health system expands.
Available resources Financial resource ratios were low relative to peers but were adequate for the rating, with expendable resources at the
academic component of $1.4 billion, equal to 25% of adjusted operating expenses and 41% of pro forma debt. Cash
and investments were stronger at $4.4 billion, equal to 81% of adjusted operating expenses and 134% pro forma debt.
Financial resource ratios at the consolidated unit were similar, with $2 .7 billion in expendable resources equal to 35%
of adjusted operating expenses and 52% of pro forma debt. Cash and investments were $5.4 billion, equal to 70% of
adjusted operating expenses and 105% of pro forma debt. We expect that NYU will be able to absorb the latest debt
issues as well as future debt as long as it maintains the current level of financial resources relative to debt and
WWW. STANDARDANDPOORS.COM MAY 2 0,2016 6
© S&P Global Ratings. All rights reserved. No reprint or dissemination without S&P Global Ratings' permission. See Terms of Use/Disclaimer on the Hi405•18 1 3006·128~2 last page.

New York State Dormitory Authority New York University; Private Coll/Univ - General Obligation
expenses. Although NYU's financial resources are high on an absolute level relative to operating expenses and debt,
they are low compared with those of its peer group and for its rating category. The dilution of NYU's financial
resources is partly offset by its revenue diversity, size, comprehensive nature, and global reach.
The endowment's market value was approximately $3.6 billion as of March 31, 2016. As of Dec. 31, 2015, the asset
allocation was 4 7% public equity, 19% hedge funds, 5% fixed income, 6% cash, 11% private equity, 5% nonmarketable
credit, 2% natural resources, 4% real estate, and 1% liquidating funds. The portfolio structure is liquid, as 51% of the
portfolio can be liquidated within 30 days and 66% within 90 days. This is higher than similarly sized endowments,
which we view favorably. Total unfunded capital commitments were a conservative 8.5% of the endowment market
value. The endowment spending policy historically was 5% of a three-year moving average approved annually by the
university's board. Starting in fiscal2014, the university adopted a spending policy based on increasing the fiscal2014
spending by the change in the New York metro area inflation rates--which is considered a more conservative spending
rate at least in the short term. As a result of these limited increases in the spending rate, endowment spending in fiscal
year 2016 was budgeted at 4.5% of the Aug. 31, 2015, market value. We believe that this is a less predictable spending
policy, but understand that if current economic conditions change, the board would likely adjust the policy.
Debt and contingent liabilities
As of Aug. 31, 2015, the academic component had approximately $2.8 billion in debt and the consolidated unit had
$4.7 billion. Postissuance, debt will reach approximately $3.3 billion at the academic component and $5.2 billion at the
consolidated unit. The academic component bonds are all fixed rate and are a combination of tax-exempt, taxable, and
private loans. We believe that the debt structure is conservative due to its predictable debt service structure. We
expect NYU to continue to regularly issue debt to finance renewal and replacement and new construction on campus.
We believe that it will be able to absorb the new-money debt at the current rating as long as financial resource ratios
remain at least consistent with current levels and that financial performance stays positive.
The university entered into a private placement loan agreement for the series 2014A bonds in October 2014 for $55
million, which refinanced the series 2004A bonds. The bonds are on parity with other bonds secured by a GO of the
academic component. The covenants do not include any financial requirements and do not have acceleration
provisions. We believe that the private placement does not materially affect the credit risk of the university's debt
profile.
The university has three lines of credit totaling $700 million with multiple counterparties. The lines are renewable on a
staggered schedule of generally two-year agreements, and we expect the university to continue to renew these lines.
NYU uses the lines of credit to fund construction and real estate acquisition and then refinances the short-term debt
with longer-term taxable and tax-exempt bond financing. We expect this practice to continue and have included the
expected use of the line in fiscal 2016 in our pro forma debt calculations.
WWW.STANDARDANDPOORS.COM MAY 20, 2016 7
© S&P Global Ratings. All rights resetved. No reprint or dissemination without S&P Global Ratings' permission. See Terms of Use/ Disclaimer on the t G40548 1 300G42892 last page.

New York State Dormitory Authority New York University; Private Coii!Univ- General Obligation
New York University - Academic Component
··Fiscal year ended Aug. 31·· Medians
Private Colleges & 2016 2015 2014 2013 2012 Universities 'AA' 2014
Enrollment and demand
Headcount 56,346 57,245 52,860 53,671 54,788
Full-time equivalent 45,488 44,233 40,039 39,934 39,213
Freshman acceptance rate (%) 32.1 35.2 32.4 35.0 32.7
Freshman matriculation rate (%) 32.0 33.2 34.9 34.3 36.2
Undergraduates as a% of total 45.7 43.6 42.8 41.9 40.7 enrollment (%)
Freshman retention (%) 93.0 92.0 92.0 92.0 92.0
Graduation rates (five years) (%) 84.0 82.0 84.0 84.0 84.0
Income statement
Adjusted operating revenue ($000s) N.A. 5,309,558 4,863,597 4,528,884 4,138,164
Adjusted operating expense ($000s) N.A. 5,440,938 5,002,289 4,538,314 4,035,767
Net operating income ($000s) N.A. (131,380) (138,692) (9,430) 102,397
Net operating margin (%) N.A. (2.41) (2.77) (0.2 1) 2.54
Change in unrestricted net assets N.A. (208,608) (12,884) 235,538 (59,721) ($000s)
Tuition discount (%) N.A. 25.7 23.3 23.5 22.4
Tuition dependence (%) N.A. 40.5 42.4 41.5 43.3
Student dependence (%) N.A. 48.6 50.8 49.9 52.5
Healthcare operations dependence N.A. 24.8 22. 1 20.0 20.4 (%)
Research dependence (%) N.A. 14.2 14.3 13.7 14.1
Endowment and investment income N.A. 2.8 2.1 2.7 2.9 dependence (%)
Debt
Outstanding debt ($000s) N.A. 2,768,575 2,452,590 2,291,580 2,169,356
Proposed debt ($000s) N.A. 857,815 N.A. N.A. N.A.
Total pro forma debt ($000s) N.A. 3,313,355 N.A. N.A. N.A.
Pro forma MADS N.A. 229,693 N.A. N.A. N.A.
Current debt service burden (%) N.A. 3.1 8 3.53 3.24 3.26
Current MADS burden (%) N.A. 3.23 4.36 4.80 N.A.
Pro forma MADS burden (%) N.A. 4.22 N.A. N.A. N.A.
Financial r esource ratios
Endowment market value ($000s) N.A. 3,475,940 3,435,03 1 2,978,545 2,800,397
Cash and investments ($000s) N.A. 4,427,368 4,389,306 3,937,684 3,738,702
Unrestricted net assets ($000s) N.A. 2,017,019 2,225,627 2,254,779 2,0 19,241
Expendable resources ($000s) N.A. 1,352,856 1,832,027 1,413,788 1,232,044
Cash and investments to operations N.A. 81.4 87.7 86.8 92.6 (%)
Cash and investments to debt (%) N.A. 159.9 179.0 171.8 172.3
WWW.STANDARDANDPOORS.COM
© S& P Global Ratings. All rights reserved. No reprint or dissemination without S&P Global Ratings' permission. See Tenms of Use/Disclaimer on the last page.
MNR
3,749
26.5
34.3
72.2
94.4
87.3
MNR
MNR
MNR
MNR
MNR
36.4
MNR
MNR
MNR
MNR
MNR
252,800
MNR
MNR
MNR
4.00
MNR
MNR
1,163,613
MNR
MNR
MNR
378.4
463. 1
MAY 2 0, 2016 8
16•10548 I JOOG47.8 ~)2

New York State Dormitory Authority New York University; Private Coll/Univ- General Obligation
New York University - Academic Component (cont.)
--Fiscal year ended Aug. 31-- Median s
Private Colleges & 2016 2015 2014 2013 2012 Universities 'AA' 2014
Cash and investments to pro forma N.A. 133.6 N.A. N.A. N.A. MNR debt(%)
Expendable resources to operations N.A. 24.9 36.6 31.2 30.5 250.4 (%)
Expendable resources to debt (%) N.A. 48.9 74.7 61.7 56.8 323.1
Expendable resources to pro forma N.A. 40.8 N.A. N.A. N.A. MNR debt(%)
Average age of plant (years) N.A. 10.9 8.9 9.2 8.9 13.0
N.A.--Not available. MNR--Median not reported. MADS--Maximum annual debt service. Total adjusted operating revenue = unrestricted revenue less realized and unrealized gains/losses and financial aid. Total adjusted operating expense = unrestricted expense plus financial aid expense. Net operating margin= lOO*(net adjusted operating income/adjusted operating expense). Tuition dependence= 100*(gross tuition revenue/adjusted operating revenue). Current debt service burden= 100*(current debt service expense/adjusted operating expenses). Current MADS burden = lOO*(maximum annual debt service expense/adjusted operating expenses). Cash and investments= cash + short-term & long-term investments Expendable resources = unrestricted net assets + temp. restricted net assets - (net PPE- outstanding debt). Average age of plant= accumulated depreciation/depreciation and amortization expense.
Related Criteria And Research
Related Criteria • General Criteria: Methodology: Not-For-Profit Public And Private Colleges And Universities, Jan. 6, 2016
• USPF Criteria: Contingent Liquidity Risks, March 5, 20 12
Ratings Detail (As Of May 20, 2016)
New York Univ
Long Term Rating
New York Univ ICR
Long Term Rating
Dorm Auth of the St of New York, New York
New York Univ, New York
AA-/Stable
AA-/Stable
New York State Dormitory Authority (New York Univy)
Long Term Rating
New York St Dorm Auth (New York Univ)
Unenhanced Rating
New York St Dorm Auth (New York Univ)
Unenhanced Rating
Long Term Rating
Many issues are enhanced by bond insurance.
AA-/Stable
AA-(SPUR)/Stable
AA-(SPUR)/Stable
AA-/Stable
Affirmed
Affirmed
Affirmed
Affirmed
Affirmed
Affirmed
WWW.STANDARDANDPOORS.COM MAY 2 0, 2016 9
© S&P Global Ratings. All rights reserved. No reprint or dissemination without S&P Global Ratings' pennission. See Tenns of Use/Disclaimer on the IG40548 1 300642892 last page.

Copyright © 2016 Standard & Poor's Financial Services LLC. All rights reserved.
No content (including ratings, credit-related analyses and data, valuations, model, software or other application or output therefrom) or any part thereof (Content) may be modified, reverse engineered, reproduced or distributed in any form by any means, or stored in a database or retrieval system, without the prior written permission of Standard & Poor's Financial Services LLC or its affiliates (collectively, S&P). The Content shall not be used for any unlawful or unauthorized purposes. S&P and any third-party providers, as well as their directors, offi cers, shareholders, employees or agents (collectively S&P Parties) do not guarantee the accuracy, completeness, timeliness or availability of the Content. S&P Parties are not responsible for any errors or omissions (negligent or otherwise), regardless of the cause, for the results obtained from the use of the Content, or for the security or maintenance of any data input by the user. The Content is provided on an "as is" basis. S&P PARTIES DISCLAIM ANY AND ALL EXPRESS OR IMPLIED WARRANTIES, INCLUDING, BUT NOT LIMITED TO, ANY WARRANTIES OF MERCHANTABILITY OR FITNESS FOR A PARTICULAR PURPOSE OR USE, FREEDOM FROM BUGS, SOFTWARE ERRORS OR DEFECTS, THAT THE CONTENT'S FUNCTIONING WILL BE UNINTERRUPTED OR THAT THE CONTENT WILL OPERATE WITH ANY SOFTWARE OR HARDWARE CONFIGURATION. In no event shall S&P Parties be liable to any party for any direct, indirect, incidental, exemplary, compensatory, punitive, special or consequential damages, costs, expenses, legal fees, or losses (including, without limitation, lost income or lost profits and opportunity costs or losses caused by negligence) in connection with any use of the Content even if advised of the possibility of such damages.
Credit-related analyses, including ratings, and statements in the Content are statements of opinion as of the date they are expressed and not statements of fact. S&P's opinions, analyses and rating acknowledgment decisions (described below) are not recommendations to purchase, hold, or sell any securities or to make any investment decisions, and do not address the suitability of any security. S&P assumes no obligation to update the Content following publication in any form or format. The Content should not be relied on and is not a substitute for the skill, judgment and experience of the user, its management, employees, advisors and/ or clients when making investment and other business decisions. S& P does not act as a fiduciary or an investment advisor except where registered as such. While S&P has obtained information from sources it believes to be reliable, S&P does not perform an audit and undertakes no duty of due diligence or independent verification of any information it receives.
To the extent that regulatory authorities allow a rating agency to acknowledge in one jurisdiction a rating issued in another jurisdiction for certain regulatory purposes, S&P reserves the right to assign, withdraw or suspend such acknowledgment at any time and in its sole discretion. S&P Parties disclaim any duty whatsoever arising out of the assignment, withdrawal or suspension of an acknowledgment as well as any liability for any damage alleged to have been suffered on account thereof.
S&P keeps certain activities of its business units separate from each other in order to preserve the independence and objectivity of their respective activities. As a result, certain business units of S&P may have information that is not available to other S&P business units. S&P has established policies and procedures to maintain the confidentiality of certain non-public information received in connection with each analytical process.
S&P may receive compensation for its ratings and certain credit-related analyses, normally from issuers or underwriters of securities or from obligors. S&P reserves the right to disseminate its opinions and analyses. S&P's public ratings and analyses are made available on its Web sites, www.standardandpoors.com (free of charge), and www.ratingsdirect.com and www.globalcreditportal.com (subscription), and may be distributed through other means, including via S&P publications and third-party redistributors. Additional information about our ratings fees is available at www.standardandpoors.com/usratingsfees.
Standard & Poor's I Research I May 20, 2016 10
I 6•10548 I 300ti428[1Z
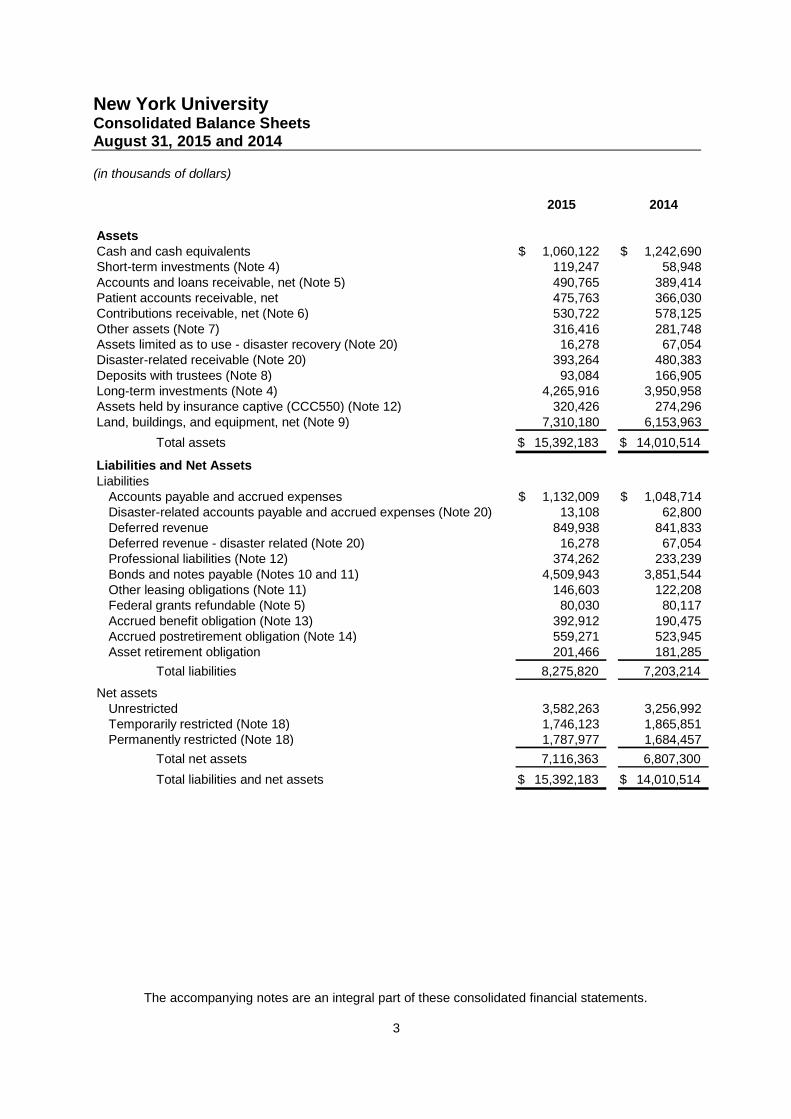
New York UniversityConsolidated Balance SheetsAugust 31, 2015 and 2014
(in thousands of dollars)
The accompanying notes are an integral part of these consolidated financial statements.
3
2015 2014
AssetsCash and cash equivalents 1,060,122$ 1,242,690$Short-term investments (Note 4) 119,247 58,948Accounts and loans receivable, net (Note 5) 490,765 389,414Patient accounts receivable, net 475,763 366,030Contributions receivable, net (Note 6) 530,722 578,125Other assets (Note 7) 316,416 281,748Assets limited as to use - disaster recovery (Note 20) 16,278 67,054Disaster-related receivable (Note 20) 393,264 480,383Deposits with trustees (Note 8) 93,084 166,905Long-term investments (Note 4) 4,265,916 3,950,958Assets held by insurance captive (CCC550) (Note 12) 320,426 274,296Land, buildings, and equipment, net (Note 9) 7,310,180 6,153,963
Total assets 15,392,183$ 14,010,514$
Liabilities and Net AssetsLiabilities
Accounts payable and accrued expenses 1,132,009$ 1,048,714$Disaster-related accounts payable and accrued expenses (Note 20) 13,108 62,800Deferred revenue 849,938 841,833Deferred revenue - disaster related (Note 20) 16,278 67,054Professional liabilities (Note 12) 374,262 233,239Bonds and notes payable (Notes 10 and 11) 4,509,943 3,851,544Other leasing obligations (Note 11) 146,603 122,208Federal grants refundable (Note 5) 80,030 80,117Accrued benefit obligation (Note 13) 392,912 190,475Accrued postretirement obligation (Note 14) 559,271 523,945Asset retirement obligation 201,466 181,285
Total liabilities 8,275,820 7,203,214
Net assetsUnrestricted 3,582,263 3,256,992Temporarily restricted (Note 18) 1,746,123 1,865,851Permanently restricted (Note 18) 1,787,977 1,684,457
Total net assets 7,116,363 6,807,300
Total liabilities and net assets 15,392,183$ 14,010,514$

New York UniversityConsolidated Statements of ActivitiesYears Ended August 31, 2015 and 2014
(in thousands of dollars)
The accompanying notes are an integral part of these consolidated financial statements.
4
2015 2014
Changes in unrestricted net assets
Operating revenuesTuition and fees (net of financial aid awards of $552,445 and $497,375) 1,599,870$ 1,565,238$Grants and contracts (Note 15) 762,386 694,562
Patient care (net of provision for bad debt $48,566 and $46,244) (Note 3) 3,479,113 2,659,471Hospital affiliations (Note 16) 305,458 292,078Insurance premiums earned 47,203 39,356Contributions 142,593 143,293
Endowment distribution (Note 4) 146,905 138,039Return on short-term investments (Note 4) 21,440 25,731Auxiliary enterprises 434,404 408,108Program fees and other 257,797 193,046Commercial insurance-disaster recovery (Note 20) - 11,000
Disaster recovery reimbursement (Note 20) 15,711 133,897Net assets released from restrictions 91,987 109,115
Total operating revenues 7,304,867 6,412,934
Expenses (Note 17)Instruction and other academic programs 1,492,235 1,477,292Research and other sponsored programs 931,003 794,599
Patient care 2,879,440 2,294,478Hospital affiliations (Note 16) 282,083 272,070Libraries 75,635 75,516Student services 122,042 118,299Auxiliary enterprises 476,662 460,536
Institutional services 947,893 765,084Disaster-related expenses (Note 20) 9,973 78,490
Total expenses 7,216,966 6,336,364
Excess of operating revenues over expenses 87,901 76,570
Nonoperating activitiesInvestment return (Note 4) 3,124 156,601Appropriation of endowment distribution (Note 4) (57,467) (51,490)
Disaster recovery reimbursement for capital (Note 20) 76,215 94,548Gain on disaster-related disposal of property, plant, and equipment - 2,039Net assets released from restrictions for capital purposes 32,013 17,753Net assets released from restrictions for hazard mitigation (Note 20) 92,258 12,267
Changes in pension and postretirement obligations (Notes 13 and 14) (75,795) (72,087)Other 14,904 24,200Reclassification related to cy-pres (Note 18) (48,247) -Loss on bond defeasance (Note 10) (104,872) -Acquisition of Lutheran Medical Center (Note 1) 305,237 -
Increase in unrestricted net assets 325,271 260,401
Changes in temporarily restricted net assets
Contributions 188,242 300,372Investment return (Note 4) 17,603 239,797Appropriation of endowment distribution (Note 4) (89,438) (86,549)Disaster award for mitigation (Note 20) - 530,748
Other (19,877) (23,698)Net assets released from restrictions for hazard mitigation (Note 20) (92,258) (12,267)Net assets released from restrictions (124,000) (126,868)
(Decrease) increase in temporarily restricted net assets (119,728) 821,535
Changes in permanently restricted net assets
Contributions 104,348 92,859Reclassification related to cy-pres (Note 18) 48,247 -
Other (49,075) (4,906)
Increase in permanently restricted net assets 103,520 87,953
Increase in net assets 309,063$ 1,169,889$

New York UniversitySupplemental Schedule to the Consolidated Financial Statements(Consolidating Statement of Activities for NYU - Summary)Year Ended August 31, 2015
(in thousands of dollars)
50
NYU ConsolidatedUniversity Health Operations Eliminations NYU
Changes in unrestricted net assetsOperating revenues
Tuition and fees (net of financial aid awards of $545,684 University; $6,761NYU Langone Health Operations) 1,548,058$ 51,812$ -$ 1,599,870$Grants and contracts (Note 15) 460,513 301,873 - 762,386Patient care (net of provision for bad debts $48,566 NYU LangoneHealth Operations) (Note 3) 40,371 3,438,742 - 3,479,113Hospital affiliations (Note 16) - 305,458 - 305,458Insurance premiums earned - 47,203 - 47,203Contributions 101,256 41,337 - 142,593Endowment distribution (Note 4) 111,423 35,482 - 146,905Return on short-term investments (Note 4) 4,916 16,524 - 21,440Auxiliary enterprises 413,680 25,766 (5,042) 434,404Program fees and other 83,855 181,200 (7,258) 257,797Disaster recovery reimbursement (Note 20) - 15,711 - 15,711Net assets released from restrictions 50,451 41,536 - 91,987
Total operating revenues 2,814,523 4,502,644 (12,300) 7,304,867
Expenses (Note 17)Instruction and other academic programs 1,444,449 47,786 - 1,492,235Research and other sponsored programs 432,930 498,073 - 931,003Patient care 40,684 2,838,756 - 2,879,440Hospital affiliations (Note 16) - 282,083 - 282,083Libraries 69,006 6,629 - 75,635Student services 115,158 6,884 - 122,042Auxiliary enterprises 417,709 63,995 (5,042) 476,662Institutional services 384,680 570,471 (7,258) 947,893Disaster-related expenses (Note 20) - 9,973 - 9,973
Total expenses 2,904,616 4,324,650 (12,300) 7,216,966
(Deficiency) excess of operating revenues over expenses (90,093) 177,994 - 87,901
Nonoperating activitiesInvestment return (Note 4) 10,888 (7,764) - 3,124Appropriation of endowment distribution (Note 4) (42,857) (14,610) - (57,467)Disaster recovery reimbursement for capital (Note 20) - 76,215 - 76,215Changes in pension and postretirement obligations (Notes 13 and 14) (56,291) (19,504) - (75,795)Net assets released from restrictions for capital purposes 24,455 7,558 - 32,013Net assets released from restrictions for hazard mitigation - 92,258 - 92,258Other 3,449 11,455 - 14,904Reclassification related to cy-pres (Note 18) (48,247) - - (48,247)Loss on bond defeasance (Note 10) (77,798) (27,074) - (104,872)Acquisition of Lutheran Medical Center (Note 1) - 305,237 - 305,237
(Decrease) increase in unrestricted net assets (276,494) 601,765 - 325,271
Changes in temporarily restricted net assetsContributions 102,318 85,924 - 188,242Investment return (Note 4) 11,377 6,226 - 17,603Appropriation of endowment distribution (Note 4) (68,566) (20,872) - (89,438)Other (13,082) (6,795) - (19,877)Net assets released from restrictions for hazard mitigation (Note 20) - (92,258) - (92,258)Net assets released from restrictions (74,906) (49,094) - (124,000)
(Decrease) in temporarily restricted net assets (42,859) (76,869) - (119,728)
Changes in permanently restricted net assetsContributions 55,240 49,108 - 104,348Reclassification related to cy-pres (Note 18) 48,247 - - 48,247Other (53,965) 4,890 - (49,075)
Increase in permanently restricted net assets 49,522 53,998 - 103,520
(Decrease) increase in net assets (269,831)$ 578,894$ -$ 309,063$
2015