sempra energy 2002 financial report
TRANSCRIPT

F I N A N C I A L R E P O R T
2002

MANAGEMENT’S DISCUSSION AND ANALYSISOF FINANCIAL CONDITION AND RESULTS OF OPERATIONS
INTRODUCTION
This section includes management’s discussion and analysis of operating results from 2000 through2002, and provides information about the capital resources, liquidity and financial performance ofSempra Energy and its subsidiaries (collectively referred to as “the company”). This section alsofocuses on the major factors expected to influence future operating results and discusses investmentand financing activities and plans. It should be read in conjunction with the Consolidated FinancialStatements included in this Annual Report.
The company, headquartered in San Diego, California, is a Fortune 500 energy services companywhose principal subsidiaries are San Diego Gas & Electric (SDG&E) and Southern California GasCompany (SoCalGas), collectively referred to as the California Utilities, and Sempra Energy GlobalEnterprises (Global), itself a holding company owning most of the company’s other subsidiaries.
Business Combination
Sempra Energy was formed to serve as a holding company for Pacific Enterprises (PE), the parentcorporation of SoCalGas, and Enova Corporation (Enova), the parent corporation of SDG&E, in a tax-free business combination that became effective on June 26, 1998.
The California Utilities
SDG&E provides service to 3.1 million consumers through 1.3 million electric meters in San Diego andsouthern Orange counties, and 789,000 natural gas meters in San Diego County. SDG&E’s servicearea encompasses 4,100 square miles, covering 26 cities. SoCalGas is the nation’s largest natural gasdistribution utility and provides service to 18.9 million customers through 5.3 million meters. SoCalGas’service territory encompasses 23,000 square miles, from San Luis Obispo on the north to the Mexicanborder in the south, and 535 cities. Within that territory it does not provide retail service in the City ofLong Beach or SDG&E’s service territory in San Diego County but does provide wholesale service tothe retail providers in these areas. Together, the two utilities serve more than 21 million customersthrough approximately 7 million gas and electric meters.
Sempra Energy Global Enterprises
Global’s primary subsidiaries, headquartered in San Diego unless otherwise noted, are as follows:
Sempra Energy Trading (SET), headquartered in Stamford, Connecticut, is a trading company thatmarkets and trades physical and financial commodity products, including natural gas, power, petroleumproducts and base metals. During 2002, SET completed acquisitions that add base metals trading andwarehousing to its business. See further discussion under “Investments” below. SET has more than2,100 customers worldwide, including most of the major oil, gas and power companies in NorthAmerica, Europe and Asia.
Sempra Energy Resources (SER) acquires, develops and operates power plants for the competitivemarket. On October 31, 2002, SER acquired a coal-fired power plant from Texas-New Mexico Power
SEMPRA ENERGY 1.

Company, as further discussed under “Capital Expenditures” below. SER’s other merchant powerplants use state-of-the-art, combined-cycle power generation technology and clean-burning natural gasto generate electricity for the wholesale market and retail electric providers, such as utilities, marketersand large energy users. It currently has two merchant power plants in operation (aggregating525 megawatt (mW)), three under construction (aggregating 2,135 mW), and seven (not all of whichwill be built) that are at or beyond the permitting stage (aggregating 4,750 mW). The following tablelists the mW of each power plant currently in operation, under construction or under development:
Power PlantGenerating
Capacity Location
In operation:Twin Oaks Power 305 Bremond, TXEl Dorado (50% owned) 220 Boulder City, NV
Total mW 525
Under construction:Mesquite Power 1,250 Arlington, AZTermoeléctrica De Mexicali 600 Mexicali, Baja California, MexicoElk Hills Power (50% owned) 285 Bakersfield, CA
Total mW 2,135
Permitting Stage:Bonnet Carre’ 1,200 La Place, LACedar Power 600 Dayton, TXMC Energy 600 Dobbin, TXCopper Mountain Power 600 Boulder City, NVEastalco 600 Frederick, MDSouth Shore Power 600 Lake Township, MIPalomar 550 Escondido, CA
Total mW 4,750
Total mW 7,410
Sempra Energy International (SEI) develops, operates and owns energy projects in internationalmarkets. SEI currently is involved in joint or solo ventures that provide natural gas or electricity to morethan 2.7 million customers in Argentina, Chile, Mexico, Peru and the United States.
Sempra Energy Solutions (SES) sells energy commodities and provides an integrated mix of energyservices, including facility management, supply and price-risk management, energy efficiency, energyasset management, performance contracting, and infrastructure ownership to assist commercial andindustrial businesses in the changing energy environment.
Other
Sempra Energy Financial (SEF) invests in limited partnerships which own 1,300 affordable-housingproperties throughout the United States, including Puerto Rico and the Virgin Islands. It also holds aninterest in a limited partnership that produces synthetic fuel from coal.
Through other subsidiaries, the company is involved in other energy-related products and services.
SEMPRA ENERGY 2.

RESULTS OF OPERATIONS
Overall Operations
Operating Income—2002 Compared to 2001
California Utility Revenues and Cost of Sales. Natural gas revenues decreased to $3.3 billion in 2002from $4.4 billion in 2001, and the cost of natural gas distributed decreased to $1.4 billion in 2002 from$2.5 billion in 2001. For the fourth quarter, natural gas revenues increased to $968 million in 2002 from$773 million in 2001, and the cost of natural gas distributed increased to $436 million in 2002 from$319 million in 2001. These changes were primarily attributable to changes in natural gas prices, asdiscussed below in “California Utility Operations.”
Electric revenues decreased to $1.3 billion in 2002 from $1.7 billion in 2001, and the cost of electricfuel and purchased power decreased to $0.3 billion in 2002 from $0.8 billion in 2001. For the fourthquarter, electric revenues increased to $312 million in 2002 from $284 million in 2001, and the cost ofelectric fuel and purchased power decreased to $76 million in 2002 from $87 million in 2001. Thesechanges were mainly due to the effect of the California Department of Water and Resource’s (DWR’s)purchasing the net short position of SDG&E, and changes in electric commodity costs and operatingcosts, as discussed in “California Utility Operations.”
Other Operating Revenues. Other operating revenues, which consist primarily of revenues fromGlobal, decreased to $1.5 billion in 2002 from $1.7 billion in 2001. This decrease was primarily due tolower revenues from SET and SEI, partially offset by an increase in SER’s sales to the DWR. For thefourth quarter of 2002, other operating revenues increased to $408 million in 2002 from $242 million in2001, due primarily to increases at SET and SER. See further discussion in “Sempra Energy GlobalEnterprises” below.
Other Cost of Sales. Other cost of sales, which consists primarily of cost of sales at Global,decreased to $709 million in 2002 from $873 million in 2001 primarily due to the lower operatingrevenues as noted above for SET and SEI, offset by increased costs associated with SER’s contractwith the DWR as discussed below in “Sempra Energy Resources.” For the fourth quarter, other cost ofsales increased to $206 million in 2002 from $174 million in 2001 due primarily to increased operatingrevenues at SET and SER. See “Sempra Energy Global Enterprises” below for further discussion ofthe change in other cost of sales.
Other Operating Expenses. Other operating expenses, primarily those of the California Utilities,increased to $1.9 billion in 2002 from $1.8 billion in 2001. The increase is due primarily to increasedoperating costs at the California Utilities and at SET. See further discussion below in “California UtilityOperations” and “Sempra Energy Global Enterprises.” Additionally, in 2001, there was a $30 millionpre-tax charge for the surrender of a natural gas distribution franchise in Nova Scotia, offset by a$33 million pre-tax gain on the sale of a subsidiary, Energy America.
Operating Income—2001 Compared to 2000
California Utility Revenues and Cost of Sales. Natural gas revenues increased to $4.4 billion in 2001from $3.3 billion in 2000, and the cost of natural gas distributed increased to $2.5 billion in 2001 from$1.6 billion in 2000, primarily as the result of higher average costs and higher natural gas volumes in2001. For the fourth quarter, natural gas revenues decreased to $773 million in 2001 from $969 millionin 2000, and the cost of natural gas distributed decreased to $319 million in 2001 from $511 million in2000. These decreases were attributable to the overall decrease in natural gas costs during the fourthquarter of 2001.
SEMPRA ENERGY 3.

Electric revenues decreased to $1.7 billion in 2001 from $2.2 billion in 2000, and the cost of electricfuel and purchased power decreased to $0.8 billion in 2001 from $1.3 billion in 2000. For the fourthquarter, electric revenues decreased to $284 million in 2001 from $717 million in 2000, and the cost ofelectric fuel and purchased power decreased to $87 million in 2001 from $485 million in 2000. Thesedecreases were attributable to the DWR’s purchasing SDG&E’s net short position for most of 2001, ascompared to higher electric commodity costs paid directly by SDG&E in 2000. See additionaldiscussion below in “California Utility Operations.”
Other Operating Revenues. Other operating revenues increased to $1.7 billion in 2001 from$1.3 billion in 2000, primarily due to higher revenues from SET. For the fourth quarter of 2001, otheroperating revenues decreased to $242 million from $481 million in 2000 primarily due to lowerrevenues from SET, resulting from the decreased volatility in energy commodity markets in the fourthquarter of 2001. See additional discussion below in “Sempra Energy Global Enterprises.”
Other Cost of Sales. Other cost of sales increased to $873 million in 2001 from $648 million in 2000,as discussed below in “Sempra Energy Global Enterprises.”
Other Operating Expenses. Other operating expenses increased to $1.8 billion in 2001 from$1.6 billion in 2000, as discussed below in “California Utility Operations” and “Sempra GlobalEnterprises.”
Other Income
Other income, which primarily consists of interest income from short-term investments, equity earningsfrom unconsolidated subsidiaries and interest on regulatory balancing accounts, was $57 million,$86 million and $127 million in 2002, 2001 and 2000, respectively. The decrease in 2002 was primarilydue to lower interest income from short-term investments and lower equity earnings from internationalinvestments, partially offset by increased earnings from SER’s investment in the El Dorado powerplant, as well as $22 million (pretax) in business interruption insurance proceeds related to outages atSER’s El Dorado plant during 2001. The decrease in 2001 was primarily due to lower earnings fromthe El Dorado power plant and the 2000 gain on the sale of SoCalGas’ minority investment in PlugPower, partially offset by higher interest income and the $19 million gain from SDG&E’s sale of itsproperty in Blythe, California in 2001.
Other income for the fourth quarter was $16 million, $3 million and $42 million for 2002, 2001, and2000, respectively. The increase in 2002 was due primarily to lower net regulatory interest expense.The decrease in 2001 from 2000 was due primarily to decreased equity earnings from unconsolidatedsubsidiaries.
Interest Expense
Interest expense was $294 million, $323 million and $286 million in 2002, 2001 and 2000, respectively.The decrease in 2002 was primarily due to an increase in capitalized interest related to constructionprojects, lower interest rates and the favorable effects of interest rate swaps. Interest rates on certainof the company’s debt can vary with credit ratings, as described in Notes 4 and 5 of the notes toConsolidated Financial Statements. The increase in 2001 was primarily due to interest expenseincurred on long-term debt issued in December of 2000 and June of 2001, and on higher short-termcommercial paper borrowings in 2001.
Interest expense for the fourth quarter was $70 million, $63 million and $70 million in 2002, 2001 and2000, respectively. The increase in 2002 was attributable to the issuance of $600 million of equity unitsby the company and $250 million of first-mortgage bonds issued by SoCalGas, partially offset by
SEMPRA ENERGY 4.

debt maturities at the California Utilities. The decrease in 2001 was due to lower debt balances andinterest rates.
Income Taxes
Income tax expense was $146 million, $213 million and $270 million in 2002, 2001 and 2000,respectively. The effective income tax rates were 20.2 percent, 29.1 percent and 38.6 percent,respectively. The decreases in income tax expense and the effective rate for 2002 compared to 2001were primarily due to the favorable resolution of income-tax issues at SDG&E in the second quarter of2002 and increased income tax credits from synthetic fuel investments in 2002. The decreases inincome tax expense and in the effective tax rate for 2001 compared to 2000 were primarily due to thefavorable settlement of various tax issues and higher income tax credits, partially offset by the fact thatany income tax benefits from certain losses outside the United States, primarily related to the NovaScotia franchise surrender noted above, were not yet recordable in 2001.
Income tax expense for the fourth quarter was $3 million in 2002, compared to a benefit of $40 millionin 2001 and expense of $103 million in 2000. The increase in 2002 was due primarily to increasedincome before taxes, as well as the resolution in 2001 of prior-year tax issues. The decrease in 2001compared to 2000 was due to the 2001 prior-year tax resolution, and lower income before taxes in thefourth quarter of 2001. The low effective income tax rate in the 2002 quarter was primarily due toincreased income tax credits from affordable housing and synthetic fuel investments. Theseinvestments are discussed in Note 3 of the notes to Consolidated Financial Statements.
Net Income
Net income was $591 million, or $2.87 per diluted share of common stock, in 2002, compared to$518 million, or $2.52 per diluted share of common stock in 2001, and $429 million, or $2.06 perdiluted share of common stock in 2000. Net income in 2002 includes an extraordinary item of$16 million ($0.08 per diluted share of common stock) net of tax, related to SET’s acquisitions in 2002.($2 million of the after-tax gain was recorded in the quarter ended June 30, 2002, and $14 million in thequarter ended December 31, 2002.) Excluding the effects of the extraordinary item, the increase in netincome in 2002 was primarily due to improved results at SER, lower interest expense, the 2001 after-tax charge of $25 million for the surrender of the Nova Scotia natural gas distribution franchise and theeffects of the income-tax matters referred to above, partially offset by lower income in 2002 from SETand the $20 million after-tax gain on sale of Energy America in 2001. The increase in 2001 comparedto 2000 was primarily due to higher earnings from SET, as a result of higher volatility in the energymarkets during the first half of 2001 and a substantial increase in trading volumes. Also contributing tothe increase was the gain on the sale of Energy America, the favorable settlement of income tax issuesand the effect in 2000 of a $30 million after-tax charge at SDG&E for regulatory issues. These factorswere partially offset by the surrender of the Nova Scotia natural gas distribution franchise, and lowerincome from SER and SEI. See additional discussion in “California Utility Operations”, “Sempra EnergyTrading” and “Sempra Energy International” below.
Net income for the fourth quarter was $148 million, or $0.72 per diluted share of common stock in2002, compared with $107 million, or $0.52 per diluted share of common stock in 2001, and$95 million, or $0.47 per diluted share of common stock in 2000. Net income for the fourth quarter of2002 includes the extraordinary item related to SET’s acquisitions that increased net income by$14 million ($0.07 per diluted share of common stock). Excluding the effects of the extraordinary item,the increase in quarterly earnings in 2002 was primarily attributable to increased earnings at SET (fromincreased volatility in the energy markets and the contribution from the metals business) and increasedearnings at SER from the DWR contract, offset partially by decreased profitability from SEI’s Argentineinvestments. The increase in quarterly earnings for 2001 compared to 2000 was primarily attributable
SEMPRA ENERGY 5.

to the favorable settlement of various income tax issues, partially offset by lower prices and reducedvolatility in the energy markets, and development costs of new power plants.
Book value per share was $13.79, $13.16 and $12.35, at December 31, 2002, 2001 and 2000,respectively. The increases in 2002 and 2001 were primarily the result of net income exceeding thesum of dividends and the foreign currency translation losses related to the Argentine peso (See Note 1of the notes to Consolidated Financial Statements).
California Utility Operations
To understand the operations and financial results of the California Utilities, it is important tounderstand the ratemaking procedures to which they are subject.
The California Utilities are regulated primarily by the California Public Utilities Commission (CPUC). It isthe responsibility of the CPUC to regulate investor-owned utilities (IOUs) in a manner that serves thebest interests of their customers while providing the IOUs the opportunity to earn a reasonable returnon investment.
In 1996, California enacted legislation restructuring California’s electric industry. The legislation andrelated decisions of the CPUC were intended to stimulate competition and reduce electric rates. Aspart of the framework for a competitive electric-generation market, the legislation established theCalifornia Power Exchange (PX) and the Independent System Operator (ISO). The PX served as awholesale power pool and the ISO scheduled power transactions and access to the electrictransmission system. Supply/demand imbalances and a number of other factors resulted in abnormallyhigh electric commodity costs beginning in mid-2000 and continuing into 2001. Due to subsequentindustry restructuring developments, the PX suspended its trading operations in January 2001. As aresult of the passage of Assembly Bill (AB) X1 in February 2001, the DWR began to purchase powerfrom generators and marketers to supply a portion of the power requirements of the state’s populationthat is served by IOUs. Through December 31, 2002, the DWR was purchasing SDG&E’s full net shortposition (the power needed by SDG&E’s customers other than that provided by SDG&E’s nucleargenerating facilities or its previously existing purchased power contracts). Starting on January 1, 2003,SDG&E and the other IOUs resumed their electric commodity procurement function based on a CPUCdecision issued in October 2002.
The natural gas industry experienced an initial phase of restructuring during the 1980s by deregulatingnatural gas sales to noncore customers. In December 2001, the CPUC issued a decision related tonatural gas industry restructuring, adopting several provisions that the California Utilities believe willmake natural gas service more reliable, more efficient and better tailored to the desires of customers.The CPUC anticipated implementation during 2002; however, implementation has been delayed.
In connection with restructuring of the electric and natural gas industries, the California Utilitiesreceived approval from the CPUC for Performance-Based Ratemaking (PBR). Under PBR, incomepotential is tied to achieving or exceeding specific performance and productivity measures, such asdemand side management and customer growth, rather than solely to expanding utility plant.
See additional discussion of these situations under “Factors Influencing Future Performance” and inNotes 13 and 14 of the notes to Consolidated Financial Statements.
SEMPRA ENERGY 6.

The tables below summarize the California Utilities’ natural gas and electric volumes and revenues bycustomer class for the years ended December 31, 2002, 2001 and 2000.
NATURAL GAS SALES, TRANSPORTATION & EXCHANGE(Dollars in millions, volumes in billion cubic feet)for the years ended December 31
Natural Gas SalesTransportation &
Exchange Total
Volumes Revenue Volumes Revenue Volumes Revenue
2002:Residential 289 $2,089 2 $ 8 291 $2,097Commercial and industrial 117 635 294 183 411 818Electric generation plants — — 264 51 264 51Wholesale — — 16 4 16 4
406 $2,724 576 $246 982 2,970
Balancing accounts andother 285
Total $3,255
2001:Residential 297 $2,797 2 $ 6 299 $2,803Commercial and industrial 113 903 262 174 375 1,077Electric generation plants — — 417 104 417 104Wholesale — — 40 10 40 10
410 $3,700 721 $294 1,131 3,994Balancing accounts and
other 377
Total $4,371
2000:Residential 284 $2,446 3 $ 13 287 $2,459Commercial and industrial 107 760 339 225 446 985Electric generation plants — — 373 130 373 130Wholesale — — 25 18 25 18
391 $3,206 740 $386 1,131 3,592Balancing accounts and
other (287)
Total $3,305
SEMPRA ENERGY 7.

ELECTRIC TRANSMISSION AND DISTRIBUTION(Dollars in millions, volumes in million kWhs)for the years ended December 31
2002 2001 2000
Volumes Revenue Volumes Revenue Volumes Revenue
Residential 6,266 $ 649 6,011 $ 775 6,304 $ 730Commercial 6,053 633 6,107 753 6,123 747Industrial 1,883 160 2,792 325 2,614 310Direct access 3,448 117 2,464 84 3,308 99Street and highway lighting 88 9 89 10 74 7Off-system sales 5 — 413 88 899 59
17,743 1,568 17,876 2,035 19,322 1,952Balancing and other (306) (359) 232
Total 17,743 $1,262 17,876 $1,676 19,322 $2,184
Although commodity-related revenues from the DWR’s purchasing of SDG&E’s net short position arenot included in revenue, the associated volumes and distribution revenue are included herein.
California Utility Operations—2002 Compared to 2001
Natural Gas Revenue and Cost of Gas Distributed. Natural gas revenues decreased to $3.3 billion in2002 from $4.4 billion in 2001, and the cost of natural gas distributed decreased to $1.4 billion in 2002from $2.5 billion in 2001. The decrease in natural gas revenue is primarily due to lower natural gasprices and decreased transportation for electric generation plants and the loss of approximately100 million cubic feet per day in load on the San Diego system when the North Baja pipeline beganservice in September 2002. The decrease in cost of natural gas distributed was primarily due to loweraverage natural gas commodity prices. For the fourth quarter, natural gas revenues increased to$968 million in 2002 from $773 million in 2001, and the cost of natural gas distributed increased to$436 million in 2002 from $319 million in 2001 due primarily to increased natural gas prices.
Under the current regulatory framework, changes in core-market natural gas prices (natural gaspurchased for customers that are primarily residential and small commercial and industrial customers,without alternative fuel capability) or consumption levels do not affect net income, since core customerrates generally recover the actual cost of natural gas on a substantially concurrent basis andconsumption levels are fully balanced. However, SoCalGas’ Gas Cost Incentive Mechanism (GCIM)allows SoCalGas to share in the savings or costs from buying natural gas for customers below orabove monthly benchmarks. The mechanism permits full recovery of all costs within a tolerance bandabove the benchmark price and refunds all savings within a tolerance band below the benchmarkprice. The costs or savings outside the tolerance band are shared between customers andshareholders. See further discussion in Notes 1 and 14 of the notes to Consolidated FinancialStatements.
Electric Revenue and Cost of Electric Fuel and Purchased Power. Electric revenues decreased to$1.3 billion in 2002 from $1.7 billion in 2001, and the cost of electric fuel and purchased powerdecreased to $0.3 billion in 2002 from $0.8 billion in 2001. These decreases were primarily due to theDWR’s purchases of SDG&E’s net short position for a full year in 2002, the effect of lower electriccommodity costs and decreased off-system sales. Under the current regulatory framework, changes incommodity costs normally do not affect net income. The commodity costs associated with the DWR’spurchases and the corresponding sale to SDG&E’s customers are not included in the Statements ofConsolidated Income as SDG&E was merely transmitting the electricity from the DWR to the
SEMPRA ENERGY 8.

customers. Similarly, in 2001, PX/ISO power revenues have been netted against purchased-powerexpense to avoid double counting as SDG&E sold power to the PX/ISO and then purchased powertherefrom.
For the fourth quarter, electric revenues increased to $312 million in 2002 from $284 million in 2001,and the cost of electric fuel and purchased power decreased to $76 million in 2002 from $87 million in2001. The increase in electric revenues was due primarily to higher electric distribution andtransmission revenue as well as additional revenues from the Incremental Cost Incentive Pricing (ICIP)mechanism, while the decrease in cost of electric fuel and purchased power was due primarily to adecrease in average electric commodity costs. Refer to Note 13 of the notes to Consolidated FinancialStatements for further discussion of ICIP and the San Onofre Nuclear Generating Station (SONGS).
Other Operating Expenses. Other operating expenses increased to $1.4 billion in 2002 from$1.3 billion in 2001. For the fourth quarter, other operating expenses increased to $445 million in 2002from $366 million in 2001. The increases were primarily due to higher labor and employee benefitscosts and increases in other operating costs, including operating costs that are associated withSDG&E’s nuclear generating facilities and balancing account costs at SoCalGas.
California Utility Operations—2001 Compared to 2000
Natural Gas Revenue and Cost of Gas Distributed. Natural gas revenues increased to $4.4 billion in2001 from $3.3 billion in 2000, and the cost of natural gas distributed increased to $2.5 billion in 2001from $1.6 billion in 2000. These increases were due to higher average natural gas commodity pricesand higher volumes of natural gas sales in 2001. For the fourth quarter, natural gas revenuesdecreased to $773 million in 2001 from $969 million in 2000, and the cost of natural gas distributeddecreased to $319 million in 2001 from $511 million in 2000. These decreases were attributable to thelower natural gas costs in the fourth quarter of 2001.
Electric Revenue and Cost of Electric Fuel and Purchased Power. Electric revenues decreased to$1.7 billion in 2001 from $2.2 billion in 2000, and the cost of electric fuel and purchased powerdecreased to $0.8 billion in 2001 from $1.3 billion in 2000. For the fourth quarter, electric revenuesdecreased to $284 million in 2001 from $717 million in 2000, and the cost of electric fuel andpurchased power decreased to $87 million in 2001 from $485 million in 2000. These decreases wereprimarily due to the DWR’s purchasing of SDG&E’s net short position starting in February 2001, offsetby a $30 million after-tax charge for regulatory issues in 2000 related to a potential regulatorydisallowance for the acquisition of wholesale power in the newly deregulated California market.
Other Operating Expenses. Other operating expenses increased to $1.3 billion in 2001 from$1.1 billion in 2000. For the fourth quarter, other operating expenses increased to $366 million in 2001from $338 million in 2000. These increases were primarily due to increased wages and employeebenefits costs, as well as increases in the operating costs that are associated with balancing accountsand, therefore, do not affect net income.
SEMPRA ENERGY 9.

Sempra Energy Global EnterprisesThe following table is a summary of Global’s operating revenues, cost of sales, operating expensesand operating income (loss) by business unit.
For the Years ended December 31
Dollars in millions 2002 2001 2000
OPERATING REVENUESSempra Energy Trading $ 821 $1,047 $ 822Sempra Energy Resources 349 178 11Sempra Energy International 176 289 159Sempra Energy Solutions 177 180 103Other 2 59 243
Total $1,525 $1,753 $1,338
COST OF SALESSempra Energy Trading $ 293 $ 320 $ 266Sempra Energy Resources 218 185 2Sempra Energy International 148 257 141Sempra Energy Solutions 56 92 57Other — 26 211
Total $ 715 $ 880 $ 677
OPERATING EXPENSESSempra Energy Trading $ 304 $ 370 $ 269Sempra Energy Resources 44 21 19Sempra Energy International 49 70 40Sempra Energy Solutions 66 68 51Other 20 32 42
Total $ 483 $ 561 $ 421
OPERATING INCOME (LOSS)Sempra Energy Trading $ 203 $ 330 $ 256Sempra Energy Resources 84 (29) (13)Sempra Energy International (34) (51) (30)Sempra Energy Solutions 43 4 (18)Other (20) (3) (21)
Total $ 276 $ 251 $ 174
Operating income (loss) is also net of depreciation and amortization expense, and taxes other thanincome taxes. It does not include foreign-currency gains, interest income, equity earnings fromunconsolidated subsidiaries and other items that are included in “other income—net” in the Statementsof Consolidated Income.
Revenues and cost of sales for the other business units of Global were higher in 2000 due to the saleof Energy America in January 2001.
Global—2002 Compared to 2001Operating Revenues. Operating revenues for Global decreased to $1.5 billion in 2002 from$1.8 billion in 2001. This decrease was primarily due to lower revenues from SET as a result ofdecreased volatility in energy commodity markets and decreased energy commodity prices during2002, partially offset by increased revenues from new acquisitions. Additionally, SEI experienced lowerrevenues as a result of decreased prices for power from its Rosarito pipeline. These decreases werepartially offset by the increase in SER’s sales to the DWR that commenced in June 2001 throughSeptember 2001 at below cost, and recommenced in April 2002 at favorable contract rates under its
SEMPRA ENERGY 10.

long-term contract. For the fourth quarter of 2002, other operating revenues increased to $416 millionfrom $294 million in 2001. The increase was primarily due to increased revenues at SET as a result ofhigher volatility in energy commodity markets in the fourth quarter of 2002, as well as the increasedrevenues at SER.
Cost of Sales. Other cost of sales decreased to $715 million in 2002 from $880 million in 2001. Thisdecrease was primarily due to the lower operating revenues discussed above for SET and SEI, andlower costs for SES related to project deliveries, offset by increased costs associated with SER’scontract with the DWR. For the fourth quarter, other cost of sales increased to $207 million in 2002from $180 million in 2001, primarily related to the increased operating revenues at SET and SER.
Operating Expenses. Operating expenses for Global decreased to $483 million in 2002 from$561 million in 2001. Operating expenses decreased due primarily to decreased labor costs associatedwith the lower SET and SEI revenues discussed above. For the fourth quarter, operating expensesincreased to $138 million in 2002 from $109 million in 2001, due primarily to increased costsassociated with the higher fourth quarter revenues at SET and SER.
Global—2001 Compared to 2000
Operating Revenues. Operating revenues for Global increased to $1.8 billion in 2001 from $1.3 billionin 2000. This increase was primarily due to higher revenues from SET as a result of increased volatilityand trading volumes in energy commodity markets during the first half of 2001, and due to SER’scontracted sale of electricity to the DWR at a discounted price in 2001. This was partially offset by thesale of Energy America in the first quarter of 2001. For the fourth quarter, other operating revenuesdecreased in 2001 from 2000 primarily due to lower revenues from SET as the result of the decreasedvolatility in energy commodity markets in the fourth quarter of 2001, as well as the sale of EnergyAmerica.
Cost of Sales. Other cost of sales increased to $880 million in 2001 from $677 million in 2000,primarily due to the increase in operating revenues for SET noted above and SER’s costs associatedwith the DWR contract. For the fourth quarter, other cost of sales decreased in 2001 from 2000,primarily due to the decrease in the volatility of energy commodity markets previously mentioned.
Operating Expenses. Operating expenses increased to $561 million in 2001 from $421 million in2000 due primarily to increased labor costs for SET’s operations. For the fourth quarter, operatingexpense decreased in 2001 from 2000, primarily due to lower volatility of energy commodity markets.
SEMPRA ENERGY 11.

Net Income by Business Unit
For the years ended December 31
Dollars in millions 2002 2001 2000
California UtilitiesSouthern California Gas Company $212 $207 $ 206San Diego Gas & Electric 203 177 145
Total Utilities 415 384 351Global Enterprises
Sempra Energy Trading 126 196 155Sempra Energy Resources 60 (27) 29Sempra Energy International 26 25 33Sempra Energy Solutions 21 1 (14)Interest and other (38) (22) (28)
Total Global Enterprises 195 173 175Sempra Energy Financial 36 28 28Parent and other (55) (67) (125)
Consolidated $591 $518 $ 429
Southern California Gas Company
Net income for SoCalGas increased to $212 million in 2002 compared to $207 million in 2001 primarilydue to lower interest expense in 2002, partially offset by higher depreciation in 2002 and the 2000GCIM award recorded in 2001. Net income for the fourth quarter of 2002 decreased compared to thefourth quarter of 2001, primarily due to increased operating costs, partially offset by lower interestexpense in 2002.
Net income for SoCalGas increased to $207 million in 2001 from $206 million in 2000 primarily due tohigher natural gas volumes in 2001, offset by the gain on sale of SoCalGas’ minority investment inPlug Power during 2000. Net income for the fourth quarter of 2001 decreased compared to the fourthquarter of 2000, primarily due to the sale of the investment in Plug Power.
San Diego Gas & Electric
Net income increased to $203 million in 2002 from $177 million in 2001. The increase was primarilydue to a $25 million after-tax benefit from the favorable resolution of prior year income-tax issues in thesecond quarter of 2002 and lower interest expense in 2002, partially offset by the 2001 gain on sale ofSDG&E’s Blythe property and lower interest income in 2002. Net income increased to $53 million forthe fourth quarter of 2002, compared to $45 million for the corresponding period in 2001 primarily dueto higher natural gas and electric distribution and transmission revenues and income tax adjustmentsin 2002, partially offset by the 2001 Blythe gain.
Net income increased to $177 million in 2001 from $145 million in 2000. The increase was primarilydue to the Blythe gain, lower interest expense and a $30 million after-tax charge in 2000 related to apotential regulatory disallowance. These increases were partially offset by lower interest income fromaffiliates. Net income increased to $45 million for the fourth quarter of 2001, compared to $38 millionfor the corresponding period in 2000 as a result of the Blythe property sale.
SEMPRA ENERGY 12.

Sempra Energy Trading
SET recorded net income of $126 million in 2002, compared to net income of $196 million and$155 million in 2001 and 2000, respectively. The decrease in net income in 2002 compared to 2001was primarily due to increased revenues in 2001 resulting from higher volatility in energy commoditymarkets during the first half of 2001, partially offset by the extraordinary gain of $16 million, earningsfrom new acquisitions and increased synthetic fuel credits in 2002. The increase in net income for 2001compared to 2000 was primarily due to high volatility in energy commodity markets during the first halfof 2001 and an increase in trading volumes, partially offset by reduced profitability in Europe.
A summary of SET’s net unrealized revenues for trading activities for the years ended December 31,2002 and 2001 (dollars in millions) follows:
2002 2001
Balance at beginning of year $ 405 $ (72)Additions 442 1,333Realized (667) (856)
Balance at end of year $ 180 $ 405
The estimated fair values for SET’s net unrealized trading assets as of December 31, 2002, and theperiods during which unrealized revenues are expected to be realized, are (dollars in millions):
Source of fair value 2003
2004and
2005
2006and
2007 Thereafter
TotalFair
Value
Prices actively quoted $ 175 $100 $12 $— $ 287Prices provided by other external
sources (6) (3) (4) 21 8Prices based on models and other valuation
methods 4 9 11 2 26
Over-the-counter revenue (1) 173 106 19 23 321Exchange contracts (2) (166) 24 1 — (141)
Total $ 7 $130 $20 $23 $ 180
(1) The present value of unrealized revenue to be received or (paid) from outstanding OTC contracts.(2) Cash (paid) or received associated with open Exchange contracts.
Sempra Energy Resources
SER recorded net income of $60 million in 2002, compared to a net loss of $27 million in 2001 and netincome of $29 million in 2000. The increase in results for 2002 was primarily due to SER’s sales to theDWR that recommenced in April 2002 at contract rates under its long-term contract, compared to 2001sales which were at below cost, and the recovery in 2002 of business interruption insurance related tooutages at the El Dorado plant in 2001. Losses in 2001 arose from development costs of newgeneration projects and from selling power to the DWR at below cost in 2001.
Sempra Energy International
Net income for SEI in 2002 was $26 million, compared to $25 million and $33 million for 2001 and2000, respectively. The increase in net income for 2002 was primarily due to the after-tax charge of$25 million in 2001 following the surrender of Sempra Atlantic Gas’ natural gas distribution franchise inNova Scotia, partially offset by reduced profitability from SEI’s Argentine subsidiaries in 2002. Adiscussion of the Argentine economic issue is included in Notes 1 and 3 of the notes to
SEMPRA ENERGY 13.

Consolidated Financial Statements. The decrease in net income for 2001 was primarily due to thesurrender of the natural gas franchise noted above, partially offset by increased earnings at the LatinAmerican subsidiaries. Additional information concerning the company’s international operations isprovided in Note 3 of the notes to Consolidated Financial Statements.
Sempra Energy Solutions
SES recorded net income of $21 million in 2002, compared to net income of $1 million in 2001 and anet loss of $14 million in 2000. The increase in net income from 2001 to 2002 is primarily due toincreased commodity sales. The loss for 2000 is primarily attributable to start-up costs, whichcontinued in 2001 but which were more than offset by increased commodity sales in 2001.
In delivering electric and natural gas supplies to its commercial and industrial customers, SES hedgesits price exposure through the use of exchange-traded and over-the-counter financial instruments. Asummary of SES’ net unrealized revenues for trading activities for the years ended December 31, 2002and 2001 (dollars in millions) follows:
2002 2001
Balance at beginning of year $ 55 $ 1Additions 90 62Realized (55) (8)
Balance at end of year $ 90 $55
The estimated fair values for SES’ net unrealized trading assets as of December 31, 2002, and theperiods during which unrealized revenues are expected to be realized, are (dollars in millions):
Source of fair value 2003
2004and
2005
2006and
2007 Thereafter
TotalFair
Value
Exchange contracts $ 1 $— $ — $ — $ 1Prices actively quoted 48 32 8 1 89
Total $49 $32 $ 8 $ 1 $90
Sempra Energy Financial
SEF invests as a limited partner in affordable-housing properties. SEF’s portfolio includes1,300 properties throughout the United States, including Puerto Rico and the Virgin Islands. Theseinvestments are expected to provide income tax benefits (primarily from income tax credits) over10-year periods. SEF also has an investment in a limited partnership which produces synthetic fuelfrom coal. SEF recorded net income of $36 million in 2002 and $28 million in each of 2001 and 2000.The increase in 2002 was due primarily to increased tax benefits resulting from increased synthetic fuelproduction. Whether SEF will invest in additional properties will depend on Sempra Energy’s incometax position.
Parent and Other
Net losses for Parent and Other were $55 million, $67 million and $125 million in 2002, 2001 and 2000,respectively. The decrease in net losses in 2002 was attributable to the consolidating elimination ofintercompany profits. During 2001, certain intercompany mark-to-market revenues recognized bysubsidiaries were deferred in consolidation until the completion of the sales to the end customer. In2002, most of these deferred revenues were no longer deferred. The decrease in net losses from 2000to 2001 was due primarily to charges in 2000 relating to income tax and credit issues associated withpre-merger operations of subsidiaries that are no longer active.
SEMPRA ENERGY 14.

CAPITAL RESOURCES AND LIQUIDITY
The company’s California Utility operations are the major source of liquidity. Funding of other businessunits’ capital expenditures is partly dependent on the California Utilities’ paying sufficient dividends toSempra Energy. Beginning in the third quarter of 2000 and continuing into the first quarter of 2001,SDG&E’s liquidity and its ability to make funds available to Sempra Energy were adversely affected bythe electric cost undercollections resulting from a temporary ceiling on electric rates legislativelyimposed in response to high electric commodity costs. Growth in these undercollections ceased as aresult of an agreement with the DWR, under which the DWR was obligated to purchase electricity forSDG&E’s customers to fill SDG&E’s full net short position consisting of the power and ancillaryservices required by SDG&E’s customers that were not provided by SDG&E’s nuclear generatingfacilities or its previously existing purchased-power contracts. The agreement with the DWR extendedthrough December 31, 2002. Starting on January 1, 2003, SDG&E and other California IOUs resumedtheir electric commodity procurement function based on a CPUC decision issued in October 2002. Inaddition, AB 57 and implementing decisions by the CPUC provide for periodic adjustments to rates thatwould reflect the costs of power and are intended to ensure the timely recovery of anyundercollections.
Another issue with potential implications to capital resources and liquidity is the ownership of certainpower sale contracts. The company believes that all profits associated with the contracts properly arefor the benefit of SDG&E shareholders rather than customers, whereas the CPUC asserted that all theprofits should accrue to the benefit of customers. On December 19, 2002, in a 3-to-2 decision, theCPUC approved a proposed settlement that divides the profits from these contracts, $199 million forSDG&E customers and $173 million for SDG&E shareholders. Of the $199 million in profits allocated tocustomers, $175 million had already been credited to ratepayers in 2001. The remaining $24 millionwas applied as a balancing account transfer that reduced the AB 265 balancing account in December2002. The profits allocated to customers reduce SDG&E’s AB 265 undercollection, but do notadversely affect SDG&E’s financial position, liquidity or results of operations. The term of acommissioner who voted to approve the settlement has expired, and a new commissioner has beenappointed. On January 29, 2003, the CPUC’s Office of Ratepayer Advocates, the City of San Diegoand the Utility Consumers’ Action Network, a consumer-advocacy group, filed requests for a CPUCrehearing of the decision. On February 13, 2003, the company filed its opposition to rehearing of thedecision. Parties requesting a rehearing and parties to any rehearing may also appeal the CPUC’s finaldecision to the California appellate courts.
For additional discussion, see “Factors Influencing Future Performance-Electric Industry Restructuringand Electric Rates” herein and Note 13 of the notes to Consolidated Financial Statements.
At December 31, 2002, the company had $455 million in cash and $2.25 billion in unused, committedlines of credit available. As of December 31, 2002, $600 million of the lines was supporting commercialpaper and variable-rate debt. In addition, in February 2003, the company issued $400 million of seniorunsecured notes with a 10-year term at a fixed interest coupon of 6 percent. The proceeds were usedto repay short-term debt.
Management believes these amounts, cash flows from operations, and new security issuances will beadequate to finance capital expenditure requirements, shareholder dividends, any new businessacquisitions or start-ups, and other commitments. If cash flows from operations were significantlyreduced and/or the company was unable to issue new securities under acceptable terms, neither ofwhich is considered likely, the company would be required to reduce non-utility capital expendituresand investments in new businesses. Management continues to regularly monitor the company’s abilityto adequately meet the needs of its operating, financing and investing activities.
At the California Utilities, cash flows from operations and from new and refunding debt issuances areexpected to continue to be adequate to meet utility capital expenditure requirements and providesignificant dividends to Sempra Energy.
SEMPRA ENERGY 15.

SET provides cash to or requires cash from Sempra Energy as the level of its net trading assetsfluctuates with prices, volumes, margin requirements (which are substantially affected by credit ratingsand price fluctuations) and the length of its various trading positions. Its status as a source or use ofSempra Energy cash also varies with its level of borrowing from its own sources. During 2002, SET’sborrowings from the company varied from a low of $6 million to a high of $754 million, and were$418 million at December 31, 2002. Company management continuously monitors the level of SET’scash requirements in light of the company’s overall liquidity. Such monitoring includes the proceduresdiscussed in “Market Risk” below.
SER’s projects are expected to be financed through a combination of the existing synthetic lease,project financing, SER’s borrowings and funds from the company. Its capital expenditures over the nextseveral years may require some additional funding.
SEI is expected to require funding from the company and/or external sources to continue theexpansion of its existing natural gas distribution operations in Mexico and its planned development ofliquefied natural gas (LNG) facilities.
SES is expected to require moderate amounts of cash in the near future as its commodity and energyservices businesses continue to grow.
SEF is expected to continue to be a net provider of cash through reductions of consolidated income taxpayments resulting from its investments in affordable housing and synthetic fuel.
CASH FLOWS FROM OPERATING ACTIVITIES
Net cash provided by operating activities totaled $1.4 billion, $0.7 billion and $0.9 billion for 2002, 2001and 2000, respectively. The increase in cash flows from operations in 2002 compared to 2001 wasattributable to SDG&E’s collection of a portion of prior purchased-power costs (the remaining balanceof which decreased to $392 million at December 31, 2001 and $215 million at December 31, 2002 froma high in mid-2001 of $750 million), the refunds to large customers in 2001 resulting from AB 43X(which extended a temporary 6.5-cents rate cap to include SDG&E’s large customers), and the changeto a net income tax liability position at December 31, 2002 compared to a net income tax asset positionat the end of 2001. In addition, cash flows from operations increased due to less growth in net tradingassets and the payment of higher trade payables in 2001. These increases were partially offset by adecrease in deferred income taxes and investment tax credits and higher accounts receivable in 2002resulting from an increase in SoCalGas’ natural gas commodity costs for the fourth quarter of 2002compared to the corresponding period in the prior year. See further discussion on the 2001 impact ofregulatory balancing accounts activity for the California Utilities below.
The decrease in cash flows from operating activities in 2001 compared to 2000 was primarilyattributable to the decrease in accounts payable due to lower natural gas costs in 2001 compared to2000 and the result of balancing account activity at SoCalGas. This included returns of priorovercollections and the temporary effects of higher-than-expected costs of natural gas and public-purpose programs and lower-than-expected sales volumes. The decrease was partially offset by loweraccounts receivable balances at the end of 2001. The SoCalGas activity was further offset by theincrease in overcollected balancing accounts at SDG&E and the fact that 2001 included refunds bySDG&E to large customers resulting from AB 43X. In 2000, SDG&E paid higher customer refunds forsurplus rate-reduction-bond proceeds.
SEMPRA ENERGY 16.

CASH FLOWS FROM INVESTING ACTIVITIES
Net cash used in investing activities totaled $1.7 billion, $1.0 billion and $0.9 billion for 2002, 2001 and2000, respectively. The increase in cash used in investing activities in 2002 compared to 2001 wasprimarily due to increased capital expenditures primarily at SER and the California Utilities.
For 2001, cash flows used in investing activities primarily consisted of capital expenditures for theupgrade and expansion of utility plant in California, construction costs for facilities under developmentin Mexico, and investments in generating plants being constructed in the western United States,partially offset by net proceeds received from the sale of the company’s investment in Energy America.
Capital Expenditures for Property, Plant and Equipment
Capital expenditures increased to $1.2 billion in 2002, compared with $1.1 billion in 2001. The increasewas due to higher expenditures by SER and the California Utilities in 2002. Capital expenditures in2001 were $300 million higher than in 2000 primarily due to power plant construction costs at SER.See further discussion below.
The California Utilities
Capital expenditures for property, plant, and equipment by the California Utilities were $731 million in2002 compared to $601 million in 2001 and $522 million in 2000. The increases in 2002 and 2001were due to additions to SDG&E’s natural gas and electric distribution systems, improvements toSoCalGas’ distribution system, and expansion of pipeline capacity to meet increased demand byelectric generators and by commercial and industrial customers. The expansion of SoCalGas’ pipelinecapacity was completed in 2002.
Sempra Energy Resources
On October 31, 2002, SER purchased a 305-megawatt, coal-fired power plant (renamed Twin OaksPower) from Texas-New Mexico Power Company for $120 million. SER has a five-year contract to sellsubstantially all of the output of the plant. In connection with the acquisition, SER also assumed acontract which includes annual commitments to purchase lignite coal either until an aggregateminimum volume has been achieved or through 2025. See discussion below on SER’s 2003commitments for construction of its power plants.
In September 2001, ground was broken for the Mesquite Power Plant. Located near Phoenix, Arizona,the $690 million, 1,250-megawatt project will provide electricity to wholesale energy markets in theSouthwest region. Commercial operations at 50-percent capacity are expected to commence in June2003 and project completion is anticipated in January 2004. The project is being financed primarily viathe synthetic lease agreement described in Note 15 of the notes to Consolidated Financial Statements.Construction expenditures as of December 31, 2002 were $558 million and SER has commitments of$50 million related to this project. Financing under the synthetic lease in excess of $280 millionrequires 103 percent collateralization through the purchase of U.S. Treasury obligations in similaramounts. During 2002, the company purchased $228 million of U.S. Treasury obligations as collateral,which is included in “Investments” on the Consolidated Balance Sheets.
In February 2001, the company announced plans to construct Termoelectrica de Mexicali, a $350million, 600-megawatt power plant near Mexicali, Mexico. Fuel for the plant will be supplied via thepipeline from Arizona to Tijuana discussed below. It is anticipated that the electricity produced by theplant will be available for markets in California, Arizona and Mexico via a newly constructed 230,000-volt transmission line. Construction of the power plant began in the second half of 2001. During 2002
SEMPRA ENERGY 17.

and as of December 31, 2002, $158 million and $308 million, respectively, have been invested in theproject, which has begun testing and is scheduled for completion by mid-2003.
Sempra Energy International
In the third quarter of 2002, SEI completed construction of the 140-mile Gasoducto Bajanorte Pipelinethat connects the Rosarito Pipeline south of Tijuana, Mexico, with a pipeline being built by PG&ECorporation that will connect to Arizona. The 30-inch pipeline can deliver up to 500 million cubic feetper day of natural gas to new generation facilities in Baja California, including SER’s Termoelectrica deMexicali power plant discussed above. Capacity on the pipeline is fully subscribed. Total capitalexpenditures of $124 million have been made by SEI through December 31, 2002.
SEI’s Mexican subsidiaries Distribuidora de Gas Natural (DGN) de Mexicali, DGN de Chihuahua andDGN de La Laguna Durango built and operate natural gas distribution systems in Mexicali, Chihuahuaand the La Laguna-Durango zone in north-central Mexico, respectively. At December 31, 2002, SEIowned interests of 60, 95 and 100 percent in the projects, respectively. Through December 31, 2002,DGN de Mexicali, DGN de Chihuahua and DGN de La Laguna Durango have made capitalexpenditures of $23 million, $57 million and $32 million, respectively. Total capital expenditures forthese subsidiaries in 2002 were $15 million. On February 7, 2003, SEI completed its purchase of theremaining interests in DGN de Mexicali, DGN de Chihuahua, Transportadora de Gas Natural, asupplier of natural gas to the Presidente Juarez power plant in Rosarito, Baja California, and othersubsidiaries.
In October 2001, Sempra Energy announced plans to develop a major new LNG receiving terminal tobring natural gas supplies into northwestern Mexico and southern California. The plant, Energia CostaAzul, would be located on the Pacific Coast, north of Ensenada, Baja California, Mexico. SEI initiallypurchased a 300-acre site for the terminal for a purchase price of $19.7 million. Subsequently, itpurchased additional land for the terminal for $2.6 million. As currently planned, the plant would have asend-out capacity of approximately 1 billion cubic feet per day of natural gas through a new 40-milepipeline between the terminal and existing pipelines in the San Diego/Baja California border area. Theproject is currently estimated to cost $600 million and to commence commercial operations in 2007.
In 2000, SEI invested $159 million in two Argentine natural gas utility holding companies (SodigasPampeana S.A. and Sodigas Sur S.A.).
Other
In February 2003, Sempra LNG Corp., a newly created subsidiary of Global, announced an agreementto acquire the proposed Hackberry, La., LNG project from a subsidiary of Dynegy, Inc. Sempra LNGCorp. initially will pay Dynegy $20 million, with additional payments contingent on the performance ofthe project. The project has received preliminary approval from the Federal Energy RegulatoryCommission (FERC) and expects a final decision later this year. If the project is approved, SempraLNG Corp. would build an LNG receiving facility capable of processing up to 1.5 billion cubic feet perday of natural gas. The total cost of the project is expected to be about $700 million. The project couldbegin commercial operations as early as 2007.
Investments
Investments and acquisition costs were $442 million, $111 million and $243 million for 2002, 2001 and2000, respectively. The increase in 2002 was due to collateral requirements associated with thesynthetic lease financing for the construction of the Mesquite Power Plant and SET’s acquisition of newbusinesses. For discussion of the synthetic lease, see Note 15 of the notes to Consolidated FinancialStatements.
SEMPRA ENERGY 18.

Sempra Energy Trading
During 2002, SET completed acquisitions that added base metals trading and warehousing to itstrading business. On February 4, 2002, SET completed the acquisition of London-based SempraMetals Limited, a leading metals trader on the London Metals Exchange, for $65 million, net of cashacquired. On April 26, 2002, SET completed the acquisition of the assets of New York-based SempraMetals & Concentrates Corp., a leading global trader of copper, lead and zinc concentrates, for$24 million. Also in April 2002, SET completed the acquisition of the Liverpool, England-basedHenry Bath & Sons Limited, which provides warehousing services for non-ferrous metals in Europeand Asia, and the assets of the U.S. warehousing business of Henry Bath, Inc., for a total of$30 million, net of cash acquired. All of these entities were part of the former MG Metals Group, whichhad been recently acquired by Enron. In January 2003, SET purchased from CMS Energy’s marketingand trading unit a substantial portion of its wholesale natural gas trading book for $17 million.
Sempra Energy Resources
During 2002 and 2001, SER invested $39 million and $91 million, respectively, in the Elk Hills PowerProject (Elk Hills), a $395 million, 570-megawatt power plant near Bakersfield, California, which isanticipated to be completed in May 2003. SER anticipates its share of the remaining construction costswill be $35 million. Elk Hills, an unconsolidated subsidiary, is being developed in a 50/50 joint venturewith Occidental Energy Ventures Corporation (Occidental) and will supply electricity to California.Information concerning litigation with Occidental is provided in Note 15 of the notes to ConsolidatedFinancial Statements.
Other
In August 2000, SES purchased its partner’s 50-percent interests in Atlantic-Pacific Las Vegas andAtlantic-Pacific Glendale for a total of $40 million, thereby acquiring full ownership of these companies.
In September 2000, the company acquired for $8 million a significant minority interest in AtlanticElectric and Gas, a United Kingdom retail energy marketer.
See further discussion of investing activities, including the $223 million foreign currency exchangeadjustment relating to Argentina, in Note 3 of the notes to Consolidated Financial Statements.
Future Construction Expenditures and Investments
The company expects to make capital expenditures of $1.3 billion in 2003, including $300 million whichis not yet committed. Significant capital expenditures are expected to include $750 million for Californiautility plant improvements and $230 million for SER power plant construction and other capital projects.These expenditures are expected to be financed by operations and security issuances.
Over the next five years, the company expects to make capital expenditures of approximately $4 billionat the California Utilities and is committed to $350 million of capital expenditures at the othersubsidiaries, including completion of the three power plants being constructed by SER. In addition, thecompany is evaluating an additional $2 billion of capital expenditures, which is not yet committed.
Construction, investment and financing programs are periodically reviewed and revised by thecompany in response to changes in economic conditions, competition, customer growth, inflation,customer rates, the cost of capital, and environmental and regulatory requirements. In addition, theunprecedented number of existing power plants and other energy-related facilities that are in excess ofmarket demand in certain regions of the country or that are owned by companies in financial distressmay provide the company with opportunities to acquire existing power plants instead of or in addition tonew construction.
SEMPRA ENERGY 19.

The company’s level of construction expenditures and investments in the next few years may varysubstantially, and will depend on the availability of financing and business opportunities providingdesirable rates of return. The company’s intention is to finance any sizeable expenditures so as tomaintain the company’s strong investment-grade ratings and capital structure. Smaller expenditureswill be made by the use of existing liquidity.
CASH FLOWS FROM FINANCING ACTIVITIES
Net cash provided by financing activities totaled $138 million, $275 million and $192 million for 2002,2001 and 2000, respectively.
Cash flows from financing activities decreased in 2002 from 2001 due primarily to the higher temporarydrawdowns of lines of credit in 2001, partially offset by new debt issuances in 2002.
Net cash provided by financing activities in 2001 was more than that provided in 2000 due to a $160million loan obtained from an unconsolidated affiliate in 2001.
Long-Term and Short-Term Debt
In 2002, the company issued $1.2 billion in long-term debt, including $600 million of equity units atSempra Energy and $250 million of 4.80% first-mortgage bonds at SoCalGas. The 4.80% first-mortgage bonds mature on October 1, 2012. The bonds are not subject to a sinking fund and are notredeemable prior to maturity except through a make-whole mechanism. Proceeds from the bond salehave become part of the company’s general treasury funds to replenish amounts previously expendedto refund and retire indebtedness and will be used for working capital and other general corporatepurposes. Each equity unit consists of $25 principal amount of the company’s 5.60% senior notes dueMay 17, 2007 and a contract to purchase for $25 on May 17, 2005, between .8190 and .9992 of ashare of the company’s common stock (to be determined by the then-prevailing market prices). Thecompany used the net proceeds of the offering to repay a portion of its short-term debt, including debtused to finance the capital expenditure program for Global. In addition, SER drew down $300 millionagainst a line of credit to finance construction projects and acquisitions.
Repayment of long-term debt of $479 million included repayments at maturity of $100 million ofSoCalGas’ 6.875% first-mortgage bonds and $28 million of SDG&E’s 7.625% first-mortgage bonds,and the calling of $10 million of SDG&E’s 8.5% first-mortgage bonds. Additionally, the company repaid$200 million of the $300 million borrowed under a line of credit in 2002 and $66 million of rate-reduction bonds.
The net short-term debt reduction of $307 million in 2002 primarily consisted of the paydown ofcommercial paper.
On September 30, 2002, SoCalGas cancelled a fixed-to-variable interest-rate swap on $175 million offirst-mortgage bonds. The $6 million gain on the transaction is being amortized over the life of thebonds, which mature in 2025.
On September 10, 2002, Global replaced its expiring $1.2 billion revolving line of credit with a$950 million syndicated line. The new revolving line of credit is guaranteed by Sempra Energy and itsinterest rate varies with market rates and credit ratings. It expires in September 2003, at which timeoutstanding borrowings may be converted to a one-year term loan. The agreement requires SempraEnergy to maintain a debt-to-total capitalization ratio (as defined in the agreement) of not to exceed65 percent.
SEMPRA ENERGY 20.
In May 2002, SDG&E and SoCalGas replaced their individual revolving lines of credit with a combinedrevolving credit agreement under which each utility may individually borrow up to $300 million, subjectto a combined borrowing limit for both utilities of $500 million. Each utility’s revolving credit line expireson May 16, 2003, at which time it may convert its then outstanding borrowings to a one-year term loan,subject to having obtained any requisite regulatory approvals. Borrowings under the agreement, whichare available for general corporate purposes including back-up support for commercial paper andvariable-rate long-term debt, would bear interest at rates varying with market rates and the borrowingutility’s credit rating. The agreement requires each utility to maintain a debt-to-total capitalization ratio(as defined in the agreement) of not to exceed 60 percent. The rights, obligations and covenants ofeach utility under the agreement are individual rather than joint with those of the other utility, and adefault by one utility would not constitute a default by the other.
In 2001, the company issued $500 million in long-term debt, primarily for capital expenditures by theGlobal subsidiaries. The net short-term debt increase of $310 million in 2001 primarily representedborrowings through Global. Funds were used to finance construction costs of various power plant andpipeline projects in California, Arizona and Mexico. During 2001, $82 million of the Employee StockOwnership (ESOP) debt and $25 million of variable-rate unsecured bonds were remarketed at7.375 percent and 6.75 percent, respectively. In addition, SEI refinanced $160 million of its long-termnotes through an Offering Memorandum of Chilquinta Energia Finance Co. LLC, which, like thecompany’s other investments in Peru and Chile, is owned 50 percent by SEI and 50 percent by PSEGGlobal. Repayments on long-term debt in 2001 included $150 million of first-mortgage bonds,$66 million of rate-reduction bonds and $120 million of unsecured debt.
In 2000, the company issued $500 million of long-term notes and $200 million of mandatorilyredeemable trust preferred securities to finance the repurchase of 36.1 million shares of its outstandingcommon stock. The company issued an additional $300 million of long-term notes during 2000 to repaya portion of its short-term debt. The net increase in short-term debt primarily represents borrowingsthrough Global used to finance the construction of natural gas distribution systems by SEI andborrowings by SET to finance increased trading activities. Repayments on long-term debt in 2000included $10 million of first-mortgage bonds, $66 million of rate-reduction bonds and $51 million ofunsecured debt. In addition, in December 2000, $60 million of variable-rate industrial developmentbonds were put back by the holders and remarketed in February 2001 at a fixed interest rate of7 percent.
In February 2003, the company issued $400 million of senior unsecured notes with a 10-year term at afixed interest rate of 6 percent. The proceeds were used to replace short-term debt.
Capital Stock Transactions
In April and May of 2002, the company publicly offered and sold $600 million of “Equity Units.” Eachunit consists of $25 of the company’s 5.60% senior notes due May 17, 2007 and a contract topurchase for $25 on May 17, 2005, between .8190 and .9992 of a share of the company’s commonstock, with the precise number determined by the then-prevailing market price. The company used thenet proceeds of the offering primarily to repay a portion of its short-term debt, including the repaymentof $200 million borrowed by SER in April 2002 and other debt used to finance the capital expenditureprogram for Global.
As noted above, in February 2000, the company completed a self-tender offer, purchasing 36.1 millionshares of its outstanding common stock at $20 per share. In March 2000, the company’s board ofdirectors authorized the optional expenditure of up to $100 million to repurchase shares of commonstock from time to time in the open market or in privately negotiated transactions. Under thisauthorization, the company acquired 162,400 shares in July 2000, 60,000 shares in November 2001and 674,400 shares in July 2002.
SEMPRA ENERGY 21.

DividendsDividends paid on common stock amounted to $205 million in 2002, $203 million in 2001 and$244 million in 2000. The lower dividends in 2001 and 2002 were due to the company’s repurchase of36.1 million shares of its outstanding common stock in 2000.
The payment of future dividends and the amount thereof are within the discretion of the company’sboard of directors. The CPUC’s regulation of the California Utilities’ capital structure limits the amountsthat are available for loans and dividends to the company from the California Utilities. At December 31,2002, SDG&E and SoCalGas each could have provided $250 million to Sempra Energy (combinedloans and dividends). At December 31, 2002, SDG&E and SoCalGas had loans to Sempra Energy of$250 million and $86 million, respectively.
CapitalizationTotal capitalization, including the current portion of long-term debt and excluding the rate-reductionbonds (which are non-recourse to the company) at December 31, 2002 was $7.8 billion. The debt-to-capitalization ratio was 59 percent at December 31, 2002. Significant changes in capitalization during2002 included long-term borrowings and dividends.
Cash and Cash EquivalentsAt December 31, 2002, the company had $455 million of cash and $2.35 billion of committed lines ofcredit, $100 million of which was borrowed. As of December 31, 2002, $600 million of the lines wassupporting commercial paper and variable-rate debt. Management believes these amounts and cashflows from operations and new security issuances will be adequate to finance capital expenditures,shareholder dividends, any new business acquisitions or start-ups, and other commitments.
Other information concerning the credit lines and related matters is provided in Notes 4, 5 and 10 ofthe notes to Consolidated Financial Statements.
CommitmentsThe following is a summary of the company’s principal contractual commitments at December 31, 2002(dollars in millions). Trading liabilities are not included herein as such derivative transactions areprimarily hedged against trading assets. In addition, liabilities reflecting fixed price contracts and otherderivatives are excluded as they are primarily offset against regulatory assets at the California Utilities.Additional information concerning commitments is provided above and in Notes 4, 5, 11 and 15 of thenotes to Consolidated Financial Statements.
By Period
Description 2003
2004and
2005
2006and
2007 Thereafter Total
Short-term debt $ 570 $ — $ — $ — $ 570Long-term debt 281 1,145 783 2,159 4,368Mandatorily redeemable trust preferred
securities — — — 200 200Preferred stock of subsidiaries subject to
mandatory redemption — 3 3 19 25Operating leases 94 205 208 1,385 1,892Purchased power contracts 257 455 437 2,285 3,434Natural gas contracts 897 424 135 157 1,613Construction commitments 162 7 — 95 264Twin Oaks coal supply 28 54 46 310 438SONGS decommissioning 20 22 9 258 309Environmental commitments 16 31 11 — 58
Totals $2,325 $2,346 $1,632 $6,868 $13,171
SEMPRA ENERGY 22.

Credit Ratings
As of January 31, 2003, credit ratings for Sempra Energy and its primary subsidiaries were as follows:
S&P Moody’s Fitch
SEMPRA ENERGYUnsecured Debt A- Baa1 ACommercial Paper A-2 P-2 F1Trust Preferred Securities BBB Baa2 A-
SDG&ESecured Debt A+ A1 AAUnsecured Debt A A2 AA-Preferred Stock A- Baa1 A+Commercial Paper A-1 P-1 F1+
SOCALGASSecured Debt A+ A1 AAUnsecured Debt A A2 AA-Preferred Stock A- Baa1 A+Commercial Paper A-1 P-1 F1+
PACIFIC ENTERPRISESPreferred Stock BBB+ — A+
GLOBALUnsecured Debt guaranteed by Sempra Energy — Baa1 —Sempra Guaranteed Commercial Paper A-2 P-2 F1
As of January 31, 2003, the company has a stable outlook rating from all three credit rating agencies.
FACTORS INFLUENCING FUTURE PERFORMANCE
Base results of the company in the near future will depend primarily on the results of the CaliforniaUtilities, while earnings growth and fluctuations will result primarily from activities at SET, SER, SEIand other businesses. The factors influencing future performance are summarized below.
CALIFORNIA UTILITIES
Electric Industry Restructuring and Electric Rates
Supply/demand imbalances and a number of other factors resulted in abnormally high electric-commodity costs beginning in mid-2000 and continuing into 2001. This caused SDG&E’s customer billsto be substantially higher than normal. In response, legislation enacted in September 2000 imposed aceiling of 6.5 cents/kilowatt hour (kWh) on the cost of electricity that SDG&E could pass on to its small-usage customers on a current basis. SDG&E accumulated the amount that it paid for electricity inexcess of the ceiling rate in an interest-bearing balancing account. This undercollection amounted to$447 million, $392 million and $215 million at December 31, 2000, 2001 and 2002, respectively.
In February 2001, the DWR began to purchase power from generators and marketers to supply aportion of the state’s power requirements that is served by IOUs. From early 2001 to December 31,2002, the DWR purchased SDG&E’s full net short position (the power needed by SDG&E’s customers,other than that provided by SDG&E’s nuclear generating facilities or its previously existing purchasepower contracts). In October 2002, the CPUC issued a decision directing the resumption of the electriccommodity procurement function by IOUs by January 1, 2003.
SEMPRA ENERGY 23.

An unresolved issue is the ownership of certain power sale profits stemming from intermediate termpurchase power contracts entered into by SDG&E during the early stages of California’s electric utilityindustry restructuring. On December 19, 2002, the CPUC rendered a 3-to-2 decision approving theJune 2002 proposed settlement previously described in the company’s Quarterly Report on Form 10-Qfor the quarter ended September 30, 2002, that divides the profits from these contracts, $199 millionfor SDG&E customers and $173 million for SDG&E shareholders. Of the $199 million in profitsallocated to customers, $175 million had already been credited to ratepayers in 2001. The remaining$24 million was applied as a balancing account transfer that reduced the AB 265 balancing account inDecember 2002. The profits allocated to customers reduce SDG&E’s AB 265 undercollection, but donot adversely affect SDG&E’s financial position, liquidity or results of operations. The term of acommissioner who voted to approve the settlement has expired, and a new commissioner has beenappointed. On January 29, 2003, the CPUC’s Office of Ratepayer Advocates, the City of San Diegoand the Utility Consumers’ Action Network, a consumer-advocacy group, filed requests for a CPUCrehearing of the decision. On February 13, 2003, the company filed its opposition to rehearing of thedecision. Parties requesting a rehearing and parties to any rehearing may also appeal the CPUC’s finaldecision to the California appellate courts.
Operating costs of SONGS Units 2 and 3 (including nuclear fuel and related financing costs) andincremental capital expenditures are recovered through the ICIP mechanism which allows SDG&E toreceive approximately 4.4 cents per kilowatt-hour for SONGS generation. Any differences between theactual amounts of these costs and the incentive price affect net income. For the year ended December31, 2002, ICIP contributed $50 million to SDG&E’s net income. The CPUC has rejected anadministrative law judge’s proposed decision to end ICIP prior to its December 31, 2003 scheduledexpiration date. However, the CPUC has also denied the previously approved market-based pricing forSONGS beginning in 2004 and instead provided for traditional rate-making treatment under which theSONGS ratebase would begin at zero, essentially eliminating earnings from SONGS until ratebasegrows. The company has applied for rehearing of this decision.
See additional discussion of this and related topics in Note 13 of the notes to Consolidated FinancialStatements.
Natural Gas Restructuring and Gas Rates
On December 11, 2001, the CPUC issued a decision adopting the following provisions affecting thestructure of the natural gas industry in California, some of which could introduce additional volatility intothe earnings of the California Utilities and other market participants: a system for shippers to hold firm,tradable rights to capacity on SoCalGas’ major gas transmission lines, with SoCalGas’ shareholders atrisk for whether market demand for these rights will cover the cost of these facilities; a furtherunbundling of SoCalGas’ storage services, giving SoCalGas greater upward pricing flexibility (exceptfor storage service for core customers) but with increased shareholder risk for whether market demandwill cover storage costs; new balancing services, including separate core and noncore balancingprovisions; a reallocation among customer classes of the cost of interstate pipeline capacity held bySoCalGas and an unbundling of interstate capacity for natural gas marketers serving core customers;and the elimination of noncore customers’ option to obtain natural gas procurement service from theCalifornia Utilities. During 2002 the California Utilities filed a proposed implementation schedule andrevised tariffs and rules required for implementation. However, protests of these compliance filingswere filed and the CPUC has not yet authorized implementation of most of the provisions of itsdecision. On December 30, 2002, the CPUC deferred acting on a plan to implement its decision.
Allowed Rates of Return
Effective January 1, 2003, SoCalGas’ authorized rate of return on ratebase (ROR) is 8.68 percent andits rate of return on common equity (ROE) is 10.82 percent. These rates will be effective until the next
SEMPRA ENERGY 24.

periodic review by the CPUC unless market interest-rate changes are large enough to trigger anautomatic adjustment prior thereto, which last occurred in October 2002 and adjusted rates downwardfrom the previous 9.49 percent (ROR) and 11.6 percent (ROE) to the current levels. This changeresults in a revenue requirement decrease of $10.5 million.
Effective January 1, 2003, SDG&E’s authorized rate of return on equity is 10.9 percent (increased from10.6 percent) for SDG&E’s electric distribution and natural gas businesses. This change results in arevenue requirement increase of $2.4 million ($1.9 million electric and $0.5 million natural gas) andincreases SDG&E’s overall rate of return from 8.75 percent to 8.77 percent. These rates remain ineffect through 2003.
Either utility can earn more than the authorized rate by controlling costs below approved levels or byachieving favorable results in certain areas such as various incentive mechanisms. In addition,earnings are affected by customer growth.
Cost of Service (COS) and Performance-Based Regulation
The COS and PBR cases for the California Utilities were filed on December 20, 2002. The filingsoutline projected expenses (excluding the commodity cost of electricity or natural gas consumed bycustomers or expenses for programs such as low-income assistance) and revenue requirements for2004 and a formula for 2005 through 2008. SoCalGas’ cost of service study proposes an increase innatural gas base rate revenues of $130 million. SDG&E’s cost of service study proposes increases inelectric and natural gas base rate revenues of $58.9 million and $21.6 million, respectively. The filingsalso requested a continuance and expansion of PBR in terms of earnings sharing and performanceservice standards that include both reward and penalty provisions related to customer satisfaction,employee safety and system reliability. The resulting new base rates are expected to be effective onJanuary 1, 2004. A CPUC decision is expected in late 2003. The California Utilities’ profitability isdependent upon their ability to control costs within base rates. The California Utilities’PBR mechanisms are in effect through December 31, 2003, at which time the mechanisms will beupdated. That update will include, among other things, a reexamination of the California Utilities’reasonable costs of operation to be allowed in rates.
An October 10, 2001 decision denied the California Utilities’ request to continue equal sharing betweenratepayers and shareholders of the estimated savings for the merger discussed in Note 1 and, instead,ordered that all of the estimated 2003 merger savings go to ratepayers. This decision will adverselyaffect the California Utilities’ 2003 net income by $35 million.
Utility Integration
On September 20, 2001, the CPUC approved Sempra Energy’s request to integrate the managementteams of the California Utilities. The decision retains the separate identities of each utility and is not amerger. Instead, utility integration is a reorganization that consolidates senior management functions ofthe two utilities and returns to the utilities the majority of shared support services previously providedby Sempra Energy’s centralized corporate center. Once implementation is completed, the integration isexpected to result in more efficient and effective operations. In a related development, an August 2002CPUC interim decision denied a request by the California Utilities to combine their natural gasprocurement activities at this time, pending completion of the CPUC’s ongoing investigation of marketpower issues.
SEMPRA ENERGY GLOBAL ENTERPRISES
Electric-Generation Assets
As discussed in “Cash Flows Used In Investing Activities” above, the company is involved in thedevelopment of several electric-generation projects that will significantly impact the company’s futureperformance. The power plants that SER is building in Arizona, California and Mexico are on scheduleto commence operations by January 2004. SER has approximately 2,700 megawatts of new
SEMPRA ENERGY 25.

generation in operation or under construction. The 570-megawatt Elk Hills power project, 50 percentowned by SER and located near Bakersfield, California, is expected to begin commercial operations inMay 2003. The 1,250-megawatt Mesquite Power Plant near Phoenix, Arizona, is expected tocommence commercial operations at 50-percent capacity in June 2003 and at full capacity in January2004. Termoelectrica de Mexicali, a 600-megawatt power plant near Mexicali, Baja California, Mexico,is expected to commence commercial operations in the summer of 2003. The 305-megawatt TwinOaks Power Plant located near Bremond, Texas, was acquired in October 2002. Electricity from theplants will be available for markets in California, Arizona, Texas and Mexico. SER’s projected portfolioof plants in the western United States and Baja California may be used to supply power to Californiaunder SER’s agreement with the DWR. See further discussion concerning SER’s contract with theDWR in Note 15 of the notes to Consolidated Financial Statements.
See additional discussion of these projects in “Investments,” below and in Notes 2, 3 and 15 of thenotes to Consolidated Financial Statements.
Investments
As discussed in “Cash Flows Used In Investing Activities” above, during 2002, SET completedacquisitions that added base metals trading and warehousing to its trading business. Theseacquisitions are Sempra Metals Limited, Sempra Metals & Concentrates Corp., Henry Bath & SonsLimited and Henry Bath, Inc., and are further described in “Cash Flows From Investing Activities.” Inaddition, on October 31, 2002, SER completed its previously announced acquisition of a305-megawatt, coal-fired power plant (renamed Twin Oaks Power) from Texas-New Mexico PowerCompany for $120 million. SER has a five-year contract to sell substantially all of the output of theplant. In connection with the acquisition, SER also assumed a contract which includes annualcommitments to purchase lignite coal either until an aggregate minimum volume has been achieved orthrough 2025. These acquisitions contributed to Sempra Energy’s earnings in 2002.
Also during 2002, SEI purchased over 300 acres of land north of Ensenada, Baja California, for $22.3million. The land is the planned site of Energia Costa Azul, the LNG receiving terminal SEI isdeveloping to bring natural gas supplies into northwestern Mexico and southern California. As currentlyplanned, the plant would have a send-out capacity of 1 billion cubic feet per day of natural gas througha new 40-mile pipeline between the terminal and existing pipelines in the San Diego/Baja Californiaborder area. The plant is expected to cost $600 million and to commence commercial operations in2007.
In February, 2003, Sempra LNG Corp., a newly created subsidiary of Global, announced an agreementto acquire the proposed Hackberry, La., LNG project from a subsidiary of Dynegy, Inc. Sempra LNGCorp. initially will pay Dynegy $20 million, with additional payments contingent on the performance ofthe project. The project has received preliminary approval from the FERC and expects a final decisionlater this year. If the project is approved, Sempra LNG Corp. would build an LNG receiving facilitycapable of processing up to 1.5 billion cubic feet per day of natural gas. The total cost of the project isexpected to be about $700 million. The project could begin commercial operations as early as 2007.
See additional discussion of these investments and projects in “Capital Expenditures for Property,Plant and Equipment” above and in Notes 2, 3 and 15 of the notes to Consolidated FinancialStatements.
The devaluation of the Argentine peso, which is noted above and further described in Note 3 of thenotes to Consolidated Financial Statements, is expected to have an adverse effect on future earningsof the Argentine operations, but the extent of the effect is not yet determinable.
SEMPRA ENERGY 26.

MARKET RISK
Market risk is the risk of erosion of the company’s cash flows, net income, asset values and equity dueto adverse changes in prices for various commodities, and in interest and foreign-currency rates.
The company’s policy is to use derivative physical and financial instruments to reduce its exposure tofluctuations in interest rates, foreign-currency exchange rates and commodity prices. The companyalso uses and trades derivative physical and financial instruments in its energy trading and marketingactivities. Transactions involving these financial instruments are with major exchanges and other firmsbelieved to be credit worthy. The use of these instruments exposes the company to market and creditrisks which, at times, may be concentrated with certain counterparties. At December 31, 2002, SETwas due approximately $100 million from the ISO, for which the company believes adequate reserveshave been recorded. Except for the ISO receivable there were no unusual concentrations at December31, 2002, that would indicate an unacceptable level of risk. Credit risks associated with concentrationare discussed below under “Credit Risk.”
The company has adopted corporate-wide policies governing its market-risk management and tradingactivities. Assisted by the company’s Energy Risk Management Group (ERMG), the company’s EnergyRisk Management Oversight Committee, consisting of senior officers, oversees company-wide energyrisk management activities and monitors the results of trading activities to ensure compliance with thecompany’s stated energy-risk management and trading policies. Utility management receives dailyinformation on positions and the ERMG receives information detailing positions creating market andcredit risk from all company affiliates (on a delayed basis as to the California Utilities). The ERMGindependently measures and reports the market and credit risk associated with these positions. Inaddition, all affiliates have groups that monitor energy-price risk management and trading activitiesindependently from the groups responsible for creating or actively managing these risks.
Along with other tools, the company uses Value at Risk (VaR) to measure its exposure to market risk.VaR is an estimate of the potential loss on a position or portfolio of positions over a specified holdingperiod, based on normal market conditions and within a given statistical confidence interval. Thecompany has adopted the variance/covariance methodology in its calculation of VaR, and uses boththe 95-percent and 99-percent confidence intervals. VaR is calculated independently by the ERMG forall company affiliates. Historical volatilities and correlations between instruments and positions areused in the calculation.
SET derives a substantial portion of its revenue from trading activities in natural gas, electricity,petroleum, petroleum products, metals and other commodities. Profits are earned as SET acts as adealer in structuring and executing transactions that assist its customers in managing their energy-price risk. In addition, SET may take positions in commodity markets based on the expectation offuture market conditions. These positions include options, forwards, futures and swaps.
Following is a summary of SET’s trading VaR profile (using a one-day holding period) in millions ofdollars:
95% 99%
December 31, 2002 $4.6 $6.52002 average 6.2 8.7December 31, 2001 6.9 9.72001 average 6.1 8.6
SES derives a substantial portion of its revenue from delivering electric and natural gas supplies to itscommercial and industrial customers. Such contracts are hedged to preserve margin and carry minimalmarket risk. Exchange-traded and over-the-counter instruments are used to hedge contracts.
SEMPRA ENERGY 27.

The California Utilities use energy derivatives to manage natural gas price risk associated withservicing their load requirements. In addition, they make limited use of natural gas derivatives fortrading purposes. These instruments can include forward contracts, futures, swaps, options and othercontracts. In the case of both price-risk management and trading activities, the use of derivativefinancial instruments by the California Utilities is subject to certain limitations imposed by companypolicy and regulatory requirements. See the continuing discussion below and Note 10 of the notes toConsolidated Financial Statements for further information regarding the use of energy derivatives bythe California Utilities.
Additional information is provided in Note 10 of the notes to Consolidated Financial Statements.
The following discussion of the company’s primary market-risk exposures as of December 31, 2002includes a discussion of how these exposures are managed.
Commodity-Price Risk
Market risk related to physical commodities is created by volatility in the prices and basis of certaincommodities. The company’s market risk is impacted by changes in volatility and liquidity in themarkets in which these commodities or related financial instruments are traded. The company’svarious affiliates are exposed, in varying degrees, to price risk primarily in the petroleum, metals,natural gas and electricity markets. The company’s policy is to manage this risk within a framework thatconsiders the unique markets, and operating and regulatory environments of each affiliate.
Sempra Energy Trading
SET derives a substantial portion of its revenue from its worldwide trading activities in natural gas,petroleum, metals, electricity, and other commodities. As a result, SET is exposed to price volatility inthe related domestic and international markets. SET conducts these activities within a structured anddisciplined risk management and control framework that is based on clearly communicated policiesand procedures, position limits, active and ongoing management monitoring and oversight, clearlydefined roles and responsibilities, and daily risk measurement and reporting.
Sempra Energy Solutions
SES derives a portion of its revenue from delivering electric and gas supplies to its customers. Suchcontracts are designed to preserve margin and carry minimal market risk. Exchange-traded and over-the-counter instruments are used to hedge contracts. The derivatives and financial instruments used tohedge the transactions include swaps, forwards, futures, options or combinations thereof.
California Utilities
With respect to the California Utilities, market risk exposure is limited due to CPUC authorized raterecovery of commodity purchase, sale and storage activity. However, the California Utilities may, attimes, be exposed to market risk as a result of activities under SDG&E’s natural gas PBR and electricprocurement or SoCalGas’ GCIM, which are discussed in Notes 13 and 14 of the notes toConsolidated Financial Statements. They manage their risk within the parameters of the company’smarket-risk management and trading framework. As of December 31, 2002, the total VaR of theCalifornia Utilities’ natural gas and electric positions was not material.
SEMPRA ENERGY 28.

Interest-Rate Risk
The company is exposed to fluctuations in interest rates primarily as a result of its long-term debt. Thecompany historically has funded utility operations through long-term debt issues with fixed interestrates and these interest rates are recovered in utility rates. With the restructuring of the regulatoryprocess, the CPUC has permitted greater flexibility in the use of debt. As a result, some recent debtofferings have been selected with short-term maturities to take advantage of yield curves, or have useda combination of fixed-rate and floating-rate debt. Subject to regulatory constraints, interest-rate swapsmay be used to adjust interest-rate exposures when appropriate, based upon market conditions.
At December 31, 2002, the California Utilities had $1.9 billion of fixed-rate debt and $0.1 billion ofvariable-rate debt. Interest on fixed-rate utility debt is fully recovered in rates on a historical cost basisand interest on variable-rate debt is provided for in rates on a forecasted basis. At December 31, 2002,utility fixed-rate debt had a one-year VaR of $394 million and utility variable-rate debt had a one-yearVaR of $0.1 million. Non-utility debt (fixed-rate and variable-rate) was $2.3 billion at December 31,2002, with a one-year VaR of $199 million.
At December 31, 2002, the notional amount of interest-rate swap transactions totaled $500 million. SeeNotes 5 and 10 of the notes to Consolidated Financial Statements for further information regardingthese swap transactions.
In addition the company is ultimately subject to the effect of interest rate fluctuation on the assets of itspension plan.
Credit Risk
Credit risk is the risk of loss that would be incurred as a result of nonperformance by counterparties oftheir contractual obligations. As with market risk, the company has adopted corporate-wide policiesgoverning the management of credit risk. Credit risk management is under the oversight of the EnergyRisk Management Oversight Committee, assisted by the ERMG and the California Utility’s creditdepartment. Using rigorous models, the ERMG continuously calculates current and potential credit riskto counterparties to ensure the risk stays within approved limits. The company avoids concentration ofcounterparties and management believes its credit policies with regard to counterparties significantlyreduce overall credit risk. These policies include an evaluation of prospective counterparties’ financialcondition (including credit ratings), collateral requirements under certain circumstances, and the use ofstandardized agreements that allow for the netting of positive and negative exposures associated witha single counterparty. At December 31, 2002, SET was due approximately $100 million from the ISO,for which the company believes adequate reserves have been recorded. Except for this matter, neitherthe company nor its subsidiaries are party to any material concentration of credit risk.
The company monitors credit risk through a credit-approval process and the assignment andmonitoring of credit limits. These credit limits are established based on risk and return considerationsunder terms customarily available in the industry.
The company periodically enters into interest-rate swap agreements to moderate exposure to interest-rate changes and to lower the overall cost of borrowing. The company would be exposed to interest-rate fluctuations on the underlying debt should other parties to the agreement not perform. See the“Interest-Rate Risk” section above for additional information regarding the company’s use of interest-rate swap agreements.
SEMPRA ENERGY 29.

Foreign-Currency-Rate Risk
The company is subject to foreign-currency-rate risk in its international operations. The company hasinvestments in entities whose functional currency is not the U.S. dollar, which exposes the company toforeign exchange movements, primarily in Latin American currencies. As a result of the devaluation ofthe Argentine peso, as of December 31, 2002, SEI has adjusted its investment in its twounconsolidated Argentine subsidiaries downward by $223 million, which is included in “othercomprehensive income (loss)” on the Consolidated Balance Sheets. As the Argentine peso has beensignificantly devalued and will float freely in the foreign exchange market, the company recognizes thatboth income and cash flows associated with the investments are likely to be reduced; however, thecompany believes that they will remain sufficiently positive to support the carrying values of theinvestments. The company does not anticipate adverse developments that would change this view. OnSeptember 5, 2002, SEI filed for international arbitration under the 1994 Bilateral Investment Treatybetween the United States and Argentina for recovery of the diminution of the value of its investmentsresulting from government actions. See further discussion in Note 3 of the notes to ConsolidatedFinancial Statements.
In appropriate instances, the company may attempt to limit its exposure to changing foreign-exchangerates through both operational and financial market actions. Financial actions may include entering intoforward, option and swap contracts to hedge existing exposures, firm commitments and anticipatedtransactions. As of December 31, 2002, the company had no significant arrangements of this type.
CRITICAL ACCOUNTING POLICIES
Certain accounting policies are viewed by management as critical because their application is the mostrelevant, judgmental and/or material to the company’s financial position and results of operations, and/or because they require the use of material judgments and estimates.
The company’s most significant accounting policies are described in Note 1 of the notes toConsolidated Financial Statements. The most critical policies, all of which are mandatory undergenerally accepted accounting principles and the regulations of the Securities and ExchangeCommission, are the following:
Statement of Financial Accounting Standards (SFAS) 71 “Accounting for the Effects of CertainTypes of Regulation,” has a significant effect on the way the California Utilities record assetsand liabilities, and the related revenues and expenses, that would not otherwise be recorded,absent the principles contained in SFAS 71.
SFAS 133 “Accounting for Derivative Instruments and Hedging Activities” and SFAS 138“Accounting for Certain Derivative Instruments and Certain Hedging Activities,” have asignificant effect on the balance sheets of the California Utilities but have no significant effecton their income statements because of the principles contained in SFAS 71.
Issue 02-3 of the Emerging Issues Task Force (EITF) of the Financial Accounting StandardsBoard (FASB) “Issues Involved in Accounting for Derivative Contracts Held for TradingPurposes and Contracts Involved in Energy Trading and Risk Management Activities” has asignificant effect on the financial statements of SET and SES, both of which had beenrecording transactions in accordance with EITF Issue 98-10, which is being eliminated byEITF Issue 02-3. However, most of the trading assets and liabilities of SET and SES will nowbe covered by SFAS 133 and SFAS 138, which have a similar effect.
SEMPRA ENERGY 30.

In connection with the application of these and other accounting policies, the company makesestimates and judgments about various matters. The most significant of these involve:
The calculation of fair or realized values (including the likelihood of fully realizing the value ofthe investments in Argentina under the Bilateral Investment Treaty).
The collectibility of regulatory and other assets.
The costs to be incurred in fulfilling certain contracts that have been marked to market.
The likelihood of recovery of various deferred tax assets.
Differences between estimates and actual amounts have had significant impacts in the past and arelikely to do so in the future.
As discussed elsewhere herein, the company uses exchange quotations or other third-party pricing toestimate fair values whenever possible. When no such data is available, it uses internally developedmodels and other techniques. The assumed collectibility of regulatory assets considers legal andregulatory decisions involving the specific items or similar items. The assumed collectibility of otherassets considers the nature of the item, the enforceability of contracts where applicable, thecreditworthiness of the other parties and other factors. Costs to fulfill marked-to-market contracts arebased on prior experience. The likelihood of deferred tax recovery is based on analyses of the deferredtax assets and the company’s expectation of future financial and/or taxable income, based on itsstrategic planning.
Choices among alternative accounting policies that are material to the company’s financial statementsand information concerning significant estimates have been discussed with the audit committee of theboard of directors.
NEW ACCOUNTING STANDARDS
New pronouncements by the FASB that have recently become effective or are yet to be effective areSFAS 142 through SFAS 149 and Interpretations 45 and 46. They are described in Note 1 of the notesto Consolidated Financial Statements. SFAS 142 affects net income by replacing the amortization ofgoodwill with periodic reviews thereof for impairment with charges against income when impairment isfound. SFAS 143 requires accounting and disclosure changes concerning legal obligations related tofuture asset retirements. SFAS 144 supercedes SFAS 121 in dealing with other asset impairmentissues. SFAS 145 makes technical corrections to previous statements. SFAS 146 deals with exit anddisposal activities, replacing EITF Issue 94-3. SFAS 147 deals with acquisitions of financial institutions.SFAS 148 amends SFAS 123 and adds two additional transition methods to the fair value method ofaccounting for stock-based compensation. SFAS 149 establishes standards for accounting for financialinstruments with characteristics of liabilities and equity. Interpretation 45 clarifies that a guarantor isrequired to recognize a liability for the fair value of the obligation undertaken in issuing a guarantee.Interpretation 46 addresses consolidation by business enterprises of variable-interest entities(previously referred to as “special-purpose entities” in most cases). Pronouncements that have orpotentially could have a material effect on future earnings are described below.
SFAS 143, “Accounting for Asset Retirement Obligations”: SFAS 143, issued in July 2001, addressesfinancial accounting and reporting for legal obligations associated with the retirement of tangible long-lived assets. It requires entities to record the fair value of a liability for an asset retirement obligation inthe period in which it is incurred. SFAS 143 is effective for the company beginning in 2003. See furtherdiscussion in Note 1 of the notes to Consolidated Financial Statements.
SEMPRA ENERGY 31.

SFAS 149, “Accounting for Certain Financial Instruments with Characteristics of Liabilities and Equity”:On January 22, 2003, the FASB directed its staff to prepare a draft of SFAS 149. The final draft isexpected to be issued in March 2003. The statement will establish standards for accounting forfinancial instruments with characteristics of liabilities, equity, or both. The FASB decided that SFAS149 will prohibit the presentation of certain items in the mezzanine section (the portion of a balancesheet between liabilities and equity) of the statement of financial position. As such, certain mandatorilyredeemable preferred stock, which is currently included in the mezzanine section, may be classified asa liability once SFAS 149 goes into effect. The proposed effective date of SFAS 149 is July 1, 2003 forthe company.
EITF Issue 02-3, “Issues Involved in Accounting for Derivative Contracts Held for Trading Purposesand Contracts Involved in Energy Trading and Risk Management Activities”: In June 2002, EITF Issue02-3, codified and reconciled existing guidance on the recognition and reporting of gains and losses onenergy trading contracts and addressed other aspects of the accounting for contracts involved inenergy trading and risk management activities. Among other things, the consensus requires that SESchange its method of recording trading activities from gross to net.
In October 2002, the EITF reached a consensus to rescind Issue 98-10 “Accounting for ContractsInvolved in Energy Trading and Risk Management Activities,” the basis for mark-to-market accountingused for recording energy-trading activities by SET and SES. The consensus requires that all newenergy-related contracts entered into subsequent to October 25, 2002, including inventory, should beaccounted for under accrual accounting and will not qualify for mark-to-market accounting unless thecontracts meet the requirements stated under SFAS 133 “Accounting for Derivative Instruments andHedging Activities” and all contracts entered into on or before October 25, 2002 are similarly affectedbeginning January 1, 2003. See Note 10 of the notes to Consolidated Financial Statements foradditional information concerning SFAS 133 derivatives.
INFORMATION REGARDING FORWARD-LOOKING STATEMENTS
This Annual Report contains statements that are not historical fact and constitute forward-lookingstatements within the meaning of the Private Securities Litigation Reform Act of 1995. The words“estimates,” “believes,” “expects,” “anticipates,” “plans,” “intends,” “may,” “would” and “should” orsimilar expressions, or discussions of strategy or of plans are intended to identify forward-lookingstatements. Forward-looking statements are not guarantees of performance. They involve risks,uncertainties and assumptions. Future results may differ materially from those expressed in theseforward-looking statements.
Forward-looking statements are necessarily based upon various assumptions involving judgments withrespect to the future and other risks, including, among others, local, regional, national and internationaleconomic, competitive, political, legislative and regulatory conditions and developments; actions by theCPUC, the California Legislature, the DWR and the FERC; capital market conditions, inflation rates,interest rates and exchange rates; energy and trading markets, including the timing and extent ofchanges in commodity prices; weather conditions and conservation efforts; war and terrorist attacks;business, regulatory and legal decisions; the pace of deregulation of retail natural gas and electricitydelivery; the timing and success of business development efforts; and other uncertainties, all of whichare difficult to predict and many of which are beyond the control of the company. Readers arecautioned not to rely unduly on any forward-looking statements and are urged to review and considercarefully the risks, uncertainties and other factors which affect the company’s business described inthis report and other reports filed by the company from time to time with the Securities and ExchangeCommission.
SEMPRA ENERGY 32.

FIVE YEAR SUMMARY
At December 31 or for the years ended December 31(Dollars in millions except per share amounts)
2002 2001 2000 1999 1998
OPERATING REVENUESCalifornia utilities:
Gas $ 3,255 $ 4,371 $ 3,305 $ 2,911 $ 2,752Electric 1,262 1,676 2,184 1,818 1,865
Other 1,503 1,683 1,271 631 364
Total $ 6,020 $ 7,730 $ 6,760 $ 5,360 $ 4,981
Operating income $ 987 $ 997 $ 884 $ 763 $ 626Income before extraordinary item $ 575 $ 518 $ 429 $ 394 $ 294Net income $ 591 $ 518 $ 429 $ 394 $ 294Income before extraordinary item per
common share:Basic $ 2.80 $ 2.54 $ 2.06 $ 1.66 $ 1.24Diluted $ 2.79 $ 2.52 $ 2.06 $ 1.66 $ 1.24
Net income per common share:Basic $ 2.88 $ 2.54 $ 2.06 $ 1.66 $ 1.24Diluted $ 2.87 $ 2.52 $ 2.06 $ 1.66 $ 1.24
Dividends declared per commonshare $ 1.00 $ 1.00 $ 1.00 $ 1.56 $ 1.56
Pretax income/revenue 12.0% 9.5% 10.3% 10.7% 8.7%Return on common equity 21.4% 19.5% 15.7% 13.4% 10.0%Effective income tax rate 20.2% 29.1% 38.6% 31.2% 31.9%Dividend payout ratio:
Basic (a) 35.7% 39.4% 48.5% 94.0% 125.8%Diluted (a) 35.8% 39.7% 48.5% 94.0% 125.8%
Price range of common shares $ 26.25- $ 28.61- $ 24.88- $ 26.00- $ 29.31-15.50 17.31 16.19 17.13 23.75
AT DECEMBER 31Current assets $ 7,010 $ 4,790 $ 6,525 $ 3,090 $ 2,482Total assets $17,757 $15,080 $15,540 $11,124 $ 10,456Current liabilities $ 7,247 $ 5,472 $ 7,490 $ 3,236 $ 2,466Long-term debt (excludes current
portion) $ 4,083 $ 3,436 $ 3,268 $ 2,902 $ 2,795Shareholders' equity $ 2,825 $ 2,692 $ 2,494 $ 2,986 $ 2,913Common shares outstanding (in
millions) 204.9 204.5 201.9 237.4 237.0Book value per common share $ 13.79 $ 13.16 $ 12.35 $ 12.58 $ 12.29Price/earnings ratio (a) 8.4 9.7 11.3 10.5 20.5Number of meters (in thousands):
Natural gas 6,127 6,053 5,981 5,915 5,837Electricity 1,278 1,258 1,238 1,218 1,192
(a) Based on income before extraordinary item.
SEMPRA ENERGY 33.

Statement of Management’s Responsibilityfor Consolidated Financial Statements
The consolidated financial statements have been prepared by management in accordance withgenerally accepted accounting principles. The integrity and objectivity of these financial statements andthe other financial information in the Financial Report, including the estimates and judgments on whichthey are based, are the responsibility of management. The financial statements have been audited byDeloitte & Touche LLP, independent auditors appointed by the board of directors. Their report is shownon the next page. Management has made available to Deloitte & Touche LLP all of the company’sfinancial records and related data, as well as the minutes of shareholders’ and directors’ meetings.
Management maintains a system of internal control which it believes is adequate to providereasonable, but not absolute, assurance that assets are properly safeguarded, that transactions areexecuted in accordance with management’s authorization and are properly recorded, and that theaccounting records may be relied on for the preparation of the consolidated financial statements, andfor the prevention and detection of fraudulent financial reporting. The concept of reasonable assurancerecognizes that the cost of a system of internal control should not exceed the benefits derived and thatmanagement makes estimates and judgments of these cost/benefit factors.
Management monitors the system of internal control for compliance through its own review and aninternal auditing program, which independently assesses the effectiveness of the internal controls. Thecompany’s independent auditors also consider certain elements of internal controls in order todetermine their audit procedures for the purpose of expressing an opinion on the company’s financialstatements. Management considers the recommendations of the internal auditors and independentauditors concerning the company’s system of internal controls and takes appropriate actions.Management believes that the company’s system of internal control is adequate to provide reasonableassurance that the accompanying financial statements present fairly the company’s financial positionand results of operations.
Management also recognizes its responsibility for fostering a strong ethical climate so that thecompany’s affairs are conducted according to the highest standards of personal and corporateconduct. This responsibility is characterized and reflected in the company’s code of corporate conduct,which is publicized throughout the company. The company maintains a systematic program to assesscompliance with this policy.
The board of directors has an audit committee, composed of independent directors, to assist in fulfillingits oversight responsibilities for management’s conduct of the company’s financial reporting processes.The audit committee meets regularly to discuss financial reporting, internal controls and auditingmatters with management, the company’s internal auditors and the independent auditors, andrecommends to the board of directors any appropriate response to those discussions. The auditcommittee recommends for approval by the full board the appointment of the independent auditors.The independent auditors and the internal auditors periodically meet alone with the audit committeeand have free access to the audit committee at any time.
Neal E. Schmale Frank H. AultExecutive Vice President andChief Financial Officer
Senior Vice President and Controller
SEMPRA ENERGY 34.

INDEPENDENT AUDITORS’ REPORT
To the Board of Directors and Shareholders of Sempra Energy:
We have audited the accompanying consolidated balance sheets of Sempra Energy and subsidiaries(the “Company”) as of December 31, 2002 and 2001, and the related statements of consolidatedincome, cash flows and changes in shareholders’ equity for each of the three years in the period endedDecember 31, 2002. These financial statements are the responsibility of the Company’s management.Our responsibility is to express an opinion on these financial statements based on our audits.
We conducted our audits in accordance with auditing standards generally accepted in the UnitedStates of America. Those standards require that we plan and perform the audit to obtain reasonableassurance about whether the financial statements are free of material misstatement. An audit includesexamining, on a test basis, evidence supporting the amounts and disclosures in the financialstatements. An audit also includes assessing the accounting principles used and significant estimatesmade by management, as well as evaluating the overall financial statement presentation. We believethat our audits provide a reasonable basis for our opinion.
In our opinion, such consolidated financial statements present fairly, in all material respects, thefinancial position of Sempra Energy and subsidiaries as of December 31, 2002 and 2001, and theresults of their operations and their cash flows for each of the three years in the period endedDecember 31, 2002, in conformity with accounting principles generally accepted in the United States ofAmerica.
San Diego, CaliforniaFebruary 14, 2003
SEMPRA ENERGY 35.

[This Page Intentionally Left Blank]
SEMPRA ENERGY 36.

SEMPRA ENERGYSTATEMENTS OF CONSOLIDATED INCOME
Years ended December 31,(Dollars in millions, except per share amounts) 2002 2001 2000
OPERATING REVENUESCalifornia utilities:
Natural gas $ 3,255 $ 4,371 $ 3,305Electric 1,262 1,676 2,184
Other 1,503 1,683 1,271
Total 6,020 7,730 6,760
OPERATING EXPENSESCalifornia utilities:
Cost of natural gas distributed 1,381 2,549 1,599Electric fuel and net purchased power 297 782 1,326
Other cost of sales 709 873 648Other operating expenses 1,873 1,760 1,560Depreciation and amortization 596 579 563Franchise fees and other taxes 177 190 180
Total 5,033 6,733 5,876
Operating income 987 997 884Other income — net 57 86 127Preferred dividends of subsidiaries (11) (11) (11)Trust preferred distributions by subsidiary (18) (18) (15)Interest expense (294) (323) (286)
Income before income taxes 721 731 699Income taxes 146 213 270
Income before extraordinary item 575 518 429Extraordinary item, net of tax (Note 1) 16 — —
Net income $ 591 $ 518 $ 429
Weighted-average number of shares outstanding:Basic* 205,003 203,593 208,155
Diluted* 206,062 205,338 208,345
Income before extraordinary itemper share of common stock
Basic $ 2.80 $ 2.54 $ 2.06
Diluted $ 2.79 $ 2.52 $ 2.06
Net income per share of common stockBasic $ 2.88 $ 2.54 $ 2.06
Diluted $ 2.87 $ 2.52 $ 2.06
Common dividends declared per share $ 1.00 $ 1.00 $ 1.00
* In thousands of shares
See notes to Consolidated Financial Statements.
SEMPRA ENERGY 37.

SEMPRA ENERGYCONSOLIDATED BALANCE SHEETS
December 31,(Dollars in millions) 2002 2001
ASSETSCurrent assets:
Cash and cash equivalents $ 455 $ 605Accounts receivable — trade 754 657Accounts and notes receivable — other 135 138Due from unconsolidated affiliates 80 57Income taxes receivable — 98Deferred income taxes 20 —Trading assets 5,064 2,740Fixed-price contracts and other derivatives 3 57Regulatory assets arising from fixed-price contracts and other
derivatives 151 168Other regulatory assets 75 75Inventories 134 124Other 139 71
Total current assets 7,010 4,790
Investments and other assets:Fixed-price contracts and other derivatives 42 27Due from unconsolidated affiliates 57 —Regulatory assets arising from fixed-price
contracts and other derivatives 812 784Other regulatory assets 532 1,004Nuclear-decommissioning trusts 494 526Investments 1,313 1,169Sundry 665 564
Total investments and other assets 3,915 4,074
Property, plant and equipment:Property, plant and equipment 13,816 12,806Less accumulated depreciation and amortization (6,984) (6,590)
Total property, plant and equipment — net 6,832 6,216
Total assets $17,757 $15,080
See notes to Consolidated Financial Statements.
SEMPRA ENERGY 38.

SEMPRA ENERGYCONSOLIDATED BALANCE SHEETS
December 31,(Dollars in millions) 2002 2001
LIABILITIES AND SHAREHOLDERS’ EQUITYCurrent liabilities:
Short-term debt $ 570 $ 875Accounts payable — trade 694 701Accounts payable — other 50 113Income taxes payable 22 —Deferred income taxes — 70Trading liabilities 4,094 1,793Dividends and interest payable 133 133Regulatory balancing accounts — net 578 733Regulatory liabilities 18 19Fixed-price contracts and other derivatives 153 171Current portion of long-term debt 281 242Other 654 622
Total current liabilities 7,247 5,472
Long-term debt 4,083 3,436
Deferred credits and other liabilities:Due to unconsolidated affiliate 162 160Customer advances for construction 91 72Post-retirement benefits other than pensions 136 145Deferred income taxes 800 847Deferred investment tax credits 90 95Fixed-price contracts and other derivatives 813 788Regulatory liabilities 121 86Deferred credits and other liabilities 985 883
Total deferred credits and other liabilities 3,198 3,076
Preferred stock of subsidiaries 204 204
Mandatorily redeemable trust preferred securities 200 200
Commitments and contingent liabilities (Note 15)
SHAREHOLDERS’ EQUITY
Preferred stock (50,000,000 shares authorized, none issued) — —Common stock (750,000,000 shares authorized; 204,911,572 and
204,475,362 shares outstanding at December 31, 2002 andDecember 31, 2001, respectively) 1,436 1,495
Retained earnings 1,861 1,475Deferred compensation relating to ESOP (33) (36)Accumulated other comprehensive income (loss) (439) (242)
Total shareholders’ equity 2,825 2,692
Total liabilities and shareholders’ equity $17,757 $15,080
See notes to Consolidated Financial Statements.
SEMPRA ENERGY 39.

SEMPRA ENERGYSTATEMENTS OF CONSOLIDATED CASH FLOWS
Years ended December 31,(Dollars in millions) 2002 2001 2000
CASH FLOWS FROM OPERATING ACTIVITIESNet Income $ 591 $ 518 $ 429Adjustments to reconcile net income to net cash provided by
operating activities:Extraordinary item, net of tax (16) — —Depreciation and amortization 596 579 563Foreign currency loss (gain) (63) — —Customer refunds paid — (127) (628)Deferred income taxes and investment tax credits (92) 106 258Equity in (income) losses of unconsolidated affiliates 55 (12) (62)Gain on sale of Energy America — (29) —Loss on surrender of Nova Scotia franchise — 30 —Loss (gain) on sale and disposition of assets 14 (14) —Fixed-price contracts and other derivatives income (5) (1) —Changes in other assets 168 (214) 22Changes in other liabilities 40 99 (108)Net changes in other working capital components 83 (203) 408
Net cash provided by operating activities 1,371 732 882
CASH FLOWS FROM INVESTING ACTIVITIESExpenditures for property, plant and equipment (1,214) (1,068) (759)Investments and acquisitions of affiliates, net of cash acquired (442) (111) (243)Dividends received from unconsolidated affiliates 11 80 30Net proceeds from sale of assets — 128 24Loan to affiliate — (57) —Other — net (14) (11) 24
Net cash used in investing activities (1,659) (1,039) (924)
CASH FLOWS FROM FINANCING ACTIVITIESCommon stock dividends (205) (203) (244)Repurchases of common stock (16) (1) (725)Issuances of common stock 13 41 12Issuance of trust preferred securities — — 200Issuances of long-term debt 1,150 675 813Payments on long-term debt (479) (681) (238)Loan from unconsolidated affiliate — 160 —Increase (decrease) in short-term debt — net (307) 310 386Other — net (18) (26) (12)
Net cash provided by financing activities 138 275 192
Increase (decrease) in cash and cash equivalents (150) (32) 150Cash and cash equivalents, January 1 605 637 487
Cash and cash equivalents, December 31 $ 455 $ 605 $ 637
See notes to Consolidated Financial Statements.
SEMPRA ENERGY 40.

Years ended December 31,(Dollars in millions) 2002 2001 2000
CHANGES IN OTHER WORKING CAPITAL COMPONENTS(Excluding cash and cash equivalents, and debt due within one year)Accounts and notes receivable $ (121) $ 353 $(655)Net trading assets 66 (362) (290)Income taxes — net 86 (121) 120Due to/from affiliates — net (69) — —Inventories (11) 33 (97)Regulatory balancing accounts 115 70 545Regulatory assets and liabilities 1 39 (2)Other current assets 102 69 (84)Accounts payable (103) (302) 733Other current liabilities 17 18 138
Net change in other working capital components $ 83 $(203) $ 408
SUPPLEMENTAL DISCLOSURE OF CASH FLOW INFORMATIONInterest payments, net of amounts capitalized $ 279 $ 302 $ 291
Income tax payments, net of refunds $ 140 $ 138 $ 104
SUPPLEMENTAL SCHEDULE OF NON-CASH INVESTING ANDFINANCING ACTIVITIES
Acquisition of subsidiaries:Assets acquired $1,134 $ — $ 40Cash paid, net of cash acquired (119) — (39)
Liabilities assumed $1,015 $ — $ 1
See notes to Consolidated Financial Statements.
SEMPRA ENERGY 41.
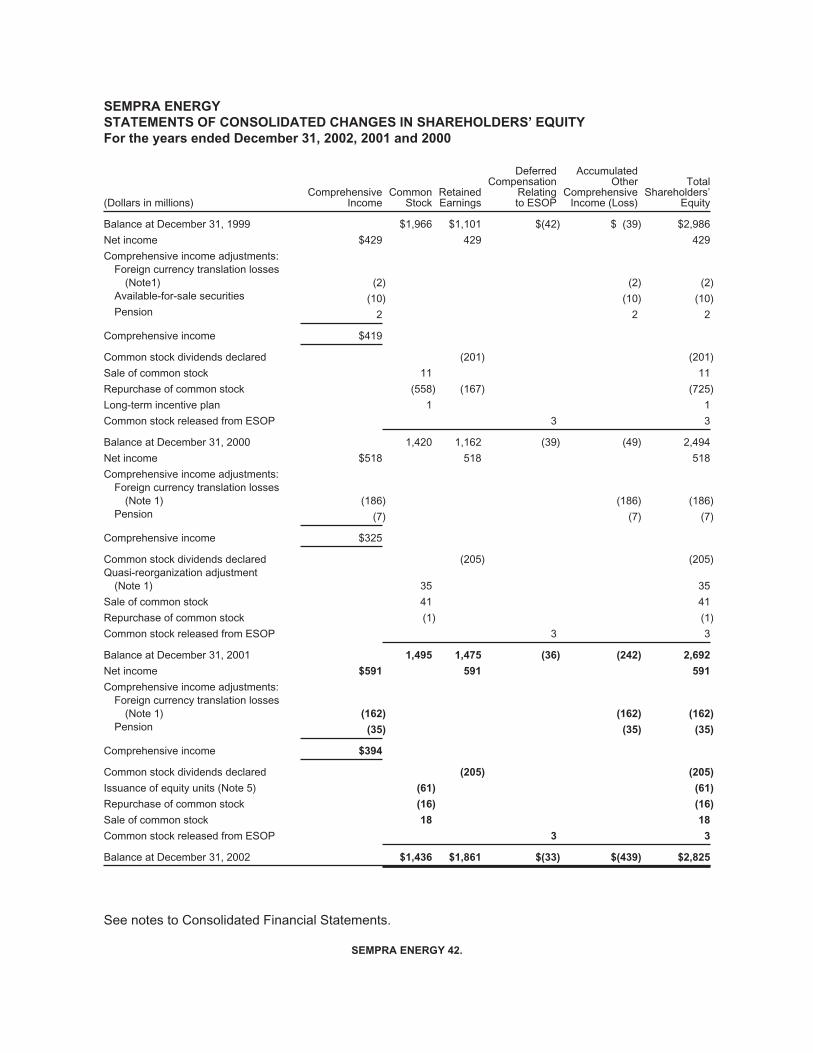
SEMPRA ENERGYSTATEMENTS OF CONSOLIDATED CHANGES IN SHAREHOLDERS’ EQUITYFor the years ended December 31, 2002, 2001 and 2000
(Dollars in millions)Comprehensive
IncomeCommon
StockRetainedEarnings
DeferredCompensation
Relatingto ESOP
AccumulatedOther
ComprehensiveIncome (Loss)
TotalShareholders’
Equity
Balance at December 31, 1999 $1,966 $1,101 $(42) $ (39) $2,986
Net income $429 429 429
Comprehensive income adjustments:Foreign currency translation losses
(Note1) (2) (2) (2)Available-for-sale securities (10) (10) (10)Pension 2 2 2
Comprehensive income $419
Common stock dividends declared (201) (201)
Sale of common stock 11 11
Repurchase of common stock (558) (167) (725)
Long-term incentive plan 1 1
Common stock released from ESOP 3 3
Balance at December 31, 2000 1,420 1,162 (39) (49) 2,494
Net income $518 518 518
Comprehensive income adjustments:Foreign currency translation losses
(Note 1) (186) (186) (186)Pension (7) (7) (7)
Comprehensive income $325
Common stock dividends declared (205) (205)Quasi-reorganization adjustment
(Note 1) 35 35
Sale of common stock 41 41
Repurchase of common stock (1) (1)
Common stock released from ESOP 3 3
Balance at December 31, 2001 1,495 1,475 (36) (242) 2,692
Net income $591 591 591
Comprehensive income adjustments:Foreign currency translation losses
(Note 1) (162) (162) (162)Pension (35) (35) (35)
Comprehensive income $394
Common stock dividends declared (205) (205)
Issuance of equity units (Note 5) (61) (61)
Repurchase of common stock (16) (16)
Sale of common stock 18 18
Common stock released from ESOP 3 3
Balance at December 31, 2002 $1,436 $1,861 $(33) $(439) $2,825
See notes to Consolidated Financial Statements.
SEMPRA ENERGY 42.

NOTES TO CONSOLIDATED FINANCIAL STATEMENTS
NOTE 1. SIGNIFICANT ACCOUNTING POLICIES
Business Combination
Sempra Energy (the company) was formed as a holding company for Enova Corporation (Enova) andPacific Enterprises (PE) in connection with a business combination of Enova and PE that wascompleted on June 26, 1998.
Principles of Consolidation
The Consolidated Financial Statements include the accounts of Sempra Energy and all majority-ownedsubsidiaries. Investments in affiliated companies at which Sempra Energy has the ability to exercisesignificant influence, but not control, are accounted for using the equity method. All materialintercompany accounts and transactions have been eliminated.
Quasi-Reorganization
In 1993, PE divested its merchandising operations and most of its oil and natural gas exploration andproduction business. In connection with the divestitures, PE effected a quasi-reorganization forfinancial reporting purposes as of December 31, 1992. Certain of the liabilities established inconnection with the quasi-reorganization, including various income tax issues, were favorably resolvedin 2001, resulting in restoring $35 million to shareholders’ equity in that year. This did not affect thecalculation of net income or comprehensive income. The remaining liabilities will be resolved in futureyears. Management believes the provisions established for these matters are adequate.
Use of Estimates in the Preparation of the Financial Statements
The preparation of financial statements in conformity with generally accepted accounting principlesrequires management to make estimates and assumptions that affect the reported amounts ofrevenues and expenses during the reporting period, and the reported amounts of assets and liabilitiesand the disclosure of contingent assets and liabilities at the date of the financial statements. Actualamounts can differ significantly from those estimates.
Basis of Presentation
Certain prior-year amounts have been reclassified to conform to the current year’s presentation.
Regulatory Matters
Effects of Regulation
The accounting policies of the company’s principal utility subsidiaries, San Diego Gas & Electric(SDG&E) and Southern California Gas Company (SoCalGas) (collectively, the California Utilities),conform with generally accepted accounting principles for regulated enterprises and reflect the policiesof the California Public Utilities Commission (CPUC) and the Federal Energy Regulatory Commission(FERC).
SEMPRA ENERGY 43.

The California Utilities prepare their financial statements in accordance with the provisions ofStatement of Financial Accounting Standards (SFAS) 71, “Accounting for the Effects of Certain Typesof Regulation,” under which a regulated utility records a regulatory asset if it is probable that, throughthe ratemaking process, the utility will recover that asset from customers. Regulatory liabilitiesrepresent future reductions in rates for amounts due to customers. To the extent that portions of theutility operations cease to be subject to SFAS 71, or recovery is no longer probable as a result ofchanges in regulation or the utility’s competitive position, the related regulatory assets and liabilitieswould be written off. In addition, SFAS 144, “Accounting for the Impairment or Disposal of Long-LivedAssets” affects utility plant and regulatory assets such that a loss must be recognized whenever aregulator excludes all or part of an asset’s cost from ratebase. The application of SFAS 144 continuesto be evaluated in connection with industry restructuring. Information concerning regulatory assets andliabilities is described below in “Revenues”, “Regulatory Balancing Accounts,” and “Regulatory Assetsand Liabilities,” and industry restructuring is described in Notes 13 and 14.
Regulatory Balancing Accounts
The amounts included in regulatory balancing accounts at December 31, 2002, represent net payables(payables net of receivables) of $184 million and $394 million for SoCalGas and SDG&E, respectively.The corresponding amounts at December 31, 2001 were net payables of $158 million and $575 millionfor SoCalGas and SDG&E, respectively. The undercollected electric commodity costs accumulatedunder Assembly Bill (AB) 265 are anticipated to be recovered in rates (recovery is expected to occurbefore the end of 2005) and are included in “regulatory balancing accounts—net” at December 31,2002.
Balancing accounts provide a mechanism for charging utility customers the amount actually incurredfor certain costs, primarily commodity costs. As a result of California’s electric-restructuring law,fluctuations in certain costs and consumption levels that had been balanced now affect earnings fromelectric operations. In addition, fluctuations in certain costs and consumption levels affect earnings forSDG&E’s natural gas operations. As SoCalGas’ natural gas operations are mostly balanced, suchfluctuations do not affect earnings. In December 2002, the CPUC issued a decision approving 100percent balancing account treatment for variances between forecast and actual for SoCalGas’ noncorerevenues and throughput. The change eliminates the impact on earnings from any throughput andrevenue variances compared to adopted forecast levels, effective January 1, 2003. Additionalinformation on regulatory matters is included in Notes 13 and 14.
Regulatory Assets and Liabilities
In accordance with the accounting principles of SFAS 71, the company records regulatory assets(which represent probable future revenues associated with certain costs that will be recovered fromcustomers through the rate-making process) and regulatory liabilities (which represent probable futurereductions in revenue associated with amounts that are to be credited to customers through the rate-making process). They are amortized over the periods in which the costs are recovered from orrefunded to customers in regulatory revenues.
SEMPRA ENERGY 44.

Regulatory assets (liabilities) as of December 31 consist of the following:
(Dollars in millions) 2002 2001
SDG&E
Fixed-price contracts and other derivatives $ 638 $ 715Recapture of temporary discount* 326 409Undercollected electric commodity costs** — 392Deferred taxes recoverable in rates 190 162Unamortized loss on retirement of debt — net 49 52Employee benefit costs 35 39Other 5 26
Total 1,243 1,795
SoCalGas
Environmental remediation 43 55Fixed-price contracts and other derivatives 325 232Unamortized loss on retirement of debt — net 38 41Deferred taxes refundable in rates (164) (158)Employee benefit costs (142) (132)Other 8 5
Total 108 43PE — Employee benefit costs 80 88
Total PE consolidated 188 131
Total $1,431 $1,926
* In connection with electric industry restructuring, which is described in Note 13, SDG&Etemporarily reduced rates to its small-usage customers. That reduction is being recovered inrates through 2004.
** The undercollected electric commodity costs accumulated under Assembly Bill 265 areanticipated to be recovered in rates before the end of 2005 and are included in regulatorybalancing accounts—net at December 31, 2002.
Net regulatory assets are recorded on the Consolidated Balance Sheets at December 31 as follows(dollars in millions):
2002 2001
Current regulatory assets $ 226 $ 243Noncurrent regulatory assets 1,344 1,788Current regulatory liabilities (18) (19)Noncurrent regulatory liabilities (121) (86)
Total $1,431 $1,926
All the assets earn a return or the cash has not yet been expended and the assets are offset byliabilities that do not incur a carrying cost.
Cash and Cash Equivalents
Cash equivalents are highly liquid investments with maturities of three months or less at the date ofpurchase.
SEMPRA ENERGY 45.

Collection Allowance
The allowance for doubtful accounts receivable was $12 million, $22 million and $26 million atDecember 31, 2002, 2001 and 2000, respectively. The company recorded a provision for doubtfulaccounts of $13 million, $21 million and $25 million in 2002, 2001 and 2000, respectively.
The allowance for realization of trading assets was $53 million, $23 million and $8 million, at December31, 2002, 2001 and 2000, respectively. The company recorded a provision for trading assets of $0.2million, $15 million and $7 million in 2002, 2001 and 2000, respectively.
Trading Instruments
Trading assets and trading liabilities include option premiums paid and received; unrealized gains andlosses from exchange-traded futures and options, over-the-counter (OTC) swaps, forwards, physicalcommodities and options; and base metals. Trading instruments are recorded by Sempra EnergyTrading (SET) and Sempra Energy Solutions (SES) on a trade-date basis and adjusted daily to currentmarket value. Unrealized gains and losses on OTC transactions reflect amounts which would bereceived from or paid to a third party upon settlement of the contracts. Unrealized gains and losses onOTC transactions are reported separately as assets and liabilities unless a legal right of setoff existsunder an enforceable master netting arrangement. Additionally, as a result of SET’s acquisitions in2002, the company acquired $0.8 billion of base metals inventory. As of December 31, 2002 and 2001,trading assets include commodity inventory of $2.0 billion and $165 million, respectively. In accordancewith Emerging Issues Task Force (EITF) Issue 02-3, commodity inventory purchased on or beforeOctober 25, 2002 is carried at fair value, the majority of the inventory purchased after October 25,2002 (base metals) is carried at fair value, and the remainder of the inventory purchased afterOctober 25, 2002 is carried at average cost. On a limited basis, average cost includes the use of fairvalue for the quantity on hand at October 24, 2002, since historical cost data is not available for thatportion. See Note 2 for further discussion of the acquisitions made. See further discussion of EITFIssue 02-3 below.
Futures and exchange-traded option transactions are recorded as contractual commitments on a trade-date basis and are carried at current market value based on current closing exchange quotations.Derivative commodity swaps and forward transactions are accounted for as contractual commitmentson a trade-date basis and are carried at fair value derived from current dealer quotations andunderlying commodity-exchange quotations. OTC options are carried at fair value based on the use ofvaluation models that utilize, among other things, current interest, commodity and volatility rates. Forlong-dated forward transactions, current market values are derived using internally developed valuationmethodologies based on available market information. Where market rates are not quoted, currentinterest, commodity and volatility rates are estimated by reference to current market levels. Given thenature, size and timing of transactions, estimated values may differ significantly from realized values.Changes in market values are recorded in the calculation of net income. Although trading instrumentsmay have scheduled maturities in excess of one year, the actual settlement of these transactions canoccur sooner, resulting in the current classification of trading assets and liabilities on the ConsolidatedBalance Sheets. Refer to “New Accounting Standards” below for a discussion of the rescission ofEITF 98-10.
Inventories
At December 31, 2002, inventory, excluding amounts presented in trading assets, included natural gasof $77 million and materials and supplies of $57 million. The corresponding balances at December 31,2001 were $68 million and $56 million, respectively. Natural gas at the California Utilities ($74 millionand $68 million at December 31, 2002 and 2001, respectively) is valued by the last-in first-out (LIFO)method. When the California Utilities’ inventory is consumed, differences between this LIFO valuation
SEMPRA ENERGY 46.

and replacement cost will be reflected in customer rates. Materials and supplies at the CaliforniaUtilities are generally valued at the lower of average cost or market.
Property, Plant and Equipment
Property, plant and equipment primarily represents the buildings, equipment and other facilities usedby the California Utilities to provide natural gas and electric utility services.
The cost of utility plant includes labor, materials, contract services and related items, and an allowancefor funds used during construction (AFUDC). The cost of most retired depreciable utility plant, plusremoval costs minus salvage value, is charged to accumulated depreciation.
Property, plant and equipment balances by major functional categories are as follows:
Property, Plant andEquipment atDecember 31
Depreciation rates for years endedDecember 31
(Dollars in billions) 2002 2001 2002 2001 2000
California utilities:Natural gas operations $ 7.7 $ 7.5 4.25% 4.25% 4.29%Electric distribution 3.0 2.9 4.66% 4.67% 4.67%Electric transmission 0.9 0.8 3.17% 3.19% 3.21%Other electric 0.6 0.3 9.37% 8.46% 8.33%
Total 12.2 11.5Other operations 1.6 1.3 various various various
Total $13.8 $12.8
Accumulated depreciation and decommissioning of natural gas and electric utility plant in service were$4.5 billion and $2.2 billion, respectively, at December 31, 2002, and were $4.2 billion and $2.1 billion,respectively, at December 31, 2001. Depreciation expense is based on the straight-line method overthe useful lives of the assets or a shorter period prescribed by the CPUC. See Note 13 for discussionof the sale of generation facilities and industry restructuring. Maintenance costs are expensed asincurred.
AFUDC, which represents the cost of funds used to finance the construction of utility plant, is added tothe cost of utility plant. AFUDC also increases income, partly as an offset to interest charges and partlyas a component of other income, shown in the Statements of Consolidated Income, although it is not acurrent source of cash. AFUDC amounted to $34 million, $17 million and $13 million for 2002, 2001and 2000, respectively. Total carrying costs capitalized, including AFUDC and the impact of SempraEnergy Resources’ (SER) construction projects, were $63 million, $28 million and $16 million for 2002,2001 and 2000, respectively.
Long-Lived Assets
The company periodically evaluates whether events or circumstances have occurred that may affectthe recoverability or the estimated useful lives of long-lived assets. Impairment occurs when theestimated future undiscounted cash flows is less than the carrying amount of the assets. If thatcomparison indicates that the assets’ carrying value may be permanently impaired, such potentialimpairment is measured based on the difference between the carrying amount and the fair value of theassets based on quoted market prices or, if market prices are not available, on the estimateddiscounted cash flows. This calculation is performed at the lowest level for which separately identifiablecash flows exist. See further discussion of SFAS 144 in “New Accounting Standards”.
SEMPRA ENERGY 47.

Nuclear-Decommissioning Liability
At December 31, 2002 and 2001, deferred credits and other liabilities include $139 million and $151million, respectively, of accrued decommissioning costs associated with SDG&E’s interest in SanOnofre Nuclear Generating Station (SONGS) Unit 1, which was permanently shut down in 1992. Thecorresponding liability for SONGS Units 2 and 3 decommissioning (included in accumulateddepreciation and amortization) is $355 million and $375 million at December 31, 2002 and 2001,respectively. Additional information on SONGS decommissioning costs is included below in “NewAccounting Standards.”
Comprehensive Income
Comprehensive income includes all changes, except those resulting from investments by owners anddistributions to owners, in the equity of a business enterprise from transactions and other events,including foreign-currency translation adjustments, minimum pension liability adjustments, unrealizedgains and losses on marketable securities that are classified as available-for-sale, and certain hedgingactivities. The components of other comprehensive income are shown in the Statements ofConsolidated Changes in Shareholders’ Equity.
Stock-Based Compensation
At December 31, 2002, the company has stock-based employee compensation plans, which aredescribed more fully in Note 9. The company accounts for those plans under the recognition andmeasurement principles of Accounting Principles Board (APB) Opinion 25, “Accounting for StockIssued to Employees,” and related Interpretations. For certain grants, no stock-based employeecompensation cost is reflected in net income, since the options granted under those plans had anexercise price equal to the market value of the underlying common stock on the date of grant.
The following table illustrates the effect on net income and earnings per share if the company hadapplied the fair value recognition provisions of SFAS 123, “Accounting for Stock-BasedCompensation,” and SFAS 148, “Accounting for Stock-Based Compensation—Transition andDisclosure.”
Dollars in millions,except per share amounts
Years Ended December 31
2002 2001 2000
Net income as reported $ 591 $ 518 $ 429Stock-based employee compensation expense determined under
the fair value based method, net of related income taxes (8) (1) —
Pro forma net income $ 583 $ 517 $ 429
Earnings per share:Basic – as reported $2.88 $2.54 $2.06
Basic – pro forma $2.84 $2.54 $2.06
Diluted – as reported $2.87 $2.52 $2.06
Diluted – pro forma $2.83 $2.52 $2.06
SEMPRA ENERGY 48.

Revenues
Revenues of the California Utilities are derived from deliveries of electricity and natural gas tocustomers and changes in related regulatory balancing accounts. Revenues from electricity andnatural gas sales and services are generally recorded under the accrual method and these revenuesare recognized upon delivery. The portion of SDG&E’s electric commodity that was procured for itscustomers by the California Department of Water Resources (DWR) is not included in SDG&E’srevenues or costs. For 2001, California Power Exchange (PX) and Independent System Operator(ISO) power revenues have been netted against purchased-power expense to avoid double-countingas SDG&E sold power into the PX/ISO and then purchased power therefrom. Refer to Note 13 for adiscussion of the electric industry restructuring. Natural gas storage contract revenues are accrued ona monthly basis and reflect reservation, storage and injection charges in accordance with negotiatedagreements, which have one-year to three-year terms. Operating revenue includes amounts forservices rendered but unbilled (approximately one-half month’s deliveries) at the end of each year.
Operating costs of SONGS Units 2 and 3 (including nuclear fuel and nuclear fuel financing costs) andincremental capital expenditures are recovered through the Incremental Cost Incentive Pricing (ICIP)mechanism which allows SDG&E to receive approximately 4.4 cents per kilowatt-hour (kWh) through2003. Any differences between these costs and the incentive price affect net income and, for the yearended December 31, 2002, the ICIP contributed $50 million to SDG&E’s net income. The CPUC hasrejected an administrative law judge’s proposed decision to end ICIP prior to its December 31, 2003scheduled expiration date. However, the CPUC has also denied the previously approved market-basedpricing for SONGS beginning in 2004 and instead provided for traditional rate-making treatment, underwhich the SONGS ratebase would begin at zero, essentially eliminating earnings from SONGS untilratebase grows. The company has applied for rehearing of this decision.
Additional information concerning utility revenue recognition is discussed above under “RegulatoryMatters.”
SET generates a substantial portion of its revenues from market making and trading activities, as aprincipal, in natural gas, electricity, petroleum, metals and other commodities, for which it quotes bidand asked prices to end users and other market makers. Principal transaction revenues are recognizedon a trade-date basis, and include realized gains and losses, and the net change in unrealized gainsand losses measured at current fair value. SET also earns trading profits as a dealer by structuring andexecuting transactions that permit its counterparties to manage their risk profiles. In addition, it takespositions in energy markets based on the expectation of future market conditions. These positionsinclude options, forwards, futures, physical commodities and swaps. Options, which are eitherexchange-traded or directly negotiated between counterparties, provide the holder with the right to buyfrom or sell to the other party an agreed amount of commodity at a specified price within a specifiedperiod or at a specified time.
As a writer of options, SET generally receives an option premium and then manages the risk of anunfavorable change in the value of the underlying commodity by entering into related transactions or byother means. Forward and future transactions are contracts for delayed delivery of commodities inwhich the counterparty agrees to make or take delivery at a specified price. Commodity swaptransactions may involve the exchange of fixed and floating payment obligations without the exchangeof the underlying commodity. These financial instruments represent contracts with counterpartieswhereby payments are linked to or derived from market indices or on terms predetermined by thecontract, which may or may not be financially settled by SET. All of SET’s derivative transactions areheld for trading and marketing purposes and were recorded at current fair value. Any post October 25,2002 non-derivative contracts are being accounted for on an accrual basis. Hence, the related profit orloss will be recognized as the contract is performed. Inventory purchased after October 25, 2002 isbeing carried on a lower of cost or market basis.
SEMPRA ENERGY 49.

Revenues of SES are generated from commodity sales and energy-related products and services tocommercial, industrial, government and institutional markets. Energy supply revenues from natural gasand electricity commodity sales are recognized on a current fair value basis and include realized gainsand losses and the net change in unrealized gains and losses measured at fair value. Revenues onconstruction projects are recognized during the construction period using the percentage-of-completionmethod, and revenues from other operating and maintenance service contracts are recorded under theaccrual method and recognized as service is rendered.
SET and SES record revenues from trading activities on a net basis in accordance with EITF 02-3. Seefurther discussion of this matter and the rescission of EITF Issue 98-10 under “New AccountingStandards”.
Revenues of SER are derived primarily from the sale of electric energy to governmental and wholesalepower marketing entities, which are recognized in accordance with provisions of EITF 91-6, “RevenueRecognition of Long-term Power Supply Contracts”, and EITF 96-17, “Revenue Recognition UnderLong-term Power Sales Contacts that Contain Both Fixed and Variable Terms.” During 2002, electricenergy sales to the DWR accounted for a significant portion of total SER revenues.
The consolidated subsidiaries of Sempra Energy International (SEI) which operate in Mexico recognizerevenue similarly to the California Utilities, except that SFAS 71 is not applicable due to the differentregulatory environment. The balance of SEI’s revenues consists of its share of the income of itsunconsolidated subsidiaries.
Foreign Currency Translation
The assets and liabilities of the company’s foreign operations are generally translated into U.S. dollarsat current exchange rates, and revenues and expenses are translated at average exchange rates forthe year. Resulting translation adjustments do not enter into the calculation of net income or retainedearnings, but are reflected in comprehensive income and accumulated other comprehensive income, acomponent of shareholders’ equity, as described below. Foreign currency transaction gains and lossesare included in consolidated net income. To reflect the devaluation in the Argentine peso, the functionalcurrency of the company’s Argentine operations, SEI adjusted its investment in its two Argentinenatural gas utility holding companies downward by $103 million and $120 million in 2002 and 2001,respectively. These non-cash adjustments did not affect net income, but did reduce comprehensiveincome and increase accumulated other comprehensive income (loss). Additional informationconcerning these investments is described in Note 3.
Related Party Transactions—Loans To Unconsolidated Affiliates
In December 2001, SEI issued two U.S. dollar denominated loans totaling $35 million and $22 millionto its affiliates Camuzzi Gas Pampeana S. A. and Camuzzi Gas del Sur S. A., respectively. Theseloans have variable interest rates (8.863% at December 31, 2002) and are due on December 11, 2003.The total balance outstanding under the notes was $57 million at December 31, 2002 and 2001. AtDecember 31, 2002, this amount is included in non-current assets, under the caption “Due fromunconsolidated affiliates.” Additionally, at December 31, 2002 SET had $79 million due from its affiliate,Atlantic Electric & Gas and the company had $1 million due from other affiliates. This amount isincluded in current assets, under the caption “Due from unconsolidated affiliates”.
New Accounting Standards
SFAS 142, “Goodwill and Other Intangible Assets”: In July 2001, the Financial Accounting StandardsBoard (FASB) issued SFAS 142, which provides guidance on how to account for goodwill and other
SEMPRA ENERGY 50.

intangible assets after an acquisition is complete, and is effective for the company in 2002. SFAS 142calls for amortization of goodwill to cease and requires goodwill and certain other intangibles to betested for impairment at least annually. Amortization of goodwill, including the company’s share ofamounts recorded by unconsolidated subsidiaries, was $24 million and $35 million in 2001 and 2000,respectively. In accordance with the transitional guidance of SFAS 142, recorded goodwill attributableto the company was tested for impairment in 2002 by comparing the fair value to its carrying value. Fairvalue was determined using a discounted cash flow methodology. As a result, during the first quarter of2002, SEI recorded a pre-tax charge of $6 million related to the impairment of goodwill associated withits two domestic subsidiaries. Impairment losses are reflected in other operating expenses in theStatements of Consolidated Income.
The following table shows what net income and earnings per share would have been if amortizationrelated to goodwill that is no longer being amortized had also not been amortized in prior periods. (Thiscomparison ignores the fact that a 2002 goodwill impairment charge would have been larger if goodwillhad not been amortized in prior periods.)
Years ended December 31,
Dollars in millions, except for the per share amounts 2002 2001 2000
Reported income before extraordinary item $ 575 $ 518 $ 429Add: goodwill amortization, net of tax — 15 21
Pro forma adjusted income before extraordinary item $ 575 $ 533 $ 450
Reported net income $ 591 $ 518 $ 429Add: goodwill amortization, net of tax — 15 21
Pro forma adjusted net income $ 591 $ 533 $ 450
Reported basic earnings per share $2.88 $2.54 $2.06Add: goodwill amortization, net of tax — .07 .10
Pro forma adjusted basic earnings per share $2.88 $2.61 $2.16
Reported diluted earnings per share $2.87 $2.52 $2.06Add: goodwill amortization, net of tax — .07 .10
Pro forma adjusted diluted earnings per share $2.87 $2.59 $2.16
During 2002, SET completed several acquisitions as further discussed in Note 2. As a result of SET’sacquisitions, the company recorded $21 million of goodwill on the Consolidated Balance Sheets and$16 million as an after-tax extraordinary gain for 2002.
SEMPRA ENERGY 51.

The change in the carrying amount of goodwill (included in noncurrent sundry assets on theConsolidated Balance Sheets) for the years ended December 31, 2002 and 2001 are as follows:
(Dollars in millions) SET Other Total
Balance as of January 1, 2001 $131 $57 $188Amortization of goodwill (11) (5) (16)
Balance as of December 31, 2001 120 52 172Goodwill acquired during the year 21 — 21Impairment losses — (6) (6)Other — (5) (5)
Balance as of December 31, 2002 $141 $41 $182
SET is the only reportable segment that has goodwill. In addition, unamortized goodwill related tounconsolidated subsidiaries (included in investments on the Consolidated Balance Sheets), primarilythose located in South America, was $294 million at both December 31, 2002 and 2001 before foreigncurrency translation adjustments. Including foreign currency translation adjustments, these amountswere $219 million and $233 million, respectively. Unamortized other intangible assets were notmaterial at December 31, 2002 and 2001.
SFAS 143, “Accounting for Asset Retirement Obligations”: SFAS 143, issued in July 2001, addressesfinancial accounting and reporting for obligations associated with the retirement of tangible long-livedassets and the associated asset retirement costs. This applies to legal obligations associated with theretirement of long-lived assets that result from the acquisition, construction, development and/ornormal operation of long-lived assets, such as nuclear plants. It requires entities to record the fair valueof a liability for an asset retirement obligation in the period in which it is incurred. When the liability isinitially recorded, the entity increases the carrying amount of the related long-lived asset by the presentvalue of the future retirement cost. Over time, the liability is accreted to its full value and paid, and thecapitalized cost is depreciated over the useful life of the related asset. SFAS 143 is effective forfinancial statements issued for fiscal years beginning after June 15, 2002. The items noted below wereidentified by the company to have a material asset retirement obligation.
Adoption of SFAS 143 will change the accounting for the decommissioning of the company’s share ofSONGS. Prior to the adoption of SFAS 143, the company recorded the obligation for decommissioningover the lives of the plants. At December 31, 2002, the company’s share of decommissioning cost forthe SONGS’ units has been estimated to be $309 million in 2002 dollars, based on a 2001 cost studyfiled with the CPUC. The adoption of this standard, effective January 1, 2003, will require a cumulativeadjustment to adjust plant assets and decommissioning liabilities to the values they would have beenhad this standard been employed from the in-service dates of the plants. Upon adoption of SFAS 143in 2003, the company will record an addition of $70 million to utility plant, representing the company’sshare of SONGS estimated future decommissioning costs (as discounted to the present value at thedate the various units began operation), and a corresponding retirement obligation liability of$309 million. The nuclear decommissioning trusts’ balance of $494 million at December 31, 2002represents amounts collected for future decommissioning costs and earnings thereon, and has acorresponding offset in accumulated depreciation ($355 million related to SONGS Units 2 and 3) anddeferred credits ($139 million related to SONGS Unit 1). The difference between the amounts results ina regulatory liability of $214 million to reflect that SDG&E has collected the funds from its customersmore quickly than SFAS 143 would accrete the retirement liability and depreciate the asset. See furtherdiscussion of SONGS’ decommissioning and the related nuclear decommissioning trusts in Note 6.
SEMPRA ENERGY 52.

As of January 1, 2003, the company had additional asset retirement obligations estimated to be$23 million associated with the retirement of a power plant and a storage field.
SFAS 144, “Accounting for Impairment or Disposal of Long-Lived Assets”: In August 2001, the FASBissued SFAS 144, which replaces SFAS 121, “Accounting for the Impairment of Long-Lived Assets andfor Long-Lived Assets to Be Disposed Of.” SFAS 144 applies to all long-lived assets, includingdiscontinued operations. SFAS 144 requires that those long-lived assets classified as held for sale bemeasured at the lower of carrying amount (cost less accumulated depreciation) or fair value less costto sell. Discontinued operations will no longer be measured at net realizable value or include amountsfor operating losses that have not yet occurred. SFAS 144 also broadens the reporting of discontinuedoperations to include all components of an entity with operations that can be distinguished from therest of the entity and that will be eliminated from the ongoing operations of the entity in a disposaltransaction. The company has identified no material effects to the financial statements from theimplementation of SFAS 144.
SFAS 148, “Accounting for Stock-Based Compensation—Transition and Disclosure”: In December2002, the FASB issued SFAS 148, an amendment to SFAS 123, “Accounting for Stock-BasedCompensation,” which gives companies electing to expense employee stock options three methods todo so. In addition, the statement amends the disclosure requirements to require more prominentdisclosure about the method of accounting for stock-based employee compensation and the effect ofthe method used on reported results in both annual and interim financial statements.
The company has elected to continue using the intrinsic value method of accounting for stock-basedcompensation. Therefore, the amendment to SFAS 123 will not have any effect on the company’sfinancial statements. See Note 9 for additional information regarding stock-based compensation.
SFAS 149, “Accounting for Certain Financial Instruments with Characteristics of Liabilities andEquity”: On January 22, 2003, the FASB directed its staff to prepare a draft of SFAS 149. The finaldraft is expected to be issued in March 2003. The statement will establish standards for accounting forfinancial instruments with characteristics of liabilities, equity, or both. Subsequent to the issuance ofSFAS 149, certain investments that are currently classified as equity in the financial statements mighthave to be reclassified as liabilities. In addition, the FASB decided that SFAS 149 will prohibit thepresentation of certain items in the mezzanine section (the portion of a balance sheet betweenliabilities and equity) of the statement of financial position. For example, certain mandatorilyredeemable preferred stock, which is currently included in the mezzanine section, may be classified asa liability once SFAS 149 goes into effect. The proposed effective date of SFAS 149 is July 1, 2003 forthe company.
EITF Issue 02-3, “Issues Involved in Accounting for Derivative Contracts Held for Trading Purposesand Contracts Involved in Energy Trading and Risk Management Activities”: In June 2002, aconsensus was reached in EITF Issue 02-3, which codifies and reconciles existing guidance on therecognition and reporting of gains and losses on energy trading contracts, and addresses otheraspects of the accounting for contracts involved in energy trading and risk management activities.Among other things, the consensus requires that mark-to-market gains and losses on energy tradingcontracts should be shown on a net basis in the income statement, effective for financial statementsissued for periods ending after July 15, 2002. This required that SES change its method of recordingtrading activities from gross to net, which had no impact on previously recorded gross margin, netincome or cash provided by operating activities. SET was already recording revenues from tradingactivities net and required no change.
SEMPRA ENERGY 53.

The following table shows the impact of changing from gross to net presentations for energy tradingactivities on the company’s revenues for prior years (dollars in millions):
Years endedDecember 31,
2001 2000
Revenues as previously reported $8,078 $7,037Adjustment (348) (277)
Revenues as restated $7,730 $6,760
In October 2002, the EITF reached a consensus to rescind Issue 98-10 “Accounting for ContractsInvolved in Energy Trading and Risk Management Activities,” the basis for fair value accounting usedfor recording energy-trading activities by SET and SES. The consensus requires that all new energy-related contracts entered into subsequent to October 25, 2002 should not be accounted pursuant toIssue 98-10. Instead, those contracts should be accounted for at historical cost and will not qualify formark-to-market accounting unless the contracts meet the requirements stated under SFAS 133“Accounting for Derivative Instruments and Hedging Activities”. Contracts entered into throughOctober 25, 2002 are to be accounted for at fair value through December 31, 2002. Except forinventory, capacity contracts and natural gas storage, the company’s transactions recorded at fairvalue by EITF Issue 98-10 will still be recorded at fair value based on SFAS 133 (see Note 10 foradditional information concerning SFAS 133 derivatives). Furthermore, the EITF decided to retain theguidance in Issue 02-3, which states that energy trading contracts and derivative instruments underSFAS 133 must be presented on a net basis in the income statement whether or not physically settled.Adoption of this statement will result in a cumulative-effect charge in the first quarter of 2003(preliminarily estimated to be less than $20 million after tax) and likely will have a material impact onthe company’s financial statements in future periods from the delay in profit recognition on transactionsthat were covered by EITF 98-10 but are not covered by SFAS 133.
FASB Interpretation 45, “Guarantor’s Accounting and Disclosure Requirements for Guarantees”: InNovember 2002, the FASB issued Interpretation 45, which elaborates on the disclosures to be made ininterim and annual financial statements of a guarantor about its obligations under certain guaranteesthat it has issued. It also clarifies that a guarantor is required to recognize, at the inception of aguarantee, a liability for the fair value of the obligation undertaken in issuing a guarantee. Initialrecognition and measurement provisions of the Interpretation are applicable on a prospective basis toguarantees issued or modified after December 31, 2002. The disclosure requirements are effective forfinancial statements of interim or annual periods ending after December 15, 2002. As of December 31,2002, substantially all of the company’s guarantees were intercompany, whereby the parent issues theguarantees on behalf of its consolidated subsidiaries to a third party. The only significant guarantee forwhich disclosure is required is that of the synthetic lease for the Mesquite Power Plant, which is alsoaffected by FASB Interpretation 46, as described below.
FASB Interpretation 46, “Consolidation of Variable Interest Entities”: In January 2003, the FASBissued Interpretation 46, which addresses consolidation by business enterprises of variable-interestentities. The interpretation is effective immediately for variable-interest entities created afterJanuary 31, 2003. For variable-interest entities created before February 1, 2003, the interpretation iseffective for fiscal or interim periods beginning after June 15, 2003. As of December 31, 2002, thecompany had commitments of $70 million related to a synthetic lease agreement to finance theconstruction of the Mesquite Power Plant. As a synthetic lease, neither the plant asset nor the relatedliability is included on the Consolidated Balance Sheets. If they were, property, plant and equipmentand long-term debt would each have been increased by $545 million at December 31, 2002, reflectingreimbursements for costs incurred on the project, including costs subject to collateralization
SEMPRA ENERGY 54.

requirements. Under Interpretation 46, the company would be required to increase property, plant andequipment and long-term debt by the total cost incurred and subject to collateralization requirementsunder the synthetic lease beginning July 1, 2003. See further discussion of the synthetic leaseagreement in Note 15.
Other Accounting Standards: During 2002 and 2001 the FASB and the EITF issued severalstatements that are currently not applicable to the company. In April 2002, the FASB issued SFAS 145,which rescinds SFAS 4, “Reporting Gains and Losses from Extinguishment of Debt”, and SFAS 64,“Extinguishments of Debt Made to Satisfy Sinking-Fund Requirements.” In June 2002, the FASBissued SFAS 146, “Accounting for Costs Associated with Exit or Disposal Activities,” which addressesaccounting for restructuring and similar costs. SFAS 146 supersedes previous accounting guidance,principally EITF Issue 94-3, “Liability Recognition for Certain Employee Termination Benefits and OtherCosts to Exit an Activity (including Certain Costs Incurred in a Restructuring).” In October 2002, theFASB issued SFAS 147, “Accounting for Certain Financial Institutions—an amendment of SFAS 72and 144 and FASB Interpretation 9,” which applies to acquisitions of financial institutions.
NOTE 2: RECENT ACQUISITIONS AND INVESTMENTS
Sempra Energy Trading
During 2002, SET completed acquisitions that added base metals trading and warehousing to itstrading business. On February 4, 2002, SET completed the acquisition of London-based SempraMetals Limited, a leading metals trader on the London Metals Exchange, for $65 million, net of cashacquired. On April 26, 2002, SET completed the acquisition of the assets of New York-based SempraMetals & Concentrates Corp., a leading global trader of copper, lead and zinc concentrates, for$24 million. Also in April 2002, SET completed the acquisition of Liverpool, England-based HenryBath & Sons Limited, which provides warehousing services for non-ferrous metals in Europe and Asia,and the assets of the U.S. warehousing business of Henry Bath, Inc., for a total of $30 million, net ofcash acquired.
All of these entities were part of the former MG Metals Group, which had recently been acquired byEnron. Related to these acquisitions, the company recognized an extraordinary after-tax gain of$16 million and goodwill of $21 million, which is expected to be fully deductible for tax purposes.
In January 2003, SET purchased from CMS Energy’s marketing and trading unit a substantial portionof its wholesale natural gas trading book for $17 million.
Sempra Energy Resources
On October 31, 2002, SER purchased a 305-megawatt, coal-fired power plant (renamed Twin OaksPower) from Texas-New Mexico Power Company for $120 million. SER has a five-year contract to sellsubstantially all of the output of the plant. In connection with the acquisition, SER also assumed acontract which includes annual commitments to purchase lignite coal either until an aggregateminimum volume has been achieved or through 2025. The wholly owned 1,250-megawatt MesquitePower Plant near Phoenix, Arizona, is expected to commence commercial operations at 50-percentcapacity in June 2003 and at full capacity in January 2004. This project has been financed through asynthetic lease agreement. Under this agreement, SER is reimbursed monthly for most project costs.Through December 31, 2002, SER had received $500 million under this facility. All amounts above$280 million require collateralization through purchases of U.S. Treasury obligations, which must atleast equal 103 percent of the amount drawn. That collateralization was $228 million at December 31,2002, and is included in “Investments” on the Consolidated Balance Sheets.
SEMPRA ENERGY 55.

Sempra Energy International
SEI’s Mexican subsidiaries Distribuidora de Gas Natural (DGN) de Mexicali, DGN de Chihuahua andDGN de La Laguna Durango built and operate natural gas distribution systems in Mexicali, Chihuahuaand the La Laguna-Durango zone in north-central Mexico, respectively. At December 31, 2002, SEIowned interests of 60, 95 and 100 percent in the projects, respectively. Through December 31, 2002,DGN de Mexicali, DGN de Chihuahua and DGN de La Laguna Durango have made capitalexpenditures of $23 million, $57 million and $32 million, respectively. Total capital expenditures forthese subsidiaries in 2002 were $15 million. On February 7, 2003, SEI completed its purchase of theremaining interests in DGN de Mexicali, DGN de Chihuahua, Transportadora de Gas Natural, asupplier of natural gas to the Presidente Juarez power plant in Rosarito, Baja California, and othersubsidiaries.
NOTE 3. INVESTMENTS IN UNCONSOLIDATED SUBSIDIARIES
Investments, other than housing partnerships, in which the company has an interest of twenty percentto fifty percent are accounted for under the equity method. The company has no investments where itsability to influence or control an investee differs from its ownership percentage. The company’s pro ratashares of the subsidiaries’ net assets are included under the caption “Investments” on theConsolidated Balance Sheets, and are adjusted for the company’s share of each investee’s earnings/losses, dividends and foreign currency translation effects. Earnings are recorded as equity earnings onthe Statements of Consolidated Income within the caption “Other income — net.” In accordance withEITF D-46, the company accounts for investments in housing partnerships made after May 18, 1995according to the American Institute of Certified Public Accountants’ Statement of Position 78-9“Accounting for Investments in Real Estate,” which generally requires the use of the equity methodunless the investor has virtually no influence over the partnership operating and financial policies.Investments in housing partnerships accounted for by the cost method are amortized over ten yearsbased on the expected residual value. The company’s investments in unconsolidated subsidiariesaccounted for by the equity and cost methods are summarized as follows:
Investments atDecember 31
(dollars in millions) 2002 2001
Equity method investments:Chilquinta Energia (including Luz del Sur) $ 504 $ 484Sodigas Pampeana and Sodigas Sur 17 140Elk Hills power project 172 133El Dorado Energy 73 57Sempra Energy Financial housing partnerships 206 228Sempra Energy Financial synthetic fuel partnerships 8 9Other — 4
Total 980 1,055
Cost method investments:Sempra Energy Financial housing partnerships 57 81Other 3 33
Total 60 114
Other:Mesquite Power Plant project (see Note 15)
Collateralized U.S. Treasury obligations 228 —Reimbursable project costs 45 —
Total 273 —
Total investments $1,313 $1,169
SEMPRA ENERGY 56.

For equity method investments, costs in excess of equity in net assets were $219 million and$233 million at December 31, 2002 and 2001, respectively. Through December 31, 2001, the excess ofthe investment over the related equity in net assets had been amortized over various periods, primarilyforty years (see Note 1). In accordance with SFAS 142, amortization has ceased in 2002. Costs inexcess of the underlying equity in net assets will continue to be reviewed for impairment in accordancewith Accounting Principles Board Opinion 18, “The Equity Method of Accounting for Investments inCommon Equity”. See additional discussion of SFAS 142 in “New Accounting Standards” in Note 1.Descriptive information concerning each of these subsidiaries follows.
Sempra Energy Resources
In December 2000, SER obtained approvals from the appropriate state agencies to construct the ElkHills Power Project (Elk Hills), a $395 million, 570-megawatt power plant near Bakersfield, California,which is anticipated to be completed by May 2003. Elk Hills is being developed in a joint venture withOccidental Energy Ventures Corporation (Occidental). Information concerning litigation with Occidentalis provided in Note 15.
In 2000, El Dorado Energy, a 50/50 partnership between SER and Reliant Energy Power Generation,completed construction of a $280 million, 440-megawatt merchant power plant near Las Vegas,Nevada.
In December 2000, SER obtained approval from the appropriate state agencies to construct theMesquite Power Plant. Located near Phoenix, Arizona, Mesquite Power is a $690 million, 1,250-megawatt project which will provide electricity to wholesale energy markets in the Southwest region.Ground was broken in September 2001. Commercial operations at 50-percent capacity are expected tocommence in June 2003 and project completion is anticipated in January 2004. The project is beingfinanced primarily via the synthetic lease agreement described in Note 15. Construction expendituresas of December 31, 2002 were $558 million. Financing under the synthetic lease in excess of$280 million requires collateralization through the purchase of U.S. Treasury obligations, which must atleast equal 103 percent of the amount drawn. During 2002, the company purchased $228 million ofU.S. Treasury obligations as collateral, which is included in “Investments” on the Consolidated BalanceSheets.
Sempra Energy International
SEI and PSEG Global (PSEG), an unaffiliated company, each own a 50-percent interest in ChilquintaEnergia S.A. (Energia), a Chilean electric utility, and 44 percent of the outstanding shares of Luz delSur S.A.A. (Luz), a Peruvian electric utility.
In October 2000, SEI increased its existing investment in two Argentine natural gas utility holdingcompanies (Sodigas Pampeana S.A. and Sodigas Sur S.A.) from 21.5 percent to 43 percent. Shortlyafter December 31, 2001, the Argentine peso, the functional currency of the companies’ operations,began to float freely in the foreign exchange market. As a result of the decline in the value of theArgentine peso, SEI has reduced the carrying value of its investment by reducing shareholders’ equityby $223 million, which is included in accumulated other comprehensive income (loss). These non-cashadjustments, which began at the end of 2001 and continued into the early part of 2002, did not affectnet income, but did reduce comprehensive income and did increase accumulated other comprehensiveincome (loss).
The related Argentine economic decline and government responses (including Argentina’s unilateral,retroactive abrogation of utility agreements early in 2002) are continuing to adversely affect theoperations of these Argentine utilities. On September 5, 2002, SEI filed for international arbitrationunder the 1994 Bilateral Investment Treaty between the United States and Argentina for recovery of
SEMPRA ENERGY 57.

the diminution of the value of its investments resulting from the government actions. SEI had itsRequest for Arbitration registered on December 6, 2002, and expects the International Center forSettlement of Investment Disputes to recognize the filing and set the matter for arbitration, butresolution is expected to take more than a year. Sempra Energy also has political-risk insurance thatcould recover a portion of the diminution.
SEI and the majority owner of the Argentine companies have an agreement whereby, under certain,specified circumstances, SEI could compel the majority owner to purchase SEI’s interest or themajority owner could compel SEI to sell its interest to the majority owner.
Sempra Energy Financial (SEF)
SEF invests as a limited partner in affordable-housing properties. SEF’s portfolio includes 1,300properties throughout the United States, including Puerto Rico and the Virgin Islands. Theseinvestments are accounted for in accordance with EITF Issue 94-1 “Accounting for Tax BenefitsResulting from Investments in Affordable Housing Projects.” These investments are expected toprovide income tax benefits (primarily from income tax credits) over 10-year periods. SEF also has aninvestment in a limited partnership which produces synthetic fuel from coal. Whether SEF will invest inadditional properties will depend on Sempra Energy’s income tax position.
NOTE 4. SHORT-TERM BORROWINGS
At December 31, 2002, the company had available $2.25 billion in unused, committed lines of credit toprovide liquidity and support commercial paper. As of December 31, 2002, $600 million of the lineswas supporting commercial paper and variable-rate debt. Borrowings under these lines are subject tocompliance with certain covenants. Under the most restrictive of these covenants Sempra Energy andits subsidiaries could have issued in excess of $3 billion of additional debt at December 31, 2002.
Committed Lines of Credit
At December 31, 2002, Global had a $950 million syndicated revolving line of credit guaranteed bySempra Energy. The revolving credit commitment expires in September 2003, at which timeoutstanding borrowings may be converted to a one-year term loan. The agreement requires SempraEnergy to maintain a debt-to-total capitalization ratio (as defined in the agreement) of not to exceed 65percent.
Borrowings under the agreement bear interest at rates varying with market rates and Sempra Energy’scredit rating. Global’s line of credit was unused at December 31, 2002, and is available to supportcommercial paper and variable-rate long-term debt. Global had $422 million and $705 million ofcommercial paper, guaranteed by Sempra Energy, outstanding at December 31, 2002 and 2001,respectively.
At December 31, 2002, the California Utilities had a combined revolving line of credit, under whicheach utility individually could borrow up to $300 million, subject to a combined borrowing limit for bothutilities of $500 million. Borrowings under the agreement, which are available for general corporatepurposes including support for commercial paper and variable-rate long-term debt, bear interest atrates varying with market rates and the individual borrowing utility’s credit rating. This revolving creditcommitment expires in May 2003, at which time the outstanding borrowings may be converted into
SEMPRA ENERGY 58.

a one-year term loan subject to any requisite regulatory approvals related to long-term debt. Thisagreement requires each utility to maintain a debt-to-total capitalization ratio (as defined in theagreement) of not to exceed 60 percent. The rights, obligations and covenants of each utility under theagreement are individual rather than joint with those of the other utility, and a default by one utilitywould not constitute a default by the other. These lines of credit were unused at December 31, 2002.At December 31, 2002, the California Utilities had no commercial paper outstanding.
At December 31, 2002, SER had a syndicated $400 million, three-year revolving line of credit,guaranteed by Sempra Energy, primarily to finance power plant and natural gas pipeline constructionprojects. The agreement requires Sempra Energy to maintain a debt-to-total capitalization ratio (asdefined in the agreement) of not to exceed 65 percent. The agreement expires in August 2004 andborrowings bear interest at rates varying with market rates and Sempra Energy’s credit rating. AtDecember 31, 2002, SER’s outstanding borrowing under the line of credit, classified as long-term, was$100 million. See Note 5 for additional information on SER’s borrowings. There were no loansoutstanding under the line of credit at December 31, 2001.
At December 31, 2002, PE had a $500 million two-year revolving line of credit, guaranteed by SempraEnergy, for the purpose of providing loans to Global. The revolving credit commitment expires in April2003, at which time the outstanding borrowings may be converted into a two-year term loan.Borrowings would be subject to mandatory repayment prior to the maturity date should PE’s creditrating cease to be at least BBB- by Standard & Poor’s (S&P) or SoCalGas’ unsecured long-term creditratings cease to be at least BBB by S&P and Baa2 by Moody’s Investor Services, Inc. (Moody’s),should Sempra Energy’s or SoCalGas’ debt-to-total capitalization ratio (as defined in the agreement)exceed 65 percent, or should there be a change in law materially and adversely affecting the ability ofSoCalGas to pay dividends or make distributions to PE. Borrowings bear interest at rates varying withmarket rates and the amount of outstanding borrowings. PE’s line of credit was unused atDecember 31, 2002 and December 31, 2001.
Uncommitted Lines of Credit
At December 31, 2002, SET had $690 million in various uncommitted lines of credit that areguaranteed by Sempra Energy and bear interest at rates varying with market rates and SempraEnergy’s credit rating. At December 31, 2002 and 2001, SET had $115 million and $120 million,respectively, in short-term borrowings, and $345 million and $167 million, respectively, of letters ofcredit outstanding against these lines.
The company’s weighted average interest rate for short-term borrowings outstanding was 2.02% and2.18%, at December 31, 2002 and 2001, respectively.
SEMPRA ENERGY 59.

NOTE 5. LONG-TERM DEBT
December 31,
(Dollars in millions) 2002 2001
First-mortgage bonds5.75% November 15, 2003 $ 100 $ 1004.8% October 1, 2012 250 —6.8% June 1, 2015 14 145.9% June 1, 2018 68 685.9% to 6.4% September 1, 2018 176 1766.1% September 1, 2019 35 35Variable rates (1.34% to 1.35% at December 31, 2002) September 1, 2020 58 585.85% June 1, 2021 60 607.375% March 1, 2023 100 1007.5% June 15, 2023 125 1256.875% November 1, 2025 175 1756.4% and 7% December 1, 2027 225 2258.5% April 1, 2022 — 107.625% June 15, 2002 — 286.875% August 15, 2002 — 100
Total 1,386 1,274
Other long-term debt5.60% Equity units May 17, 2007 600 —Notes payable at variable rates after a fixed-to-floating rate swap (2.69% to
2.73% at December 31, 2002) July 1, 2004 500 5007.95% Notes March 1, 2010 500 500Rate-reduction bonds, 6.19% to 6.37% annually through 2007 329 3956.95% Notes December 1, 2005 300 300Debt incurred to acquire limited partnerships, secured by real estate, at
7.11% to 9.35% annually through 2009 145 1875.9% June 1, 2014 130 130SER line of credit at variable rates (3.073% at December 31, 2002)
August 21, 2004 100 —Employee Stock Ownership Plan
Bonds at 7.375% November 1, 2014 82 82Bonds at variable rates (1.92% at December 31, 2002) November 2014 19 46
5.67% January 15, 2003 75 75Variable rates (2.00% at December 31, 2002) December 1, 2021 60 60Variable rates (1.75% at December 31, 2002) July 1, 2021 39 396.75% March 1, 2023 25 256.375% May 14, 2006 8 8Other variable-rate debt 18 27Capitalized leases 10 14Market value adjustments for interest rate swaps — net 42 22
Total 4,368 3,684
Less:Current portion of long-term debt 281 242Unamortized discount on long-term debt 4 6
285 248
Total $4,083 $3,436
SEMPRA ENERGY 60.

Excluding capital leases, which are described in Note 15, and market value adjustments for interest-rate swaps, maturities of long-term debt are $278 million in 2003, $745 million in 2004, $397 million in2005, $100 million in 2006, $683 million in 2007 and $2.2 billion thereafter. Holders of variable-ratebonds may require the issuer to repurchase them prior to scheduled maturity. However, sincerepurchased bonds would be remarketed and funds for repurchase are provided by revolving lines ofcredit (which are generally renewed upon expiration and which are described in Note 4), it is assumedthe bonds will be held to maturity for purposes of determining the maturities listed above. Interest rateson the $300 million and $500 million of notes maturing in 2005 and 2010, respectively, can vary withthe company’s credit ratings.
First-mortgage Bonds
The first-mortgage bonds were issued by the California Utilities and are secured by a lien on theirrespective utility plant. The California Utilities may issue additional first-mortgage bonds uponcompliance with the provisions of their bond indentures, which require, among other things, thesatisfaction of pro forma earnings-coverage tests on first-mortgage bond interest and the availability ofsufficient mortgaged property to support the additional bonds. The most restrictive of these tests (theproperty test) would permit the issuance, subject to CPUC authorization, of an additional $2.7 billion offirst-mortgage bonds at December 31, 2002.
During the first quarter of 2001, SDG&E remarketed $150 million of variable-rate first-mortgage bondsfor a five-year term at a fixed rate of 7%. At SDG&E’s option, the bonds may be remarketed at a fixedor floating rate at December 1, 2005, the expiration of the fixed term. In November 2001, SoCalGascalled its $150 million 8.75% first-mortgage bonds at a premium of 3.59 percent. On December 11,2001, SoCalGas entered into an interest-rate swap which effectively exchanged the fixed rate on its$175 million 6.875% first-mortgage bonds for a floating rate. On September 30, 2002, SoCalGasterminated the swap, receiving cash proceeds of $10 million, comprised of $4 million in accruedinterest and a $6 million amortizable gain. Additional information is provided under “Interest-RateSwaps” below. In June and July 2002, SDG&E paid off its $28 million 7.625% first-mortgage bonds and$10 million 8.5% first-mortgage bonds, respectively. In August 2002, SoCalGas paid off its $100 million6.875% first-mortgage bonds.
In October 2002, SoCalGas publicly offered and sold $250 million of 4.8% first-mortgage bonds,maturing on October 1, 2012. The bonds are not subject to a sinking fund and are not redeemable priorto maturity except through a make-whole mechanism. Proceeds from the bond sale have become partof the company’s general funds to replenish amounts previously expended to refund and retireindebtedness, and for working capital and other general corporate purposes. These bonds wereassigned ratings of A+ by the S&P rating agency, A1 by Moody’s and AA by Fitch, Inc.
Callable Bonds
At the company’s option, certain bonds may be called at a premium, including $157 million of variable-rate bonds that are callable at various dates in 2003. Of the company’s remaining callable bonds, $860million are callable in 2003, $25 million in 2004, $105 million in 2005 and $8 million in 2006.
Rate-Reduction Bonds
In December 1997, $658 million of rate-reduction bonds were issued on behalf of SDG&E at anaverage interest rate of 6.26 percent. These bonds were issued to facilitate the 10% rate reductionmandated by California’s electric-restructuring law, which is described in Note 13. These bonds arebeing repaid over ten years by SDG&E’s residential and small-commercial customers via a
SEMPRA ENERGY 61.

specified charge on their electricity bills. These bonds are secured by the revenue streams collectedfrom customers and are not secured by, or payable from, utility assets.
The sizes of the rate-reduction bond issuances were set so as to make the investor owned utilities(IOUs) neutral as to the 10% rate reduction, and were based on a four-year period to recover strandedcosts. Because SDG&E recovered its stranded costs in only 18 months (due to the greater-than-anticipated plant-sale proceeds), the bond sale proceeds were greater than needed. Accordingly,during the third quarter of 2000, SDG&E returned to its customers $388 million of surplus bondproceeds in accordance with a June 8, 2000 CPUC decision. The bonds and their repayment scheduleare not affected by this refund.
Equity Units
In April and May of 2002, the company publicly offered and issued $600 million of Equity Units. Eachunit consists of $25 principal amount of the company’s 5.60% senior notes due May 17, 2007 and acontract to purchase for $25 on May 17, 2005, between .8190 and .9992 of a share of the company’scommon stock (to be determined by the then-prevailing market prices). The company used the netproceeds of the offering to repay a portion of its short-term debt, including debt used to finance thecapital expenditure program for Global.
Unsecured Long-term Debt
In February 2001, SDG&E remarketed $25 million of variable-rate unsecured bonds as 6.75 percentfixed-rate debt for a three-year term. At SDG&E’s option, the bonds may be remarketed at a fixed orfloating rate at February 29, 2004, the expiration of the fixed term. Various long-term obligationstotaling $355 million are unsecured at December 31, 2002. In October 2001, SoCalGas repaid $120million of 6.38 percent medium-term notes upon maturity. In June 2001, the company issued $500million of three-year notes due July 1, 2004 at an interest rate of 6.8 percent. Sempra Energy has afixed-to-floating rate swap on these notes. (See discussion under “Interest-Rate Swaps” below.)
In February 2000, the company issued $500 million of long-term 7.95% notes due in 2010 to partiallyfinance the self-tender offer described in Note 12. In December 2000, the company issued anadditional $300 million in long-term notes due in 2005 in order to reduce short-term debt. The notesbear interest at 6.95 percent. In July 2000, SoCalGas repaid $30 million of 8.75% medium-term notesupon maturity.
In October 2002 SER borrowed $100 million on its $400 million line of credit. This loan is due August2004 and bears a variable interest rate (3.073 percent at December 31, 2002).
On January 15, 2003, $70 million of SoCalGas’ 5.67% $75 million medium term notes were put back tothe company. The remaining $5 million matures on January 18, 2028.
In January 2003, the company issued $400 million of long-term 6% notes due February 2013. Thebonds are not subject to a sinking fund and are not redeemable prior to maturity except through amake-whole mechanism. Proceeds were used to pay down commercial paper. These bonds wereassigned ratings of A- by the S&P rating agency, Baa1 by Moody’s and A by Fitch, Inc.
Debt of Employee Stock Ownership Plan (ESOP) and Trust (Trust)
The Trust has covered substantially all of SoCalGas’ employees and, effective January 1, 2000,employees of Sempra Energy and some of its unregulated affiliates. The Trust is used to fund part ofthe retirement savings plan. The 15-year notes are repriced weekly and subject to repurchase by the
SEMPRA ENERGY 62.
company at the holder’s option, depending on market demand. In June 2001, utilizing the term optionprovisions of the notes, $82 million of the notes were remarketed at a fixed rate of 7.375 percent forthree years. The variable interest rate and weekly repricing resume in May 2004. In September 2001and 2002, ESOP debt was reduced by $2.5 million and $0.9 million, respectively, when 40,000 sharesand 17,000 shares, respectively, of company common stock were released from the Trust in order tofund the employer contribution to the company savings plan. Additional information on the companysavings plan is included in Note 8. Interest on ESOP debt amounted to $7 million in 2002, $6 million in2001 and $9 million in 2000. Dividends used for debt service amounted to $3 million each in 2002,2001 and 2000.
Interest-Rate Swaps
The company periodically enters into interest-rate swap agreements to moderate its exposure tointerest-rate changes and to lower its overall cost of borrowing. At December 31, 2002, Sempra Energyhas a fixed-to-floating-rate swap agreement on $500 million of underlying debt which matures in 2004and effectively causes the interest rate on the debt to vary at a rate of LIBOR plus 1.329%. OnDecember 11, 2001, SoCalGas executed a cancelable-call interest-rate swap, exchanging its fixed-rateobligation of 6.875% on its $175 million first-mortgage bonds for a floating rate of LIBOR plus 4 basispoints. On September 30, 2002, SoCalGas terminated the swap, receiving cash proceeds of$10 million, comprised of $4 million in accrued interest and a $6 million amortizable gain. The companybelieves the remaining swap is fully effective in its purpose of converting the underlying debt’s fixedrate to a floating rate and meets the criteria for accounting under the short-cut method defined inSFAS 133 for fair value hedges of debt instruments. Accordingly, market value adjustments to long-term debt of $20 million and $22 million were recorded at December 31, 2002 and 2001, respectively,to reflect, without affecting net income or other comprehensive income, the favorable/unfavorableeconomic consequences (as measured at December 31, 2002 and 2001) of having entered into theswap transactions. During 2002 and 2001, SDG&E had an interest-rate swap agreement that maturedin 2002 that effectively fixed the interest rate on $45 million of variable-rate underlying debt at5.4 percent. This floating-to-fixed-rate swap did not qualify for hedge accounting and, therefore, thegains and losses associated with the change in fair value are recorded in the Statements ofConsolidated Income. The effect on income was a $1 million gain in 2002 and a $1 million loss in 2001.See additional discussion of interest-rate swaps in Note 10.
Foreign-Currency Hedges
The company’s primary objective with respect to currency risk is to reduce net income volatility thatwould otherwise occur due to exchange-rate fluctuations.
Sempra Energy’s net investment in its Latin American operating companies and the resulting cashflows are partially protected against normal exchange-rate fluctuations by rate-setting mechanismswhich are intended to compensate for local inflation and currency exchange-rate fluctuations. Inaddition to establishing such tariff-based protections, the company hedges material cross-currencytransactions and net income exposure through various means, including financial instruments andshort-term investments.
Because the company does not hedge its net investment in foreign countries, it is susceptible tovolatility in other comprehensive income, as occurred in the years ended December 31, 2002 and 2001as a result of Argentina’s decoupling its peso from the U.S. dollar as discussed in Note 3.
See additional discussion in Note 10.
SEMPRA ENERGY 63.

Loans Due to Affiliates
In March 2001, SEI refinanced $160 million of long-term notes through its unconsolidated affiliateChilquinta Energia Finance, LLC. At both December 31, 2002 and 2001, long-term notes payable toaffiliates include $60 million at 6.47 percent due April 1, 2008 and $100 million at 6.62% due April 1,2011. The loans are secured by SEI’s investments in Energia and Luz.
Financial Covenants
The California Utilities’ first-mortgage bond indentures require the satisfaction of certain bond interestcoverage ratios and the availability of sufficient mortgaged property to issue additional first-mortgagebonds, but do not restrict other indebtedness. Note 4 discusses the financial covenants applicable toshort-term debt.
NOTE 6. FACILITIES UNDER JOINT OWNERSHIP
SONGS and the Southwest Powerlink transmission line are owned jointly with other utilities. Thecompany’s interests at December 31, 2002, are as follows:
Project (Dollars in millions) SONGSSouthwestPowerlink
Percentage ownership 20% 88%Utility plant in service $76 $222Accumulated depreciation and amortization $53 $134Construction work in progress $ 5 $ 12
The company and the other owners each hold its interest as an undivided interest as tenants incommon. Each owner is responsible for financing its share of each project and participates in decisionsconcerning operations and capital expenditures.
The company’s share of operating expenses is included in the Statements of Consolidated Income.Participants in each project must provide their own financing. The amounts specified above for SONGSinclude nuclear production, transmission and other facilities. Certain substation equipment at SONGSis wholly owned by the company.
SONGS Decommissioning
Objectives, work scope and procedures for the future dismantling and decontamination of the SONGSunits must meet the requirements of the Nuclear Regulatory Commission, the EnvironmentalProtection Agency, the CPUC and other regulatory bodies.
The company’s share of decommissioning costs for the SONGS units is estimated to be $309 million in2002 dollars, based on a 2001 cost study completed and filed with the CPUC in 2002. At this time, thecost study and resulting contributions are expected to be finalized and approved or disapproved by theCPUC in April of 2003. Cost studies are updated every three years and approved by the CPUC. Thenext such update is expected to occur in 2005. Rate recovery of decommissioning costs is alloweduntil the time that the costs are fully recovered, and is subject to adjustment every three years basedon costs allowed by regulators. The amount accrued each year is currently being collected in rates.Currently, collections are authorized to continue until 2013, but may be extended upon request to theCPUC until 2022. The requested amount is considered sufficient to cover the company’s share offuture decommissioning costs. Payments to the nuclear decommissioning trusts (described belowunder “Nuclear Decommissioning Trusts”) are expected to continue until sufficient funds have beencollected to fully decommission SONGS, which is not expected to begin before 2022.
SEMPRA ENERGY 64.

Unit 1 was permanently shut down in 1992, and physical decommissioning began in January 2000.Several structures, foundations and large components have been dismantled and removed.Preparations have been made for the remaining major work to be performed in 2003 and beyond. Thatwork will include dismantling, removal and disposal of all remaining Unit 1 equipment and facilities(both nuclear and non-nuclear components), decontamination of the site and completion of an on-sitestorage facility for Unit 1 spent fuel. These activities are expected to be completed by 2008.
The amounts collected in rates are invested in externally managed trust funds (described below under“Nuclear Decommissioning Trusts”). The securities held by the trust are considered available for sale andthe trust is shown on the Consolidated Balance Sheets at market value. These values reflect unrealizedgains of $95 million and $122 million at December 31, 2002, and 2001, respectively, with the offsettingcredit recorded to accumulated depreciation and amortization on the Consolidated Balance Sheets.
See discussion regarding the impact of SFAS 143 in Note 1.
Nuclear Decommissioning Trusts
SDG&E has a Nonqualified Nuclear Decommissioning Trust and a Qualified Nuclear DecommissioningTrust. CPUC guidelines prohibit investments in derivatives and securities of Sempra Energy or relatedcompanies. They also establish maximum amounts for investments in equity securities (50 percent ofthe qualified trust and 60 percent of the nonqualified trust), international equity securities (20 percent)and securities of electric utilities having ownership interests in nuclear power plants (10 percent). Notless than 50 percent of the equity portion of the Trusts shall be invested passively.
At December 31, 2002 and 2001, trust assets were allocated as follows (dollars in millions):
Qualified TrustNonqualified
Trust
2002 2001 2002 2001
Domestic equity $143 $144 $36 $48Foreign equity 69 76 — —
Total equity 212 220 36 48Total fixed income 220 225 26 33
Total $432 $445 $62 $81
Decommissioning cost studies are conducted every three years to determine the appropriate level ofcontributions to be collected in utility-customer rates to ensure adequate funding at the decommissioningdate. Customer contribution amounts are determined by estimates of after-tax investment returns,decommissioning costs and decommissioning cost escalation rates. Lower actual investment returns orhigher actual decommissioning costs would result in an increase in customer contributions.
Additional information regarding SONGS is included in Notes 13 and 15.
SEMPRA ENERGY 65.

NOTE 7. INCOME TAXES
The reconciliation of the statutory federal income tax rate to the effective income tax rate is as follows:
For the years ended December 31 2002 2001 2000
Statutory federal income tax rate 35.0% 35.0% 35.0%Depreciation 5.2 5.9 6.7State income taxes — net of federal
income tax benefit 7.0 6.4 6.6Tax credits (18.5) (13.7) (13.0)Income from unconsolidated foreign
subsidiaries (2.0) (3.0) (1.8)Settlement of Internal Revenue Service audit (3.6) — —Other — net (2.9) (1.5) 5.1
Effective income tax rate 20.2% 29.1% 38.6%
The components of income tax expense are as follows:
(Dollars in millions) 2002 2001 2000
Current:Federal $ 195 $ 36 $ (8)State 30 60 (5)Foreign 13 11 25
Total 238 107 12
Deferred:Federal (113) 104 207State 31 1 57Foreign (5) 7 (1)
Total (87) 112 263
Deferred investment tax credits (5) (6) (5)
Total income tax expense $ 146 $213 $270
SEMPRA ENERGY 66.

Accumulated deferred income taxes at December 31 consist of the following:
(Dollars in millions) 2002 2001
Deferred tax liabilities:Differences in financial and tax bases of utility plant $ 883 $ 672Balancing accounts and other regulatory assets 305 489Partnership income 45 37Other 312 279
Total deferred tax liabilities 1,545 1,477
Deferred tax assets:Investment tax credits 62 65General business tax credit carryforward 148 24Net operating losses of foreign entities 89 46Postretirement benefits 32 36Other deferred liabilities 157 174Restructuring costs 40 40Other 247 187
Total deferred tax assets 775 572
Net deferred income tax liability 770 905
Valuation allowance 10 12
Net deferred income tax liability $ 780 $ 917
The net deferred income tax liability is recorded on the Consolidated Balance Sheets at December 31as follows:
(Dollars in millions) 2002 2001
Current (asset) liability $ (20) $ 70Noncurrent liability 800 847
Total $ 780 $ 917
In connection with its affordable-housing investments, the company has $148 million of unused generalbusiness tax credits dating back to 1999. The cumulative credit carryforwards will expire between theyears 2019 and 2022. The company fully expects to utilize the credits in future years. In addition, thecompany has $19 million of alternative minimum tax credits with no expiration date. All of these creditshave been included in the company’s calculation of income tax expense.
Foreign subsidiaries have $275 million in unused net operating losses available to reduce futureincome taxes, primarily in Mexico, Canada and the United Kingdom. Utilization of these losses beganto expire in 2002. Financial statement benefits have been recorded on all but $32 million of theselosses, primarily by offsetting them against deferred tax liabilities with the same expiration pattern andcountry of jurisdiction.
The company has not provided for U.S. income taxes on foreign subsidiaries’ undistributed earnings($304 million at December 31, 2002), which are expected to be reinvested indefinitely outside the U.S.It is not possible to predict the amount of U.S. income taxes that might be payable if these earningswere eventually repatriated.
SEMPRA ENERGY 67.

NOTE 8. EMPLOYEE BENEFIT PLANS
The information presented below covers the plans of the company and its principal subsidiaries.
Pension and Other Postretirement Benefits
The company sponsors several qualified and nonqualified pension plans and other postretirementbenefit plans for its employees.
During 2002, the company had amendments reflecting retiree cost of living adjustments which resultedin an increase in the pension plan benefit obligation of $51 million. Amendments to otherpostretirement benefit plans related to the transfer of employees to SDG&E and changes to theirspecific benefits which resulted in a decrease in the benefits obligation of $7 million. The amortizationof these changes will affect pension expense in future years.
During 2001, SDG&E participated in a voluntary separation program. As a result, the companyrecorded a $13 million special termination benefit, a $1 million curtailment cost and a $19 millionsettlement gain.
During 2000, Sempra Energy and most of its subsidiaries participated in another voluntary separationprogram. As a result, the company recorded a $56 million special termination benefit, a $2 millioncurtailment credit and a $26 million settlement gain.
SEMPRA ENERGY 68.

The following tables provide a reconciliation of the changes in the plans’ projected benefit obligationsand the fair value of assets over the two years, and a statement of the funded status as of each yearend:
Pension Benefits
OtherPostretirement
Benefits
(Dollars in millions) 2002 2001 2002 2001
WEIGHTED-AVERAGE ASSUMPTIONS AS OFDECEMBER 31:
Discount rate 6.50% 7.25% 6.50% 7.25%Expected return on plan assets 8.00% 8.00% 7.80% 7.85%Rate of compensation increase 4.50% 5.00% 4.50% 5.00%Cost trend of covered health-care charges — — 7.00%(1) 7.25%(1)
CHANGE IN PROJECTED BENEFIT OBLIGATION:Net obligation at January 1 $2,010 $2,027 $ 590 $ 551Service cost 57 49 13 11Interest cost 149 141 42 41Plan amendments 51 — (7) —Actuarial (gain) loss 197 (27) 191 13Curtailments — (7) — —Settlements — 1 — —Special termination benefits — 13 — —Other 13 — — —Benefits paid (187) (187) (32) (26)
Net obligation at December 31 2,290 2,010 797 590
CHANGE IN PLAN ASSETS:Fair value of plan assets at January 1 2,449 2,910 469 515Actual return on plan assets (281) (277) (50) (37)Employer contributions 3 3 22 17Benefits paid (187) (187) (32) (26)
Fair value of plan assets at December 31 1,984 2,449 409 469
Plan assets net of benefit obligation at December 31 (306) 439 (388) (121)Unrecognized net actuarial (gain) loss 283 (426) 266 (14)Unrecognized prior service cost 93 49 (14) (10)Unrecognized net transition obligation 1 2 — —
Net recorded asset (liability) at December 31 $ 71 $ 64 $(136) $(145)
(1) Decreasing to ultimate trend of 6.50% in 2004.
SEMPRA ENERGY 69.

The following table provides the amounts recognized on the Consolidated Balance Sheets (undernoncurrent sundry assets, deferred credits and other liabilities and postretirement benefits other thanpensions) at December 31:
Other
Pension BenefitsPostretirement
Benefits
(Dollars in millions) 2002 2001 2002 2001
Prepaid benefit cost $ 203 $146 $ — —Accrued benefit cost (132) (82) (136) $(145)Additional minimum liability (93) (18) — —Intangible asset 12 3 — —Accumulated other comprehensive income, pretax 81 15 — —
Net recorded asset (liability) $ 71 $ 64 $(136) $(145)
The following table provides the components of net periodic benefit cost (income) for the plans:
(Dollars in millions) Pension BenefitsOther
Postretirement Benefits
Years ended December 31 2002 2001 2000 2002 2001 2000
Service cost $ 57 $ 49 $ 41 $ 13 $ 11 $ 11Interest cost 149 141 153 42 41 37Expected return on assets (204) (219) (239) (39) (39) (37)Amortization of:
Transition obligation 1 1 1 9 10 11Prior service cost 7 6 6 (1) (1) (2)Actuarial gain (18) (39) (55) — (3) (8)
Special termination benefit — 13 54 — — 2Curtailment cost (credit) — 1 (2) — — —Settlement credit — (19) (26) — — —Regulatory adjustment 32 51 18 25 30 26
Total net periodic benefit cost (income) $ 24 $ (15) $ (49) $ 49 $ 49 $ 40
Assumed health-care cost trend rates have a significant effect on the amounts reported for the health-care plans. A one-percent change in assumed health-care cost trend rates would have the followingeffects:
(Dollars in millions)1%
Increase1%
Decrease
Effect on total of service and interest cost components of net periodicpostretirement health-care benefit cost $ 9 $ (7)
Effect on the health-care component of the accumulated other postretirementbenefit obligation $119 $(96)
Except for one plan, all funded pension plans had plan assets in excess of accumulated benefitobligations. For that one plan, the projected benefit obligation and accumulated benefit obligation were$613 million and $575 million, respectively, as of December 31, 2002, and $448 million and $442million, respectively, as of December 31, 2001.
The company maintains dedicated assets in support of its Supplemental Executive Retirement Plan.
Other postretirement benefits include retiree life insurance, medical benefits for retirees and theirspouses, and Medicare Part B reimbursement for certain retirees.
SEMPRA ENERGY 70.

Savings Plans
The company offers savings plans, administered by plan trustees, to all eligible employees. Eligibility toparticipate in the plans is immediate for salary deferrals. Employees may contribute, subject to planprovisions, from one percent to 25 percent of their regular earnings. After one year of completedservice, the company begins to make matching contributions. Employer contribution amounts andmethodology vary by plan, but generally the contributions are equal to 50 percent of the first 6 percentof eligible base salary contributed by employees and, if certain company goals are met, an additionalamount related to incentive compensation payments. Employer contributions are invested in companystock and must remain so invested until termination of employment. At the direction of the employees,the employees’ contributions are invested in company stock, mutual funds, institutional trusts orguaranteed investment contracts. The plans of certain non-wholly owned subsidiaries may not containSempra Energy stock. In this case, the employer matching contributions are invested to mirror theemployee-directed contributions. Employer contributions for the Sempra Energy and SoCalGas plansare partially funded by the employee stock ownership plan referred to below. Company contributions tothe savings plans were $20 million in 2002, $17 million in 2001 and $15 million in 2000. The marketvalue of company stock held by the savings plan was $533 million and $530 million at December 31,2002 and 2001, respectively.
Employee Stock Ownership Plan
All contributions to the Trust are made by the company; there are no contributions made by theparticipants.
As the company makes contributions to the ESOP, the ESOP debt service is paid and shares arereleased in proportion to the total expected debt service. Compensation expense is charged and equityis credited for the market value of the shares released. Income tax deductions are based on the cost ofthe shares. Dividends on unallocated shares are used to pay debt service and are applied against theliability. The Trust held 2.6 million shares and 2.7 million shares of Sempra Energy common stock, withfair values of $61.0 million and $65.9 million, at December 31, 2002 and 2001, respectively.
NOTE 9. STOCK-BASED COMPENSATION
Sempra Energy has stock-based compensation plans intended to align employee and shareholderobjectives related to the long-term growth of the company. The plans permit a wide variety of stock-based awards, including nonqualified stock options, incentive stock options, restricted stock, stockappreciation rights, performance awards, stock payments and dividend equivalents.
In 2002 and 2001, 544,100 shares and 777,500 shares of restricted company stock, respectively, wereawarded to key employees. The corresponding weighted average fair values of the shares grantedwere $24.77 and $23.37, respectively. There was no restricted company stock awarded in 2000.Subject to earlier forfeitures upon termination of employment, each award is scheduled to vest at theend of seven years, but is also subject to earlier vesting over a four-year period upon satisfaction ofobjective performance-based goals. Holders of restricted stock have full voting and dividend rights.Compensation expense for the issuance of restricted stock was approximately $7 million in 2002, $5million in 2001 and $1 million in 2000.
In 2002, 2001 and 2000, Sempra Energy granted to officers and key employees 3,444,300, 2,934,800and 4,339,000 stock options, respectively. The option price is equal to the market price of commonstock at the date of grant. The options vest over a four-year period and do not include dividendequivalents. The stock options expire 10 years from the date of grant, subject to earlier expiration upontermination of employment. Compensation expense (or reduction thereof) for stock option grants (all
SEMPRA ENERGY 71.

associated with outstanding options with dividend equivalents, all of which were issued before 2000)and similar awards was ($2 million), $7 million and $14 million in 2002, 2001 and 2000, respectively.
As of December 31, 2002, 12,250,231 shares were authorized and available for future grants ofrestricted stock and/or stock options. In addition, on January 1 of each year, additional sharesamounting to 1.5 percent of the outstanding shares of Sempra Energy common stock becomeavailable for grant.
The plans permit the granting of dividend equivalents, which provide grantees the opportunity toreceive some or all of the cash dividends that would have been paid on the shares since the grantdate. All grants that have included dividend equivalents have made the dividend equivalentsdependent on the attainment of certain performance goals. For grants prior to July 1, 1998, payment ofthe dividend equivalents is also contingent upon an in-the-money exercise of the related options.
In 1995, SFAS 123, “Accounting for Stock-Based Compensation,” was issued. It encourages a fair-value-based method of accounting for stock-based compensation. As permitted by SFAS 123, thecompany adopted only its disclosure requirements and continues to account for stock-basedcompensation in accordance with the provisions of Accounting Principles Board Opinion 25,“Accounting for Stock Issued to Employees.” See additional discussion of SFAS 148, the amendmentto SFAS 123, in Note 1.
STOCK OPTION ACTIVITY
SharesUnderOption
WeightedAverageExercise
Price
OptionsExercisable
at December 31
OPTIONS WITH DIVIDEND EQUIVALENTSDecember 31, 1999 4,693,197 $21.96 1,844,079
Exercised (399,875) 18.91Cancelled (264,749) 23.39
December 31, 2000 4,028,573 22.17 2,462,574Exercised (588,315) 20.92Cancelled (119,911) 22.46
December 31, 2001 3,320,347 22.38 2,508,328Exercised (172,358) 19.87Cancelled (68,124) 24.03
December 31, 2002 3,079,865 $22.48 2,777,590
On January 1, 2003, approximately two-thirds of the shares under options and the options exercisableceased to have dividend equivalents, due to expiration or payment of the dividend equivalents.
SEMPRA ENERGY 72.

SharesUnderOption
WeightedAverageExercise
Price
OptionsExercisable
at December 31
OPTIONS WITHOUT DIVIDEND EQUIVALENTSDecember 31, 1999 3,953,005 $22.67 1,019,056
Granted 4,339,000 19.03Exercised (329,313) 19.10Cancelled (397,271) 25.07
December 31, 2000 7,565,421 20.61 1,659,244Granted 2,934,800 22.50Exercised (421,633) 18.79Cancelled (204,134) 23.59
December 31, 2001 9,874,454 21.19 3,143,319Granted 3,444,300 24.71Exercised (223,430) 17.70Cancelled (84,137) 21.70
December 31, 2002 13,011,187 $22.18 5,287,437
Additional information on options outstanding at December 31, 2002, is as follows:
Range ofExercise Prices
Number ofShares
WeightedAverage
RemainingLife
WeightedAverageExercise
Price
Outstanding Options$14.29-$16.12 149,576 2.10 $15.99$16.87-$22.65 9,930,929 6.98 $20.48$23.45-$27.64 6,010,547 7.58 $25.26
16,091,052 7.16 $22.22
Exercisable Options$14.29-$16.12 149,576 $15.99$16.87-$22.65 5,287,704 $20.20$23.45-$27.64 2,627,747 $25.93
8,065,027 $21.99
The grant-date market value of each option grant (including dividend equivalents where applicable)was estimated using the modified Black-Scholes option-pricing model. Weighted average grant-datemarket values for options granted in 2002, 2001 and 2000 were $4.45, $4.29 and $3.07, respectively.
The assumptions that were used to determine these grant-date market values are as follows:
2002 2001 2000
Stock price volatility 22% 24% 20%Risk-free rate of return 4.8% 4.6% 6.8%Annual dividend yield 4.1% 4.3% 5.4%Expected life 6 Years 6 Years 6 Years
SEMPRA ENERGY 73.

NOTE 10. FINANCIAL INSTRUMENTS
Fair Value
The fair values of certain of the company’s financial instruments (cash, temporary investments, fundsheld in trust, notes receivable, dividends payable, short-term debt and customer deposits) approximatethe carrying amounts. The following table provides the carrying amounts and fair values of theremaining financial instruments at December 31:
2002 2001
(Dollars in millions)CarryingAmount
FairValue
CarryingAmount
FairValue
Investments in limited partnerships $ 271 $ 346 $ 317 $ 390
U.S. Treasury obligations $ 228 $ 228 $ — $ —
First-mortgage bonds $1,386 $1,452 $1,274 $1,297Notes payable 1,300 1,424 1,300 1,327Equity units 600 577 — —SDG&E rate-reduction bonds 329 357 395 411Debt incurred to acquire limited partnerships 145 169 187 206Other long-term debt 608 623 528 545
Total long-term debt $4,368 $4,602 $3,684 $3,786
Preferred stock of subsidiaries $ 204 $ 168 $ 204 $ 162
Mandatorily redeemable trust preferred securities $ 200 $ 205 $ 200 $ 214
The fair values of investments in limited partnerships accounted for under the equity and cost methodswere estimated based on the present value of remaining cash flows, discounted at rates available forsimilar investments. The fair values of debt incurred to acquire limited partnerships, which do not havereadily determinable quoted market prices, were estimated based on the present value of the futurecash flows, discounted at rates available for similar notes with comparable maturities. The fair valuesof the other long-term debt, preferred stock, mandatorily redeemable trust preferred securities and U.S.Treasury obligations were estimated based on quoted market prices for them or for similar issues.
Accounting for Derivative Instruments and Hedging Activities
SFAS 133 “Accounting for Derivative Instruments and Hedging Activities,” as amended by SFAS 138,“Accounting for Certain Derivative Instruments and Certain Hedging Activities” recognizes allderivatives as either assets or liabilities in the statement of financial position, measures thoseinstruments at fair value and recognizes changes in the fair value of derivatives in earnings in theperiod of change unless the derivative qualifies as an effective hedge that offsets certain exposure. Forrelated matters see discussion of EITF Issue 02-3 “Issues Involved in Accounting for DerivativeContracts Held for Trading Purposes and Contracts Involved in Energy Trading and Risk ManagementActivities” and the rescission of EITF Issue 98-10 in Note 1.
The company utilizes derivative financial instruments to reduce its exposure to unfavorable changes incommodity prices, which are subject to significant and often volatile fluctuation. Derivative financialinstruments include futures, forwards, swaps, options and long-term delivery contracts. Thesecontracts allow the company to predict with greater certainty the effective prices to be received by thecompany and, in the case of the California Utilities, their customers. Since adoption of SFAS 133 onJanuary 1, 2001, the company classifies its forward contracts as follows:
Normal Purchase and Sales: These contracts generally are long-term contracts that are settled byphysical delivery and, therefore, are eligible for the normal purchases and sales exception of
SEMPRA ENERGY 74.

SFAS 133. The contracts are accounted for at historical cost with gains and losses reflected in theStatements of Consolidated Income at the contract settlement date.
Electric and Natural Gas Purchases and Sales: The unrealized gains and losses related to theseforward contracts, as they relate to the California Utilities, are reflected on the Consolidated BalanceSheets as regulatory assets and liabilities to the extent derivative gains and losses will be recoverableor payable in future rates. If gains and losses at the California Utilities are not recoverable or payablethrough future rates, the California Utilities apply hedge accounting if certain criteria are met. When acontract no longer meets the requirements of SFAS 133, the unrealized gains and losses will beamortized over the remaining contract life.
In instances where hedge accounting is applied to derivatives, cash flow hedge accounting is electedand, accordingly, changes in fair values of the derivatives are included in other comprehensive income,but not reflected in the Statements of Consolidated Income until the corresponding hedged transactionis settled. The effect on other comprehensive income for the years ended December 31, 2002 and2001 was not material. In instances where derivatives do not qualify for hedge accounting, gains andlosses are recorded in the Statements of Consolidated Income.
The following were recorded in the Consolidated Balance Sheets at December 31:
(Dollars in millions) 2002 2001
Fixed-priced contracts and other derivatives:Current assets $ 3 $ 57Noncurrent assets 42 27
Total 45 84
Current liabilities 153 171Noncurrent liabilities 813 788
Total 966 959
Net liabilities $921 $875
Regulatory assets and liabilities:Current regulatory assets 151 168Noncurrent regulatory assets 812 784
Total 963 952
Regulatory balancing account liabilities — 50Current regulatory liabilities 2 4Noncurrent regulatory liabilities — 1
Total 2 55
Net regulatory assets $961 $897
The remaining differences between net liabilities and regulatory assets were primarily due to marketvalue adjustments of $42 million and $22 million at December 31, 2002 and 2001, respectively, to long-term debt related to two fixed-to-floating interest rate swaps. The market value adjustment in 2002included a reversing effect for the cancellation of one of the swap agreements on September 30, 2002.
SEMPRA ENERGY 75.

$4 million of income in 2002 and $5 million of losses in 2001 were recorded in operating revenues and$1 million of income in 2002 and $1 million of losses in 2001 were recorded in “other income — net” inthe Statements of Consolidated Income.
Market Risk
The company’s policy is to use derivative instruments to manage exposure to fluctuations in interestrates, foreign-currency exchange rates and prices. The company also uses and trades derivativeinstruments in its trading and marketing of energy and other commodities. Transactions involving theseinstruments are with major exchanges and other firms believed to be credit-worthy. The use of theseinstruments exposes the company to market and credit risk which may at times be concentrated withcertain counterparties, although counterparty nonperformance is not anticipated.
Interest-Rate Risk Management
The company periodically enters into interest-rate swap agreements to moderate exposure to interest-rate changes and to lower the overall cost of borrowing.
SDG&E had an interest-rate swap agreement that matured in December 2002 and effectively fixed theinterest rate on $45 million of variable-rate underlying debt at 5.42 percent. This floating-to-fixed-rateswap did not qualify for hedge accounting and, therefore, the gains and losses associated with thechange in fair value were recorded in the Statements of Consolidated Income. The effect on incomewas a $1 million gain and a $1 million loss for the years ended December 31, 2002 and 2001,respectively. Although this financial instrument did not meet the hedge accounting criteria ofSFAS 133, it was effective in achieving the risk management objectives for which it was intended.
During 2002 the company also had two fixed-to-floating rate swaps. At December 31, 2002, it had afixed-to-floating-rate swap agreement on $500 million of underlying debt which matures in 2004 andeffectively causes the interest rate on the debt to vary at a rate of LIBOR plus 1.329%. SoCalGas hadthe other agreement, which was a cancelable-call interest-rate swap, exchanging its fixed-rateobligation of 6.875% on its $175 million first-mortgage bonds for a floating rate of LIBOR plus fourbasis points. On September 30, 2002, SoCalGas terminated the swap, receiving cash proceeds of$10 million, comprised of $4 million in accrued interest and a $6 million amortizable gain. The companybelieves both swaps have been fully effective in their purpose of converting the fixed rate stated in thedebt to a floating rate and the swaps meet the criteria for accounting under the short-cut methoddefined in SFAS 133 for fair value hedges of debt instruments. Accordingly, market value adjustmentsof $20 million and $22 million (as discussed above) were added to long-term debt during the yearsended December 31, 2002 and 2001, respectively, and no net gains or losses were recorded in incomein respect to these swaps.
Energy Derivatives
The company utilizes derivative instruments to reduce its exposure to unfavorable changes in energyprices, which are subject to significant and often volatile fluctuation. Derivative instruments arecomprised of futures, forwards, swaps, options and long-term delivery contracts. These contracts allowthe company to predict with greater certainty the effective prices to be received and, in the case of theCalifornia Utilities, the prices to be charged to their customers. See Note 1 for discussion of how thesederivatives are classified under SFAS 133.
Energy Contracts
The California Utilities record natural gas and electric energy contracts in “Cost of natural gasdistributed” and “Electric fuel and net purchased power,” respectively, in the Statements of
SEMPRA ENERGY 76.

Consolidated Income. For open contracts not expected to result in physical delivery, changes in marketvalue of the contracts are recorded in these accounts during the period the contracts are open, with anoffsetting entry to a regulatory asset or liability. The company’s trading operations include the neteffects of its contracts in “other operating revenues.” The majority of the California Utilities’ contractsresult in physical delivery, which is infrequent at the trading operations.
Sempra Energy Trading and Sempra Energy Solutions
SET derives a substantial portion of its revenue, as a principal, from market making and tradingactivities in natural gas, electricity, petroleum products, metals and other commodities, for which itquotes bid and asked prices to other market makers and end users. It also earns trading profits as adealer by structuring and executing transactions that permit its counterparties to manage their riskprofiles. In addition, it takes positions in markets based on the expectation of future market conditions.These positions include options, forwards, futures and swaps. These instruments represent contractswith counterparties under which payments are linked to or derived from energy market indices or onterms predetermined by the contract, which may or may not be financially settled by SET. All of SET’sderivatives were held for trading and marketing purposes. Sempra Energy guarantees many of SET’stransactions.
SES derives a portion of its revenue from delivering electric and natural gas supplies to its commercialand industrial customers. Such contracts are hedged to preserve margin and carry minimal market risk.Exchange-traded and over-the-counter instruments are used to hedge contracts. The derivativeinstruments used to hedge the transactions include swaps, forwards, futures, options or combinationsthereof.
Both SET and SES mark to market these derivative instruments on a daily basis, with gains and lossesrecognized in earnings. These instruments are included in the Consolidated Balance Sheets as tradingassets or liabilities. Certain swaps and certain other instruments are entered into and closed out withinthe same period. SET and SES record net gains and losses on these derivative transactions in “otheroperating revenues” in the Statements of Consolidated Income.
The sections of Note 1 dealing with trading instruments, revenues and EITF Issue 02-3 provideinformation that pertains to this topic.
At SET, market risk arises from the potential for changes in the value of physical and financialinstruments resulting from fluctuations in prices and basis for natural gas, electricity, petroleum,petroleum products, metals and other commodities. Market risk is also affected by changes in volatilityand liquidity in markets in which these instruments are traded. Market risk for SES from fluctuations innatural gas or electricity prices is reduced by SES’ hedging strategy as described above.
SET’s credit risk from physical and financial instruments as of December 31, 2002 is represented bytheir positive fair value after consideration of collateral. Options written do not expose SET to creditrisk. Exchange traded futures and options are not deemed to have significant credit exposure since theexchanges guarantee that every contract will be properly settled on a daily basis. For SES, credit riskis associated with its retail customers.
SEMPRA ENERGY 77.

The following table summarizes the counterparty credit quality and exposure for SET and SES atDecember 31, 2002 and 2001, expressed in terms of net replacement value. These exposures are netof $240 million of collateral in the form of customer margin and/or letters of credit.
(Dollars in millions) December 31, 2002 2001
Counterparty credit quality*SET:
Commodity Exchanges $ 49 $ 133AAA 69 53AA 194 105A 316 577BBB 559 476Below investment grade 504 335
Total $1,691 $1,679
SES:AA $ 8 $ 4A 11 18BBB 24 7Below investment grade and not rated 86 190
Total $ 129 $ 219
* As determined by rating agencies or internal models intended to approximate rating-agencydeterminations.
Trading assets and trading liabilities are primarily carried at fair value. Trading assets at December 31,2002 include commodity inventory, which is carried at fair value for inventory purchased on or beforeOctober 25, 2002. The majority of inventory purchased after October 25, 2002 (base metals) is carriedat fair value and the remainder of the inventory purchased after October 25, 2002 is carried at averagecost. On a limited basis, average cost includes the use of fair value for the quantity on hand atOctober 24, 2002, since historical cost data is not available for that portion. Furthermore, on January 1,2003, all commodity inventory will be at lower of cost or market. SES has determined that the carryingamounts of its retail energy and wholesale energy contracts and instruments approximate fair value.
Trading assets and liabilities are recorded on a trade-date basis and adjusted daily to current value,and include amounts due from commodity clearing organizations, amounts due to/from tradingcounterparties, unrealized gains and losses from exchange-traded futures and and options, derivativeOTC swaps, forwards and options. Unrealized gains and losses on OTC derivative transactions reflectamounts which would be received from or paid to a third party upon liquidation of these contracts undercurrent market conditions. Unrealized gains and losses on OTC transactions are reported separatelyas assets and liabilities unless a legal right of setoff exists.
Based on quarterly measurements, the average fair values during 2002 for trading assets and liabilitiesapproximate $3.0 billion and $2.3 billion, respectively. For 2001, the amounts were $3.0 billion and$2.2 billion, respectively.
SEMPRA ENERGY 78.

The carrying values of trading assets and trading liabilities approximate the following:
December 31, (Dollars in millions) 2002 2001
TRADING ASSETSSET:
Unrealized gains on swaps and forwards $1,226 $1,635OTC commodity options purchased 480 425Due from trading counterparties 1,279 320Due from commodity clearing organizations and clearing brokers 49 133Commodities owned 1,968 165
Total 5,002 2,678SES:
Unrealized gains on swaps and forwards 96 149
Total 96 149Less intercompany eliminations (34) (87)
Total $5,064 $2,740
TRADING LIABILITIESSET:
Unrealized losses on swaps and forwards $ 816 $1,313OTC commodity options written 569 290Due to trading counterparties 1,196 162Repurchase obligations 1,511 —
Total 4,092 1,765SES:
Unrealized losses on swaps and forwards 6 81
Total 6 81Less intercompany eliminations (4) (53)
Total $4,094 $1,793
Futures and exchange-traded option transactions are recorded as contractual commitments on a trade-date basis and are carried at fair value based on closing exchange quotations. Commodity swaps andforward transactions are accounted for as contractual commitments on a trade-date basis and arecarried at fair value derived from dealer quotations and underlying commodity exchange quotations.OTC options purchased and written are recorded on a trade-date basis. OTC options are carried at fairvalue based on the use of valuation models that utilize, among other things, current interest,commodity and volatility rates, as applicable.
Notional amounts do not necessarily represent the amounts exchanged by parties to the physical andfinancial instruments and do not measure SET’s or SES’ exposure to credit or market risks. Thenotional or contractual amounts are used to summarize the volume of instruments, but do not reflectthe extent to which positions may offset one another. Accordingly, both companies are exposed tomuch smaller amounts.
SEMPRA ENERGY 79.

The notional amounts of SET’s and SES’ physical and financial instruments at December 31 were:
(Dollars in millions) 2002 2001
SET:Forwards and commodity swaps $ 87,621 $34,567Options purchased 33,893 21,552Options written 32,163 18,265Futures and exchange options 27,838 4,712
Total 181,515 79,096SES:Forwards and commodity swaps 1,742 10Options purchased — 3Options written 1 3Futures and exchange options 12 9
Total 1,755 25Less intercompany eliminations (1,380) (1,008)
Total $181,890 $78,113
SEMPRA ENERGY 80.

NOTE 11. PREFERRED STOCK OF SUBSIDIARIES
December 31, (Dollars in millions, except call price) Call Price 2002 2001
Pacific Enterprises (not subject to mandatory redemption andwithout par value), authorized 15,000,000 shares:
$4.75 Dividend, 200,000 shares outstanding $100.00 $ 20 $ 20$4.50 Dividend, 300,000 shares outstanding $100.00 30 30$4.40 Dividend, 100,000 shares outstanding $101.50 10 10$4.36 Dividend, 200,000 shares outstanding $101.00 20 20$4.75 Dividend, 253 shares outstanding $101.00 — —
Total 80 80
SoCalGas (not subject to mandatory redemption):$25 par value, authorized 1,000,000 shares:
6% Series, 28,041 shares outstanding 1 16% Series A, 783,032 shares outstanding 19 19
Without par value, authorized 10,000,000 shares — —
Total 20 20
SDG&E:Not subject to mandatory redemption:
$20 par value, authorized 1,375,000 shares:5% Series, 375,000 shares outstanding $ 24.00 8 84.5% Series, 300,000 shares outstanding $ 21.20 6 64.4% Series, 325,000 shares outstanding $ 21.00 7 74.6% Series, 373,770 shares outstanding $ 20.25 7 7
Without par value:$1.70 Series, 1,400,000 shares outstanding $ 25.85 35 35$1.82 Series, 640,000 shares outstanding $ 26.00 16 16
Total not subject to mandatory redemption 79 79
Subject to mandatory redemption:Without par value: $1.7625 Series, 1,000,000 shares
outstanding $ 25.00 25 25
Total $204 $204
PE preferred stock is callable at the applicable redemption price for each series, plus any unpaiddividends. All series have one vote per share and cumulative preferences as to dividends, and have aliquidation value of $100 per share plus any unpaid dividends.
None of SoCalGas’ preferred stock is callable. All series have one vote per share and cumulativepreferences as to dividends, and have a liquidation value of $25 per share, plus any unpaid dividends.In addition, the 6% Series preferred stock would also share pro rata with common stock in theremaining assets.
All series of SDG&E’s preferred stock have cumulative preferences as to dividends. The $20 par valuepreferred stock has two votes per share on matters being voted upon by shareholders of SDG&E and aliquidation value at par, whereas the no-par-value preferred stock is nonvoting and has a liquidationvalue of $25 per share, plus any unpaid dividends. SDG&E is authorized to issue 10,000,000 shares ofno-par-value preferred stock (both subject to and not subject to mandatory redemption). All series arecallable at December 31, 2002, except for the $1.7625 and $1.70 Series (callable in January andOctober 2003, respectively). The $1.7625 Series has a sinking fund requirement to redeem 50,000shares per year from 2003 to 2007; the remaining 750,000 shares must be redeemed in 2008.
SEMPRA ENERGY 81.

Mandatorily Redeemable Trust Preferred Securities
On February 23, 2000, a wholly owned subsidiary trust of the company issued 8,000,000 shares ofpreferred stock in the form of 8.90-percent Cumulative Quarterly Income Preferred Securities, Series A(QUIPS). The QUIPS have cumulative preferences as to distributions, are nonvoting and have a parand liquidation value of $25 per share. Cash dividends are paid quarterly and the QUIPS mature onFebruary 23, 2030, subject to extension to a date not later than February 23, 2049, and shortening to adate not earlier than February 23, 2015. The QUIPS are subject to mandatory redemption and thecompany has guaranteed payments to the extent that the trust does not have funds available to makedistributions. The trust has no assets except its corresponding receivable from Sempra Energy. TheQUIPS are callable on or after February 23, 2005 and there are no sinking fund provisions. The QUIPSare reflected as “Mandatorily redeemable trust preferred securities” on the company’s ConsolidatedBalance Sheets and cash dividend payments are shown as “Trust preferred distributions by subsidiary”on the company’s Statements of Consolidated Income. Proceeds of this issuance, together with $500million of long-term 7.95 percent notes due 2010 (see Note 5), were used to finance substantially all ofthe tender offer referred to in Note 12.
NOTE 12. SHAREHOLDERS’ EQUITY AND EARNINGS PER SHARE
The only difference between basic and diluted earnings per share is the effect of common stockoptions. For 2002, 2001 and 2000, the effect of dilutive options was equivalent to an additional1,059,000, 1,745,000, and 190,000 shares, respectively. This is based on using the treasury stockmethod, whereby the proceeds from the exercise price are assumed to be used to repurchase shareson the open market at the average market price for the year. The calculation excludes options covering6.0 million shares, 2.1 million shares and 6.6 million shares for 2002, 2001 and 2000, respectively, forwhich the exercise price was greater than the average market price for common stock during therespective year.
The company is authorized to issue 750,000,000 shares of no-par-value common stock and50,000,000 shares of preferred stock. Excluding shares held by the ESOP, common stock activityconsisted of the following:
2002 2001 2000
Common shares outstanding, January 1 204,475,362 201,927,524 237,408,051Stock options exercised 395,788 1,009,948 729,188Long-term incentive plan 544,100 777,500 —Common stock investment plan* 212,411 761,154 —Shares released from ESOP 130,486 134,645 125,848Shares repurchased (674,400) (60,000) (36,304,740)Shares forfeited and other (172,175) (75,409) (30,823)
Common shares outstanding, December 31 204,911,572 204,475,362 201,927,524
* In 2002 and 2001 participants in the Direct Stock Purchase Plan reinvested dividends andpurchased newly issued shares. In 2000 open-market shares were used.
SEMPRA ENERGY 82.

The payment of future dividends and the amount thereof are within the discretion of the company’sboard of directors. The CPUC’s regulation of the California Utilities’ capital structure limits the amountsthat are available for loans and dividends to the company from the California Utilities. At December 31,2002, SDG&E and SoCalGas each could have provided $250 million to Sempra Energy (combinedloans and dividends). At December 31, 2002, SDG&E and SoCalGas had loans to Sempra Energy of$250 million and $86 million, respectively.
Tender Offer
On February 25, 2000, the company completed a self-tender offer, purchasing 36.1 million shares of itsoutstanding common stock at $20 per share. In March 2000, the company’s board of directorsauthorized the optional expenditure of up to $100 million to repurchase additional shares of commonstock from time to time in the open market or in privately negotiated transactions. The companyacquired 674,400 shares, 60,000 shares and 162,400 shares under this authorization in 2002, 2001and 2000, respectively.
Equity Units
During the second quarter of 2002, the company issued $600 million of “Equity Units.” Each unitconsists of $25 principal amount of the company’s 5.60% senior notes due May 17, 2007 and acontract to purchase for $25 on May 17, 2005, between .8190 and .9992 of a share of the company’scommon stock (with the precise number to be determined by the then-prevailing market prices). Thenumber of shares would range from 20 million to 24 million. The net proceeds of the offering were usedprimarily to repay a portion of the company’s short-term debt, including debt used to finance the capitalexpenditure program for Global. The Equity Units are recorded as long-term debt in the ConsolidatedBalance Sheets. $61 million was charged to the common stock account in connection with thetransaction.
NOTE 13. ELECTRIC INDUSTRY REGULATION
Background
Supply/demand imbalances and a number of other factors resulted in abnormally high electric-commodity prices beginning in mid-2000 and continuing into 2001. This caused SDG&E’s customerbills to be substantially higher than normal. These higher prices were initially passed through tocustomers and resulted in bills that in most cases were double or triple those from 1999 and early2000. This resulted in several legislative and regulatory responses, including AB 265, enacted inSeptember 2000 and in effect through December 31, 2002. AB 265 imposed a ceiling of 6.5 cents/kWhon the cost of the electric commodity that SDG&E could pass on to its small-usage customers on acurrent basis, effective retroactive to June 1, 2000.
SDG&E accumulated the amount that it paid for electricity in excess of the ceiling rate in an interest-bearing balancing account (the AB 265 undercollection). It increased to approximately $750 million inthe first quarter of 2001 and decreased to $392 million at December 31, 2001 and $215 million atDecember 31, 2002 (included in current “regulatory balancing accounts—net”).
In June 2001, representatives of California Governor Davis, the DWR, Sempra Energy and SDG&Eentered into a Memorandum of Understanding (MOU) contemplating the implementation of a series oftransactions and regulatory settlements and actions to resolve many of the issues affecting SDG&Eand its customers arising out of the California energy crisis. During 2001, implementation of some ofthe MOU’s provisions (with the rest no longer likely to be implemented) resulted in a partial reduction ofthe AB 265 undercollection (see above). In addition, the DWR’s procurement of SDG&E’s full net shortposition during 2001 and 2002 (see below) resulted in the cessation of growth in the AB 265undercollection.
SEMPRA ENERGY 83.

The Department of Water Resources and Power Procurement
In February 2001, through the passage of Assembly Bill 1, Chapter 4, Statutes of the 2001 FirstExtraordinary Session (AB X1), the DWR began to purchase power from generators and marketersand entered into long-term contracts for the purchase of a portion of the state’s power requirementsthat is served by the IOUs. SDG&E and the DWR had an agreement under which the DWR purchasedthe net short supply for bundled SDG&E customers through December 31, 2002.
Since early 2001, the DWR has procured power for each of the California IOUs and the CPUC hasestablished the allocation of the power and the related cost responsibility among the IOUs for thatpower. SDG&E’s allocation results in its overall rates being comparable to those of the other twoCalifornia electric IOUs, Southern California Edison (Edison) and Pacific Gas and Electric (PG&E). OnDecember 17, 2002, the CPUC issued a decision allocating the cost of the DWR’s revenuerequirement for its 2003 power purchases. The decision pools the total fixed costs of the DWR’scontracts and allocates these costs among the IOUs on the basis of the quantity of the energy suppliedto each IOU from the contracts. Variable costs related to the energy supplied under each contract go tothe IOU assigned each contract. This decision allocates $643 million to SDG&E and will be handledwithin existing utility rates. That amount is currently under additional review as the DWR revenuerequirement was reduced when the IOUs began power procurement on January 1, 2003 (seediscussion below).
The CPUC’s objective was for the IOUs to take the procurement function back from the DWR by thebeginning of 2003. On September 19, 2002, the CPUC issued a decision on how the power from thelong-term contracts signed by the DWR should be allocated to the customers of each of the IOUs forpurposes of determining the amount of additional power each utility is required to procure in 2003 andthereafter to fulfill its resource needs. The reasonableness of the IOUs’ administration and dispatch ofthe allocated contracts will be reviewed by the CPUC in an annual proceeding. AB 57, signed byCalifornia Governor Davis on September 24, 2002, requires the CPUC to make this determination, andto establish procedures that will allow the IOUs to recover their electric procurement costs in a timelyfashion without the need for retrospective reasonableness reviews. SDG&E believes that the return tothe procurement function in accordance with AB 57 will have no adverse impact on its financial positionor results of operations.
On August 22, 2002, the CPUC issued a decision that authorized the California IOUs to begin interimprocurement of power to cover their net short energy requirements starting on January 1, 2003. Thenet short is the difference between the amount of electricity needed to cover a utility’s customerdemand and the power provided by owned generation and existing contracts, including the long-termpower contracts allocated to the customers of each IOU by the DWR (see above). The IOUs areauthorized to enter into contracts of up to five years for power from traditional sources, and up to15 years for power from renewable sources. SDG&E is required to purchase approximately 10 percentof its customer requirements in 2003, based on the allocation of the DWR power approved by theCPUC on December 17, 2002.
On October 24, 2002, the CPUC issued a decision in the Electric Procurement proceeding thatofficially directs the resumption of the electric commodity procurement function by IOUs by January 1,2003, and begins the implementation of recent legislation regarding procurement and renewablesportfolio standards addressed in AB 57 and Senate Bill 1078. The decision established a process forreview and approval of the utilities’ updated 2003 and long-term (20-year) procurement plans. TheCPUC approved SDG&E’s 2003 procurement plan in December 2002 and approval of the long-termplan is expected during 2003. The CPUC has authorized the utilities to use derivatives to manageprocurement risk and to acquire a variety of resource types including utility ownership, conventionalgeneration, distributed generation, self generation, demand side resources, transmission andrenewables. A semiannual cost review and rate revision mechanism is established, and a trigger is
SEMPRA ENERGY 84.

established for more frequent changes if undercollected commodity costs exceed five percent ofannual, non-DWR generation revenues, to provide for timely recovery of any undercollections.
The Electric Procurement decision described above also directed each IOU to procure from renewablesources at least one percent of its 2003 total energy sales and an additional one percent of energysales each year thereafter, until a 20-percent renewable resources portfolio is achieved by the year2017. SDG&E has contracted to procure approximately four percent of its 2003 total energy sales fromrenewable sources and, pursuant to a December 2002 CPUC resolution, may “bank” or credit towardfuture years’ compliance any excess over its one-percent requirement.
The CPUC has placed a moratorium on the IOUs’ purchasing electricity from their affiliates for theearlier of two years or until the CPUC completes a rulemaking on this matter. SDG&E believes that thismoratorium will have no adverse impact on its financial position or results of operations. During 2002,SDG&E’s purchases of electricity from its affiliate Sempra Energy Trading were less than one percentof total electricity purchases.
DWR Operating and Servicing Agreements
On December 19, 2002, the CPUC issued an Operating Order setting the terms by which the IOUs willadminister the DWR contracts allocated to the customers of each of the utilities (see above). The DWRcontinues to bear the credit risk on the contracts and the IOUs have assumed the administrativeburden of the contracts. The order requires the IOUs to take financial responsibility for acquiringnatural gas supplies for the generation facilities that are subject to the DWR contracts.
SDG&E currently has pending an operating and servicing agreement signed by the DWR and SDG&Ewhich, if approved by the CPUC, will supercede the CPUC’s operating order referred to above. Thepending agreement will clearly delineate that the natural gas procurement and associated risk willcontinue to reside with the DWR.
Effect on Customer Rates
On December 19, 2002, the CPUC issued a decision denying SDG&E’s application for a ratesurcharge to expedite recovery of the AB 265 undercollection. However, even at current rates andallocation of the resulting revenues between the DWR and SDG&E, the balance is expected to becompletely recovered before the end of 2005. Also at issue is the ownership of certain power saleprofits stemming from intermediate term purchase power contracts entered into by SDG&E during theearly stages of California’s electric utility industry restructuring. The company believes that all profitsassociated with these contracts properly are for the benefit of SDG&E shareholders rather thancustomers, whereas the CPUC asserted that all the profits should accrue to the benefit of customers.Accordingly, SDG&E challenged the CPUC’s disallowance of profits from the contracts in both theCalifornia Court of Appeals and in Federal District Court.
These court proceedings have been held in abeyance pending the CPUC’s consideration of variousother proposed settlements. On December 19, 2002, the CPUC rendered a 3-to-2 decision approvingthe June 2002 proposed settlement, previously described in the company’s Quarterly Report on Form10-Q for the quarter ended September 30, 2002, that divides the profits from these contracts, $199million for SDG&E customers and $173 million for SDG&E shareholders. Of the $199 million in profitsallocated to customers, $175 million had already been credited to ratepayers in 2001. The remaining$24 million was applied as a balancing account transfer that reduced the AB 265 balancing account inDecember 2002. The profits allocated to customers reduce SDG&E’s AB 265 undercollection, but donot adversely affect SDG&E’s financial position, liquidity or results of operations. The term of acommissioner who voted to approve the settlement has expired, and a new commissioner has been
SEMPRA ENERGY 85.

appointed. On January 29, 2003, the CPUC’s Office of Ratepayer Advocates (ORA), the City of SanDiego and the Utility Consumers’ Action Network, a consumer-advocacy group, filed requests for aCPUC rehearing of the decision. On February 13, 2003, the company filed its opposition to rehearingof the decision. Parties requesting a rehearing and parties to any rehearing may also appeal theCPUC’s final decision to the California appellate courts.
Direct Access
On March 21, 2002, the CPUC affirmed its decision prohibiting new direct access (DA) contracts afterSeptember 20, 2001, but rejected a proposal to make the prohibition retroactive to July 1, 2001.Contracts in place as of September 20, 2001 may be renewed or assigned to new parties. OnNovember 7, 2002, the CPUC issued a decision adopting DA exit fees with an interim cap of 2.7 centsper kWh, effective January 1, 2003. This decision will have no effect on SDG&E’s cash flows or resultsof operations, because any shortfall due to the cap on the exit fees will be funded by bundledcustomers in current rates. The CPUC is conducting further proceedings to determine whether, or towhat extent, the interim cap should be revised after July 1, 2003. The CPUC’s decisions concerningdirect access affect SES’ ability to enter into contracts to sell electricity in California.
SONGS
Operating costs of SONGS Units 2 and 3, including nuclear fuel and related financing costs, andincremental capital expenditures are recovered through the ICIP mechanism which allows SDG&E toreceive approximately 4.4 cents per kilowatt-hour for SONGS generation. Any differences betweenthese costs and the incentive price affect net income. For the year ended December 31, 2002, ICIPcontributed $50 million to SDG&E’s net income. The CPUC has rejected an administrative law judge’sproposed decision to end ICIP prior to its December 31, 2003 scheduled expiration date. However, theCPUC has also denied the previously approved market-based pricing for SONGS beginning in 2004and instead provided for traditional rate-making treatment, under which the SONGS ratebase wouldbegin at zero, essentially eliminating earnings from SONGS until ratebase grows. The company hasapplied for rehearing of this decision.
FERC Actions
The FERC is investigating prices charged to buyers in the California PX and ISO markets by variouselectric suppliers. It is seeking to determine the extent to which individual sellers have yet to be paid forpower supplied during the period of October 2, 2000 through June 20, 2001 and to estimate theamounts by which individual buyers and sellers paid and were paid in excess of competitive marketprices. Based on these estimates, the FERC could find that individual net buyers, such as SDG&E, areentitled to refunds and individual net sellers, such as SET, are obliged to provide refunds. To the extentany such refunds are actually realized by SDG&E, they would reduce SDG&E’s rate-ceiling balancingaccount. To the extent that SET is required to provide refunds, they could result in payments by SETafter adjusting for any amounts still owed to SET for power supplied during the relevant period. Suchpayments, if any, are not expected to be material to the company’s financial position, results ofoperations or liquidity. In December 2002, a FERC administrative law judge’s (ALJ) preliminary findingsindicate that California owes power suppliers $1.2 billion (the $3 billion that California still owes energycompanies less $1.8 billion the ALJ finds the energy companies overcharged California). California isseeking $8.9 billion in refunds and indicated it would appeal if the ALJ’s findings are adopted. A FERCdecision is not expected before the second half of 2003. More recently, FERC has launched aninvestigation into whether there was manipulation of short-term energy prices in the West that resultedin unjust and unreasonable long-term power sales contracts.
SEMPRA ENERGY 86.

In addition, in February 2002 the CPUC and the California Electricity Oversight Board petitioned theFERC to determine that the long-term power contracts the DWR signed with energy companies duringthe height of the energy crisis do not provide just and reasonable rates, and to abrogate or reform thecontracts. In April 2002, the FERC ordered hearings on the complaints. The order requires thecomplainants to satisfy a “heavy” burden of proof to support a revision of the contracts, and cited theFERC’s long-standing policy to recognize the sanctity of contracts, from which it has deviated only in“extreme circumstances.” In December 2002, a FERC administrative law judge held formal hearingsand in January 2003 issued a partial, initial decision recommending that the validity of SER’s contractbe determined under a “public interest” standard that requires the complainants to satisfy a significantlyhigher standard of review to invalidate the SER contract than would a just and reasonable standard.Final briefs were submitted to the full FERC commission later in January with respect to the publicinterest standard of review and the FERC has indicated that it expects to issue a final decision byMarch 2003.
Effect On Other Subsidiaries
At December 31, 2002, SET was due approximately $100 million from the ISO for which the companybelieves adequate reserves have been recorded. The collection of these receivables may depend onsatisfactory resolution of the financial difficulties being experienced by the other IOUs as a result of theCalifornia electric industry situation described above.
NOTE 14. OTHER REGULATORY MATTERS
Gas Industry Restructuring
In January 1998, the CPUC released a staff report initiating a project to assess the current market andregulatory framework for California’s natural gas industry. In July 1999, after hearings, the CPUCissued a decision stating which natural gas regulatory changes it found most promising, encouragingparties to submit settlements addressing those changes, and providing for further hearings ifnecessary.
On December 11, 2001, the CPUC issued a decision adopting much of a settlement that had beensubmitted in 2000 by the California Utilities and approximately 30 other parties representing allsegments of the natural gas industry in Southern California, but opposed by some parties. The CPUCdecision adopts the following provisions: a system for shippers to hold firm, tradable rights to capacityon SoCalGas’ major natural gas transmission lines, with SoCalGas’ shareholders at risk for whethermarket demand for these rights will cover the cost of these facilities; a further unbundling of SoCalGas’storage services, giving SoCalGas greater upward pricing flexibility (except for storage service for corecustomers) but with increased shareholder risk for whether market demand will cover storage costs;new balancing services, including separate core and noncore balancing provisions; a reallocationamong customer classes of the cost of interstate pipeline capacity held by SoCalGas and anunbundling of interstate capacity for natural gas marketers serving core customers; and the eliminationof noncore customers’ option to obtain natural gas procurement service from the California Utilities.The CPUC modified the settlement to provide increased protection against the exercise of marketpower by persons who would acquire rights on the SoCalGas natural gas transmission system. TheCPUC also rejected certain aspects of the settlement that would have provided more options fornatural gas marketers serving core customers.
During 2002 the California Utilities filed a proposed implementation schedule and revised tariffs andrules required for implementation. However, protests of these compliance filings were filed, and theCPUC has not yet authorized implementation of most of the provisions of its decision. On December30, 2002, the CPUC deferred acting on a plan to implement its decision.
SEMPRA ENERGY 87.

The California Utilities believe that the implementation of the decision would make natural gas servicemore reliable, more efficient and better tailored to meet the needs of customers. The decision is notexpected to adversely affect the California Utilities’ earnings.
Cost of Service (COS) and Performance-Based Regulation (PBR)
To promote efficient operations and improved productivity and to move away from reasonablenessreviews and disallowances, the CPUC adopted PBR for SDG&E effective in 1994 and for SoCalGaseffective in 1997. PBR has resulted in modification to the general rate case and certain other regulatoryproceedings for the California Utilities. Under PBR, regulators require future income potential to be tiedto achieving or exceeding specific performance and productivity goals, rather than relying solely onexpanding utility plant to increase earnings. The three areas that are eligible for PBR rewards areoperational incentives based on measurements of safety, reliability and customer satisfaction; demand-side management (DSM) rewards based on the effectiveness of the programs; and natural gasprocurement rewards. These incentive rewards are not included in the company’s earnings before theyare approved by the CPUC.
The COS and PBR cases for the California Utilities were filed on December 20, 2002. The filingsoutline projected expenses (excluding the commodity cost of electricity or natural gas consumed bycustomers or expenses for programs such as low-income assistance) and revenue requirements for2004 and a formula for 2005 through 2008. SoCalGas’ cost of service study proposes an increase innatural gas base rate revenues of $130 million. SDG&E’s cost of service study proposes increases inelectric and natural gas base rate revenues of $58.9 million and $21.6 million, respectively. The filingsalso requested a continuance and expansion of PBR in terms of earnings sharing and performanceservice standards that include both reward and penalty provisions related to customer satisfaction,employee safety and system reliability. The resulting new base rates are expected to be effective onJanuary 1, 2004. A CPUC decision is expected in late 2003. The California Utilities’ PBR mechanismsare in effect through December 31, 2003, at which time the mechanisms will be updated. That updatewill include, among other things, a reexamination of the California Utilities’ reasonable costs ofoperation to be allowed in rates.
An October 10, 2001 decision denied the California Utilities’ request to continue equal sharing betweenratepayers and shareholders of the estimated savings for the PE/Enova merger as more fullydiscussed in Note 1 and, instead, ordered that all of the estimated 2003 merger savings go toratepayers. This decision will adversely affect the California Utilities’ 2003 net income by $35 million.
In August 2002, the CPUC issued a resolution approving SDG&E’s 2000 PBR report. The resolutionapproved SDG&E’s request for a total net reward of $11.7 million (pretax), as well as SDG&E’s actual2000 rate of return (applicable only to electric distribution and natural gas transportation) of 8.74percent, which is below the authorized 8.75 percent. This results in no sharing of earnings in 2000under the PBR sharing mechanism. The financial results herein include the reward during the thirdquarter of 2002.
During 2002, SDG&E filed its 2001 PBR report with the CPUC. Based on the results against theperformance indicator benchmarks, SDG&E requested a total net reward of $12.2 million.
On January 16, 2003, the CPUC issued a resolution approving SoCalGas’ report on its PBR results for2000. The resolution approved SoCalGas’ calculation of the amount that should be retained byshareholders. The resolution also approved SoCalGas’ request for an $80,000 reward for employeesafety results. SoCalGas is not eligible for any other rewards and was not found by the resolution toowe any penalties.
SEMPRA ENERGY 88.

During 2002, SoCalGas filed its 2001 PBR report with the CPUC. Based on the results against theperformance indicator benchmarks, SoCalGas requested a total net reward of $0.5 million.
These proceedings do not encompass electric transmission issues. By the end of February 2003,SDG&E will file an electric transmission rate request with the FERC, updating its ratebase and itsrevenue requirement for operating and maintenance costs.
Natural Gas Procurement PBR
SDG&E has a Natural Gas Procurement PBR mechanism that allows SDG&E to receive a share of thesavings it achieves by buying natural gas for customers below a monthly benchmark. SDG&E’srequest for a reward of $6.7 million for the PBR natural gas procurement period ended July 31, 2001(Year 8) was approved by the CPUC on January 30, 2003. As part of the reward calculation is basedon California-Arizona natural gas border price indices, the decision reserved the right to revise thereward in the future, depending on the outcome of the CPUC’s border price investigation (see below)and the FERC’s investigation into alleged energy price manipulation (see Note 13 above). In October2002, SDG&E filed its Year 9 report for the PBR natural gas procurement period ended July 31, 2002,reporting a $1.4 million disallowance, which was recorded during the three-month period endedSeptember 30, 2002. SDG&E also filed an application on October 31, 2002, seeking to modify andextend the Natural Gas PBR mechanism beyond Year 10, which ends July 31, 2003.
Gas Cost Incentive Mechanism (GCIM)
SoCalGas’ GCIM allows SoCalGas to receive a share of the savings it achieves by buying natural gasfor customers below monthly benchmarks. The mechanism permits full recovery of all costs within atolerance band above the benchmark price and refunds all savings within a tolerance band below thebenchmark price. The costs or savings outside the tolerance band are shared between customers andshareholders. The CPUC approved the use of natural gas futures for managing risk associated with theGCIM. SoCalGas enters into natural gas futures contracts in the open market to mitigate risk andbetter manage natural gas costs.
On December 17, 2002, the CPUC issued its final decision in the GCIM Year 6 Phase 2 proceeding,approving, with modifications, a settlement agreement among SoCalGas, the CPUC’s ORA and TheUtility Reform Network, a consumer-advocacy group, and extending the GCIM mechanism to Year 7and beyond.
SoCalGas has requested that the CPUC approve rewards of $30.8 million and $17.4 million for GCIMYears 7 and 8, respectively. CPUC approval of these rewards is expected in 2003, subject to possiblefuture adjustment as a result of its investigation into the run-up in California border natural gas pricesduring the winter of 2000-2001 (discussed below). In the past shareholder rewards associated with theGCIM had been recorded to SoCalGas’ Purchased Gas Balancing Account after the close of the GCIMperiod covering the utility’s natural gas supply operations for the twelve months ended March 31. InJune 2002, the CPUC issued a decision allowing SoCalGas to recover its GCIM earnings through itsmonthly core procurement filing beginning January 1, 2003. These awards are not included inSoCalGas’ earnings until approved by the CPUC.
Demand Side Management and Energy Efficiency Awards
Since the 1990s, the IOUs have been eligible to earn awards for implementing and/or administeringenergy-conservation programs. The California Utilities have offered these programs to customers andhave consistently achieved significant earnings therefrom. Beginning in 2002, earnings for non-low-income energy-efficiency programs were eliminated; however, awards related to DSM and low-incomeenergy-efficiency programs may still be requested.
SEMPRA ENERGY 89.

SoCalGas has outstanding before the CPUC applications to recover shareholder rewards earned forperformance under the DSM programs for 1995 through 2001. Reward requests in these applicationstotal $9.1 million.
SDG&E has outstanding before the CPUC applications to recover shareholder rewards earned forperformance under the DSM programs for 1995 through 2001. Reward requests in these applicationstotal $35.5 million.
A CPUC Administrative Law Judge has scheduled a pre-hearing conference to review the IOUs’ DSMprograms. The review may include reanalyzing the uncollected portion of past rewards earned by IOUs(which have not been included in the California Utilities’ income), and potentially recompute the amountof the DSM rewards. The California Utilities have opposed such a recalculation. The issue is stillpending before the CPUC.
Pending Incentive Awards
At December 31, 2002, the following performance incentives were pending CPUC approval and,therefore, were not included in the company’s earnings (dollars in millions):
Program SoCalGas SDG&E Total
PBR $ 0.5 $12.2 $ 12.7Natural gas procurement 48.2 6.7 54.9DSM 9.1 35.5 44.6
Total $57.8 $54.4 $112.2
Cost of Capital
Effective January 1, 2003, SoCalGas’ authorized rate of return on common equity (ROE) is 10.82percent and its return on ratebase (ROR) is 8.68 percent. These rates will continue to be effective untilthe next periodic review by the CPUC unless market interest-rate changes are large enough to triggeran automatic adjustment prior thereto, which last occurred in October 2002 and adjusted ratesdownward from the previous 11.6 percent (ROE) and 9.49 percent (ROR) to the current levels. Thischange results in an annual revenue requirement decrease of $10.5 million.
Effective January 1, 2003, SDG&E’s authorized rate of return on equity is 10.9 percent (increased from10.6 percent) for SDG&E’s electric distribution and natural gas businesses. This change results in anannual revenue requirement increase of $2.4 million ($1.9 million electric and $0.5 million natural gas)and increases SDG&E’s overall rate of return from 8.75 percent to 8.77 percent. These rates remain ineffect through 2003. The electric-transmission cost of capital is determined under a separate FERCproceeding.
Border Price Investigation
On November 21, 2002, the CPUC instituted an investigation into the Southern California natural gasmarket and the price of natural gas delivered to the California-Arizona (CA-AZ) border during theperiod of March 2000 through May 2001. The CPUC intends to examine the possible reasons for andissues potentially related to the elevated border prices that affected California consumers during thisperiod.
The California Utilities are included among the respondents to the investigation. If the investigationdetermines that the conduct of any respondent contributed to the natural gas price spikes at the CA-AZborder during this period, the CPUC may modify the respondent’s applicable natural gas procurement
SEMPRA ENERGY 90.

incentive mechanism, reduce the amount of any shareholder award for the period involved, or orderthe respondent to issue a refund to ratepayers to offset the higher rates paid. The California Utilitiesare fully cooperating with the CPUC in the investigation and believe that the CPUC will ultimatelydetermine that they were not responsible for the high border prices during this period.
Biennial Cost Allocation Proceeding (BCAP)
The BCAP determines the allocation of authorized costs between customer classes and the rates andrate design applicable to such classes for natural gas transportation service. The BCAP adjustsSoCalGas’ rates to reflect variances in customer demand as compared to the adopted forecastspreviously used in establishing customer natural gas transportation rates. The mechanism in effectthrough the end of 2002 largely eliminated the effect on SoCalGas’ income of variances in customerdemand and natural gas transportation costs. SDG&E filed its 2003 BCAP on October 5, 2001 andSoCalGas filed its 2003 BCAP on September 21, 2001. In February 2003, a CPUC Administrative LawJudge granted a motion to defer the BCAP. As a result of that ruling, the California Utilities must submitan amended application by September 2003, with new rates scheduled to be implemented bySeptember 2004. On December 5, 2002, the CPUC issued a decision approving 100 percent balancingaccount protection for all core and noncore transportation costs, effective in 2003.
Nuclear Decommissioning Trusts
On June 17, 2002, SDG&E amended its March 21, 2002 joint application with Edison, requesting theCPUC to set contribution levels for the SONGS nuclear decommissioning trust funds. SDG&Erequested a rate increase to cover its share of projected increased decommissioning costs for SONGS.If approved, the current annual contribution to SDG&E’s trust funds, which is recovered in rates, wouldincrease to $11.5 million annually from $4.9 million. Prior to August 1999, SDG&E’s annual contributionhad been $22 million.
Utility Integration
On September 20, 2001, the CPUC approved Sempra Energy’s request to integrate the managementteams of the California Utilities. The decision retains the separate identities of each utility and is not amerger. Instead, utility integration is a reorganization that consolidates senior management functions ofthe two utilities and returns to the utilities the majority of shared support services previously providedby Sempra Energy’s centralized corporate center. Once implementation is completed, the integration isexpected to result in more effective operations.
In a related development, an August 2002 CPUC interim decision denied a request by the CaliforniaUtilities to combine their natural gas procurement activities at this time, pending completion of theCPUC’s Border Price Investigation referred to above.
CPUC Investigation of Energy-Utility Holding Companies
The CPUC has initiated an investigation into the relationship between California’s IOUs and theirparent holding companies. Among the matters to be considered in the investigation are utility dividendpolicies and practices and obligations of the holding companies to provide financial support for utilityoperations under the agreements with the CPUC permitting the formation of the holding companies.
SEMPRA ENERGY 91.

On January 11, 2002, the CPUC issued a decision to clarify under what circumstances, if any, aholding company would be required to provide financial support to its utility subsidiaries. The CPUCbroadly determined that it would require the holding company to provide cash to a utility subsidiary tocover its operating expenses and working capital to the extent they are not adequately funded throughretail rates. This would be in addition to the requirement of holding companies to cover their utilitysubsidiaries’ capital requirements, as the IOUs have previously acknowledged in connection with theholding companies’ formations. On January 14, 2002, the CPUC ruled on jurisdictional issues, decidingthat the CPUC had jurisdiction to create the holding company system and, therefore, retains jurisdictionto enforce conditions to which the holding companies had agreed. The company’s request forrehearing on the issues was denied by the CPUC and the company subsequently filed appeals in theCalifornia Court of Appeal, which are still pending.
Valley-Rainbow Interconnect
On December 19, 2002, the CPUC issued a decision finding that the Valley-Rainbow Interconnect, aproposed 500-kv transmission line connecting SDG&E’s and Edison’s transmission systems, is notneeded to meet SDG&E’s projected resource needs within a planning horizon that the CPUC deemedappropriate (five years). If it chooses to, SDG&E can refile at a later date. In January 2003, SDG&Eand the ISO filed applications for rehearing of the decision. If this project is abandoned SDG&E plansto seek recovery of its costs ($20 million through December 31, 2002) in a FERC filing to be made inFebruary 2003.
NOTE 15. COMMITMENTS AND CONTINGENCIES
Natural Gas Contracts
The California Utilities buy natural gas under short-term and long-term contracts. Short-term purchasesare from various Southwest U.S. and Canadian suppliers and are primarily based on monthly spot-market prices. The California Utilities transport natural gas under long-term firm pipeline capacityagreements that provide for annual reservation charges, which are recovered in rates. SoCalGas hascommitments for firm pipeline capacity under contracts with pipeline companies that expire at variousdates through 2006.
SDG&E has long-term natural gas transportation contracts with various interstate pipelines that expireon various dates between 2003 and 2023. SDG&E has a long-term purchase agreement with aCanadian supplier that expires in August 2003, and in which the delivered cost of natural gas is tied tothe California border spot-market price. SDG&E purchases natural gas on a spot basis to fill itsadditional long-term pipeline capacity. SDG&E intends to continue using the long-term pipelinecapacity in other ways as well, including the transport of other natural gas for its own use and therelease of a portion of this capacity to third parties.
SEMPRA ENERGY 92.

At December 31, 2002, the future minimum payments under natural gas contracts were:
(Dollars in millions)Storage and
TransportationNatural
Gas Total
2003 $210 $687 $ 8972004 214 3 2172005 204 3 2072006 117 2 1192007 14 2 16Thereafter 157 — 157
Total minimum payments $916 $697 $1,613
Total payments under natural gas contracts were $1.4 billion in 2002, $2.6 billion in 2001, and $1.6billion in 2000.
Purchased-Power Contracts
On January 17, 2001, the California Assembly passed AB X1 to allow the DWR to purchase powerunder long-term contracts for the benefit of California consumers. In accordance with AB X1, SDG&Eentered into an agreement with the DWR under which the DWR purchases SDG&E’s full net shortposition (the power needed by SDG&E’s customers, other than that provided by SDG&E’s nucleargenerating facilities or its previously existing purchased power contracts) through December 31, 2002.Starting on January 1, 2003, SDG&E and the other IOUs resumed their electric commodityprocurement function based on a CPUC decision issued in October 2002. For additional discussion ofthis matter see Note 13.
For 2003, SDG&E expects to receive 43 percent of its customer power requirement from DWRallocations. Of the remaining requirements that SDG&E must provide, SONGS will account for21 percent, long-term contracts for 26 percent and spot market purchases for 10 percent. As ofJanuary 2003, SDG&E has approximately 90 percent of its electric power requirements met by acombination of long-term contracts, DWR-allocated contracts and its share of nuclear generatingfacilities. The contracts expire on various dates between 2003 and 2025. Prior to January 1, 2001, thecost of these contracts was recovered by bidding them into the PX and receiving revenue from the PXfor bids accepted. As of January 1, 2001, in compliance with a FERC order prohibiting sales to the PX,SDG&E no longer bids those contracts into the PX. Those contracts are now used to serve customersin compliance with a CPUC order. In late 2000, SDG&E entered into additional contracts to servecustomers instead of buying all of its power from the PX. These contracts expire in 2003. In addition,during 2002 SDG&E entered into contracts which will provide approximately four percent of its 2003total energy sales from renewable sources. These contracts expire from 2008 through 2018.
SEMPRA ENERGY 93.

At December 31, 2002, the estimated future minimum payments under the long-term contracts (notincluding the DWR allocations) were:
(Dollars in millions)
2003 $ 2572004 2272005 2282006 2242007 213Thereafter 2,285
Total minimum payments $3,434
The payments represent capacity charges and minimum energy purchases. SDG&E is required to payadditional amounts for actual purchases of energy that exceed the minimum energy commitments.Total payments under the contracts were $235 million in 2002, $512 million in 2001 and $257 million in2000.
Leases
The company has leases (primarily operating) on real and personal property expiring at various datesfrom 2003 to 2045. Certain leases on office facilities contain escalation clauses requiring annualincreases in rent ranging from 2 percent to 7 percent. The rentals payable under these leases aredetermined on both fixed and percentage bases, and most leases contain extension options which areexercisable by the company. The company also has long-term capital leases on real property.Property, plant and equipment included $35 million at both December 31, 2002 and 2001, related tothese leases. The associated accumulated amortization was $21 million and $18 million, respectively.SDG&E terminated its capital lease agreement for nuclear fuel in mid-2001 and now owns its nuclearfuel.
At December 31, 2002, the minimum rental commitments payable in future years under allnoncancellable leases were as follows:
(Dollars in millions)Operating
LeasesCapitalized
Leases
2003 $ 94 $ 32004 101 32005 104 32006 103 12007 105 1Thereafter 1,385 1
Total future rental commitments $1,892 12
Imputed interest (7% to 10%) (2)
Net commitments $10
In connection with the quasi-reorganization described in Note 1, PE recorded liabilities of $102 millionto adjust to fair value the operating leases related to its headquarters and other facilities at December31, 1992. The remaining amount of these liabilities was $42 million at December 31, 2002. Theseleases are included in the above table.
SEMPRA ENERGY 94.

Rent expense for operating leases totaled $90 million in 2002, $92 million in 2001 and $102 million in2000. Depreciation expense for capitalized leases is included in depreciation on the ConsolidatedStatements of Income.
Construction Projects
In October 2001, Sempra Energy announced plans to develop a major new liquefied natural gas (LNG)receiving terminal to bring natural gas supplies into northwestern Mexico and southern California. SEIinitially purchased a 300-acre site on the Pacific Coast, north of Ensenada, Baja California, Mexico forthe terminal for a purchase price of $19.7 million. Subsequently, it purchased additional land for theterminal for $2.6 million. As currently planned, the plant would have a send-out capacity ofapproximately 1 billion cubic feet per day of natural gas through a new 40-mile pipeline between theterminal and existing pipelines in the San Diego/Baja California border area. The project is currentlyestimated to cost $600 million and to commence commercial operations in 2007.
In February 2003, Sempra LNG Corp., a newly created subsidiary of Global, announced an agreementto acquire the proposed Hackberry, La., LNG project from a subsidiary of Dynegy, Inc. Sempra LNGCorp. initially will pay Dynegy $20 million, with additional payments contingent on the performance ofthe project. The project has received preliminary approval from the FERC and expects a final decisionlater this year. If the project is approved, Sempra LNG Corp. intends to build an LNG receiving facilitycapable of processing up to 1.5 billion cubic feet per day of natural gas. The total cost of the project isexpected to be about $700 million. The project could begin commercial operations as early as 2007.
In February 2001, the company announced plans to construct Termoelectrica de Mexicali, a $350million, 600-megawatt power plant near Mexicali, Mexico. Fuel for the plant will be supplied via thenewly constructed pipeline from Arizona to Tijuana referred to below. It is anticipated that the electricityproduced by the plant will be available for markets in California, Arizona and Mexico via a newlyconstructed 230,000-volt transmission line. Construction of the power plant began in the second half of2001. $308 million has been invested in the project, which is scheduled for completion by mid-2003.SER has approximately $8 million of commitments remaining in the project at December 31, 2002.
In December 2000, SER obtained approvals from the appropriate state agencies to construct the ElkHills Power Project, a $395 million 570-megawatt power plant near Bakersfield, California. Elk Hills isbeing developed in a 50/50 joint venture with Occidental. As of December 31, 2002, SER has invested$172 million in the project and has commitments of approximately $15 million. The project isanticipated to be completed in May 2003. Information concerning related litigation with Occidental isprovided below.
In December 2000, SER obtained approval from the appropriate state agencies to construct theMesquite Power Plant (Mesquite Power). Located near Phoenix, Arizona, Mesquite Power is a $690million, 1,250-megawatt project which will provide electricity to wholesale energy markets in theSouthwest. Construction began in September 2001, commercial operations at 50-percent capacity areexpected to commence in June 2003 and project completion is anticipated for January 2004.Expenditures as of December 31, 2002 are $558 million and SER has commitments of $70 millionrelated to this project. Most project expenditures are financed through a synthetic lease agreement.Financing under the synthetic lease in excess of $280 million requires 103 percent collateralizationthrough the purchase of U.S. Treasury obligations in similar amounts. As of December 31, 2002, thecompany had purchased $228 million of U.S. Treasury obligations as collateral, which is included ininvestments on the Consolidated Balance Sheets.
SEMPRA ENERGY 95.

SER, as construction agent for the lessor, is responsible for completing construction in a timelymanner. Upon completion of Mesquite Power, SER is required to make lease payments to the lessor inan amount sufficient to provide a specified return to the investors. In 2005, SER has the option toextend the lease at fair market value, purchase the project at a fixed amount, or act as remarketingagent for the lessor to sell the project. If SER elects the remarketing option, it may be required to paythe lessor up to 85 percent of the project cost if the proceeds from remarketing are insufficient to repaythe lessor’s investors. The lease is guaranteed by Sempra Energy, and the availability of additionalfinancing is conditioned upon Sempra Energy’s continuing to have credit ratings of at least BBB- byS&P or Baa3 by Moody’s. The lease also requires Sempra Energy to maintain a debt-to-totalcapitalization ratio, (as defined in the lease), of not to exceed 65 percent. As a synthetic lease, neitherthe plant asset nor the related liability is included on the Consolidated Balance Sheets. If they were,property, plant and equipment and long-term debt would each have been increased by $545 million atDecember 31, 2002, reflecting reimbursements for costs incurred on the project, including costssubject to the collateralization requirements noted above. The company is currently reviewing thesynthetic lease to determine the application of FASB Interpretation 46 (FIN 46), “Consolidation ofVariable Interest Entities” related to the Mesquite Power Plant. Under FIN 46, the company would berequired to increase property, plant and equipment and long-term debt by the total costs incurred andsubject to collateralization requirements under the synthetic lease, as noted above. See furtherdiscussion of FIN 46 in Note 1.
In addition, as of December 31, 2002, SER has commitments of $73 million related to two natural gasturbines for use in future power plant development.
In the third quarter of 2002, SEI completed construction of the 140-mile Gasoducto Bajanorte Pipelinethat connects the Rosarito Pipeline south of Tijuana, Mexico, with a pipeline being built by PG&ECorporation that will connect to Arizona. The 30-inch pipeline can deliver up to 500 million cubic feetper day of natural gas to new generation facilities in Baja California, including SER’s Termoelectrica deMexicali power plant discussed above. Capacity on the pipeline is fully subscribed. Total capitalexpenditures of $124 million have been made by SEI through December 31, 2002.
Other Commitments and Contingencies
In May 2001, SER entered into a ten-year agreement with the DWR to supply up to 1,900 megawattsof power to the state. SER may, but is not obligated to, deliver most of this electricity from its projectedportfolio of plants in the western United States and Baja California, Mexico. If SER elects to use theseplants to supply the DWR, those sales would comprise more than two-thirds of the projected capacityof the plants. The profits from the sales to the DWR are significant to the company’s ability to increaseits earnings. Subsequent to the state’s signing of this contract and electricity-supply contracts withother vendors, various state officials have contended that the rates called for by the contracts are toohigh. These rates substantially exceed current spot-market prices for electricity, but are substantiallylower than those prevailing at the time the contracts were signed. This contract is discussed furtherunder “Litigation.”
In February 2002, the CPUC and the California Electricity Oversight Board petitioned the FERC todetermine that the contracts do not provide just and reasonable rates, and to abrogate or reform thecontracts. On April 24, 2002, the FERC ordered hearings on the complaints. The order requires thecomplainants to satisfy a “heavy” burden of proof to support a revision of the contracts, and cited theFERC’s long-standing policy to recognize the sanctity of contracts, from which it has deviated only in“extreme circumstances.” In December 2002, a FERC administrative law judge held formal hearingsand in January 2003 issued a partial, initial decision recommending that the validity of SER’s contractbe determined under a “public interest” standard that requires the complainants to satisfy a significantlyhigher standard of review to invalidate the SER contract than would a just and reasonable standard.Hearings began in December 2002 and settlement negotiations are ongoing. The FERC has indicated
SEMPRA ENERGY 96.

that it expects to issue a final decision by March 2003. The company believes that the contract priceswere fair, but had been discussing (and continues to be willing to further discuss) with the DWRchanging certain aspects of the contract (which would not affect the long-term profitability) in a mannermutually beneficial to SER and the state.
On October 31, 2002, SER completed the acquisition of Twin Oaks Power from Texas-New MexicoPower Company for $120 million. Located near Bremond, Texas, Twin Oaks Power is a 305-megawattlignite-fired power plant which provides electricity under a 5-year offtake agreement expiring inSeptember 2007. In connection with the acquisition, SER also assumed a contract which includesannual commitments to purchase lignite coal either until an aggregate minimum volume has beenachieved or through 2025. At December 31, 2002, SER’s future minimum payments under the lignitecoal agreement were $28 million for 2003, $27 million for 2004, $27 million for 2005, $23 million for2006, $23 million for 2007 and $310 million thereafter. The minimum payments have been adjusted forallowed shortfalls and 90 percent minimum contract requirements under the contract.
On March 21, 2002, the CPUC affirmed its decision prohibiting new direct access contracts afterSeptember 20, 2001, but rejected a proposal to make the prohibition retroactive to July 1, 2001.Contracts in place as of September 20, 2001 may be renewed or assigned to new parties. OnNovember 7, 2002, the CPUC issued a decision adopting DA exit fees with an interim cap of 2.7 centsper kWh for rates effective January 1, 2003. The CPUC is conducting further proceedings to determinewhether, or to what extent, the interim cap should be revised after July 1, 2003. The CPUC’s decisionsconcerning direct access affect SES’ ability to enter into contracts to sell electricity in California.
Environmental Issues
The company’s operations are subject to federal, state and local environmental laws and regulationsgoverning hazardous wastes, air and water quality, land use, solid waste disposal and the protection ofwildlife. Most of the environmental issues faced by the company occur at the California Utilities.However, as SER constructs new power plants, additional environmental issues will arise requiring thecompany’s attention. As applicable, appropriate and relevant, these laws and regulations require thatthe company investigate and remediate the effects of the release or disposal of materials at sitesassociated with past and present operations, including sites at which the company has been identifiedas a Potentially Responsible Party (PRP) under the federal Superfund laws and comparable statelaws. Costs incurred at the California Utilities to operate the facilities in compliance with these laws andregulations generally have been recovered in customer rates.
Significant costs incurred to mitigate or prevent future environmental contamination or extend the life,increase the capacity or improve the safety or efficiency of property utilized in current operations arecapitalized. The company’s capital expenditures to comply with environmental laws and regulationswere $8 million in 2002, $6 million in 2001 and $4 million in 2000. The cost of compliance with theseregulations over the next five years is not expected to be significant.
At the California Utilities, costs that relate to current operations or an existing condition caused by pastoperations are generally recorded as a regulatory asset due to the assurance that these costs will berecovered in rates.
The environmental issues currently facing the company or resolved during the latest three-year periodinclude investigation and remediation of the California Utilities’ manufactured-gas sites (25 completedas of December 31, 2002 and 20 to be completed), cleanup at SDG&E’s former fossil fuel power plants(all sold in 1999 and actual or estimated cleanup costs included in the transactions), cleanup of third-party waste-disposal sites used by the company, which has been identified as a PRP (investigationsand remediations are continuing) and mitigation of damage to the marine environment caused by thecooling-water discharge from SONGS (the requirements for enhanced fish protection, a 150-acreartificial reef and restoration of 150 acres of coastal wetlands are in process). Through December 31,2003, the SONGS mitigation costs are recovered through the ICIP mechanism.
SEMPRA ENERGY 97.

Environmental liabilities are recorded when the company’s liability is probable and the costs arereasonably estimable. In many cases, however, investigations are not yet at a stage where thecompany has been able to determine whether it is liable or, if the liability is probable, to reasonablyestimate the amount or range of amounts of the cost or certain components thereof. Estimates of thecompany’s liability are further subject to other uncertainties, such as the nature and extent of sitecontamination, evolving remediation standards and imprecise engineering evaluations. The accrualsare reviewed periodically and, as investigations and remediation proceed, adjustments are made asnecessary. At December 31, 2002, the company’s accrued liability for environmental matters was$57.8 million, of which $42.7 million related to manufactured-gas sites, $12.1 million to cleanup atSDG&E’s former fossil-fueled power plants, $2.3 million to waste-disposal sites used by the company(which has been identified as a PRP) and $0.7 million to other hazardous waste sites. The accruals forthe manufactured-gas and waste-disposal sites are expected to be paid ratably over the next fouryears. The accruals for SDG&E’s former fossil-fueled power plants are expected to be paid ratablyover the next three years.
Nuclear Insurance
SDG&E and the other co-owners of SONGS have insurance to respond to any nuclear liability claimsrelated to SONGS. The insurance policy provides $200 million in coverage, which is the maximumamount available. In addition to this primary financial protection, the Price-Anderson Act provides forup to $9.25 billion of secondary financial protection if the liability loss exceeds the insurance limit.Should any of the licensed/commercial reactors in the United States experience a nuclear liability losswhich exceeds the $200 million insurance limit, all utilities owning nuclear reactors could be assessedunder the Price-Anderson Act to provide the secondary financial protection. SDG&E and the other co-owners of SONGS could be assessed up to $176 million under the Price-Anderson Act. SDG&E’sshare would be $36 million unless default occurs by any other SONGS co-owner. In the event thesecondary financial protection limit is insufficient to cover the liability loss, the Price-Anderson Actprovides for Congress to enact further revenue raising measures to pay claims. These measures couldinclude an additional assessment on all licensed reactor operators. SDG&E and the other co-owners ofSONGS have $2.75 billion of nuclear property, decontamination and debris removal insurance. Thecoverage also provides the SONGS owners up to $490 million for outage expenses incurred becauseof accidental property damage. This coverage is limited to $3.5 million per week for the first 52 weeks,and $2.8 million per week for up to 110 additional weeks. Coverage is also provided for the cost ofreplacement power, which includes indemnity payments for up to three years, after a waiting period of12 weeks. The insurance is provided through a mutual insurance company owned by utilities withnuclear facilities. Under the policy’s risk sharing arrangements, insured members are subject toretrospective premium assessments if losses at any covered facility exceed the insurance company’ssurplus and reinsurance funds. Should there be a retrospective premium call, SDG&E could beassessed up to $7.6 million.
Both the nuclear liability and property insurance programs include industry aggregate limits for SONGSlosses resulting from acts of terrorism.
Department Of Energy Decommissioning
The Energy Policy Act of 1992 established a fund for the decontamination and decommissioning of theDepartment of Energy (DOE) nuclear fuel enrichment facilities. Utilities which have used DOEenrichment services are being assessed a total of $2.3 billion, subject to adjustment for inflation, over a15-year period ending in 2006. Each utility’s share is based on its share of enrichment servicespurchased from the DOE through 1992. SDG&E’s annual assessment is approximately $1 million,which is recovered through SONGS revenue.
SEMPRA ENERGY 98.

Department Of Energy Nuclear Fuel Disposal
The Nuclear Waste Policy Act of 1982 made the DOE responsible for the disposal of spent nuclearfuel. However, it is uncertain when the DOE will begin accepting spent nuclear fuel from SONGS. Thisdelay by the DOE will lead to increased cost for spent fuel storage. This cost will be recovered throughSONGS revenue unless the company is able to recover the increased cost from the federalgovernment.
Litigation
Lawsuits filed in 2000 and currently consolidated in San Diego Superior Court seek class-actioncertification and damages, alleging that Sempra Energy, SoCalGas and SDG&E, along with El PasoEnergy Corp. and several of its affiliates, unlawfully sought to control and have manipulated naturalgas and electricity markets. On October 16, 2002, the assigned San Diego Superior Court judge ruledthat the case can proceed with discovery and that the California courts, rather than the FERC, havejurisdiction in the case. This was a preliminary ruling and not a ruling on the merits or facts of the case.Northern California cases, which only name El Paso as a defendant, are scheduled for trial inSeptember 2003 and the remainder of the cases are set for trial in January 2004. During the fourthquarter of 2002, additional similar lawsuits have been filed in various jurisdictions.
Various 2000 lawsuits, which seek class-action certification, allege that certain company subsidiariesunlawfully manipulated the electric-energy market. These lawsuits were consolidated in San DiegoSuperior Court by order of the Judicial Council, but have recently been removed to Federal Courtwhere motions to remand are pending. Similar, subsequent lawsuits are expected to be consolidatedwith the existing matters in San Diego.
SER is a defendant in an action brought by Occidental Energy Ventures Corporation with respect tothe Elk Hills power project being jointly developed by the two companies. Occidental alleges that SERbreached the joint venture agreement by not providing that Occidental would be a party to the contractwith the DWR or receiving its share of the proceeds from providing the DWR with power from Elk Hillsunder the contract. The court has ordered that the agreement requires the matter be arbitrated inaccordance with the agreement.
SER, SET and SDG&E, along with all other sellers in the western power market, have been nameddefendants in a complaint filed at the FERC by the California Attorney General’s office seeking refundsfor electricity purchases based on alleged violations of FERC tariffs. The FERC has dismissed thecomplaint. The California Attorney General’s office requested a rehearing, which the FERC denied.The California Attorney General has filed an appeal in the 9th Circuit.
Except for the matters referred to above, neither the company nor its subsidiaries are party to, nor istheir property the subject of, any material pending legal proceedings other than routine litigationincidental to their businesses.
Management believes the above allegations are without merit and will not have a material adverseeffect on the company’s financial condition or results of operations.
Other Legal Proceedings
In connection with its investigation into California energy prices, in May 2002 the FERC ordered allenergy companies engaged in electric energy trading activities to state whether they had engaged in“death star,” “load shift,” “wheel out,” “ricochet,” “inc-ing load” and various other specific tradingactivities as described in memos prepared by attorneys retained by Enron Corporation and in which itwas asserted that Enron was manipulating or “gaming” the California energy markets. In response to
SEMPRA ENERGY 99.

the inquiry, Sempra Energy’s electricity trading subsidiaries have denied using any of these strategies.SDG&E did disclose and explain a single de minimus 100-mW transaction for the export of electricityout of California. In response to a related FERC inquiry regarding natural gas trading, SDG&E andSoCalGas have also denied engaging in “wash” or “round trip” trading activities. The companies arealso cooperating with the FERC and other governmental agencies and officials in their variousinvestigations of the California energy markets.
In October 2002, the FERC also requested the largest North American natural gas marketers in 2001to submit information regarding natural gas trading data provided by these marketers to energy tradepublications in 2000 and 2001. During this period individual employees at SET received unsolicitedinformation requests from trade publications, many of which were telephone inquiries seeking animmediate telephonic response. SET has advised the FERC and the Commodity Futures TradingCommission (CFTC) that, out of several hundred communications during the relevant period, priceswere inaccurately reported by perhaps $.01 to $.02 per mmbtu on a handful of occasions involving anarea in the Rocky Mountain region. No records of these telephone conversations exist. SET has alsoadvised the FERC that it has found no instances involving inaccurate written information provided bySET to trade publications and is cooperating with the CFTC’s inquiries about the matter.
On May 28, 2002, SER filed a complaint for declaratory judgment in San Diego Superior Courtregarding its contract with the DWR. In addition to other relief, SER is seeking a binding declarationfrom the court that, contrary to DWR’s stated position, SER is meeting the terms of the agreement andthat DWR is obligated to take delivery of and pay for wholesale electric power, as provided for underthe agreement. In response to SER’s complaint for a declaratory judgment, on July 2, 2002, the DWRfiled a cross-complaint against SER, seeking to void the 10-year energy-supply contract by allegingthat SER misrepresented its intentions regarding the Elk Hills Power Plant as well as the other plantscurrently under construction. The DWR continues to accept all scheduled power from SER and hasmade all payments for such power. The construction of the Elk Hills Power Plant is on schedule tobegin operating in the spring of 2003. The DWR has stated its belief that the contract requires SER tobuild power plants to supply the contract and, specifically, required the Elk Hills plant to beginoperations of a simple-cycle function while completing its combined cycle facility. SER denies both ofthese contentions and insists that it may supply the power as it chooses, although it has the option ofsupplying the DWR from one or more of the plants. Trial has been scheduled for May 2003. Additionalinformation regarding the contract between SER and the DWR is included under “Other Commitmentsand Contingencies” and “FERC Actions” above.
SER is a defendant in an action brought by the CPUC and the California Electricity Oversight Board atthe FERC alleging that, because of the dysfunctional energy market in California, the long-term powercontracts entered into by the DWR should be revised or set aside as being unjust and unreasonable.Additional information regarding this complaint and the contract between SER and the DWR isincluded under “Other Commitments and Contingencies” and “FERC Actions” above.
SET is a defendant in the action at the FERC concerning rates charged certain utilities by sellers ofelectricity. Management believes it has provided fully for any adverse outcomes of this action.
At December 31, 2002, SET remains due approximately $100 million from energy sales made in 2000and 2001 through the California Independent System Operator and the PX markets. The collection ofthese receivables depends on satisfactory resolution of the financial difficulties being experienced byother California IOUs as a result of the California electric industry crisis. SET has submitted relevantclaims in the PG&E and PX bankruptcy proceedings. The company believes adequate reserves havebeen recorded.
Management believes that these matters will not have a material adverse effect on the company’sfinancial condition or results of operations.
SEMPRA ENERGY 100.

Electric Distribution System Conversion
Under a CPUC-mandated program and through franchise agreements with various cities, SDG&E iscommitted, in varying amounts, to converting overhead distribution facilities to underground. As ofDecember 31, 2002, the aggregate unexpended amount of this commitment was $98 million. Capitalexpenditures for underground conversions were $33 million in 2002, $12 million in 2001 and $26million in 2000.
Concentration Of Credit Risk
The company maintains credit policies and systems to manage overall credit risk. These policiesinclude an evaluation of potential counterparties’ financial condition and an assignment of credit limits.These credit limits are established based on risk and return considerations under terms customarilyavailable in the industry. The California Utilities grant credit to utility customers and counterparties,substantially all of whom are located in their service territories, which together cover most of SouthernCalifornia and a portion of central California.
As discussed in Note 13, SDG&E accumulated certain costs of electricity purchases in a balancingaccount (the AB 265 undercollection). SDG&E may experience an increase in customer credit risk as itpasses on these costs to customers, as well as charges on behalf of the state of California to repay thestate bonds issued in connection with its past purchases of power for IOU customers. However,mitigating this increase in customer credit risk are the decline in the cost of the electric commodity andreturn to stability thereof, and the October 2002 CPUC decision which allows SDG&E to enter into newcontracts to procure electric energy and to establish a cost recovery mechanism. The decisionestablishes a semiannual cost review and rate recovery mechanism with a trigger for more frequentrate changes if balances exceed five percent of annual, non-DWR generation revenues, to provide fortimely recovery of any undercollections.
SET monitors and controls its credit-risk exposures through various systems which evaluate its creditrisk, and through credit approvals and limits. To manage the level of credit risk, SET deals with amajority of counterparties with good credit standing, enters into master netting arrangements wheneverpossible and, where appropriate, obtains collateral. Master netting agreements incorporate rights ofsetoff that provide for the net settlement of subject contracts with the same counterparty in the event ofdefault.
NOTE 16. SEGMENT INFORMATION
The company is a holding company, whose subsidiaries are primarily engaged in the energy business.It has four separately managed reportable segments comprised of SoCalGas, SDG&E, SET and SER.(During the third quarter of 2002, SER first met the requirements for disclosure as a reportablesegment.) The California Utilities operate in essentially separate service territories under separateregulatory frameworks and rate structures set by the CPUC. SDG&E provides electric service to SanDiego and southern Orange counties and natural gas service to San Diego county. SoCalGas is anatural gas distribution utility, serving customers throughout most of southern California and part ofcentral California. SET, based in Stamford, Connecticut, is a wholesale trader of physical and financialenergy products and other commodities, and a trader and wholesaler of metals, serving a broad rangeof customers in the United States, Canada, Europe and Asia. SER develops, owns and operatespower plants and natural gas storage, production and transportation facilities within the western UnitedStates and Baja California, Mexico.
The accounting policies of the segments are described in Note 1, and segment performance isevaluated by management based on reported net income. California Utility transactions are based onrates set by the CPUC and FERC.
SEMPRA ENERGY 101.

Years ended December 31,
(Dollars in millions) 2002 2001 2000
OPERATING REVENUESSouthern California Gas $2,858 $3,716 $2,854San Diego Gas & Electric 1,696 2,362 2,671Sempra Energy Trading 821 1,047 822Sempra Energy Resources 349 178 11All other 333 458 467Intersegment revenues (37) (31) (65)
Total $6,020 $7,730 $6,760
INTEREST INCOMESouthern California Gas $ 5 $ 22 $ 27San Diego Gas & Electric 10 21 51Sempra Energy Trading 11 11 8Sempra Energy Resources 4 6 —All other 84 73 88Intercompany elimination (72) (50) (106)
Total interest income 42 83 68Equity in income (losses) of unconsolidated affiliates (55) 12 62Sundry income (loss) 70 (9) (3)
Total other income $ 57 $ 86 $ 127
DEPRECIATION AND AMORTIZATIONSouthern California Gas $ 276 $ 268 $ 263San Diego Gas & Electric 230 207 210Sempra Energy Trading 21 27 32Sempra Energy Resources 2 1 2All other 67 76 56
Total $ 596 $ 579 $ 563
INTEREST EXPENSESouthern California Gas $ 44 $ 68 $ 74San Diego Gas & Electric 77 92 118Sempra Energy Trading 43 14 18Sempra Energy Resources 6 7 3All other 196 192 179Intercompany elimination (72) (50) (106)
Total $ 294 $ 323 $ 286
INCOME TAX EXPENSE (BENEFIT)Southern California Gas $ 178 $ 169 $ 183San Diego Gas & Electric 91 141 144Sempra Energy Trading 60 87 63Sempra Energy Resources 36 (18) 15All other (219) (166) (135)
Total $ 146 $ 213 $ 270
NET INCOME (LOSS)Southern California Gas $ 212 $ 207 $ 206San Diego Gas & Electric 203 177 145Sempra Energy Trading 126 196 155Sempra Energy Resources 60 (27) 29All other (10) (35) (106)
Total $ 591 $ 518 $ 429
SEMPRA ENERGY 102.

At December 31 or years endedDecember 31,
(Dollars in millions) 2002 2001 2000
ASSETSSouthern California Gas $ 4,079 $ 3,733 $ 4,128San Diego Gas & Electric 5,123 5,399 4,734Sempra Energy Trading 5,614 2,997 4,627Sempra Energy Resources 1,347 577 276All other 2,580 3,094 2,421Intersegment receivable (986) (720) (646)
Total $17,757 $15,080 $15,540
CAPITAL EXPENDITURESSouthern California Gas $ 331 $ 294 $ 198San Diego Gas & Electric 400 307 324Sempra Energy Trading 21 45 22Sempra Energy Resources 356 225 59All other 106 197 156
Total $ 1,214 $ 1,068 $ 759
GEOGRAPHIC INFORMATIONLong-lived assets
United States $ 7,062 $ 6,515 $ 6,071Latin America 1,062 836 911Europe 18 10 9Canada 3 24 23
Total $ 8,145 $ 7,385 $ 7,014
Operating revenuesUnited States $ 5,475 $ 7,169 $ 6,423Latin America 168 280 154Europe 328 250 158Canada 28 15 14Asia 21 16 11
Total $ 6,020 $ 7,730 $ 6,760
SEMPRA ENERGY 103.

NOTE 17. QUARTERLY FINANCIAL DATA (UNAUDITED)
Quarters ended (Dollars in millions, except per share amounts) March 31 June 30 September 30 December 31
2002Operating revenues $1,460 $1,488 $1,384 $1,688Operating expenses 1,209 1,260 1,074 1,490
Operating income $ 251 $ 228 $ 310 $ 198
Income before extraordinary item $ 146 $ 145 $ 150 $ 134Net income $ 146 $ 147 $ 150 $ 148Average common shares outstanding (diluted) 206.4 207.1 205.4 205.6Income per common share before extraordinary
item (diluted) $ 0.71 $ 0.70 $ 0.73 $ 0.65Net income per common share (diluted) $ 0.71 $ 0.71 $ 0.73 $ 0.72
2001Operating revenues $3,119 $1,895 $1,417 $1,299Operating expenses 2,747 1,623 1,198 1,165
Operating income $ 372 $ 272 $ 219 $ 134
Net income $ 178 $ 137 $ 96 $ 107Average common shares outstanding (diluted) 203.0 206.0 206.6 206.0Net income per common share (diluted) $ 0.88 $ 0.66 $ 0.46 $ 0.52
Reclassifications have been made to certain of the amounts since they were presented in the QuarterlyReports on Form 10-Q.
QUARTERLY COMMON STOCK DATA (UNAUDITED)First
QuarterSecondQuarter
ThirdQuarter
FourthQuarter
2002Market price
High $25.92 $26.25 $24.11 $24.62Low 22.15 21.52 15.50 16.70
2001Market price
High $23.94 $28.61 $28.00 $26.68Low 17.31 21.98 23.25 22.00
Dividends declared were $0.25 in each quarter.
FORM 10-K
Sempra Energy’s annual report to the Securities and Exchange Commission on Form 10-K is availableto shareholders at no charge by writing to Shareholder Services at 101 Ash Street, San Diego, CA92101.
SEMPRA ENERGY 104.

© 2003 Sempra Energy. All copyright and trademark rights reserved.
101 Ash Street, San Diego, California 92101-3017 www.sempra.com