semi-annual report october 31,...
TRANSCRIPT

WCM Focused International Growth Fund (Investor Class: WCMRX)
(Institutional Class: WCMIX)
WCM Focused Emerging Markets Fund (Investor Class: WFEMX)
(Institutional Class: WCMEX)
WCM Focused Global Growth Fund (Investor Class: WFGGX)
(Institutional Class: WCMGX)
WCM International Small Cap Growth Fund (Institutional Class: WCMSX)
SEMI-ANNUAL REPORT October 31, 2016

www.wcminvestfunds.com
WCM Focused International Growth Fund WCM Focused Emerging Markets Fund
WCM Focused Global Growth Fund WCM International Small Cap Growth Fund
Each a series of Investment Managers Series Trust
Table of Contents
Schedules of Investments ........................................................................................................................... 1 Statements of Assets and Liabilities ....................................................................................................... 17
Statements of Operations ........................................................................................................................ 19
Statements of Changes in Net Assets ..................................................................................................... 21 Financial Highlights ................................................................................................................................... 25
Notes to Financial Statements................................................................................................................. 32 Expense Examples ..................................................................................................................................... 44
This report and the financial statements contained herein are provided for the general information of the shareholders of the WCM Funds. This report is not authorized for distribution to prospective investors in the Funds unless preceded or accompanied by an effective Prospectus.

WCM Focused International Growth Fund SCHEDULE OF INVESTMENTS As of October 31, 2016 (Unaudited)
Number of Shares Value __________ ____________
COMMON STOCKS – 93.2%
AUSTRALIA – 4.0%
1,471,513 CSL Ltd.
$ 112,507,053
____________ BERMUDA – 1.9%
1,461,899 Lazard Ltd. - Class A
53,300,837
____________ BRAZIL – 2.1%
9,686,943 Ambev S.A. - ADR
57,152,964
____________ CANADA – 6.8%
761,287 Canadian Pacific Railway Ltd.
108,833,590
170,075 Constellation Software, Inc.
79,673,918
____________ 188,507,508
____________ CHINA – 6.9%
1,910,720 Ctrip.com International Ltd. - ADR
* 84,358,288
4,083,710 Tencent Holdings Ltd.
108,363,959
____________ 192,722,247
____________ DENMARK – 10.4%
1,155,097 Chr Hansen Holding A/S
69,178,306
1,145,461 Coloplast A/S - Class B
79,927,678
2,059,779 Novo Nordisk A/S - ADR
73,204,546
1,773,589 Novozymes A/S
65,883,342
____________ 288,193,872
____________ FRANCE – 7.5%
620,513 Essilor International S.A.
69,748,113
153,807 Hermes International
62,316,316
424,556 LVMH Moet Hennessy Louis Vuitton S.E.
77,151,752
____________ 209,216,181
____________ GERMANY – 2.2%
374,459 adidas A.G.
61,409,632
____________ INDIA – 3.3%
1,276,223 HDFC Bank Ltd. - ADR
90,331,064
____________ IRELAND – 8.2%
717,296 Accenture PLC - Class A
83,378,487
4,369,206 Experian PLC
84,121,922
768,708 ICON PLC
* 61,711,878
____________ 229,212,287
____________ JAPAN – 6.0%
135,020 Keyence Corp.
99,214,658
1

WCM Focused International Growth Fund SCHEDULE OF INVESTMENTS - Continued As of October 31, 2016 (Unaudited)
Number of Shares Value __________ ____________
COMMON STOCKS (Continued) JAPAN (Continued) 981,950
Sysmex Corp.
$ 68,259,898
____________ 167,474,556
____________ MEXICO – 1.5%
19,467,323 Wal-Mart de Mexico S.A.B. de C.V.
41,188,204
____________ NETHERLANDS – 2.7%
775,868 Core Laboratories N.V.
75,235,920
____________
RUSSIA – 2.1%
2,971,628 Yandex N.V. - Class A
* 58,511,355
____________
SOUTH AFRICA – 2.9%
5,492,362 Shoprite Holdings Ltd.
81,058,755
____________
SPAIN – 1.5%
1,215,894 Industria de Diseno Textil S.A.
42,502,903
____________ SWITZERLAND – 11.1%
969,512 Chubb Ltd.
123,128,024
1,524,271 Nestle S.A.
110,515,808
37,596 SGS S.A.
76,210,162
____________ 309,853,994
____________ TAIWAN – 4.6%
4,142,325 Taiwan Semiconductor Manufacturing Co., Ltd. - ADR
128,826,307
____________ UNITED KINGDOM – 7.5%
4,587,095 Compass Group PLC
83,151,624
1,418,067 Reckitt Benckiser Group PLC
126,931,750
____________ 210,083,374
____________
TOTAL COMMON STOCKS (Cost $2,450,725,462) 2,597,289,013
____________ SHORT-TERM INVESTMENTS – 6.2%
173,475,427 Fidelity Institutional Money Market Government Portfolio, 0.26%
1 173,475,427
____________
TOTAL SHORT-TERM INVESTMENTS (Cost $173,475,427) 173,475,427
____________
2
WCM Focused International Growth Fund SCHEDULE OF INVESTMENTS - Continued As of October 31, 2016 (Unaudited)
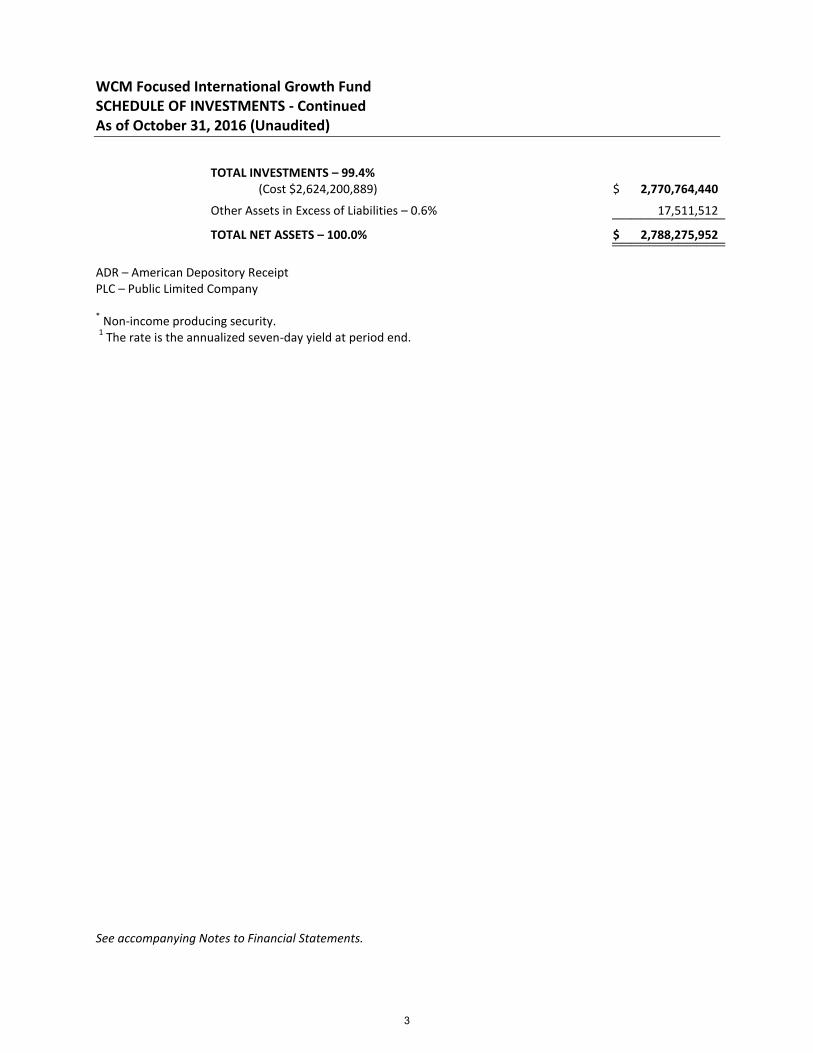
TOTAL INVESTMENTS – 99.4% (Cost $2,624,200,889) $ 2,770,764,440
Other Assets in Excess of Liabilities – 0.6%
17,511,512 ____________
TOTAL NET ASSETS – 100.0% $ 2,788,275,952 ____________ ____________
ADR – American Depository Receipt PLC – Public Limited Company * Non-income producing security.
1 The rate is the annualized seven-day yield at period end.
See accompanying Notes to Financial Statements.
3

WCM Focused International Growth Fund SUMMARY OF INVESTMENTS As of October 31, 2016 (Unaudited)
Security Type/Sector Percent of Total
Net Assets
Common Stocks Consumer Staples 17.4% Technology 17.4% Health Care 16.7% Consumer Discretionary 14.4% Financials 9.6% Industrials 7.5% Communications 5.1% Energy 2.7% Materials 2.4% __________
Total Common Stocks 93.2%
Short-Term Investments 6.2% __________ Total Investments 99.4% Other Assets in Excess of Liabilities 0.6% __________ Total Net Assets 100.0% __________ __________
See accompanying Notes to Financial Statements.
4

WCM Focused Emerging Markets Fund SCHEDULE OF INVESTMENTS As of October 31, 2016 (Unaudited)
Number of Shares Value __________ ____________
COMMON STOCKS – 98.2%
ARGENTINA – 5.8%
7,856 MercadoLibre, Inc.
$ 1,319,886
____________ BRAZIL – 8.8%
176,859 Ambev S.A. - ADR
1,043,468
43,100 Raia Drogasil S.A.
956,788
____________ 2,000,256
____________ CHINA – 14.7% 6,037
China Biologic Products, Inc.
* 713,030
24,241 Ctrip.com International Ltd. - ADR
* 1,070,240
336,920 Regina Miracle International Holdings Ltd.
1 344,931
46,590 Tencent Holdings Ltd.
1,236,296
____________ 3,364,497
____________ INDIA – 12.0% 31,028
Asian Paints Ltd.
499,831
1,506 Eicher Motors Ltd.
541,893
21,449 Godrej Consumer Products Ltd.
515,215
13,729 HDFC Bank Ltd. - ADR
971,739
17,989 Hindustan Unilever Ltd.
226,100
____________ 2,754,778
____________ INDONESIA – 7.4% 5,879,495
Kalbe Farma Tbk P.T.
784,053
1,658,730 Surya Citra Media Tbk P.T.
336,882
14,498 Telekomunikasi Indonesia Persero Tbk P.T. - ADR
471,040
233,130 Tower Bersama Infrastructure Tbk P.T.
106,756
____________ 1,698,731
____________ LUXEMBOURG – 1.2%
5,962 Globant S.A.
* 259,347
____________ MALAYSIA – 1.7% 256,100
IHH Healthcare Bhd
390,713
____________ MEXICO – 10.6%
126,490 Banregio Grupo Financiero S.A.B. de C.V.
828,767
24,185 Grupo Televisa SAB - ADR
593,258
204,690 Kimberly-Clark de Mexico S.A.B. de C.V. - Class A
441,414
266,720 Wal-Mart de Mexico S.A.B. de C.V.
564,316
____________ 2,427,755
____________ PHILIPPINES – 3.0%
183,145 Universal Robina Corp.
688,219
____________
5
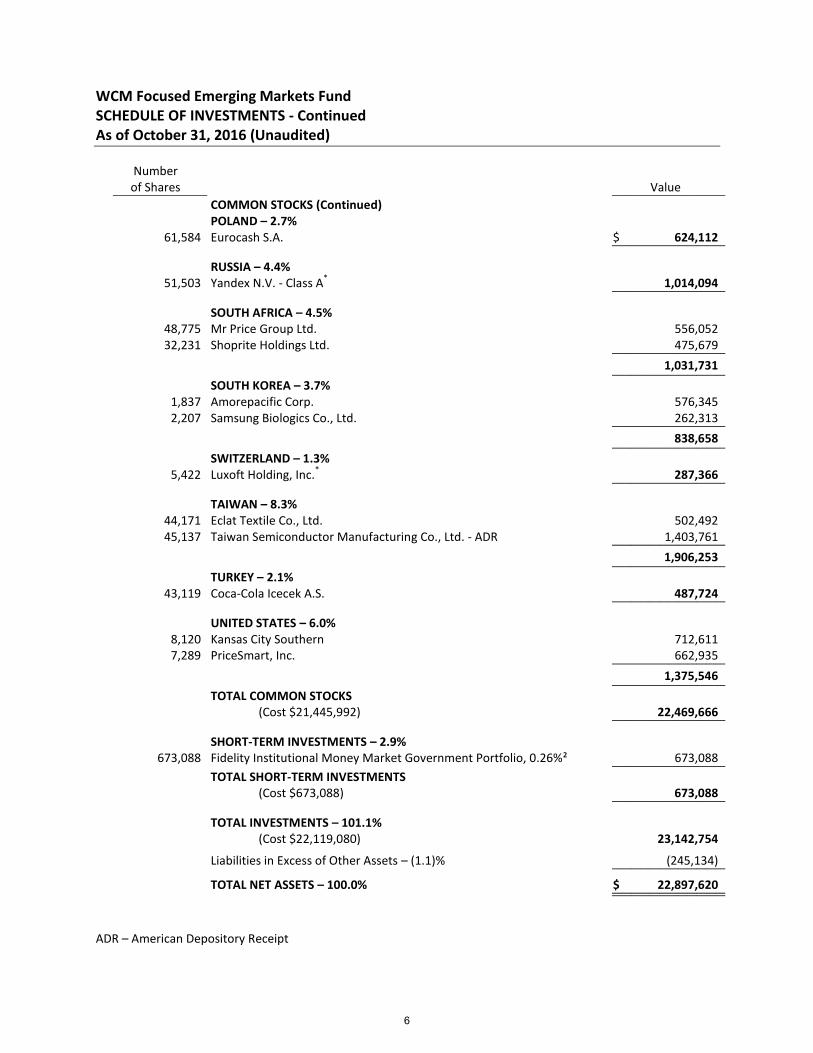
WCM Focused Emerging Markets Fund SCHEDULE OF INVESTMENTS - Continued As of October 31, 2016 (Unaudited)
Number of Shares Value __________ ____________
COMMON STOCKS (Continued) POLAND – 2.7%
61,584 Eurocash S.A.
$ 624,112
____________ RUSSIA – 4.4% 51,503
Yandex N.V. - Class A
* 1,014,094
____________ SOUTH AFRICA – 4.5%
48,775 Mr Price Group Ltd.
556,052
32,231 Shoprite Holdings Ltd.
475,679
____________ 1,031,731
____________ SOUTH KOREA – 3.7% 1,837
Amorepacific Corp.
576,345
2,207 Samsung Biologics Co., Ltd.
262,313
____________ 838,658
____________ SWITZERLAND – 1.3%
5,422 Luxoft Holding, Inc.
* 287,366
____________ TAIWAN – 8.3%
44,171 Eclat Textile Co., Ltd.
502,492
45,137 Taiwan Semiconductor Manufacturing Co., Ltd. - ADR
1,403,761
____________ 1,906,253
____________ TURKEY – 2.1%
43,119 Coca-Cola Icecek A.S.
487,724
____________ UNITED STATES – 6.0% 8,120
Kansas City Southern
712,611
7,289 PriceSmart, Inc.
662,935
____________ 1,375,546
____________
TOTAL COMMON STOCKS (Cost $21,445,992) 22,469,666
____________ SHORT-TERM INVESTMENTS – 2.9%
673,088 Fidelity Institutional Money Market Government Portfolio, 0.26%²
673,088
____________
TOTAL SHORT-TERM INVESTMENTS (Cost $673,088) 673,088
____________
TOTAL INVESTMENTS – 101.1% (Cost $22,119,080) 23,142,754
Liabilities in Excess of Other Assets – (1.1)%
(245,134) ____________
TOTAL NET ASSETS – 100.0% $ 22,897,620 ____________ ____________
ADR – American Depository Receipt
6

WCM Focused Emerging Markets Fund SCHEDULE OF INVESTMENTS - Continued As of October 31, 2016 (Unaudited) * Non-income producing security.
1 Security exempt from registration under Rule 144A of the Securities Act of 1933. These
securities are restricted and may be resold in transactions exempt from registration normally to qualified institutional buyers. The total value of these securities is $344,931. 2 The rate is the annualized seven-day yield at period end.
See accompanying Notes to Financial Statements.
7

WCM Focused Emerging Markets Fund SUMMARY OF INVESTMENTS As of October 31, 2016 (Unaudited)
Security Type/Sector Percent of Total
Net Assets
Common Stocks Consumer Staples 31.7% Communications 15.2% Technology 13.9% Consumer Discretionary 11.9% Health Care 9.4% Financials 7.9% Industrials 6.0% Materials 2.2%
Short-Term Investments 2.9% __________ Total Investments 101.1% Liabilities in Excess of Other Assets (1.1)% __________ Total Net Assets 100.0% __________ __________
See accompanying Notes to Financial Statements.
8

WCM Focused Global Growth Fund SCHEDULE OF INVESTMENTS As of October 31, 2016 (Unaudited)
Number of Shares Value __________ ____________
COMMON STOCKS – 94.9%
ARGENTINA – 3.5% 787
MercadoLibre, Inc.
$ 132,224
____________ CANADA – 3.0%
1,801 Canadian National Railway Co.
113,229
____________ CHINA – 7.6%
2,289 Ctrip.com International Ltd. - ADR
* 101,059
25,000 Techtronic Industries Co., Ltd.
94,126
3,325 Tencent Holdings Ltd.
88,231
____________ 283,416
____________ DENMARK – 4.0%
2,089 Novo Nordisk A/S - ADR
74,243
1,993 Novozymes A/S
74,034
____________ 148,277
____________ INDIA – 3.1% 1,666
HDFC Bank Ltd. - ADR
117,920
____________ NETHERLANDS – 2.2%
861 Core Laboratories N.V.
83,491
____________ SWITZERLAND – 7.3%
858 Chubb Ltd.
108,966
1,170 Nestle S.A.
84,830
39 SGS S.A.
79,056
____________ 272,852
____________ TAIWAN – 4.1% 4,884
Taiwan Semiconductor Manufacturing Co., Ltd. - ADR
151,892
____________ UNITED KINGDOM – 3.1%
1,288 Reckitt Benckiser Group PLC
115,289
____________ UNITED STATES – 57.0% 167
Amazon.com, Inc.
* 131,900
1,817 Amphenol Corp. - Class A
119,795
4,949 Boston Scientific Corp.
* 108,878
2,334 Brown-Forman Corp. - Class B
107,761
1,847 Cerner Corp.
* 108,197
693 Cooper Cos., Inc.
121,996
604 Costco Wholesale Corp.
89,314
1,224 Crown Castle International Corp. - REIT
111,372
978 Ecolab, Inc.
111,658
670 Edwards Lifesciences Corp.
* 63,797
9
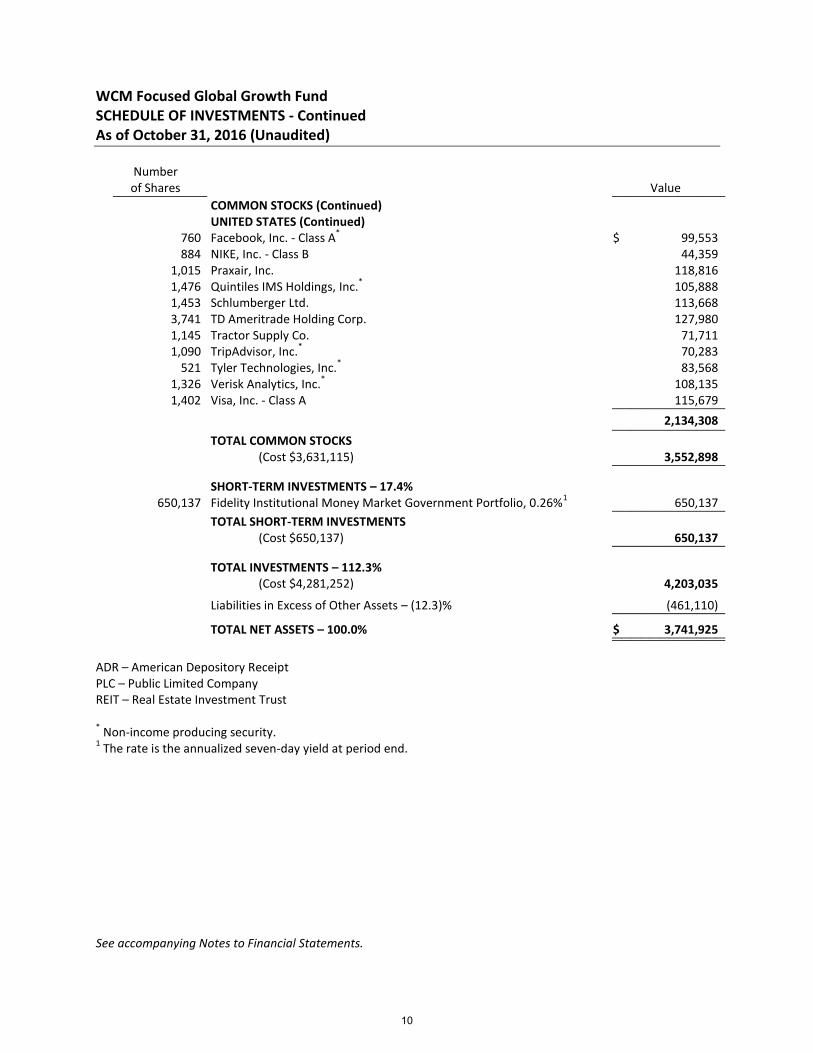
WCM Focused Global Growth Fund SCHEDULE OF INVESTMENTS - Continued As of October 31, 2016 (Unaudited)
Number of Shares Value __________ ____________
COMMON STOCKS (Continued) UNITED STATES (Continued) 760
Facebook, Inc. - Class A
* $ 99,553
884 NIKE, Inc. - Class B
44,359
1,015 Praxair, Inc.
118,816
1,476 Quintiles IMS Holdings, Inc.
* 105,888
1,453 Schlumberger Ltd.
113,668
3,741 TD Ameritrade Holding Corp.
127,980
1,145 Tractor Supply Co.
71,711
1,090 TripAdvisor, Inc.
* 70,283
521 Tyler Technologies, Inc.
* 83,568
1,326 Verisk Analytics, Inc.
* 108,135
1,402 Visa, Inc. - Class A
115,679
____________ 2,134,308
____________
TOTAL COMMON STOCKS (Cost $3,631,115) 3,552,898
____________ SHORT-TERM INVESTMENTS – 17.4%
650,137 Fidelity Institutional Money Market Government Portfolio, 0.26%
1 650,137
____________
TOTAL SHORT-TERM INVESTMENTS (Cost $650,137) 650,137
____________
TOTAL INVESTMENTS – 112.3% (Cost $4,281,252) 4,203,035
Liabilities in Excess of Other Assets – (12.3)%
(461,110) ____________
TOTAL NET ASSETS – 100.0% $ 3,741,925 ____________ ____________
ADR – American Depository Receipt PLC – Public Limited Company REIT – Real Estate Investment Trust * Non-income producing security.
1 The rate is the annualized seven-day yield at period end.
See accompanying Notes to Financial Statements.
10

WCM Focused Global Growth Fund SUMMARY OF INVESTMENTS As of October 31, 2016 (Unaudited)
Security Type/Sector Percent of Total
Net Assets
Common Stocks Consumer Discretionary 17.8% Financials 15.5% Technology 14.4% Health Care 12.7% Consumer Staples 10.6% Communications 7.2% Industrials 6.2% Energy 5.3% Materials 5.2% __________
Total Common Stocks 94.9%
Short-Term Investments 17.4% __________ Total Investments 112.3% Liabilities in Excess of Other Assets (12.3)% __________ Total Net Assets 100.0% __________ __________
See accompanying Notes to Financial Statements.
11

WCM International Small Cap Growth Fund SCHEDULE OF INVESTMENTS As of October 31, 2016 (Unaudited)
Number of Shares Value __________ ____________
COMMON STOCKS – 95.0%
ARGENTINA – 1.8%
140 MercadoLibre, Inc.
$ 23,521
____________
AUSTRALIA – 5.8%
1,999 Bellamy's Australia Ltd.
17,289
120 Blackmores Ltd.
10,231
335 Domino's Pizza Enterprises Ltd.
16,373
4,865 oOh!media Ltd.
15,802
395 REA Group Ltd.
15,366
____________ 75,061
____________ BRAZIL – 3.1%
3,800 Embraer S.A.
20,417
900 Raia Drogasil S.A.
19,979
____________ 40,396
____________ CANADA – 3.3%
323 Dollarama, Inc.
24,136
530 Ritchie Bros Auctioneers, Inc.
18,327
____________ 42,463
____________ CHINA – 5.9%
161 China Biologic Products, Inc.
* 19,016
13,000 Regina Miracle International Holdings Ltd.
1 13,309
3,000 Shenzhou International Group Holdings Ltd.
19,902
12,000 Vitasoy International Holdings Ltd.
25,096
____________ 77,323
____________ DENMARK – 1.6%
445 DSV A/S
21,568
____________
GERMANY – 6.3%
330 AURELIUS Equity Opportunities S.E. & Co. KGaA
19,662
335 Nemetschek S.E.
20,887
254 Sartorius A.G.
19,955
105 XING A.G.
21,375
____________ 81,879
____________ INDIA – 3.7%
3,200 Syngene International Ltd.
1 27,802
1,063 Yes Bank Ltd.
20,181
____________ 47,983
____________ IRELAND – 3.0%
4,470 Greencore Group PLC
18,055
12

WCM International Small Cap Growth Fund SCHEDULE OF INVESTMENTS - Continued As of October 31, 2016 (Unaudited)
Number of Shares Value __________ ____________
COMMON STOCKS (Continued) IRELAND (Continued) 257
ICON PLC
* $ 20,632
____________ 38,687
____________ ITALY – 1.8%
390 Brembo S.p.A.
24,102
____________ JAPAN – 16.1%
450 Asahi Intecc Co., Ltd.
19,524
300 Hoshizaki Corp.
27,119
2,200 Infomart Corp.
26,160
1,300 MISUMI Group, Inc.
23,764
600 Nihon M&A Center, Inc.
19,539
875 Pigeon Corp.
24,697
100 Ryohin Keikaku Co., Ltd.
21,398
1,800 Start Today Co., Ltd.
31,651
1,200 Wellnet Corp.
15,070
____________ 208,922
____________ MALAYSIA – 3.4%
32,600 Karex Bhd
18,962
44,100 My EG Services Bhd
25,650
____________ 44,612
____________ MEXICO – 2.0%
4,000 Banregio Grupo Financiero S.A.B. de C.V.
26,208
____________ NETHERLANDS – 3.0%
680 Takeaway.com Holding B.V.
*1 15,992
1,920 Wessanen
22,941
____________ 38,933
____________ PHILIPPINES – 2.8%
13,490 Concepcion Industrial Corp.
17,273
4,100 Security Bank Corp.
18,664
____________ 35,937
____________ SOUTH KOREA – 4.5%
945 DuzonBizon Co., Ltd.
18,458
70 Hugel, Inc.
* 20,983
54 Medy-Tox, Inc.
19,198
____________ 58,639
____________ SWEDEN – 5.6%
1,795 Hexpol A.B.
14,756
898 Indutrade A.B.
16,693
114 Probi A.B.
* 5,112
13
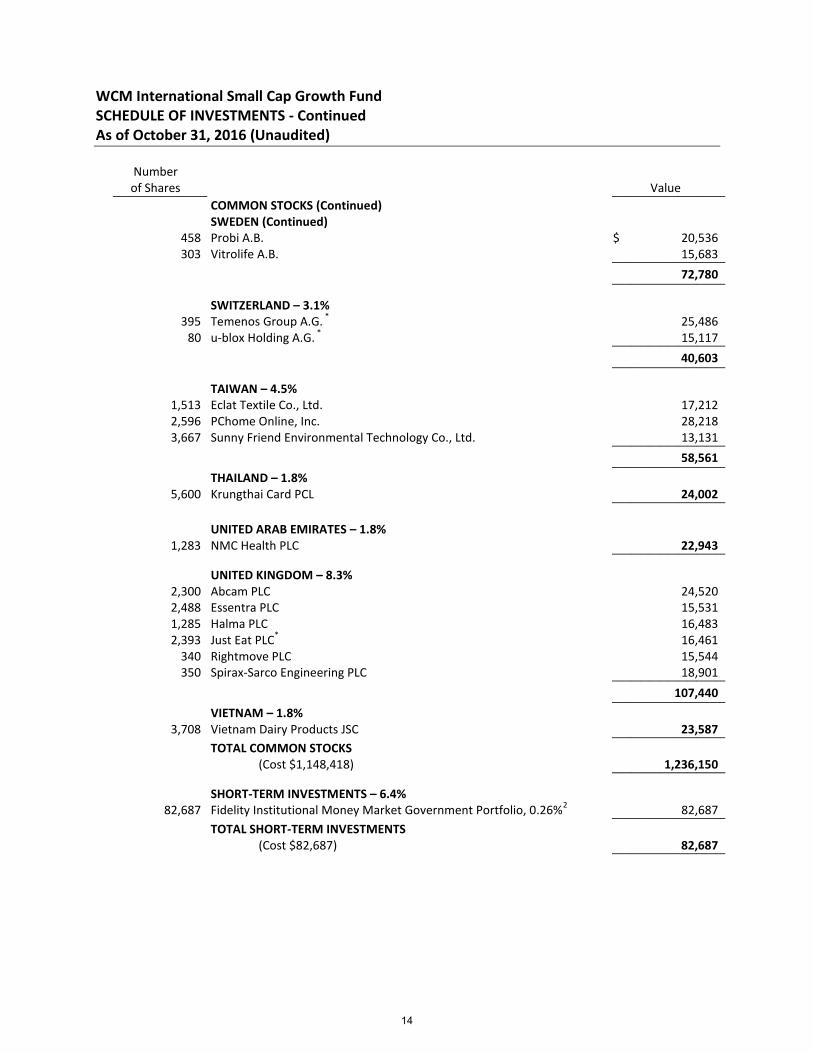
WCM International Small Cap Growth Fund SCHEDULE OF INVESTMENTS - Continued As of October 31, 2016 (Unaudited)
Number of Shares Value __________ ____________
COMMON STOCKS (Continued) SWEDEN (Continued) 458
Probi A.B.
$ 20,536
303 Vitrolife A.B.
15,683
____________ 72,780
____________ SWITZERLAND – 3.1%
395 Temenos Group A.G.
* 25,486
80 u-blox Holding A.G.
* 15,117
____________ 40,603
____________ TAIWAN – 4.5%
1,513 Eclat Textile Co., Ltd.
17,212
2,596 PChome Online, Inc.
28,218
3,667 Sunny Friend Environmental Technology Co., Ltd.
13,131
____________ 58,561
____________ THAILAND – 1.8%
5,600 Krungthai Card PCL
24,002
____________ UNITED ARAB EMIRATES – 1.8%
1,283 NMC Health PLC
22,943
____________ UNITED KINGDOM – 8.3%
2,300 Abcam PLC
24,520
2,488 Essentra PLC
15,531
1,285 Halma PLC
16,483
2,393 Just Eat PLC
* 16,461
340 Rightmove PLC
15,544
350 Spirax-Sarco Engineering PLC
18,901
____________ 107,440
____________ VIETNAM – 1.8%
3,708 Vietnam Dairy Products JSC
23,587
____________
TOTAL COMMON STOCKS (Cost $1,148,418) 1,236,150
____________ SHORT-TERM INVESTMENTS – 6.4%
82,687 Fidelity Institutional Money Market Government Portfolio, 0.26%
2 82,687
____________
TOTAL SHORT-TERM INVESTMENTS (Cost $82,687) 82,687
____________
14

WCM International Small Cap Growth Fund SCHEDULE OF INVESTMENTS - Continued As of October 31, 2016 (Unaudited) Value ____________
TOTAL INVESTMENTS – 101.4% (Cost $1,231,105) $ 1,318,837
Liabilities in Excess of Other Assets – (1.4)%
(17,841) ____________
TOTAL NET ASSETS – 100.0% $ 1,300,996 ____________ ____________
PCL – Public Company Limited PLC – Public Limited Company * Non-income producing security.
1 Security exempt from registration under Rule 144A of the Securities Act of 1933. These
securities are restricted and may be resold in transactions exempt from registration normally to qualified institutional buyers. The total value of these securities is $57,103. 2 The rate is the annualized seven-day yield at period end.
See accompanying Notes to Financial Statements.
15
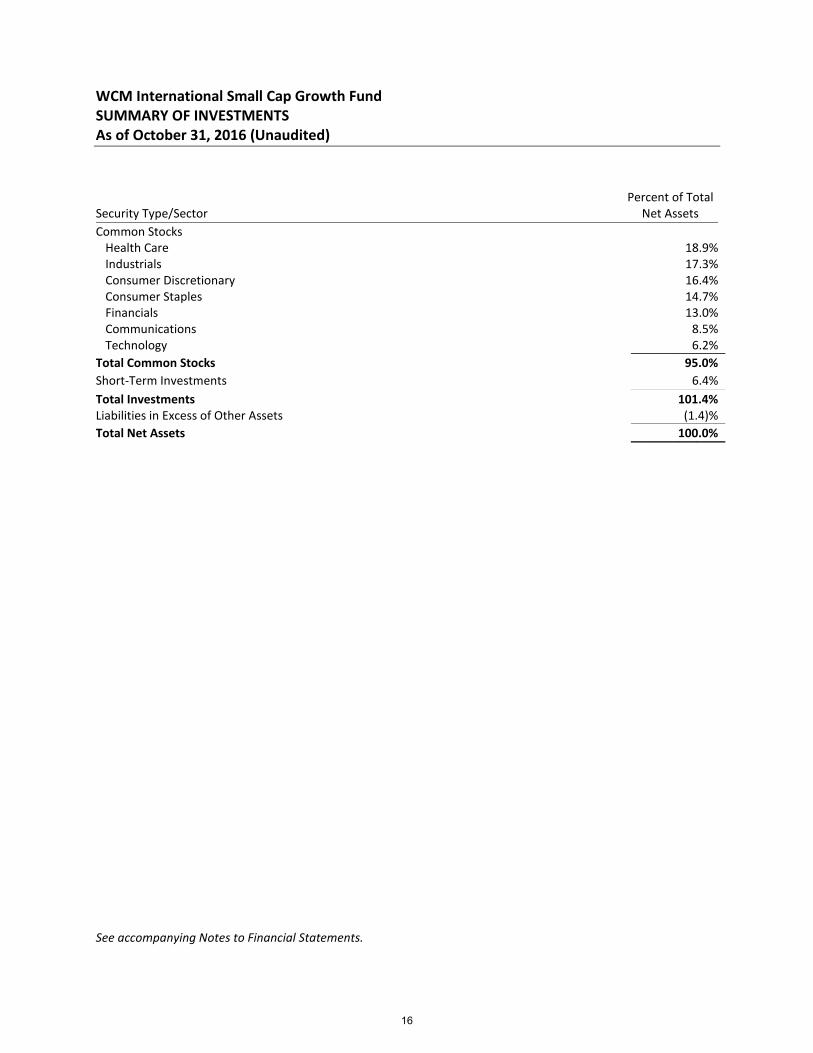
WCM International Small Cap Growth Fund SUMMARY OF INVESTMENTS As of October 31, 2016 (Unaudited)
Security Type/Sector Percent of Total
Net Assets
Common Stocks Health Care 18.9% Industrials 17.3% Consumer Discretionary 16.4% Consumer Staples 14.7% Financials 13.0% Communications 8.5% Technology 6.2% __________
Total Common Stocks 95.0%
Short-Term Investments 6.4% __________ Total Investments 101.4% Liabilities in Excess of Other Assets (1.4)% __________ Total Net Assets 100.0% __________ __________
See accompanying Notes to Financial Statements.
16

STATEMENTS OF ASSETS AND LIABILITIES
As of October 31, 2016 (Unaudited)
WCM Focused WCM Focused
International Growth Fund Emerging Markets Fund
Assets:Investments, at cost $ 2,624,200,889 $ 22,119,080
Investments, at value $ 2,770,764,440 $ 23,142,754
Receivables:
Investment securities sold 16,538,089 53,069
Fund shares sold 1,662,907 7,500
Dividends and interest 3,906,432 5,072
Due from Advisor - 25,622
Prepaid expenses 53,943 17,985
Total assets 2,792,925,811 23,252,002
Liabilities:
Payables:
Investment securities purchased - 264,936
Fund shares redeemed 1,680,044 -
Advisory fees 2,055,268 -
Shareholder servicing fees (Note 7) 175,452 14,170
Distribution fees (Note 8) 20,548 1,288
Fund administration fees 220,809 7,349
Custody fees 165,865 7,492
Transfer agent fees and expenses 118,409 8,360
Fund accounting fees 83,701 11,660
Auditing fees 8,955 8,576
Chief Compliance Officer fees 3,158 2,229
Trustees' fees and expenses 773 417
Non-U.S. Taxes - 17,181
Accrued other expenses 116,877 10,724
Total liabilities 4,649,859 354,382
Net Assets $ 2,788,275,952 $ 22,897,620
Components of Net Assets:
Paid-in capital (par value of $0.01 per share with an unlimited
number of shares authorized) $ 2,586,178,247 $ 22,940,398
Accumulated net investment income 10,752,912 174,264
Accumulated net realized gain (loss) on investments and
foreign currency transactions 44,818,941 (1,220,254)
Net unrealized appreciation (depreciation) on:
Investments 146,563,551 1,003,049 *
Foreign currency translations (37,699) 163
Net Assets $ 2,788,275,952 $ 22,897,620
Investor Class:
Net assets applicable to shares outstanding $ 96,812,988 $ 6,091,401
Shares of beneficial interest issued and outstanding 7,675,631 619,378
Net asset value, offering and redemption price per share $ 12.61 $ 9.83
Institutional Class:
Net assets applicable to shares outstanding $ 2,691,462,964 $ 16,806,219
Shares of beneficial interest issued and outstanding 212,457,028 1,702,900
Net asset value, offering and redemption price per share $ 12.67 $ 9.87
*Net of deferred non-U.S. taxes.
Maximum Offering Price per Share:
See accompanying Notes to Financial Statements.
17

STATEMENTS OF ASSETS AND LIABILITIES - Continued
As of October 31, 2016 (Unaudited)
WCM Focused WCM International
Global Growth Fund Small Cap Growth Fund
Assets:Investments, at cost $ 4,281,252 $ 1,231,105
Investments, at value $ 4,203,035 $ 1,318,837
Receivables:
Investment securities sold 18,705 -
Fund shares sold 23,200 -
Dividends and interest 17,081 1,042
Due from Advisor 20,707 -
Offering costs - 2,460
Prepaid expenses 25,453 17,616
Total assets 4,308,181 1,339,955
Liabilities:
Payables:
Investment securities purchased 490,557 -
Fund shares redeemed 14,213 -
Shareholder servicing fees (Note 7) 2,414 1,099
Distribution fees (Note 8) 458 -
Fund accounting fees 17,458 4,857
Fund administration fees 9,277 5,244
Transfer agent fees and expenses 9,240 5,316
Auditing fees 8,834 9,017
Chief Compliance Officer fees 1,096 887
Trustees' fees and expenses 975 537
Custody fees 476 1,054
Non-U.S. Taxes - 1,160
Offering costs - Advisor - 3,977
Accrued other expenses 11,258 5,811
Total liabilities 566,256 38,959
Net Assets $ 3,741,925 $ 1,300,996
Components of Net Assets:
Paid-in capital (par value of $0.01 per share with an unlimited
number of shares authorized) $ 3,407,332 $ 1,220,064
Accumulated net investment income (loss) 65,427 (4,510)
Accumulated net realized gain (loss) on investments and
foreign currency transactions 347,395 (1,112)
Net unrealized appreciation (depreciation) on:
Investments (78,217) 86,572 *
Foreign currency translations (12) (18)
Net Assets $ 3,741,925 $ 1,300,996
Investor Class:
Net assets applicable to shares outstanding $ 2,509,202 $ -
Shares of beneficial interest issued and outstanding 187,531 -
Net asset value, offering and redemption price per share $ 13.38 $ -
Institutional Class:
Net assets applicable to shares outstanding $ 1,232,723 $ 1,300,996
Shares of beneficial interest issued and outstanding 91,770 121,375
Net asset value, offering and redemption price per share $ 13.43 $ 10.72
*Net of deferred non-U.S. taxes.
Maximum Offering Price per Share:
See accompanying Notes to Financial Statements.
18

STATEMENTS OF OPERATIONS
For the Six Months Ended October 31, 2016 (Unaudited)
WCM Focused WCM Focused
International Growth Fund Emerging Markets Fund
Investment Income:
Dividends (net of foreign withholding taxes of $1,714,876 and $16,734, respectively) 16,850,342$ 120,640$
Interest 212,542 1,222
Total investment income 17,062,884 121,862
Expenses:
Advisory fees 11,317,382 93,894
Fund administration fees 724,972 21,732
Shareholder servicing fees (Note 7) 567,268 14,084
Custody fees 367,300 16,445
Transfer agent fees and expenses 178,248 15,785
Fund accounting fees 171,605 25,075
Distribution fees (Note 8) 102,989 7,552
Shareholder reporting fees 83,909 2,572
Registration fees 66,651 11,576
Miscellaneous 53,519 3,770
Legal fees 36,882 6,866
Auditing fees 8,850 8,850
Trustees' fees and expenses 8,079 3,552
Chief Compliance Officer fees 3,113 2,850
Insurance 2,527 424
Total expenses 13,693,294 235,027
Advisory fees waived - (93,894)
Other expenses absorbed - (141,133)
Net expenses 13,693,294 -
Net investment income 3,369,590 121,862
Realized and Unrealized Gain (Loss) on Investments and Foreign Currency:
Net realized gain (loss) on:
Investments 47,163,714 48,785 1
Foreign currency transactions (185,187) (13,402)
Net realized gain on investments and foreign currency transactions 46,978,527 35,383
Net change in unrealized appreciation/depreciation on:
Investments 15,795,003 529,230 2
Foreign currency translations (124,967) (134)
15,670,036 529,096
Net realized and unrealized gain on investments and foreign currency 62,648,563 564,479
Net Increase in Net Assets from Operations 66,018,153$ 686,341$
1Net of non-U.S. taxes $133.2Net of non-U.S. taxes $20,625.
Net change in unrealized appreciation/depreciation
See accompanying Notes to Financial Statements.
19

STATEMENTS OF OPERATIONS - Continued
For the Six Months Ended October 31, 2016 (Unaudited)
WCM Focused WCM International
Global Growth Fund Small Cap Growth Fund
Investment Income:
Dividends (net of foreign withholding taxes of $0 and $665, respectively) 6,185$ 8,549$
Interest 167 67
Total investment income 6,352 8,616
Expenses:
Fund accounting fees 26,898 26,450
Fund administration fees 21,831 17,755
Transfer agent fees and expenses 16,497 8,310
Registration fees 15,782 16,311
Auditing fees 8,850 9,018
Legal fees 8,086 7,065
Advisory fees 5,881 6,126
Custody fees 4,909 17,050
Miscellaneous 3,579 2,363
Trustees' fees and expenses 3,552 3,028
Chief Compliance Officer fees 2,775 2,177
Shareholder reporting fees 2,147 1,224
Shareholder servicing fees (Note 7) 1,059 916
Distribution fees (Note 8) 1,013 -
Insurance 654 498
Offering costs - 8,755
Total expenses 123,513 127,046
Advisory fees waived (5,881) (6,126)
Other expenses absorbed (117,632) (112,350)
Net expenses - 8,570
Net investment income 6,352 46
Realized and Unrealized Gain (Loss) on Investments and Foreign Currency:
Net realized gain (loss) on:
Investments 18,025 7,268
Foreign currency transactions 209 (566)
Net realized gain on investments and foreign currency transactions 18,234 6,702
Net change in unrealized appreciation/depreciation on:
Investments (80,491) 67,932 1
Foreign currency translations (667) (65)
(81,158) 67,867
Net realized and unrealized gain (loss) on investments and foreign currency (62,924) 74,569
Net Increase (Decrease) in Net Assets from Operations (56,572)$ 74,615$
1Net of non-U.S. taxes $1,160.
Net change in unrealized appreciation/depreciation
See accompanying Notes to Financial Statements.
20

STATEMENTS OF CHANGES IN NET ASSETS
Increase (Decrease) in Net Assets from:
Operations:
Net investment income $ 3,369,590 $ 9,911,134
46,978,527 1,055,447
and foreign currency translations 15,670,036 (22,388,957)
Net increase (decrease) in net assets resulting from operations 66,018,153 (11,422,376)
Distributions to Shareholders:
From net investment income:
Investor class - (21,782)
Institutional class - (5,028,504)
From net realized gain:
Investor class - (546,691)
Institutional class - (13,986,586)
Total distributions to shareholders - (19,583,563)
Capital Transactions:
Net proceeds from shares sold:
Investor class 38,273,743 40,070,241
Institutional class 577,182,222 1,357,660,011
Reinvestment of distributions:
Investor class - 567,941
Institutional class - 17,703,270
Cost of shares redeemed:
Investor class1 (6,298,770) (46,487,960)
Institutional class2 (168,648,560) (206,450,983)
Net increase in net assets from capital transactions 440,508,635 1,163,062,520
Total increase in net assets 506,526,788 1,132,056,581
Net Assets:
Beginning of period 2,281,749,164 1,149,692,583
End of period $ 2,788,275,952 $ 2,281,749,164
Accumulated net investment income $ 10,752,912 $ 7,383,322
Capital Share Transactions:
Shares sold:
Investor class 2,977,160 3,289,192
Institutional class 45,179,226 112,111,618
Shares reinvested:
Investor class - 46,783
Institutional class - 1,454,665
Shares redeemed:
Investor class (494,318) (3,884,083)
Institutional class (13,214,113) (17,120,877)
Net increase in capital share transactions 34,447,955 95,897,298
1 Net of redemption fees of $1,094 and $9,581, respectively.2 Net of redemption fees of $36,148 and $18,568, respectively.
WCM Focused
International Growth Fund
Net change in unrealized appreciation/depreciation on investments
April 30, 2016
Net realized gain on investments and foreign currency transactions
(Unaudited)
For the
Six Months Ended For the
October 31, 2016 Year Ended
See accompanying Notes to Financial Statements.
21

STATEMENTS OF CHANGES IN NET ASSETS
Increase (Decrease) in Net Assets from:
Operations:
Net investment income $ 121,862 $ 107,243
35,383 (866,885)
and foreign currency translations 529,096 444,117
Net increase (decrease) in net assets resulting from operations 686,341 (315,525)
Distributions to Shareholders:
From net investment income:
Investor class - (13,918)
Institutional class - (31,974)
Total distributions - (45,892)
Capital Transactions:
Net proceeds from shares sold:
Investor class 377,466 1,113,138
Institutional class 5,814,568 4,172,013
Reinvestment of distributions:
Investor class - 13,918
Institutional class - 30,196
Cost of shares redeemed:
Investor class1 (202,005) (543,558)
Institutional class (438,891) (1,541,390)
Net increase in net assets from capital transactions 5,551,138 3,244,317
Total increase in net assets 6,237,479 2,882,900
Net Assets:
Beginning of period 16,660,141 13,777,241
End of period $ 22,897,620 $ 16,660,141
Accumulated net investment income $ 174,264 $ 52,402
Capital Share Transactions:
Shares sold:
Investor class 39,082 125,546
Institutional class 587,285 460,484
Shares reinvested:
Investor class - 1,573
Institutional class - 3,400
Shares redeemed:
Investor class (20,461) (60,050)
Institutional class (44,270) (168,122)
Net increase in capital share transactions 561,636 362,831
1 Net of redemption fees of $1 and $0, respectively.
For the
(Unaudited) April 30, 2016
Net realized gain (loss) on investments and foreign currency transactions
Net change in unrealized appreciation/depreciation on investments
WCM Focused
Emerging Markets Fund
Six Months Ended
October 31, 2016 For the Year Ended
See accompanying Notes to Financial Statements.
22
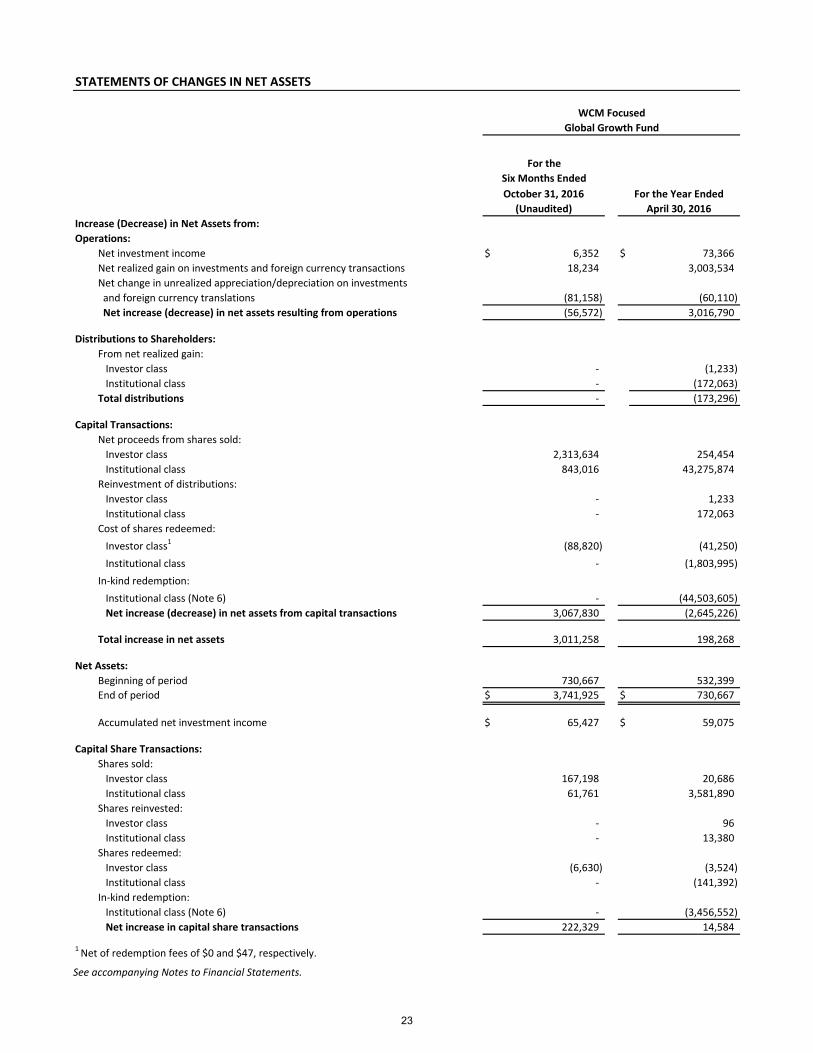
STATEMENTS OF CHANGES IN NET ASSETS
Increase (Decrease) in Net Assets from:
Operations:
Net investment income $ 6,352 $ 73,366
18,234 3,003,534
and foreign currency translations (81,158) (60,110)
Net increase (decrease) in net assets resulting from operations (56,572) 3,016,790
Distributions to Shareholders:
From net realized gain:
Investor class - (1,233)
Institutional class - (172,063)
Total distributions - (173,296)
Capital Transactions:
Net proceeds from shares sold:
Investor class 2,313,634 254,454
Institutional class 843,016 43,275,874
Reinvestment of distributions:
Investor class - 1,233
Institutional class - 172,063
Cost of shares redeemed:
Investor class1 (88,820) (41,250)
Institutional class - (1,803,995)
In-kind redemption:
Institutional class (Note 6) - (44,503,605)
Net increase (decrease) in net assets from capital transactions 3,067,830 (2,645,226)
Total increase in net assets 3,011,258 198,268
Net Assets:
Beginning of period 730,667 532,399
End of period $ 3,741,925 $ 730,667
Accumulated net investment income $ 65,427 $ 59,075
Capital Share Transactions:
Shares sold:
Investor class 167,198 20,686
Institutional class 61,761 3,581,890
Shares reinvested:
Investor class - 96
Institutional class - 13,380
Shares redeemed:
Investor class (6,630) (3,524)
Institutional class - (141,392)
In-kind redemption:
Institutional class (Note 6) - (3,456,552)
Net increase in capital share transactions 222,329 14,584
1 Net of redemption fees of $0 and $47, respectively.
October 31, 2016 For the Year Ended
For the
WCM Focused
Global Growth Fund
(Unaudited) April 30, 2016
Net realized gain on investments and foreign currency transactions
Net change in unrealized appreciation/depreciation on investments
Six Months Ended
See accompanying Notes to Financial Statements.
23

STATEMENTS OF CHANGES IN NET ASSETS
November 30, 2015*
through
April 30, 2016
Increase (Decrease) in Net Assets from:
Operations:
Net investment income (loss) $ 46 $ (581)
Net realized gain (loss) on investments and foreign currency transactions 6,702 (9,340)
Net change in unrealized appreciation/depreciation on investments
and foreign currency translations 67,867 18,687
Net increase in net assets resulting from operations 74,615 8,766
Distributions to Shareholders:
From net investment income:
Institutional class - (3,438)
Total distributions - (3,438)
Capital Transactions:
Net proceeds from shares sold:
Institutional class 602,615 615,000
Reinvestment of distributions:
Institutional class - 3,438
Net increase in net assets from capital transactions 602,615 618,438
Total increase in net assets 677,230 623,766
Net Assets:
Beginning of period 623,766 -
End of period $ 1,300,996 $ 623,766
Accumulated net investment loss $ (4,510) $ (4,556)
Capital Share Transactions:
Shares sold:
Institutional class 59,474 61,553
Shares reinvested:
Institutional class - 348
Net increase in capital share transactions 59,474 61,901
* Commencement of operations.
For the PeriodFor the
Six Months Ended
October 31, 2016
(Unaudited)
WCM International
Small Cap Growth Fund
See accompanying Notes to Financial Statements. 24

FIN
AN
CIA
L H
IGH
LIG
HTS
Per
sh
are
op
era
tin
g p
erfo
rma
nce
.
For
a c
ap
ita
l sh
are
ou
tsta
nd
ing
th
rou
gh
ou
t ea
ch p
erio
d.
For
the
Six
Mo
nth
sFo
r th
eFo
r th
eFo
r th
eFo
r th
eFo
r th
e P
eri
od
End
ed
Oct
ob
er
31
, 20
16
Ye
ar E
nd
ed
Ye
ar E
nd
ed
Ye
ar E
nd
ed
Ye
ar E
nd
ed
Au
gust
31
, 20
11
*
(Un
aud
ite
d)
Ap
ril 3
0, 2
01
6A
pri
l 30
, 20
15
Ap
ril 3
0, 2
01
4A
pri
l 30
, 20
13
thro
ugh
Ap
ril 3
0, 2
01
2
Ne
t as
set
valu
e, b
egi
nn
ing
of
pe
rio
d1
2.2
5$
12
.76
$
1
1.8
3$
10
.84
$
9
.47
$
9.2
9$
Inco
me
fro
m In
vest
me
nt
Op
era
tio
ns
Net
inve
stm
ent
inco
me1
-
2
0.0
5
0.0
5
0.0
3
0.0
4
0.0
9
Net
rea
lized
an
d u
nre
aliz
ed g
ain
(lo
ss)
on
inve
stm
ents
an
d f
ore
ign
cu
rren
cy0
.36
(0
.45
)
0.9
2
1.0
4
1.3
9
0.0
9
Tota
l fro
m in
vest
men
t o
per
atio
ns
0.3
6
(0.4
0)
0
.97
1
.07
1
.43
0
.18
Less
Dis
trib
uti
on
s:
Fro
m n
et in
vest
men
t in
com
e-
-
2
-
2
-
2
(0.0
3)
-
Fro
m n
et r
ealiz
ed g
ain
-
(0
.11
)
(0.0
4)
(0
.08
)
(0.0
3)
-
Tota
l dis
trib
uti
on
s-
(0.1
1)
(0
.04
)
(0.0
8)
(0
.06
)
-
Re
de
mp
tio
n f
ee
pro
cee
ds1
-
2
-
2
-
2
-
2
-
-
Ne
t as
set
valu
e, e
nd
of
pe
rio
d1
2.6
1$
12
.25
$
1
2.7
6$
11
.83
$
1
0.8
4$
9.4
7$
Tota
l re
turn
3 2
.94
%4
(3.1
1)%
8.2
3%
9.9
0%
15
.12
%1
.94
%4
Rat
ios
and
Su
pp
lem
en
tal D
ata
Net
ass
ets,
en
d o
f p
erio
d (
in t
ho
usa
nd
s)9
6,8
13
$
63
,61
9$
7
3,2
67
$
55
,19
9$
1
2,8
73
$
45
1$
Rat
io o
f ex
pen
ses
to a
vera
ge n
et a
sset
s:
Bef
ore
fee
s w
aive
d/r
eco
vere
d1
.27
%5
1.2
8%
1.2
9%
1.3
3%
1.4
0%
1.7
5%
5
Aft
er f
ees
wai
ved
/rec
ove
red
1.2
7%
51
.28
%1
.29
%1
.33
%1
.45
%1
.50
%5
Rat
io o
f n
et in
vest
men
t in
com
e to
ave
rage
net
ass
ets:
Bef
ore
fee
s w
aive
d/r
eco
vere
d0
.01
%5
0.4
0%
0.3
8%
0.2
2%
0.4
4%
1.2
4%
5
Aft
er f
ees
wai
ved
/rec
ove
red
0.0
1%
50
.40
%0
.38
%0
.22
%0
.39
%1
.49
%5
Po
rtfo
lio t
urn
ove
r ra
te9
%4
26
%2
6%
36
%3
0%
27
%4
*C
om
men
cem
ent
of
op
erat
ion
s.1
Cal
cula
ted
bas
ed o
n a
vera
ge s
har
es o
uts
tan
din
g fo
r th
e p
erio
d.
2A
mo
un
t re
pre
sen
ts le
ss t
han
$0
.01
per
sh
are.
3 4N
ot
ann
ual
ized
.5
An
nu
aliz
ed.
Tota
l ret
urn
s w
ou
ld h
ave
bee
n lo
wer
/hig
her
had
exp
ense
s n
ot
bee
n w
aive
d o
r ab
sorb
ed/r
eco
vere
d b
y th
e A
dvi
sor.
Ret
urn
s sh
ow
n in
clu
de
Ru
le 1
2b
-1 f
ees
of
up
to
0.2
5%
an
d d
o n
ot
refl
ect
the
ded
uct
ion
of
taxe
s th
at a
sh
areh
old
er w
ou
ld p
ay o
n F
un
d d
istr
ibu
tio
ns
or
the
red
emp
tio
n o
f Fu
nd
sh
ares
.
WC
M F
ocu
sed
Inte
rnat
ion
al G
row
th F
un
d
Inve
sto
r C
lass
See
acc
om
pa
nyi
ng
No
tes
to F
ina
nci
al S
tate
men
ts.
25

FIN
AN
CIA
L H
IGH
LIG
HTS
Per
sh
are
op
era
tin
g p
erfo
rma
nce
.
For
a c
ap
ita
l sh
are
ou
tsta
nd
ing
th
rou
gh
ou
t ea
ch p
erio
d.
For
the
Six
Mo
nth
sFo
r th
eFo
r th
eFo
r th
eFo
r th
eFo
r th
e P
eri
od
End
ed
Oct
ob
er
31
, 20
16
Ye
ar E
nd
ed
Ye
ar E
nd
ed
Ye
ar E
nd
ed
Ye
ar E
nd
ed
May
31
, 20
11
*
(Un
aud
ite
d)
Ap
ril 3
0, 2
01
6A
pri
l 30
, 20
15
Ap
ril 3
0, 2
01
4A
pri
l 30
, 20
13
thro
ugh
Ap
ril 3
0, 2
01
2
Ne
t as
set
valu
e, b
egi
nn
ing
of
pe
rio
d1
2.2
9$
12
.81
$
1
1.8
7$
10
.88
$
9
.48
$
10
.00
$
Inco
me
fro
m In
vest
me
nt
Op
era
tio
ns
Net
inve
stm
ent
inco
me1
0.0
2
0.0
8
0.0
8
0.0
5
0.0
6
0.0
8
Net
rea
lized
an
d u
nre
aliz
ed g
ain
(lo
ss)
on
inve
stm
ents
an
d f
ore
ign
cu
rren
cy0
.36
(0
.45
)
0.9
3
1.0
5
1.4
0
(0.6
0)
Tota
l fro
m in
vest
men
t o
per
atio
ns
0.3
8
(0.3
7)
1
.01
1
.10
1
.46
(0
.52
)
Less
Dis
trib
uti
on
s:
Fro
m n
et in
vest
men
t in
com
e-
(0.0
4)
(0
.03
)
(0.0
3)
(0
.03
)
-
Fro
m n
et r
ealiz
ed g
ain
-
(0
.11
)
(0.0
4)
(0
.08
)
(0.0
3)
-
Tota
l dis
trib
uti
on
s-
(0.1
5)
(0
.07
)
(0.1
1)
(0
.06
)
-
Re
de
mp
tio
n f
ee
pro
cee
ds1
-
2
-
2
-
2
-
2
-
2
-
2
Ne
t as
set
valu
e, e
nd
of
pe
rio
d1
2.6
7$
12
.29
$
1
2.8
1$
11
.87
$
1
0.8
8$
9.4
8$
Tota
l re
turn
33
.09
%4
(2.9
1)%
8.5
1%
10
.16
%1
5.4
8%
(5.2
0)%
4
Rat
ios
and
Su
pp
lem
en
tal D
ata
Net
ass
ets,
en
d o
f p
erio
d (
in t
ho
usa
nd
s)2
,69
1,4
63
$
2,2
18
,13
0$
1
,07
6,4
26
$
56
2,8
61
$
30
4,5
17
$
14
4,4
04
$
Rat
io o
f ex
pen
ses
to a
vera
ge n
et a
sset
s:
Bef
ore
fee
s w
aive
d/r
eco
vere
d1
.02
%5
1.0
3%
1.0
4%
1.0
8%
1.1
5%
1.4
4%
5
Aft
er f
ees
wai
ved
/rec
ove
red
1.0
2%
51
.03
%1
.04
%1
.08
%1
.20
%1
.25
%5
Rat
io o
f n
et in
vest
men
t in
com
e to
ave
rage
net
ass
ets:
Bef
ore
fee
s w
aive
d/r
eco
vere
d0
.26
%5
0.6
4%
0.6
3%
0.4
7%
0.6
9%
0.7
3%
5
Aft
er f
ees
wai
ved
/rec
ove
red
0.2
6%
50
.64
%0
.63
%0
.47
%0
.64
%0
.92
%5
Po
rtfo
lio t
urn
ove
r ra
te9
%4
26
%2
6%
36
%3
0%
27
%4
*C
om
men
cem
ent
of
op
erat
ion
s.1
Cal
cula
ted
bas
ed o
n a
vera
ge s
har
es o
uts
tan
din
g fo
r th
e p
erio
d.
2A
mo
un
t re
pre
sen
ts le
ss t
han
$0
.01
per
sh
are.
3 4N
ot
ann
ual
ized
.5
An
nu
aliz
ed.
Tota
l ret
urn
s w
ou
ld h
ave
bee
n lo
wer
/hig
her
had
exp
ense
s n
ot
bee
n w
aive
d o
r ab
sorb
ed/r
eco
vere
d b
y th
e A
dvi
sor.
Ret
urn
s sh
ow
n d
o n
ot
refl
ect
the
ded
uct
ion
of
taxe
s th
at a
sh
areh
old
er w
ou
ld p
ay
on
Fu
nd
dis
trib
uti
on
s o
r th
e re
dem
pti
on
of
Fun
d s
har
es.
Inst
itu
tio
nal
Cla
ss
WC
M F
ocu
sed
Inte
rnat
ion
al G
row
th F
un
d
See
acc
om
pa
nyi
ng
No
tes
to F
ina
nci
al S
tate
men
ts.
26

FINANCIAL HIGHLIGHTS
Per share operating performance.
For a capital share outstanding throughout each Period.
For the Six Months For the For the For the Period
Ended October 31, 2016 Year Ended Year Ended June 28, 2013*(Unaudited) April 30, 2016 April 30, 2015 through April 30, 2014
Net asset value, beginning of period 9.44$ 9.83$ 10.26$ 10.00$
Income from Investment Operations
Net investment income (loss)10.06 0.07 (0.03) (0.06)
Net realized and unrealized gain (loss) on investments
and foreign currency 0.33 (0.43) (0.40) 0.32
Total from investment operations 0.39 (0.36) (0.43) 0.26
Less Distributions:
From net investment income - (0.03) - -
From net realized gain - - - 2 -
Total distributions - (0.03) - -
Redemption fee proceeds - 2 - - -
Net asset value, end of period 9.83$ 9.44$ 9.83$ 10.26$
Total return34.13% 4 (3.69)% (4.19)% 2.60% 4
Ratios and Supplemental Data
Net assets, end of period (in thousands) 6,091$ 5,671$ 5,245$ 114$
Ratio of expenses to average net assets:
Before fees waived and expenses absorbed 2.67% 5 3.16% 4.74% 34.74% 5
After fees waived and expenses absorbed 0.00% 5 0.29% 1.65% 1.65% 5
Ratio of net investment income (loss) to average net assets:
Before fees waived and expenses absorbed (1.37)% 5 (2.10)% (3.37)% (33.77)% 5
After fees waived and expenses absorbed 1.30% 5 0.77% (0.28)% (0.68)% 5
Portfolio turnover rate 9% 4 49% 37% 19% 4
* Commencement of operations.1
Calculated based on average shares outstanding for the period.2
Amount represents less than $0.01 per share.3
4Not annualized.
5Annualized.
WCM Focused Emerging Markets Fund
Investor Class
Total returns would have been lower had expenses not been waived or absorbed by the Advisor. Returns shown include Rule 12b-1 fees of up to
0.25% and do not reflect the deduction of taxes that a shareholder would pay on Fund distributions or the redemption of Fund shares.
See accompanying Notes to Financial Statements.
27

FINANCIAL HIGHLIGHTS
Per share operating performance.
For a capital share outstanding throughout each Period.
For the Six Months For the For the For the Period
Ended October 31, 2016 Year Ended Year Ended June 28, 2013*
(Unaudited) April 30, 2016 April 30, 2015 through April 30, 2014
Net asset value, beginning of period 9.47$ 9.87$ 10.28$ 10.00$
Income from Investment Operations
Net investment income (loss)10.06 0.07 - 2 (0.04)
Net realized and unrealized gain (loss) on investments
and foreign currency 0.34 (0.43) (0.41) 0.32
Total from investment operations 0.40 (0.36) (0.41) 0.28
Less Distributions:
From net investment income - (0.04) - -
From net realized gain - - - 2 -
Total distributions - (0.04) - -
Net asset value, end of period 9.87$ 9.47$ 9.87$ 10.28$
Total return34.22% 4 (3.65)% (3.99)% 2.80% 4
Ratios and Supplemental Data
Net assets, end of period (in thousands) 16,806$ 10,989$ 8,532$ 1,220$
Ratio of expenses to average net assets:
Before fees waived and expenses absorbed 2.42% 5 2.91% 4.49% 34.49% 5
After fees waived and expenses absorbed 0.00% 5 0.24% 1.40% 1.40% 5
Ratio of net investment income (loss) to average net assets:
Before fees waived and expenses absorbed (1.12)% 5 (1.85)% (3.12)% (33.52)% 5
After fees waived and expenses absorbed 1.30% 5 0.82% (0.03)% (0.43)% 5
Portfolio turnover rate 9% 4 49% 37% 19% 4
* Commencement of operations.1 Calculated based on average shares outstanding for the period.2
Amount represents less than $0.01 per share.3
4Not annualized.
5 Annualized.
WCM Focused Emerging Markets Fund
Institutional Class
Total returns would have been lower had expenses not been waived or absorbed by the Advisor. Returns do not reflect the deduction of taxes that
a shareholder would pay on Fund distributions or the redemption of Fund shares.
See accompanying Notes to Financial Statements.
28
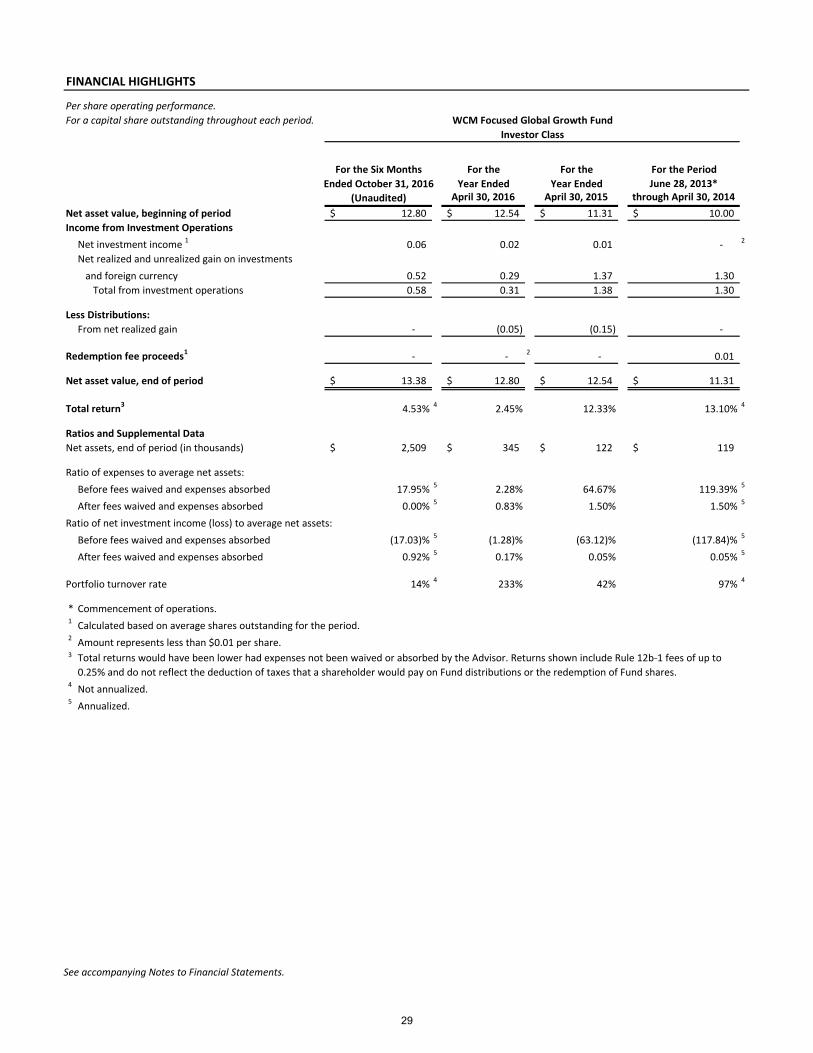
FINANCIAL HIGHLIGHTS
Per share operating performance.
For a capital share outstanding throughout each period.
For the Six Months For the For the For the Period
Ended October 31, 2016 Year Ended Year Ended June 28, 2013*
(Unaudited) April 30, 2016 April 30, 2015 through April 30, 2014
Net asset value, beginning of period 12.80$ 12.54$ 11.31$ 10.00$
Income from Investment Operations
Net investment income 1 0.06 0.02 0.01 - 2
Net realized and unrealized gain on investments
and foreign currency 0.52 0.29 1.37 1.30
Total from investment operations 0.58 0.31 1.38 1.30
Less Distributions:
From net realized gain - (0.05) (0.15) -
Redemption fee proceeds1- - 2 - 0.01
Net asset value, end of period 13.38$ 12.80$ 12.54$ 11.31$
Total return34.53% 4 2.45% 12.33% 13.10% 4
Ratios and Supplemental Data
Net assets, end of period (in thousands) 2,509$ 345$ 122$ 119$
Ratio of expenses to average net assets:
Before fees waived and expenses absorbed 17.95% 5 2.28% 64.67% 119.39% 5
After fees waived and expenses absorbed 0.00% 5 0.83% 1.50% 1.50% 5
Ratio of net investment income (loss) to average net assets:
Before fees waived and expenses absorbed (17.03)% 5 (1.28)% (63.12)% (117.84)% 5
After fees waived and expenses absorbed 0.92% 5 0.17% 0.05% 0.05% 5
Portfolio turnover rate 14% 4 233% 42% 97% 4
* Commencement of operations.1
Calculated based on average shares outstanding for the period.2
Amount represents less than $0.01 per share.3
4Not annualized.
5Annualized.
WCM Focused Global Growth Fund
Investor Class
Total returns would have been lower had expenses not been waived or absorbed by the Advisor. Returns shown include Rule 12b-1 fees of up to
0.25% and do not reflect the deduction of taxes that a shareholder would pay on Fund distributions or the redemption of Fund shares.
See accompanying Notes to Financial Statements.
29

FINANCIAL HIGHLIGHTS
Per share operating performance.
For a capital share outstanding throughout each period.
For the Six Months For the For the For the Period
Ended October 31, 2016 Year Ended Year Ended June 28, 2013*
(Unaudited) April 30, 2016 April 30, 2015 through April 30, 2014
Net asset value, beginning of period 12.85$ 12.57$ 11.33$ 10.00$
Income from Investment Operations
Net investment income10.06 0.04 0.10 0.03
Net realized and unrealized gain on investments
and foreign currency 0.52 0.29 1.31 1.30
Total from investment operations 0.58 0.33 1.41 1.33
Less Distributions:
From net investment income - - (0.02) -
From net realized gain - (0.05) (0.15) -
Total distributions - (0.05) (0.17) -
Net asset value, end of period 13.43$ 12.85$ 12.57$ 11.33$
Total return24.51% 3 2.69% 12.53% 13.30% 3
Ratios and Supplemental Data
Net assets, end of period (in thousands) 1,233$ 386$ 411$ 57$
Ratio of expenses to average net assets:
Before fees waived and expenses absorbed 17.63% 4 1.90% 64.42% 119.14% 4
After fees waived and expenses absorbed 0.00% 4 0.69% 1.25% 1.25% 4
Ratio of net investment income (loss) to average net assets:
Before fees waived and expenses absorbed (16.71)% 4 (0.90)% (62.87)% (117.59)% 4
After fees waived and expenses absorbed 0.92% 4 0.31% 0.30% 0.30% 4
Portfolio turnover rate 14% 3 233% 42% 97% 3
* Commencement of operations.1 Calculated based on average shares outstanding for the period.2
3Not annualized.
4Annualized.
WCM Focused Global Growth Fund
Institutional Class
Total returns would have been lower had expenses not been waived or absorbed by the Advisor. Returns do not reflect the deduction of taxes that
a shareholder would pay on Fund distributions or the redemption of Fund shares.
See accompanying Notes to Financial Statements.
30

FINANCIAL HIGHLIGHTS
Per share operating performance.
For a capital share outstanding throughout each period.
For the Six Months For the Period
Ended October 31, 2016 November 30, 2015* through
(Unaudited) April 30, 2016
Net asset value, beginning of period 10.08$ 10.00$
Income from Investment Operations
Net investment income (loss) 1 - 2
(0.01)
Net realized and unrealized gain on investments
and foreign currency 0.64 0.15
Total from investment operations 0.64 0.14
Less Distributions:
From net investment income - (0.06)
Total distributions - (0.06)
Net asset value, end of period 10.72$ 10.08$
Total return3 6.35% 4 1.39% 4
Ratios and Supplemental Data
Net assets, end of period (in thousands) 1,301$ 624$
Ratio of expenses to average net assets:
Before fees waived and expenses absorbed 20.73% 5 39.92% 5
After fees waived and expenses absorbed 1.40% 5 1.40% 5
Ratio of net investment income (loss) to average net assets:
Before fees waived and expenses absorbed (19.32)% 5 (38.75)% 5
After fees waived and expenses absorbed 0.01% 5 (0.23)% 5
Portfolio turnover rate 30% 4 18% 4
* Commencement of operations.1 Calculated based on average shares outstanding for the period.2
Amount represents less than $0.01 per share.3
4Not annualized.
5Annualized.
Total returns would have been lower had expenses not been waived or absorbed by the Advisor. Returns shown do not reflect the deduction
of taxes that a shareholder would pay on Fund distributions or the redemption of Fund shares.
WCM International
Small Cap Growth Fund
See accompanying Notes to Financial Statements.
31

WCM Funds NOTES TO FINANCIAL STATEMENTS October 31, 2016 (Unaudited)
Note 1 – Organization WCM Focused International Growth Fund (the ‘‘International Growth” or “International Growth Fund”), WCM Focused Emerging Markets Fund (“Emerging Markets” or “Emerging Markets Fund”), WCM Focused Global Growth Fund (“Global Growth” or “Global Growth Fund”) and WCM International Small Cap Growth Fund (the ‘‘International Small Cap Growth”) (each a “Fund” and collectively the ‘‘Funds’’) are organized as a non-diversified series of Investment Managers Series Trust, a Delaware statutory trust (the “Trust”) which is registered as an open-end management investment company under the Investment Company Act of 1940, as amended (the “1940 Act”). The International Growth Fund’s primary investment objective is to provide long-term capital appreciation. The Fund offers two classes of shares, Investor Class and Institutional Class. The International Growth Fund commenced investment operations on May 31, 2011 with the Institutional Class shares. The Investor Class shares commenced operations on August 31, 2011. The Emerging Markets Fund’s primary investment objective is to provide long-term capital appreciation. The Fund offers two classes of shares, Investor Class and Institutional Class. The Emerging Markets Fund commenced investment operations on June 28, 2013. The Global Growth Fund’s primary investment objective is to provide long-term capital appreciation. The Fund offers two classes of shares, Investor Class and Institutional Class. The Global Growth Fund commenced investment operations on June 28, 2013. The International Small Cap Growth Fund’s primary investment objective is to provide long-term capital appreciation. The Fund offers one class of shares, Institutional Class. The International Small Cap Growth Fund commenced investment operations on November 30, 2015. The shares of each class represent an interest in the same portfolio of investments of the Fund and have equal rights as to voting, redemptions, dividends and liquidation, subject to the approval of the Trustees. Income, expenses (other than expenses attributable to a specific class) and realized and unrealized gains and losses on investments are allocated to each class of shares in proportion to their relative shares outstanding. Shareholders of a class that bears distribution and service expenses under the terms of a distribution plan have exclusive voting rights to that distribution plan. Each Fund is an investment company and accordingly follows the investment company accounting and reporting guidance of the Financial Accounting Standards Board (FASB) Accounting Standard Codification Topic 946 “Financial Services—Investment Companies”. Note 2 – Accounting Policies The following is a summary of the significant accounting policies consistently followed by the Funds in the preparation of their financial statements. The preparation of financial statements in conformity with accounting principles generally accepted in the United States of America (“GAAP”) requires management to make estimates and assumptions that affect the reported amounts and disclosures in the financial statements. Actual results could differ from these estimates. (a) Valuation of Investments Each Fund values equity securities at the last reported sale price on the principal exchange or in the principal over the counter (“OTC”) market in which such securities are traded, as of the close of regular trading on the NYSE on the day the securities are being valued or, if the last-quoted sales price is not readily available, the securities will be valued at the last bid or the mean between the last available bid and ask price. Securities traded on the NASDAQ are valued at the NASDAQ Official Closing Price (“NOCP”). Debt securities are valued by utilizing a price supplied by independent pricing service providers. The independent pricing service providers may use various valuation methodologies including matrix pricing and other analytical pricing models as well as market transactions and dealer quotations. These models generally consider
32
WCM Funds NOTES TO FINANCIAL STATEMENTS - Continued October 31, 2016 (Unaudited) such factors as yields or prices of bonds of comparable quality, type of issue, coupon, maturity, ratings and general market conditions. If a price is not readily available for a portfolio security, the security will be valued at fair value (the amount which the Fund might reasonably expect to receive for the security upon its current sale) as determined in good faith by the Fund’s advisor, subject to review and approval by the Valuation Committee, pursuant to procedures adopted by the Board of Trustees. The actions of the Valuation Committee are subsequently reviewed by the Board at its next regularly scheduled board meeting. The Valuation Committee meets as needed. The Valuation Committee is comprised of all the Trustees, but action may be taken by any one of the Trustees. (b) Investment Transactions, Investment Income and Expenses Investment transactions are accounted for on the trade date. Realized gains and losses on investments are determined on the identified cost basis. Dividend income is recorded net of applicable withholding taxes on the ex-dividend date and interest income is recorded on an accrual basis. Withholding taxes on foreign dividends, if applicable, are paid (a portion of which may be reclaimable) or provided for in accordance with the applicable country’s tax rules and rates and are disclosed in the Statement of Operations. Withholding tax reclaims are filed in certain countries to recover a portion of the amounts previously withheld. The Funds record a reclaim receivable based on a number of factors, including a jurisdiction’s legal obligation to pay reclaims as well as payment history and market convention. Discounts or premiums on debt securities are accreted or amortized to interest income over the lives of the respective securities using the effective interest method. Expenses incurred by the Trust with respect to more than one fund are allocated in proportion to the net assets of each fund except where allocation of direct expenses to each fund or an alternative allocation method can be more appropriately made. The International Small Cap Growth Fund incurred offering costs of approximately $19,205, which are being amortized over a one-year period from November 30, 2015 (commencement of operations). (c) Foreign Currency Translation The Funds’ records are maintained in U.S. dollars. The value of securities, currencies and other assets and liabilities denominated in currencies other than U.S. dollars are translated into U.S. dollars based upon foreign exchange rates prevailing at the end of the reporting period. The currencies are translated into U.S. dollars by using the exchange rates quoted at the close of the London Stock Exchange prior to when the Funds’ NAV is next determined. Purchases and sales of investment securities, income and expenses are translated on the respective dates of such transactions. The Funds do not isolate that portion of their net realized and unrealized gains and losses on investments resulting from changes in foreign exchange rates from the impact arising from changes in market prices. Such fluctuations are included with net realized and unrealized gain or loss from investments and foreign currency. Net realized foreign currency transaction gains and losses arise from sales of foreign currencies, currency gains or losses realized between the trade and settlement dates on securities transactions, and the differences between the amounts of dividends, interest, and foreign withholding taxes recorded on the Funds’ books and the U.S. dollar equivalent of the amounts actually received or paid. Net unrealized foreign currency translation gains and losses arise from changes in the value of assets and liabilities, other than investments in securities, resulting from changes in the exchange rates. (d) Federal Income Taxes The Funds intend to comply with the requirements of Subchapter M of the Internal Revenue Code applicable to regulated investment companies and to distribute substantially all of its net investment income and any net realized gains to its shareholders. Therefore, no provision is made for federal income or excise taxes. Due to the timing of dividend distributions and the differences in accounting for income and realized gains and losses for financial statement and federal income tax purposes, the fiscal year in which amounts are distributed may differ from the year in which the income and realized gains and losses are recorded by the Funds.
33

WCM Funds NOTES TO FINANCIAL STATEMENTS - Continued October 31, 2016 (Unaudited) Accounting for Uncertainty in Income Taxes (the “Income Tax Statement”) requires an evaluation of tax positions taken (or expected to be taken) in the course of preparing a Funds’ tax returns to determine whether these positions meet a “more-likely-than-not” standard that, based on the technical merits, have a more than fifty percent likelihood of being sustained by a taxing authority upon examination. A tax position that meets the “more-likely-than-not” recognition threshold is measured to determine the amount of benefit to recognize in the financial statements. The Funds recognize interest and penalties, if any, related to unrecognized tax benefits as income tax expense in the Statements of Operations. The Income Tax Statement requires management of the Funds to analyze tax positions taken in the prior three open tax years, if any, and tax positions expected to be taken in the Fund’s current tax year, as defined by the IRS statute of limitations for all major jurisdictions, including federal tax authorities and certain state tax authorities. As of and during the open years ended April 30, 2013-2015 for the International Growth and open years ended April 30, 2014-2015 for the Emerging Markets and Global Growth and the open year ended April 30, 2015 for International Small Cap Growth and as of and during the six months ended October 31, 2016, the Funds did not have a liability for any unrecognized tax benefits. The Funds have no examination in progress and are not aware of any tax positions for which they are reasonably possible that the total amounts of unrecognized tax benefits will significantly change in the next twelve months. (e) Distributions to Shareholders The Funds will make distributions of net investment income and net capital gains, if any, at least annually. Distributions to shareholders are recorded on the ex-dividend date. The amount and timing of distributions are determined in accordance with federal income tax regulations, which may differ from GAAP. The character of distributions made during the year from net investment income or net realized gains may differ from the characterization for federal income tax purposes due to differences in the recognition of income, expense and gain (loss) items for financial statement and tax purposes. Where appropriate, reclassifications between net asset accounts are made for such differences that are permanent in nature. Certain funds may utilize earnings and profits on redemption of shares as part of the dividends paid deduction. Note 3 – Investment Advisory and Other Agreements The Trust, on behalf of the Funds, entered into an Investment Advisory Agreement (the “Agreement”) with WCM Investment Management (the “Advisor”). Under the terms of the Agreement, the International Growth Fund, Emerging Markets Fund, Global Growth Fund and International Small Cap Growth Fund pays a monthly investment advisory fee to the Advisor. The annual rates are listed by Fund in the table below. The Advisor has contractually agreed to waive its fees and/or pay for operating expenses of the Fund to ensure that total annual fund operating expenses (excluding taxes, leverage interest, brokerage commissions, dividend expenses on short sales, acquired fund fees and expenses as determined in accordance with Form N-1A, expenses incurred in connection with any merger or reorganization, or extraordinary expenses such as litigation expenses) in order to limit total annual operating expenses of each fund. This agreement is in effect until August 31, 2026, and it may be terminated before that date only by the Trust's Board of Trustees. The table below contains the expense cap by Fund and by Class:
Investment Total Limit on Annual Total Limit on Annual
Advisory Operating Expenses Operating Expenses
Fees Investor Class† Institutional Shares†
International Growth Fund 0.85% 1.50% 1.25%
Emerging Markets Fund 1.00% 1.65% 1.40%
Global Growth Fund 0.85% 1.50% 1.25%
International Small Cap Growth Fund 1.00% - 1.40%
†The total limit on annual operating expenses is calculated based on each Fund’s average daily net assets.
34
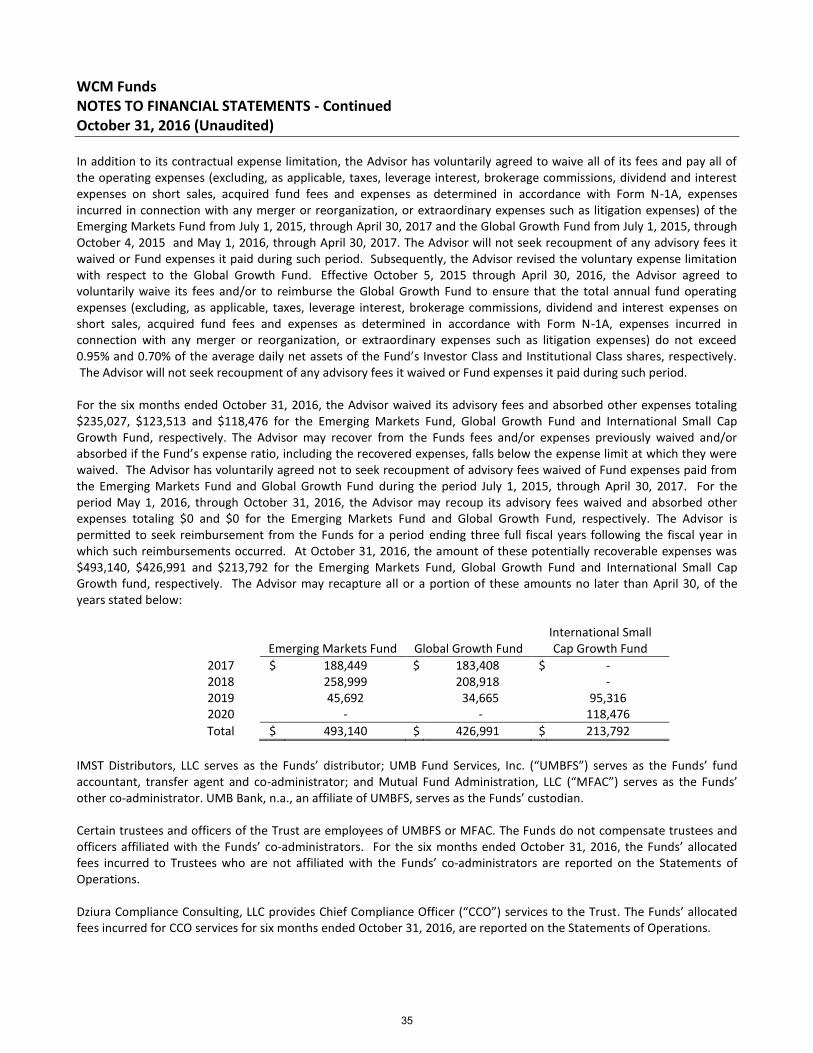
WCM Funds NOTES TO FINANCIAL STATEMENTS - Continued October 31, 2016 (Unaudited) In addition to its contractual expense limitation, the Advisor has voluntarily agreed to waive all of its fees and pay all of the operating expenses (excluding, as applicable, taxes, leverage interest, brokerage commissions, dividend and interest expenses on short sales, acquired fund fees and expenses as determined in accordance with Form N-1A, expenses incurred in connection with any merger or reorganization, or extraordinary expenses such as litigation expenses) of the Emerging Markets Fund from July 1, 2015, through April 30, 2017 and the Global Growth Fund from July 1, 2015, through October 4, 2015 and May 1, 2016, through April 30, 2017. The Advisor will not seek recoupment of any advisory fees it waived or Fund expenses it paid during such period. Subsequently, the Advisor revised the voluntary expense limitation with respect to the Global Growth Fund. Effective October 5, 2015 through April 30, 2016, the Advisor agreed to voluntarily waive its fees and/or to reimburse the Global Growth Fund to ensure that the total annual fund operating expenses (excluding, as applicable, taxes, leverage interest, brokerage commissions, dividend and interest expenses on short sales, acquired fund fees and expenses as determined in accordance with Form N-1A, expenses incurred in connection with any merger or reorganization, or extraordinary expenses such as litigation expenses) do not exceed 0.95% and 0.70% of the average daily net assets of the Fund’s Investor Class and Institutional Class shares, respectively. The Advisor will not seek recoupment of any advisory fees it waived or Fund expenses it paid during such period. For the six months ended October 31, 2016, the Advisor waived its advisory fees and absorbed other expenses totaling $235,027, $123,513 and $118,476 for the Emerging Markets Fund, Global Growth Fund and International Small Cap Growth Fund, respectively. The Advisor may recover from the Funds fees and/or expenses previously waived and/or absorbed if the Fund’s expense ratio, including the recovered expenses, falls below the expense limit at which they were waived. The Advisor has voluntarily agreed not to seek recoupment of advisory fees waived of Fund expenses paid from the Emerging Markets Fund and Global Growth Fund during the period July 1, 2015, through April 30, 2017. For the period May 1, 2016, through October 31, 2016, the Advisor may recoup its advisory fees waived and absorbed other expenses totaling $0 and $0 for the Emerging Markets Fund and Global Growth Fund, respectively. The Advisor is permitted to seek reimbursement from the Funds for a period ending three full fiscal years following the fiscal year in which such reimbursements occurred. At October 31, 2016, the amount of these potentially recoverable expenses was $493,140, $426,991 and $213,792 for the Emerging Markets Fund, Global Growth Fund and International Small Cap Growth fund, respectively. The Advisor may recapture all or a portion of these amounts no later than April 30, of the years stated below:
Emerging Markets Fund Global Growth Fund
International Small Cap Growth Fund
2017 $ 188,449 $ 183,408 $ - 2018 258,999 208,918 - 2019 45,692 34,665 95,316 2020 - - 118,476
Total $ 493,140 $ 426,991 $ 213,792
IMST Distributors, LLC serves as the Funds’ distributor; UMB Fund Services, Inc. (“UMBFS”) serves as the Funds’ fund accountant, transfer agent and co-administrator; and Mutual Fund Administration, LLC (“MFAC”) serves as the Funds’ other co-administrator. UMB Bank, n.a., an affiliate of UMBFS, serves as the Funds’ custodian. Certain trustees and officers of the Trust are employees of UMBFS or MFAC. The Funds do not compensate trustees and officers affiliated with the Funds’ co-administrators. For the six months ended October 31, 2016, the Funds’ allocated fees incurred to Trustees who are not affiliated with the Funds’ co-administrators are reported on the Statements of Operations. Dziura Compliance Consulting, LLC provides Chief Compliance Officer (“CCO”) services to the Trust. The Funds’ allocated fees incurred for CCO services for six months ended October 31, 2016, are reported on the Statements of Operations.
35

WCM Funds NOTES TO FINANCIAL STATEMENTS - Continued October 31, 2016 (Unaudited) Note 4 – Federal Income Taxes At October 31, 2016, gross unrealized appreciation and depreciation of investments, based on cost for federal income tax purposes were as follows:
International Growth Fund
Emerging Markets Fund
Global Growth Fund
International Small Cap
Growth Fund
Cost of investments $ 2,626,391,145 $ 22,228,755 $ 4,281,954 $ 1,231,105
Gross unrealized appreciation $ 277,762,826 $ 2,652,332 $ 72,946 $ 146,853 Gross unrealized depreciation (133,389,531) (1,738,333) (151,865) (59,121)
Net unrealized appreciation (depreciation) on investments $ 144,373,295 $ 913,999 $ (78,919) $ 87,732
The difference between cost amounts for financial statement and federal income tax purposes is due primarily to timing differences in recognizing certain gains and losses in security transactions. As of April 30, 2016, the components of accumulated earnings/ (deficit) on a tax basis were as follows:
International Growth Fund
Emerging Markets
Fund
Global
Growth Fund
International Small Cap Growth
Fund
Undistributed ordinary income $ 7,369,753 $ 52,402 $ 369,480 $ - Undistributed long-term capital gains - - 19,458 -
Tax accumulated earnings 7,369,753 52,402 388,938 - Accumulated capital and other losses (2,031,135) (1,150,629) - (12,066) Unrealized appreciation (depreciation) on foreign currency 100,837 301 655 47 Unrealized appreciation (depreciation) on investments 130,640,097 368,807 1,572 18,336
Total accumulated earnings (deficit) $ 136,079,552 $ (729,119) $ 391,165 $ 6,317
36

WCM Funds NOTES TO FINANCIAL STATEMENTS - Continued October 31, 2016 (Unaudited) The tax character of the distributions paid during the fiscal years ended April 30, 2016 and April 30, 2015, for the International Growth Fund, Emerging Markets, Global Growth and Small Cap Growth were as follows:
International Growth Fund Emerging Markets Fund
Distributions paid from: 2016 2015 2016 2015
Ordinary Income $ 5,050,286 $ 2,412,191 $ 45,892 $ 109
Net long-term capital gains 14,533,277 2,032,189 - -
Total distributions paid $ 19,583,563 $ 4,444,380 $ 45,892 $ 109
Global Growth Fund International Small Cap Growth Fund
Distributions paid from: 2016 2015 2016 2015
Ordinary Income $ 120,763 $ 5,217 $ 3,438 $ -
Net long-term capital gains 52,533 220 - -
Total distributions paid $ 173,296 $ 5,437 $ 3,438 $ -
At April 30, 2016, the Funds had accumulated capital loss carryforwards as follows:
International
International Emerging Global Small Cap
Growth Markets Growth Growth
Not subject to expiration
Short-term $ - $ 664,680 $ - $ 7,814
Long-term - 485,949 - -
Total $ - $ 1,150,629 $ - $ 7,814
To the extent that a fund may realize future net capital gains, those gains will be offset by any of its unused capital loss carryforward. Future capital loss carryover utilization in any given year may be subject to Internal Revenue Code limitations. As of April 30, 2016, International Small Cap Growth Fund had $4,252 of qualified late-year ordinary losses, which are deferred until fiscal year 2017 for tax purposes. As of April 30, 2016, the International Growth Fund had $2,031,135 of post-October losses, which are deferred until fiscal year 2017 for tax purposes. Net capital losses incurred after October 31, and within the taxable year are deemed to arise on the first day of the Fund's next taxable year.
37

WCM Funds NOTES TO FINANCIAL STATEMENTS - Continued October 31, 2016 (Unaudited) Note 5 – Redemption Fee The Funds may impose a redemption fee of 1.00% of the total redemption amount on all shares redeemed within 30 days
of purchase. For the six months ended October 31, 2016 and the year ended April 30, 2016, redemption fees were as
follows:
October 31, 2016 April 30, 2016
International Growth Fund $ 37,242 $ 28,149
Emerging Markets Fund 1 - Global Growth Fund - 47 International Small Cap Growth Fund - -
Note 6 – Investment Transactions For the six months ended October 31, 2016, purchases and sales of investments, excluding short-term investments, futures contracts, options contracts and securities sold short, were as follows:
Purchases Sales
International Growth Fund $ 625,581,395 $ 231,890,378
Emerging Markets Fund
7,120,744 1,578,096
Global Growth Fund
3,114,702 190,192 International Small Cap Growth Fund 878,352 346,063
In accordance with the Funds’ registration statement, the Funds may pay all or a portion of a shareholder’s redemption proceeds in liquid securities (from the Fund’s portfolio) with a market value equal to the redemption amount (an in-kind redemption) in lieu of cash. An in-kind redemption is allowed by the Funds’ registration statement in order to protect the interests of the Funds’ remaining shareholders. On April 1, 2016 and April 29, 2016, the Global Growth Fund had an in-kind redemption, whereby 2,897,019 and 559,497 shares were redeemed from the Fund. The Fund delivered investment securities with a fair value of $37,315,630 and $7,187,975 to this shareholder in lieu of cash. The fair market value of the investment securities delivered in this transaction are included in the Statements of Changes. Note 7 – Shareholder Servicing Plan The Trust, on behalf of each Fund, has adopted a Shareholder Servicing Plan to pay a fee at an annual rate of up to 0.15% of each Fund’s average daily net assets of shares serviced by shareholder servicing agents who provide administrative and support services to their customers. For the six months ended October 31, 2016, for the International Growth Fund, Emerging Markets Fund, Global Growth Fund and International Small Cap Growth, shareholder servicing fees incurred are disclosed on the Statements of Operations. Note 8 – Distribution Plan The Trust, on behalf of each Fund, has adopted a Distribution Plan (the “Plan”) pursuant to Rule 12b-1 under the 1940 Act, which allows each Fund to pay distribution fees for the sale and distribution of its Investor Class shares. The Plan provides for the payment of distribution fees at the annual rate of up to 0.25% of each Fund’s average daily net assets attributable to Investor Class shares, payable to IMST Distributors, LLC. The Institutional Class shares do not pay any distribution fees.
38

WCM Funds NOTES TO FINANCIAL STATEMENTS - Continued October 31, 2016 (Unaudited) For the six months ended October 31, 2016, for the International Growth Fund, Emerging Markets Fund and Global Growth Fund, distribution fees incurred by each Fund’s Investor Class shares are disclosed on the Statements of Operations. Note 9 – Indemnifications In the normal course of business, the Funds enter into contracts that contain a variety of representations which provide general indemnifications. The Funds’ maximum exposure under these arrangements is unknown, as this would involve future claims that may be made against the Funds that have not yet occurred. However, the Funds expect the risk of loss to be remote. Note 10 – Fair Value Measurements and Disclosure Fair Value Measurements and Disclosures defines fair value, establishes a framework for measuring fair value in accordance with GAAP, and expands disclosure about fair value measurements. It also provides guidance on determining when there has been a significant decrease in the volume and level of activity for an asset or a liability, when a transaction is not orderly, and how that information must be incorporated into a fair value measurement. Under Fair Value Measurements and Disclosures, various inputs are used in determining the value of the Funds’ investments. These inputs are summarized into three broad Levels as described below:
• Level 1 – Unadjusted quoted prices in active markets for identical assets or liabilities that the Funds have the ability to access.
• Level 2 – Observable inputs other than quoted prices included in Level 1 that are observable for the asset or liability, either directly or indirectly. These inputs may include quoted prices for the identical instrument on
an inactive market, prices for similar instruments, interest rates, prepayment speeds, credit risk, yield curves, default rates and similar data.
• Level 3 – Unobservable inputs for the asset or liability, to the extent relevant observable inputs are not available;
representing the Funds’ own assumptions about the assumptions a market participant would use in valuing the asset or liability, and would be based on the best information available.
The availability of observable inputs can vary from security to security and is affected by a wide variety of factors, including, for example, the type of security, whether the security is new and not yet established in the marketplace, the liquidity of markets, and other characteristics particular to the security. To the extent that valuation is based on models or inputs that are less observable or unobservable in the market, the determination of fair value requires more judgment. Accordingly, the degree of judgment exercised in determining fair value is greatest for instruments categorized in Level 3. The inputs used to measure fair value may fall into different Levels of the fair value hierarchy. In such cases, for disclosure purposes, the Level in the fair value hierarchy within which the fair value measurement falls in its entirety, is determined based on the lowest Level input that is significant to the fair value measurement in its entirety.
39
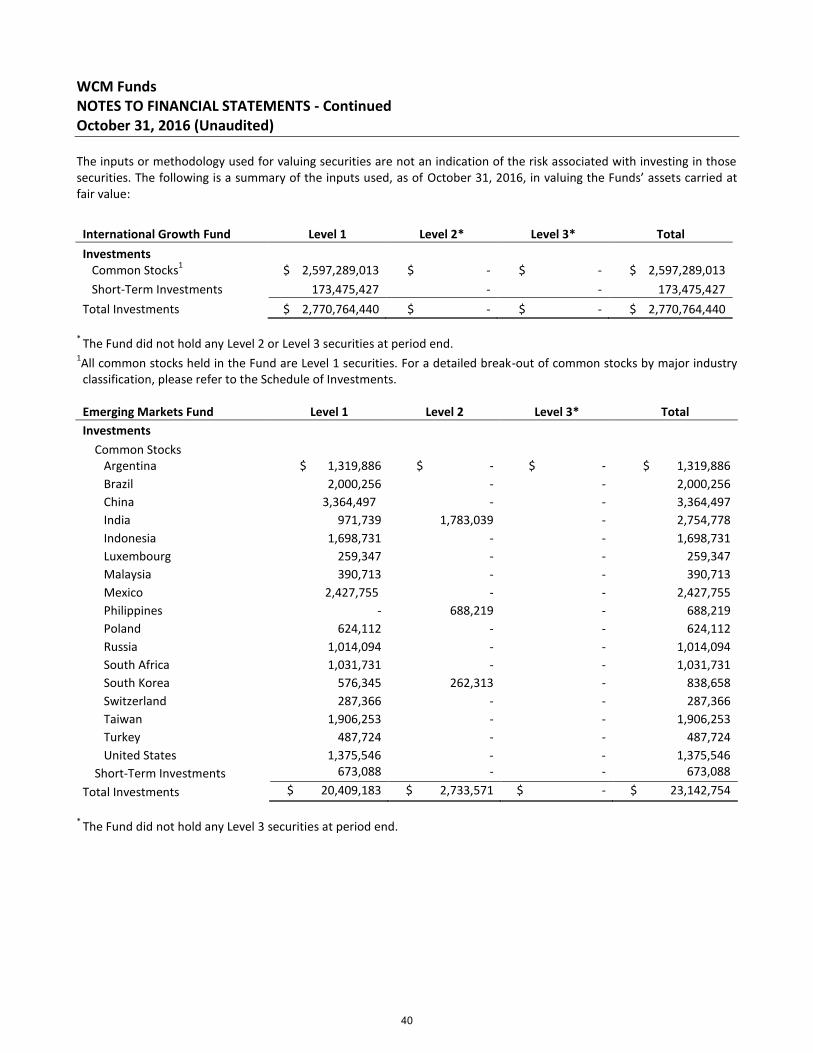
WCM Funds NOTES TO FINANCIAL STATEMENTS - Continued October 31, 2016 (Unaudited) The inputs or methodology used for valuing securities are not an indication of the risk associated with investing in those securities. The following is a summary of the inputs used, as of October 31, 2016, in valuing the Funds’ assets carried at fair value:
International Growth Fund Level 1 Level 2* Level 3* Total
Investments Common Stocks
1 $ 2,597,289,013 $ - $ - $ 2,597,289,013
Short-Term Investments 173,475,427 - - 173,475,427
Total Investments $ 2,770,764,440 $ - $ - $ 2,770,764,440
*
The Fund did not hold any Level 2 or Level 3 securities at period end.
1All common stocks held in the Fund are Level 1 securities. For a detailed break-out of common stocks by major industry classification, please refer to the Schedule of Investments. Emerging Markets Fund Level 1 Level 2 Level 3* Total
Investments Common Stocks
Argentina $ 1,319,886 $ - $ - $ 1,319,886
Brazil 2,000,256 - - 2,000,256
China 3,364,497 - - 3,364,497
India 971,739 1,783,039 - 2,754,778
Indonesia 1,698,731 - - 1,698,731
Luxembourg 259,347 - - 259,347
Malaysia 390,713 - - 390,713
Mexico 2,427,755 - - 2,427,755
Philippines - 688,219 - 688,219
Poland 624,112 - - 624,112
Russia 1,014,094 - - 1,014,094
South Africa 1,031,731 - - 1,031,731
South Korea 576,345 262,313 - 838,658
Switzerland 287,366 - - 287,366
Taiwan 1,906,253 - - 1,906,253
Turkey 487,724 - - 487,724
United States 1,375,546 - - 1,375,546
Short-Term Investments 673,088 - - 673,088
Total Investments $ 20,409,183 $ 2,733,571 $ - $ 23,142,754
* The Fund did not hold any Level 3 securities at period end.
40

WCM Funds NOTES TO FINANCIAL STATEMENTS - Continued October 31, 2016 (Unaudited)
Global Growth Fund Level 1 Level 2* Level 3
* Total
Investments Common Stocks
1 $ 3,552,898 $ - $ - $ 3,552,898
Short-Term Investments 650,137 - - 650,137
Total Investments $ 4,203,035 $ - $ - $ 4,203,035
*
The Fund did not hold any Level 2 or Level 3 securities at period end. 1All common stocks held in the Fund are Level 1 securities. For a detailed break-out of common stocks by major industry classification, please refer to the Schedule of Investments.
International Small Cap Growth Fund Level 1 Level 2 Level 3* Total
Investments Common Stocks
Argentina $ 23,521 $ - $ - $ 23,521
Australia 75,061 - - 75,061
Brazil 40,396 - - 40,396
Canada 42,463 - - 42,463
China 77,323 - - 77,323
Denmark 21,568 - - 21,568
Germany 81,879 - - 81,879
India - 47,983 - 47,983
Ireland 38,687 - - 38,687
Italy 24,102 - - 24,102
Japan 208,922 - - 208,922
Malaysia 44,612 - - 44,612
Mexico 26,208 - - 26,208
Netherlands 38,933 - - 38,933
Philippines 17,273 18,664 - 35,937
South Korea 58,639 - - 58,639
Sweden 67,668 5,112 - 72,780
Switzerland 40,603 - - 40,603
Taiwan 58,561 - - 58,561
Thailand 24,002 - - 24,002
United Arab Emirates 22,943 - - 22,943
United Kingdom 107,440 - - 107,440
Vietnam 23,587 - - 23,587
Short-Term Investments 82,687 - - 82,687
Total Investments $ 1,247,078 $ 71,759 $ - $ 1,318,837
*
The Fund did not hold any Level 3 securities at period end.
41
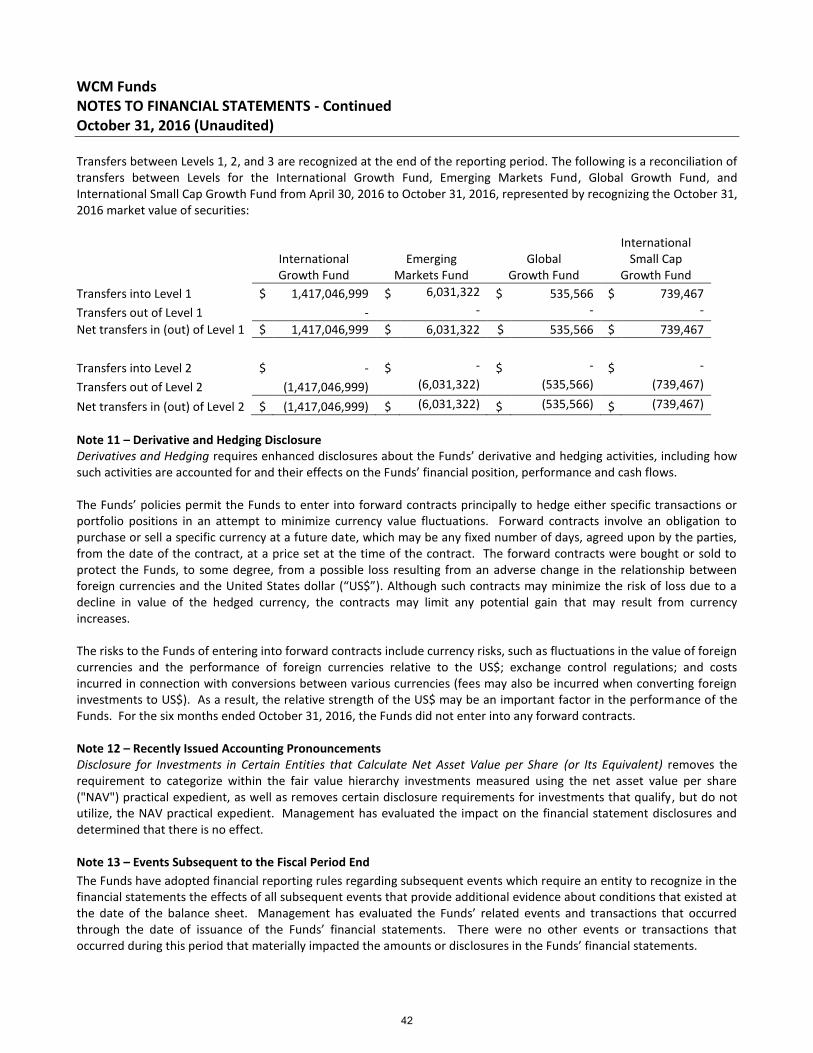
WCM Funds NOTES TO FINANCIAL STATEMENTS - Continued October 31, 2016 (Unaudited) Transfers between Levels 1, 2, and 3 are recognized at the end of the reporting period. The following is a reconciliation of transfers between Levels for the International Growth Fund, Emerging Markets Fund, Global Growth Fund, and International Small Cap Growth Fund from April 30, 2016 to October 31, 2016, represented by recognizing the October 31, 2016 market value of securities:
International Growth Fund
Emerging
Markets Fund
Global
Growth Fund
International Small Cap
Growth Fund
Transfers into Level 1 $ 1,417,046,999 $ 6,031,322 $ 535,566 $ 739,467
Transfers out of Level 1
- - - -
Net transfers in (out) of Level 1 $ 1,417,046,999 $ 6,031,322 $ 535,566 $ 739,467
Transfers into Level 2 $ - $ - $ - $ -
Transfers out of Level 2
(1,417,046,999) (6,031,322) (535,566) (739,467)
Net transfers in (out) of Level 2 $ (1,417,046,999) $ (6,031,322) $ (535,566) $ (739,467)
Note 11 – Derivative and Hedging Disclosure Derivatives and Hedging requires enhanced disclosures about the Funds’ derivative and hedging activities, including how such activities are accounted for and their effects on the Funds’ financial position, performance and cash flows. The Funds’ policies permit the Funds to enter into forward contracts principally to hedge either specific transactions or portfolio positions in an attempt to minimize currency value fluctuations. Forward contracts involve an obligation to purchase or sell a specific currency at a future date, which may be any fixed number of days, agreed upon by the parties, from the date of the contract, at a price set at the time of the contract. The forward contracts were bought or sold to protect the Funds, to some degree, from a possible loss resulting from an adverse change in the relationship between foreign currencies and the United States dollar (“US$”). Although such contracts may minimize the risk of loss due to a decline in value of the hedged currency, the contracts may limit any potential gain that may result from currency increases. The risks to the Funds of entering into forward contracts include currency risks, such as fluctuations in the value of foreign currencies and the performance of foreign currencies relative to the US$; exchange control regulations; and costs incurred in connection with conversions between various currencies (fees may also be incurred when converting foreign investments to US$). As a result, the relative strength of the US$ may be an important factor in the performance of the Funds. For the six months ended October 31, 2016, the Funds did not enter into any forward contracts. Note 12 – Recently Issued Accounting Pronouncements Disclosure for Investments in Certain Entities that Calculate Net Asset Value per Share (or Its Equivalent) removes the requirement to categorize within the fair value hierarchy investments measured using the net asset value per share ("NAV") practical expedient, as well as removes certain disclosure requirements for investments that qualify, but do not utilize, the NAV practical expedient. Management has evaluated the impact on the financial statement disclosures and determined that there is no effect. Note 13 – Events Subsequent to the Fiscal Period End
The Funds have adopted financial reporting rules regarding subsequent events which require an entity to recognize in the financial statements the effects of all subsequent events that provide additional evidence about conditions that existed at the date of the balance sheet. Management has evaluated the Funds’ related events and transactions that occurred through the date of issuance of the Funds’ financial statements. There were no other events or transactions that occurred during this period that materially impacted the amounts or disclosures in the Funds’ financial statements.
42
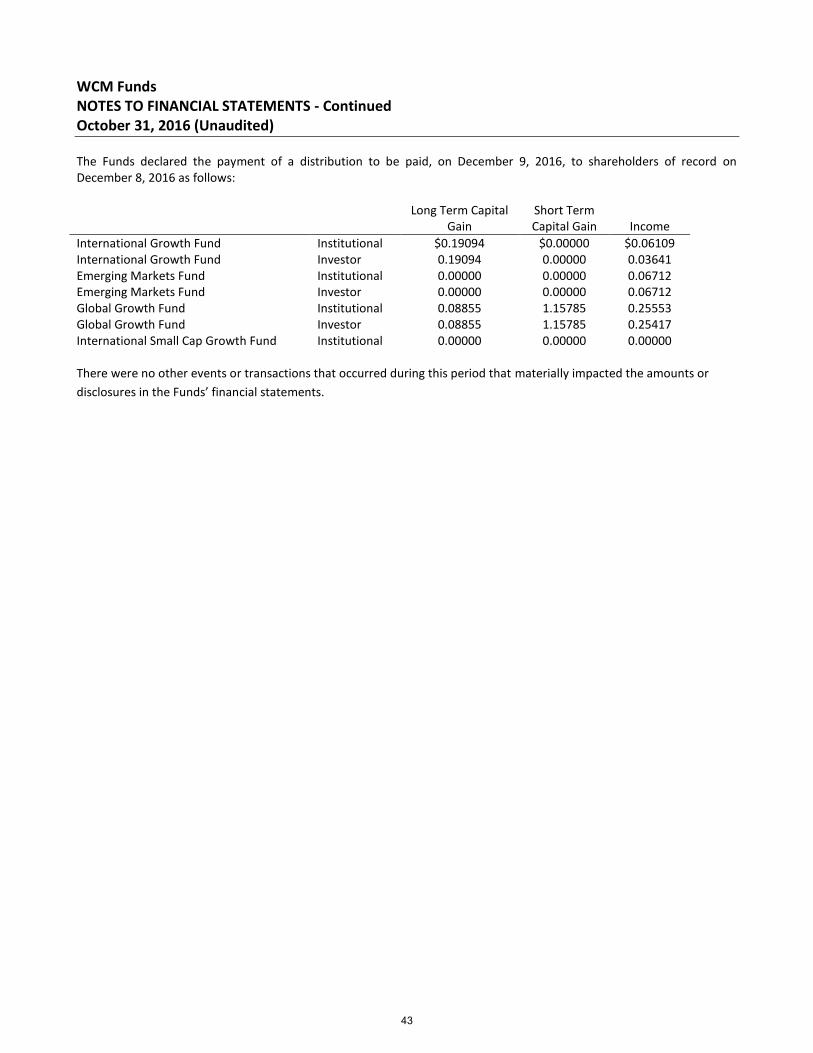
WCM Funds NOTES TO FINANCIAL STATEMENTS - Continued October 31, 2016 (Unaudited) The Funds declared the payment of a distribution to be paid, on December 9, 2016, to shareholders of record on December 8, 2016 as follows: Long Term Capital
Gain Short Term Capital Gain Income
International Growth Fund Institutional $0.19094 $0.00000 $0.06109 International Growth Fund Investor 0.19094 0.00000 0.03641 Emerging Markets Fund Institutional 0.00000 0.00000 0.06712 Emerging Markets Fund Investor 0.00000 0.00000 0.06712 Global Growth Fund Institutional 0.08855 1.15785 0.25553 Global Growth Fund Investor 0.08855 1.15785 0.25417 International Small Cap Growth Fund Institutional 0.00000 0.00000 0.00000 There were no other events or transactions that occurred during this period that materially impacted the amounts or
disclosures in the Funds’ financial statements.
43

WCM Funds EXPENSE EXAMPLES For the Six Months Ended October 31, 2016 (Unaudited)
Expense Examples As a shareholder of the Funds, you incur two types of costs: (1) transaction costs and redemption fees; and (2) ongoing costs, including management fees; distribution and/or service (12b-1) fees (Investor Class only); and other Fund expenses. The examples below are intended to help you understand your ongoing costs (in dollars) of investing in the Fund and to compare these costs with the ongoing costs of investing in other mutual funds. The examples are based on an investment of $1,000 invested at the beginning of the period and held for the entire period from May 1, 2016 to October 31, 2016. Actual Expenses The information in the row titled “Actual Performance” of the table below provides actual account values and actual expenses. You may use the information in these columns, together with the amount you invested, to estimate the expenses that you paid over the period. Simply divide your account value by $1,000 (for example, an $8,600 account value divided by $1,000 = 8.6), then multiply the result by the number in the appropriate row for your share class, in the column titled “Expenses Paid During Period” to estimate the expenses you paid on your account during this period. Hypothetical Example for Comparison Purposes The information in the row titled “Hypothetical (5% annual return before expenses)” of the table below provides hypothetical account values and hypothetical expenses based on the Fund’s actual expense ratios and an assumed rate of return of 5% per year before expenses, which is not the Fund’s actual return. The hypothetical account values and expenses may not be used to estimate the actual ending account balance or expenses you paid for the period. You may use this information to compare the ongoing costs of investing in the Fund and other funds. To do so, compare these 5% hypothetical examples with the 5% hypothetical examples that appear in the shareholder reports of the other funds. Please note that the expenses shown in the table are meant to highlight your ongoing costs only and do not reflect any transaction costs, such as sales charges (loads) or redemption fees. Therefore, the information in the row titled “Hypothetical (5% annual return before expenses)” is useful in comparing ongoing costs only, and will not help you determine the relative total costs of owning different funds. In addition, if these transactional costs were included, your costs would have been higher.
Focused International Growth Fund Beginning Account Value
Ending Account Value
Expenses Paid During Period*
5/1/16 10/31/16 5/1/16 – 10/31/16
Investor Class Actual Performance $ 1,000.00 $ 1,029.40 $ 6.51
Hypothetical (5% annual return before expenses) 1,000.00 1,018.79 6.47
Institutional Class Actual Performance 1,000.00 1,030.90 5.23
Hypothetical (5% annual return before expenses) 1,000.00 1,020.06 5.20
* Expenses are equal to the Fund’s annualized expense ratio of 1.27% and 1.02% for Investor Class and Institutional Class, respectively, multiplied by the average account value over the period, multiplied by 184/365 (to reflect the six month period). Assumes all dividends and distributions were reinvested.
44

WCM Funds EXPENSE EXAMPLES - Continued For the Six Months Ended October 31, 2016 (Unaudited)
Focused Emerging Markets Fund Beginning Account
Value Ending Account
Value Expenses Paid During Period*
5/1/16 10/31/16 5/1/16 – 10/31/16
Investor Class Actual Performance $ 1,000.00 $ 1,041.30 $ 0.00
Hypothetical (5% annual return before expenses) 1,000.00 1,025.21 0.00
Institutional Class Actual Performance 1,000.00 1,042.20 0.00
Hypothetical (5% annual return before expenses) 1,000.00 1,025.21 0.00
* Expenses are equal to the Fund’s annualized expense ratio of 0.00% and 0.00% for Investor Class and Institutional Class, respectively, multiplied by the average account value over the period, multiplied by 184/365 (to reflect the six month period). The expense ratio reflects an expense waiver. Assumes all dividends and distributions were reinvested.
Focused Global Growth Fund Beginning Account Value
Ending Account Value
Expenses Paid During Period*
5/1/16 10/31/16 5/1/16 – 10/31/16
Investor Class Actual Performance $ 1,000.00 $ 1,045.30 $ 0.00
Hypothetical (5% annual return before expenses) 1,000.00 1,025.21 0.00
Institutional Class Actual Performance 1,000.00 1,045.10 0.00
Hypothetical (5% annual return before expenses) 1,000.00 1,025.21 0.00
* Expenses are equal to the Fund’s annualized expense ratio of 0.00% and 0.00% (including excise tax reimbursement from Advisor) for Investor Class and Institutional Class, respectively, multiplied by the average account value over the period, multiplied by 184/365 (to reflect the six month period). The expense ratio reflects an expense waiver. Assumes all dividends and distributions were reinvested.
International Small Cap Growth Fund Beginning Account Value
Ending Account Value
Expenses Paid During Period*
5/1/16 10/31/16 5/1/16 – 10/31/16
Actual Performance $ 1,000.00 $ 1,063.50 $ 7.27
Hypothetical (5% annual return before expenses)^ 1,000.00 1,018.16 7.11
* Expenses are equal to the Fund’s annualized expense ratio of 1.40%, multiplied by the average account value over
the period, multiplied by 184/365 (to reflect the six month period). The expense ratios reflect an expense waiver.
Assumes all dividends and distributions were reinvested.
45

This page is intentionally left blank

This page is intentionally left blank

This page is intentionally left blank
WCM Focused International Growth Fund WCM Focused Emerging Markets Fund
WCM Focused Global Growth Fund WCM International Small Cap Growth Fund
Each a series of Investment Managers Series Trust
Investment Advisor WCM Investment Management
281 Brooks Street Laguna Beach, California 92651
Custodian UMB Bank, n.a.
928 Grand Boulevard, 5th Floor Kansas City, Missouri 64106
Fund Co-Administrator Mutual Fund Administration, LLC
2220 E. Route 66, Suite 226 Glendora, California 91740
Fund Co-Administrator, Transfer Agent and Fund Accountant UMB Fund Services, Inc.
235 W. Galena Street Milwaukee, Wisconsin 53212
Distributor IMST Distributors, LLC
Three Canal Plaza, Suite 100 Portland, Maine 04101
www.foreside.com

FUND INFORMATION
TICKER CUSIP WCM Focused International Growth Fund – Investor Class WCMRX 461418 386 WCM Focused International Growth Fund – Institutional Class
WCM Focused Emerging Markets Fund Investor Class
WCM Focused Emerging Markets Fund Institutional Class
WCM Focused Global Growth Fund Investor Class
WCM Focused Global Growth Fund Institutional Class WCM International Small Cap Growth Fund – Institutional Class
WCMIX WFEMX
WCMEX WFGGX WCMGX WCMSX
461418 444 46141P 842 46141P 834 46141P 826 46141P 818 46141Q 683
Privacy Principles of the WCM Funds for Shareholders The Funds are committed to maintaining the privacy of their shareholders and to safeguarding their non-public personal information. The following information is provided to help you understand what personal information the Funds collect, how we protect that information and why, in certain cases, we may share information with select other parties.
Generally, the Funds do not receive any non-public personal information relating to their shareholders, although certain non-public personal information of their shareholders may become available to the Funds. The Funds do not disclose any non-public personal information about their shareholders or former shareholders to anyone, except as permitted by law or as is necessary in order to service shareholder accounts (for example, to a transfer agent or third party administrator).
This report is sent to shareholders of the WCM Funds for their information. It is not a Prospectus, circular or representation intended for use in the purchase or sale of shares of the Funds or of any securities mentioned in this report.
Proxy Voting Policies and Procedures A description of the Funds’ proxy voting policies and procedures related to portfolio securities is available without charge, upon request, by calling the Funds (toll-free) at (888) 988-9801, or on the U.S. Securities and Exchange Commission’s (“SEC”) website at www.sec.gov. Proxy Voting Record Information regarding how the Funds voted proxies for portfolio securities, if applicable, during the most recent 12-month period ended June 30, is also available, without charge and upon request by calling the Funds (toll-free) at (888) 988-9801, or by accessing the Funds’ Form N-PX on the SEC’s website at www.sec.gov. Form N-Q Disclosure The Funds file their complete schedule of portfolio holdings with the SEC for the first and third quarters of each fiscal year on Form N-Q. The Funds’ Form N-Q is available on the SEC website at www.sec.gov or by calling the Funds (toll-free) at (888) 988-9801. The Funds’ Form N-Q may also be viewed and copied at the SEC’s Public Reference Room in Washington, DC. Information on the operation of the Public Reference Room may be obtained by calling (800) SEC-0330.
WCM Funds P.O. Box 2175
Milwaukee, WI 53201 Toll Free: (888) 988-9801