semantics for big data applications in smart dairy farming · semantics for big data applications...
TRANSCRIPT

SEMANTICS FOR BIG DATA APPLICATIONS IN SMART DAIRY FARMING Jack Verhoosel, Jacco Spek Presentation at SWIT 2016
October 17th 2016

aantallen NL
noemen
Collaboration project 3 Cooperations 7 SME’s 5 Research institutes 7 Real farmers
Goal of SDF: to support dairy farmers in the care of individual animals. with the specific goal of a longer productive stay at the farm due to improvement of individual health.
Challenge SDF2: more farmers: from 7 to 60 (and prepare for 2500) more sensor suppliers and more data consumers incorporate semantics and big data analysis
2
SMART DAIRY FARMING

3
Starting point: Cow centric thinking
Starting point: Farmer in control
“De boer aan het roer”
Real time analysis models (at different organisations)
Sensors from different suppliers: Lely, Delaval, Agis, Gallagher,…
Other data sources, CRV, FC, AgriFirm, Weather, Satellite
InfoBroker: Open platform for sharing (sensor) data producers and consumers
Cow specifics Workinstructions (SOP)
This project is made possible by:
Data sharing in the dairy chain
Think big, start small 12GB sensordata per year for
7 farms => 310 GB triples
From 7 to 50 farms of 15.000 in NL
4
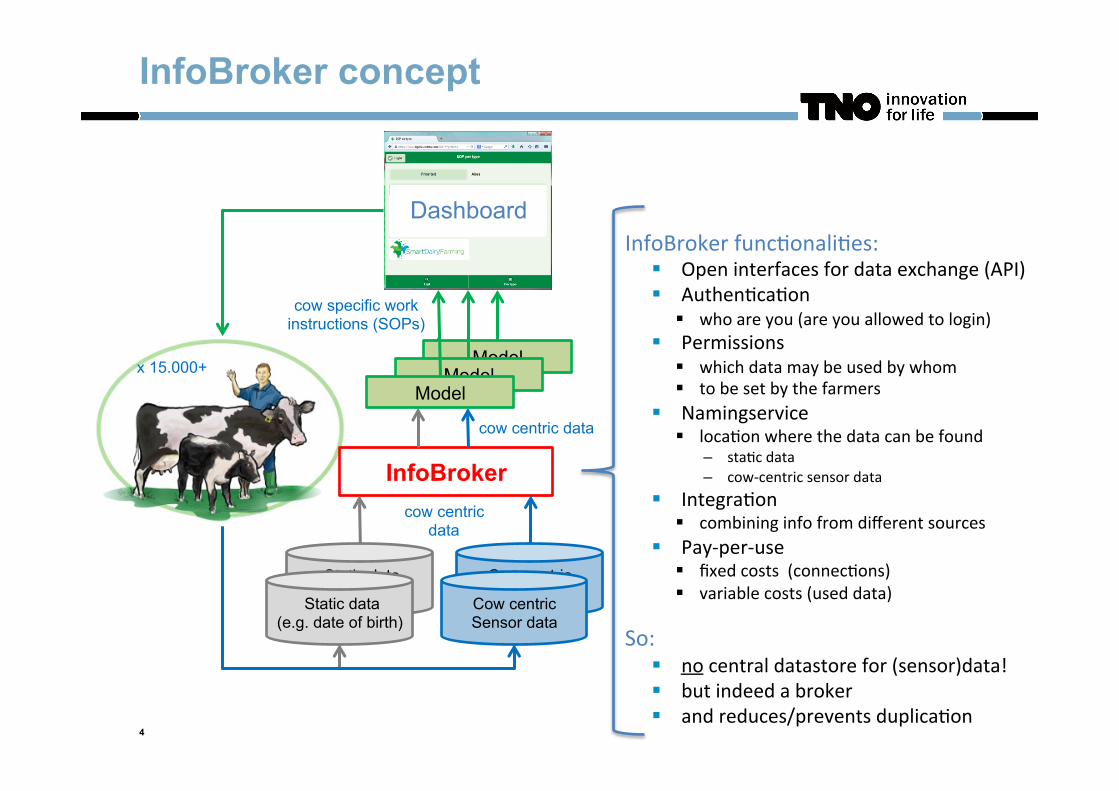
InfoBroker concept
InfoBroker func,onali,es: § Open interfaces for data exchange (API) § Authen,ca,on
§ who are you (are you allowed to login) § Permissions
§ which data may be used by whom § to be set by the farmers
§ Namingservice § loca,on where the data can be found
– sta,c data – cow-‐centric sensor data
§ Integra,on § combining info from different sources
§ Pay-‐per-‐use § fixed costs (connec,ons) § variable costs (used data)
So: § no central datastore for (sensor)data! § but indeed a broker § and reduces/prevents duplica,on
cow specific work instructions (SOPs)
InfoBroker
cow centric data
cow centric data
Cow centric Sensor data
Static data (e.g. feed) Cow centric
Sensor data Static data
(e.g. date of birth)
Dashboard
Model Model
Model x 15.000+

InfoBroker – Facts & Figures
5
Farm 1 Farm 2 Farm 3 Farm 4 Farm 5 Farm 6 Farm 7
# cows/calves 459 186 315 239 706 202 351
Behaviour x x
Temperature x x
Activity x x x x x x
Milk production x x x x x
Food intake x x x
Weight x x x x x x x
Water intake x x
Milk intake x x
Date: february 2015 NB1: this are “sensor data categories” at a farm NB2: not all animals are monitored for SDF (e.g. 3 and 4 only calves)

InfoBroker – Facts & Figures
6
Number of cows vs time
Number of sensorfields vs time

WHY LINKED DATA AND SEMANTICS?
1. To make the various data sets accessible in an automatically linkable manner for easier integration
2. To align the semantics of the datasets in isolation as well as in combination using ontologies
3. To enable a rich set of questions to be queried on the datasets for better analysis
7

AgriFirm: “How much feed did a group of cows at a dairy farm take in a certain period per type of feed and how strong is the correlation with milk yield?” CRV: “What was the average weight per day over the last lactation period of a cow and what was the weight in/decrease over that period?
BIG DATA ANALYSIS QUESTIONS

WHAT IS LINKED DATA?
“Linked data is a set of design principles for sharing machine-readable data on the Web for use by public administrations, business and citizens.”
The four design principles of Linked Data (by Tim Berners Lee): 1. Use Uniform Resource Identifiers (URIs) as names for things. 2. Use HTTP URIs so that people can look up those names. 3. When someone looks up a URI, provide useful information, using
the standards (RDF*, SPARQL). 4. Include links to other URIs so that they can discover more things.
9

5 STAR MODEL
Open Data
Open License
Reusable
Open format
URI
Linked Open Data Linked
Data
10

SIMPLE EXAMPLE OF LINKED DATA
Subject Object predicate
Cow Animal
is a (type)
Parcel
grazes on
Parcel
Grassland is a (type)
40 ha
has surface
11

LINKED DATA ROADMAP*
Source: http://www.pilod.nl/wiki/BoekTNO/stappenplan
The four design principles of Linked Data (by Tim Berners Lee): 1. Use Uniform Resource Identifiers
(URIs) as names for things. 2. Use HTTP URIs so that people can
look up those names. 3. When someone looks up a URI,
provide useful information, using the standards (RDF*, SPARQL).
4. Include links to other URIs so that they can discover more things.
12
LODRefine
*Based on PLDN LD roadmap

….. sensor data ….. sensor data
ONTOLOGY-BASED SDF
13
Cow specific data per farm per sensor equipment
Delaval sensor data
Lely sensor data
Visualization and analysis apps
Common Dairy Ontology
MS-ontology Measurements Triples Static Triples
ST-ontology
Static data (e.g. date of birth)
Cow specific data per farm
mapping mapping
Nedap sensor data
Agis sensor data

COMMON DAIRY ONTOLOGY
14
“What was the average
weight per day and
weight in/decrease over
the last lactation period
of a cow in a group ?”

ONTOLOGY MAPPING
15
Common Dairy Ontology
rdfs:label = “Activity2hours” rdfs:label = “BodyWeight”
Measurement ontology

PLASIDO: OUR BIG, LINKED DATA PLATFORM
Powerful server: 128GB memory, 5TB storage Triplestores:
Marmotta Triplestore with Relational TripleDB Jena Fuseki Triplestore with Native GraphDB Virtuoso Relational ClassicalDB with SPARQL-2-SQL interface
All SDF data of 2014 and 2015 retrieved from InfoBroker Converted into triples using LODRefine and RDF generator From 12GB to 310GB, increase of factor 25 Stored in Marmotta and Fuseki for comparison
Application development: Angular-Javascript JSON converter Google Visualization
16
LODRefine

POC DEMO: AGRIFIRM AND CRV
17

POC DEMO: STATIC COW INFO
18
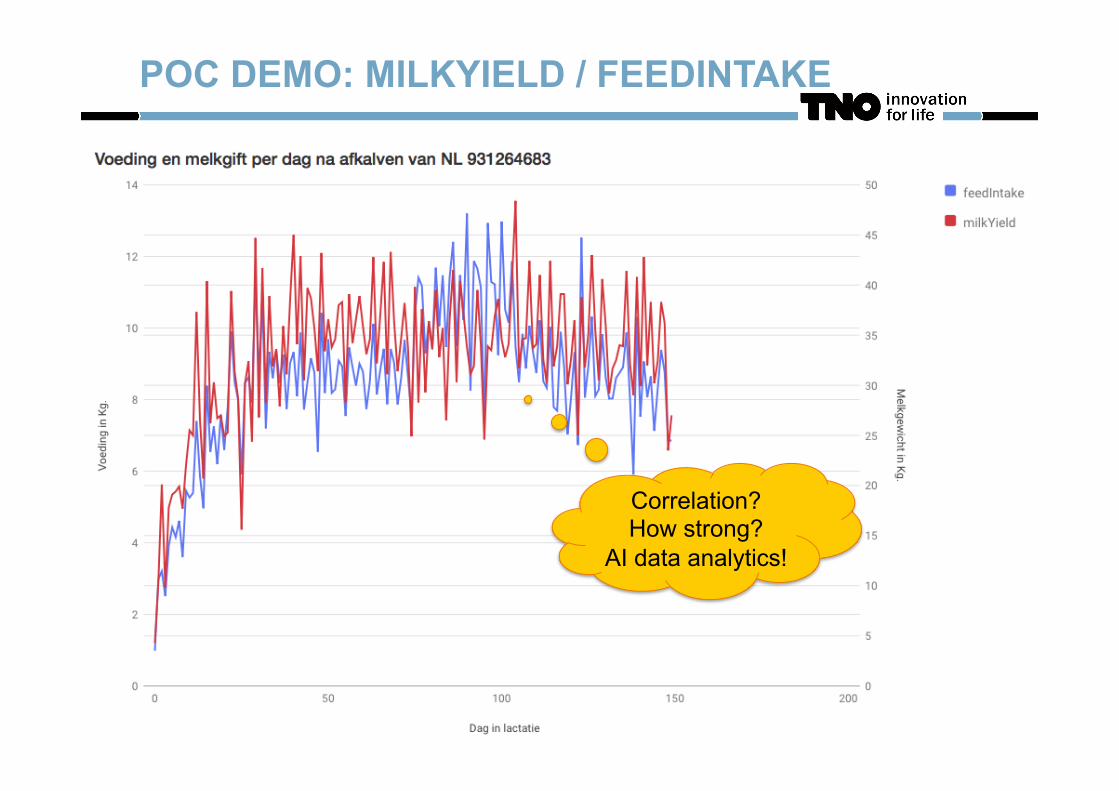
POC DEMO: MILKYIELD / FEEDINTAKE
19
Correlation? How strong?
AI data analytics!

POC DEMO: FEEDINTAKE PER FEED
20

PLASIDO PERFORMANCE TESTS 1. All 2014 SDF triple data from Infobroker into Apache
Marmotta triplestore 12GB of CSV data turned into +/- 310 GB of RDF triples
Marmotta makes use of classical relational database to store triples Simple queries with only one parameter can be easily answered More complex queries let to unacceptable response time Main reason is inefficient access to underlying RDB
2. Next step: switch all data to Apache Jena Fuseki triplestore
Still +/- 310 GB of RDF triples Fuseki makes use of modern graph database to store triples Simple queries with only one parameter can be easily answered More complex analysis queries lead to long, but still acceptable response time, upto 15 minutes So, an acceptable performance. See next slide for some numbers.
21

PLASIDO PERFORMANCE
Query Input Graph size Search par Response Select an overview with the number of cows of a farmer
Stokman 111,604,625 1 0.04s Bakker 167,894,559 1 0.03s Antonides 79,739,365 1 0.37s
Select the list of cows with number and parity Stokman 28,704 3 0.934s Bakker 9,400 3 15.110s Antonides 45,816 3 27.006s
Select feed per type per day over all cows of a farmer
Stokman 66,551,765 3 913.003s Bakker 38,034,692 3 350.917s Antonides 45,637,592 3 380.470s
Select average weight over all cows per day per parity
Antonides 45,637,592 3 348.704s
Select static info for a cow NL 715820911 45,816 2 0.094s Select weight per day in lactation period NL 715820911 45,683,408 5 5.129s Select weight and milkyield per day in lactation period
NL 715820911 45,683,408 7 13.714s
Select milkyield per day in lactation period NL 715820911 45,683,408 3 4.142s
With set-up 2 using Apache Jena Fuseki triplestore with graphDB

PLASIDO PERFORMANCE TESTS Conclusion of previous 2 tests: working with large triplesets is acceptable However, is it really necessary to put all data into triples? Why not use only the CDO as semantic interface and leave all data in classical table database format?
3. Next step: put all data into tables and use RDB of Virtuoso
Only +/- 10 GB of raw data SPARQL interface based on CDO Mapping between SPARQL and SQL to translate queries towards RDB Simple queries with only one parameter can be easily answered More complex analysis queries lead to errors, because the SPARQL-2-SQL mapping generates too large SQL queries and results that cannot be handled by Virtuoso
23

CONCLUSION AND NEXT STEPS
CDO ontology application in SDF architecture Further enhancement of CDO to cover the dairy domain extensively Architectural study to enable the use of CDO with InfoBroker CDO as semantic interface for InfoBroker Apply AI deep learning algorithms to perform data analytics
More extensive performance studies
Other linked data platforms to deal with big data: D2RQ Other possibilities for improvements: Linked Data Fragments Dealing with heterogeneous sensordata: differently measured Enabling analysis based on incomplete sensordata RDF stream processing for dealing with streaming sensor data
24

THANK YOU FOR YOUR ATTENTION!
25