semantic integration and knowledge discovery for ...zhchen/papers/jdm-07.pdfknowledge discovery. we...
TRANSCRIPT
Journal of Database Management, 18(1), 43-67, January-March 2007 43
Copyright © 2007, Idea Group Inc. Copying or distributing in print or electronic forms without written permission of Idea Group Inc. is prohibited.
AbstrAct
Environmental research and knowledge discovery both require extensive use of data stored in various sources and created in different ways for diverse purposes. We describe a new metadata approach to elicit semantic information from environmental data and implement semantics-based techniques to assist users in integrating, navigating, and mining multiple environmental data sources. Our system contains specifications of various environmental data sources and the relationships that are formed among them. User requests are augmented with semantically related data sources and automatically presented as a visual semantic network. In addition, we present a methodology for data navigation and pattern discovery using multi-resolution brows-ing and data mining. The data semantics are captured and utilized in terms of their patterns and trends at multiple levels of resolution. We present the efficacy of our methodology through experimental results.
Keywords: environmental research, knowledge discovery and navigation, semantic integra-tion, semantic networks, wavelets
semantic Integration and Knowledge Discovery for Environmental research
Zhiyuan Chen, University of Maryland, Baltimore County (UMBC), USAAryya Gangopadhyay, University of Maryland, Baltimore County (UMBC), USA
George Karabatis, University of Maryland, Baltimore County (UMBC), USAMichael McGuire, University of Maryland, Baltimore County (UMBC), USA
Claire Welty, University of Maryland, Baltimore County (UMBC), USA
IntroDuctIonThe urban environment is formed
by complex interactions between natural and human systems. Studying the urban environment requires the collection and analysis of very large datasets that span many disciplines, have semantic (including
spatial and temporal) differences and inter-dependencies, are collected and managed by multiple organizations, and are stored in varying formats. Scientific knowledge discovery is often hindered because of challenges in the integration and naviga-tion of these disparate data. Furthermore,

44 Journal of Database Management, 18(1), 43-67, January-March 2007
Copyright © 2007, Idea Group Inc. Copying or distributing in print or electronic forms without written permission of Idea Group Inc. is prohibited.
as the number of dimensions in the data increases, novel approaches for pattern discovery are needed.
Environmental data are collected in a variety of units (metric or SI), time incre-ments (minutes, hours, or even days), map projections (e.g., UTM or State Plane) and spatial densities. The data are stored in numerous formats, multiple locations, and are not centralized into a single repository for easy access. To help users (mostly en-vironmental researchers) identify data sets of interest, we use a metadata approach to extract semantically related data sources and present them to the researchers as a semantic network. Starting with an initial search (query) submitted by a researcher, we exploit stored relationships (metadata) among actual data sources to enhance the search result with additional semantically related information. Although domain ex-perts need to manually construct the initial semantic network, which may only include a small number of sources, we introduce an algorithm to let the network expand and evolve automatically based on usage patterns. Then, we present the semantic network to the user as a visual display of a hyperbolic tree; we claim that semantic networks provide an elegant and compact technique to visualize considerable amounts of semantically relevant data sources in a simple yet powerful manner.
Once users have finalized a set of envi-ronmental data sources, based on semantic networks, they can access the actual sources to extract data and perform techniques for knowledge discovery. We introduce a new approach to integrate urban environmental data and provide scientists with semantic techniques to navigate and discover patterns in very large environmental datasets.
Our system provides access to a mul-titude of heterogeneous and autonomous
data repositories and assists the user to navigate through the abundance of diverse data sources as if they were a single ho-mogeneous source. More specifically, our contributions are:
1. recommendation of Additional and relevant Data sources: We present our approach to recommend data sources that are potentially relevant to the user’s search interests. Cur-rently, it is tedious and impractical for users to locate relevant information sources by themselves. We provide a methodology that addresses this problem and automatically supplies users with additional and potentially relevant data sources that they might not be aware of. In order to discover these additional recommendations, we exploit semantic relationships between data sources. We define se-mantic networks for interrelated data sources and present an algorithm to automatically refine, augment, and expand an initial and relatively small semantic network with additional and relevant data sources; we also exploit user profiles to tailor resulting data sources to specific user preferences.
2. Visualization and navigation of rel-evant Data sources: The semantic network with the additional sources is shown to the user as a visual hy-perbolic tree improving usability by showing the semantic relationships among relevant data sources in a vi-sual way. After the user has decided on the choice of relevant data sources of interest (based on our metadata ap-proach) and has accessed the actual data, we also assist the user in navigat-ing through the plethora of environ-mental data using visualization and

Journal of Database Management, 18(1), 43-67, January-March 2007 45
Copyright © 2007, Idea Group Inc. Copying or distributing in print or electronic forms without written permission of Idea Group Inc. is prohibited.
navigation techniques that describe data at multiple levels of resolution, enabling pattern and knowledge discovery at different semantic lev-els. We achieve that, using wavelet transformation techniques, and we demonstrate resilience of wavelet transformation to noisy data.
3. Implementation of a Prototype system: Finally, we have designed and implemented a prototype system as a proof of concept for our tech-niques. Using this system we have demonstrated the feasibility of our contributions and have conducted a set of experiments verifying and validating our approach.
This article is organized as follows. First, we present related work on data inte-gration using semantics, and on exploration of multi-dimensional data. Next, we present our research methodology on semantic net-works and pattern discovery with wavelet transformations. Then, we describe our prototype implementation and the experi-ments we conducted. Our conclusions are presented in the final section.
rElAtED WorK
Data IntegrationThere is a rich body of existing
work on data integration problems. The fundamental problem is to enable inter-operation across different heterogeneous sources of information. In general, this problem manifests itself either as schema mismatches (schema integration) or data incompatibilities (data integration) while accessing disparate data sources. Several surveys identifying problems and proposed approaches on schema and data integration
have been written over the years (Batini, Lenzerini, & Navathe, 1986; Ouksel & Sheth, 1999; Rahm & Bernstein, 2001). There has been a significant amount of work on data integration, especially on resolving discrepancies of different data schemas using a global (mediated) schema (Friedman, Levy, & Millstein, 1999; Levy, Rajaraman, & Ordille, 1996; Miller et al., 2001; Papakonstantinou, Garcia-Molina, & Ullman, 1996; Rahm & Bernstein, 2001; Ram, Park, & Hwang, 2002). More recently, there exists work on decentralized data sharing (Bowers, Lin, & Ludascher, 2004; Doan, Domingos, & Halevy, 2003; Halevy, Ives, Suciu, & Tatarinov, 2003; Hyperion, Tatarinov, & Halevy, 2004) and on integrating data in web-based databases (Bowers et al., 2004; Chang, He, & Zhang, 2005; Dispensa & Brulle, 2003). Clustering, classification and ontologies have also been extensively used as a tool to solve semantic heterogeneity problems (Jain & Zhao, 2004; Kalfoglou & Schorlemmer, 2003; Ram & Park, 2004; Sheth et al., 2004; Sheth, Arpinar, & Kashyap, 2003; Sheth et al., 2002; Zhao & Ram, 2002, 2004).
All the previously mentioned work takes a deep integration approach, where the data schemas (or query interface for integrating web databases) of all sources are integrated. However, this approach is often too restrictive for environmental research because: (1) there are so many different types of data collected by so many different groups that it is impractical for all of them to agree on a universal mediated schema; (2) unlike companies, environmental research-ers often share data in an ad hoc way, e.g., a company may purchase products from several fixed suppliers while environmental researchers may use any dataset collected by other researchers but related to their current research task.

46 Journal of Database Management, 18(1), 43-67, January-March 2007
Copyright © 2007, Idea Group Inc. Copying or distributing in print or electronic forms without written permission of Idea Group Inc. is prohibited.
There has been much effort by the ecology research community to integrate its data (EML, ORS, SEEK). These sys-tems take a shallow integration approach where only metadata is integrated; they allow researchers to store metadata in a centralized database and to select datasets by searching the metadata using keyword or SQL-based search. Such systems avoid the problem of defining a global-mediated data schema and allow researchers to share data in an ad hoc way. A semantics-based integration approach for geospatial data is presented in (Ram, Khatri, Zhang, & Zeng, 2001).
The main problem of existing systems for integrating environmental data is that they provide limited support to assist users in finding data sources semantically related to their research. Most existing systems as-sume researchers have full knowledge of what keywords to search and provide no assistance in selecting data sources based on relationships between them. However, unlike business applications, environmental research is more explorative and research-ers are interested in searching semantically related datasets. Although experienced researchers may find all related keywords, inexperienced researchers such as gradu-ate students may have trouble doing this. The only exception is the SEEK project (Bowers et al., 2004; Bowers & Ludascher, 2004), which uses an ontology for ecology concepts to find related datasets. However, SEEK assumes the ontology will be com-pletely given by domain experts, while our approach augments such knowledge by incremental and automatic refinement of the semantic network.
There has also been work on discov-ering semantic similarity in (Fankhauser, Kracker, & Neuhold, 1991) based on generalization/specialization, and posi-
tive/negative association between classes; in our article, we do not restrict our work to these types of classes only, instead, we let the users identify the degree of relevance between data sources as their own semantic interpretation. Although our approach gives more emphasis on the user’s semantics, it may require more manual work to calculate the semantic relationships in the semantic network, since it is user-based. To reduce the amount of manual work, we start with a small manually created semantic network, and then we apply an algorithm that we de-signed and implemented, to automatically expand, refine, and augment the semantic network by taking advantage of observed usage patterns. Another difference with (Fankhauser et al., 1991) is the way that the degree of relevance is calculated. They use triangular norms (T-norms) from fuzzy logic, while we use conditional probabilities. Relevant to our work is the topic of discovering and ranking semantic relationships for the Semantic Web (Ale-man-Meza, Halaschek-Wiener, Arpinar, Ramakrishnan, & Sheth, 2005; Sheth et al., 2004). However, relationship ranking is not in the scope of this article.
using Wavelets for Exploration of Multidimensional Data
In order to study long-term envi-ronmental factors, we need to evaluate measures across multiple dimensions such as time and geographic space at different dimensional hierarchies. An example of the type of queries that have to be answered is, “How do stream temperature and pre-cipitation change over time and space?” In order to answer such queries, the system must integrate diverse sets of information, which is typically facilitated by dimensional modeling techniques (Kimball, 2002) and online analytical processing (OLAP). The
Journal of Database Management, 18(1), 43-67, January-March 2007 47
Copyright © 2007, Idea Group Inc. Copying or distributing in print or electronic forms without written permission of Idea Group Inc. is prohibited.
challenge stems from the fact that such dimensional models grow exponentially in size with the number of dimensions and dimensional hierarchies. Current OLAP techniques, however, rely on the intuition of the decision maker in navigating through this lattice of cuboids and only provide navigation tools such as drill down and roll up. There have been very few attempts made to address this issue, most notably the work done by (Sarawagi, Agrawal, & Megiddo, 1998) and (Kumar, Gangopad-hyay, & Karabatis, in press). However, the major deficiency of the existing work in this area is that the volume of data after a few drill-downs becomes prohibitively large, which hinders the effectiveness of the method. In order to help end users (scientists or engineers) discover and analyze patterns from large datasets, we have developed a methodology for visualization of data at multiple levels of dimensional hierarchy and pattern discovery through data mining techniques (Han & Kamber, 2000; Mitchell, 1997) at multiple levels of resolution.
The last decade has seen an explosion of interest in wavelets (Daubechies, 1992; Goswami & Chan, 1999), a subject area that has coalesced from roots in mathematics, physics, electrical engineering and other disciplines. Wavelets have been developed as a means to provide low-resolution views of data with the ability to reconstruct high-resolution views if necessary. Wavelet transformation has been applied in numer-ous disciplines such as compression and de-noising of audio signals and images, finger print compression, edge detection, object detection in two-dimensional images, and image retrieval (Stollnitz, Derose, & Sale-sin, 1996). There have been few studies on approximate query answering through lossy compression of multi-dimensional data cubes (Matias, Vitter, & Wang, 1998; Smith,
Li, & Jhingran, 2004; Vitter & Wang, 1999; Vitter, Wang, & Iyer, 1998), data cleaning, and time-series data analysis (Percival & Walden, 2000). However, no study has been done on utilizing wavelet transformation to provide decision support. We use wavelets to provide coarse, low-resolution views to researchers with the capability of retriev-ing high-resolution data by zooming into selected areas.
Generally speaking, wavelet trans-formation is a tool that divides up data, functions, or operators into different fre-quency components and then studies each component with a resolution matched to its scale (Daubechies, 1992). A wavelet has many desirable properties such as compact support, vanishing moments and dilating relation and other preferred properties such as smoothness (Chui & Lian, 1996). The core idea behind a discrete wavelet transfor-mation (DWT) is to progressively smooth the data using an iterative procedure and keep the detail along the way. The DWT is performed using the pyramid algorithm (Mallat, 1989) in O(N) time.
rEsEArch DEsIgn AnD MEthoDs
overview of the ArchitectureThe overall architecture of our system
is shown in Figure 1. It consists of a data integration component, a data warehouse, and visualization, navigation, and pattern discovery component, all for the semantic utilization of heterogeneous data sources depicted on the left. The data integration component consists of a metadata reposi-tory, a semantic network, and a set of con-version functions. The metadata repository stores information about the source data including descriptions of each particular source along with information on its syntax

48 Journal of Database Management, 18(1), 43-67, January-March 2007
Copyright © 2007, Idea Group Inc. Copying or distributing in print or electronic forms without written permission of Idea Group Inc. is prohibited.
and semantics. In our approach the metadata layer is not a global schema. Instead we collect various information artifacts about the sources to assist in finding relationships and correspondences among data in differ-ent sources. We also store information on how to access the data (including location identifier, access method, access rights, username, etc.) and how to transform the
data to the canonical form if needed through conversion functions (on measurement units, formats, etc.), as explained in the following section.
The semantic network contains rela-tionships between sources. Users request data sources by searching the metadata re-pository and our system will automatically use the semantic network to return not only
Vis
ualiz
atio
n, N
avig
atio
n an
d Pa
ttern
Dis
cove
ry
Mul
ti-re
solu
tion
view
ofda
ta
Dat
a W
areh
ouse
Orig
inal
dat
a
Wav
elet
co
effic
ient
s
Sour
ce
DB
W
eb C
lient
s
Sour
ce
DB
So
urce
Fi
le
Dat
a In
tegr
atio
n
Sour
ce
Spre
adsh
eet
D
ata
Min
ing
&
Patte
rn
Dis
cove
ry
Met
adat
a R
epos
itory
Con
vers
ion
Func
tions
Sem
antic
N
etw
ork
Figure 1. System architecture with data integration and knowledge discovery compo-nents

Journal of Database Management, 18(1), 43-67, January-March 2007 49
Copyright © 2007, Idea Group Inc. Copying or distributing in print or electronic forms without written permission of Idea Group Inc. is prohibited.
the requested ones but also to recommend additional and related data sources that us-ers might not know about. Once the users decide on the final selection of the sources they may download data directly to their local machines. Data being downloaded can be converted to canonical form for possible analysis. This is achieved by a set of conversion functions that are part of the integration component. Data that are integrated are stored in the data warehouse. The data warehouse is a multidimensional model of commonly used source data, which also stores wavelet coefficients. Once users have obtained data, they can visualize, navigate, and discover patterns at different dimensions and resolutions to aid knowledge discovery.
Data IntegrationIn this section, we address issues re-
lated to (1) data sources and relationships that form among them, (2) semantic net-works, for recommendation of additional and relevant data sources visualized as hy-perbolic trees, and (3) automatic expansion and augmentation of the semantic network by observing user patterns.
Describing Data Sources and their Rela-tionships
The plethora of diverse data in en-vironmental research poses significant integration problems. Some data sources may be structured or semi-structured data-bases with varying data models (relational, object-oriented, object-relational, etc.); some may be available as spreadsheets, while others may be flat files. Data may also contain spatial information in raster or vector formats.
We take a metadata approach, in which we store information about the data, which is collected and stored in the metadata layer
with details from both scientific and storage perspectives. For example, many ecosystem study projects collect data related to climate (e.g., precipitation depth, wind speed, wind velocity, air temperature, humidity), soils (e.g., temperature, water content, trace gases), and streams (e.g., depth, flow rate, temperature, nutrients, pathogens, toxics, biota). For each such category, we store its definition, measurement unit, collection frequency, and measurement location, to create an accurate description of what is being collected, how it is measured, where it is stored, and how it is accessed. Usu-ally, this type of information is available from the data sources themselves. It is part of a routine process to specify specific metadata information when users submit data at the data sources. Additional infor-mation may also be stored from external sources (e.g., the Open Research System (ORS)). In general, information about data sources is not significantly large, especially when compared with the amount of actual data at the sources; metadata information can be collected from the sources either automatically (through an application programming interface (API) if available) or manually. All such information is kept in the metadata repository and it serves the purpose of a universal registry; similar but not identical to universal description, discovery and integration (UDDI) for Web services. The metadata repository, stored in an object-relational database, is augmented with information on additional data sources as needed.
This work expands on the specification of relationships among database objects stored in heterogeneous database systems (Georgakopoulos, Karabatis, & Gantima-hapatruni, 1997; Karabatis, Rusinkiewicz, & Sheth, 1999; Rusinkiewicz, Sheth, & Karabatis, 1991; Sheth & Karabatis, 1993).

50 Journal of Database Management, 18(1), 43-67, January-March 2007
Copyright © 2007, Idea Group Inc. Copying or distributing in print or electronic forms without written permission of Idea Group Inc. is prohibited.
We have created a methodology allowing researchers to derive semantic relation-ships among data sources based on source descriptions in the metadata layer. These semantic relationships form a semantic network of related information, which as-sists users to discover additional informa-tion, relevant to their search but possibly unknown to them. We realize that some relationships may not be captured initially in the metadata repository, especially when semantic incompatibilities prevent direct identification of data (such as problems related to synonyms, homonyms, etc.). Nevertheless, missing relationships are captured and added to the metadata reposi-tory by observing researchers’ usage pat-terns when they interact with the semantic network, as will be explained further in the current section. The notion of relationships between concepts is also related to the topic maps or concept maps (TopicMap), and Semantic Web (W3C) for XML and web documents containing metadata about concepts. However, our work does not limit itself only to XML or web data, but can be used to describe data in general.
Converting Data to a Canonical FormEnvironmental data sources may have
differences in formats, data units, spatial and temporal granularities, and may be col-lected at different time intervals. We have implemented methods and/or applications to convert between different units and formats. In addition, spatial and temporal disparities are resolved using spatial and temporal join/aggregation operations and integrating data at the appropriate level. As an example, suppose that we need to integrate stream chemical and biological data collected at each site with land use and land cover data. In our data warehouse model, each site belongs to a stream reach,
and each stream reach belongs to a sub-watershed (the land area that drains to a particular point along a stream segment and is represented by a polygon feature). Land use/land cover data is also collected on areas represented by polygons (although these polygons are different and smaller than polygons for sub-watersheds). Thus, we aggregate stream data to sub-watershed level, and then aggregate land use/land cover data to areas represented by the same set of polygons for sub-watersheds using re-projection, spatial joins, or overlay functions provided by ArcObjects, the API included in the ESRI’s ArcGIS software suite (www.esri.com/software/arcgis).
Using Semantic Networks to Expand User Queries
In this section, we provide details on the creation and utilization of semantic networks. We formally define semantic networks and we present techniques to extract information from semantic networks and recommend additional and relevant data sources to users in their search of related data sources. We also present an algorithm to automatically refine, and dynamically augment semantic networks; Semantic networks have long been used to represent relationships (Masterman, 1961). We take advantage of their structure to elicit additional semantic information for environmental data.
Definition 1: We formally define a semantic network G(V,E,W) as a graph G where:
• V is the set of nodes in the network. Each node represents a data source or data set. For convenience, we use data source and data set interchangeably in this article.

Journal of Database Management, 18(1), 43-67, January-March 2007 51
Copyright © 2007, Idea Group Inc. Copying or distributing in print or electronic forms without written permission of Idea Group Inc. is prohibited.
Figure 2. An example semantic network
• E is the set of directed edges in the network. An edge (vi, vj) indicates that node vi is semantically related to node vj.
• W is a |V| * |V| relevance score matrix, where W(i,j) is a number in range of [0,1] and represents the degree of rel-evance (or relevance score) between nodes vj and vi.
Figure 2 depicts an example semantic network related to fish population. The num-ber on each edge represents the relevance score associated with the two adjacent nodes. Based on these scores, we can infer the relevance between any two nodes in the network. We consider each relevance score as a conditional probability and as-sume they are independent of each other (Rice, 1994). For example, the relevance score between fish population and stream temperature can be considered as the condi-tional probability of a researcher interested in stream temperature given that he or she is interested in fish population.
Using the standard notation for con-ditional probability, we have:
P(surfaces | fish) = P(surfaces, stream temperature | fish) because the user will be interested in impervious surfaces, assum-ing the user is also interested in stream temperature.
Using chain rules and assuming all conditional probabilities are independent (Rice, 1994), we have:
P(surfaces, temperature | fish) = P(temperature | fish) * P(surfaces | tem-perature) = 0.9 * 0.9 = 0.81.
In general, if vi and vj are two nodes, there are k paths p1,…, pk between vi and vj, where path pl (1 <= l <=k) consists of nodes vl1,…, vl|pl|+1 (|pl| is the length of path pl).
The relevance score rs between vi and vj is
)),(,1min(||1
1∑ ∏≤≤
+=pl pli
ii llwrs (1)
The above formula computes the rel-evance score between vi and vj as the sum of relevance scores for all paths connecting vi and vj. For each such path, the relevance score between the two endpoints is com-puted as the product of relevance scores for all edges along the path. There can be more detailed types of semantic relationships (cause-effect, is-a, and is-part-of), or to use more advanced inference rules without the independent assumption on the conditional probabilities, but these extensions are be-yond the scope of this article.
Construction of Semantic NetworkWe assume that domain experts have
provided an initial semantic network, i.e., a set of edges and nodes with their relevance scores. Based on this initial semantic net-work, we compute the relevance scores between any pair of nodes in the network, and create the matrix W.
Let us consider the example in Figure 2. Suppose matrix R stores the relevance scores of all edges in the initial semantic
0.9
0.9
0.9
Fish Population
Stream Temperature
Impervious Surfaces
Land Use/Land Cover

52 Journal of Database Management, 18(1), 43-67, January-March 2007
Copyright © 2007, Idea Group Inc. Copying or distributing in print or electronic forms without written permission of Idea Group Inc. is prohibited.
network. The first, second, third, and fourth row (column) in the matrix corresponds to edges from (to) fish, temperature, surface data, and land data. Rij stores the relevance score from node i to node j.
R =
00009.0000
09.000009.00
Based on formula (1), the relevance score between any pair of nodes equals the sum of relevance scores of all paths between them. Using matrix multiplication rules, and for any given pair (i, j) with i ≠ j, we calculate the sum of relevance scores of all paths between i and j with length k. It is equal to Rk
ij where Rk is the multiplication of k matrices R. For example, the relevance scores of all paths with length 2 is:
R2 = R * R =
0000000081.0000081.000
There are two non-zero entries: R213
= 0.81, identifying the relevance score between fish data to surface data, and R2
24 = 0.81 identifying the score between temperature and land data. Hence, the rel-evance score rs between any pair of nodes in the network can be computed using the following formula:
∑≤≤
=Ni
iRrs1 (2)
Using Semantic Networks to Elicit Ad-ditional Semantics
A user in search of ecosystem data sources may perform a keyword search or submit a regular SQL query to our system,
which in turn will find data sources that directly satisfy the user’s conditions. We call these data sources exact answers. In addition to the exact answers, we describe a novel approach to enhance and augment the result set with additional sources, semanti-cally relevant to the exact answers, which the user might not be aware of. We achieve this goal by exploiting the semantic net-work, and returning all data sources whose relevance score with the exact answers is higher than a threshold. For simplicity, we have set the threshold in our system to 0.5 but a user can adjust it according to how closely additional data sources should be related to the exact answers.
For example, suppose a user wants to find all data sources related to ‘fish popula-tion.’ The exact answer contains only the fish population data set because only that data set contains the keyword ‘fish popula-tion.’ However, using the semantic network in Figure 2, our system will return all other three data sources in the figure because they are also related to the fish population ac-cording to the semantic network. Therefore, we can automatically recommend to the users additional semantic information (data sources) relevant to the exact answers.
Visualizing Semantic NetworksMost existing systems for ecological
research (EML) return data sources as a list, and it is difficult for users to go through them when the list is long. Our system utilizes a hyperbolic tree technique (Lamping, Rao, & Pirolli, 1995) to visualize data sources and the semantic relationships they form. Figure 3 shows an example of such a tree. The main benefit of this technique is to show users the entire set of exact answers and additional related data sources at a glance, as a visualization of all relevant nodes and edges forming a semantic net-

Journal of Database Management, 18(1), 43-67, January-March 2007 53
Copyright © 2007, Idea Group Inc. Copying or distributing in print or electronic forms without written permission of Idea Group Inc. is prohibited.
work. In addition, users can dynamically adjust the display size of a data source of their choice and automatically bring it to the foreground concentrating on a specific data source and all its edges connecting it to the relevant sources.
Dealing with Different User Prefer-ences
We also consider the issue that differ-ent domain experts may not have the same interests; instead they may need to utilize different semantic networks (if available) pertaining to their own specialties. For example, a stream chemist may not be interested in land use/land cover, contrary to an urban developer who would certainly focus on it. We address this problem by creating different user profiles, each cor-responding to a separate semantic network with its own bias towards a certain specialty. Initially, domain experts will define a set of profiles. A new user will select a profile before using our system, and can change this selection at any time. For each profile, we also track the usage patterns by users and
collect information that is used to dynami-cally refine and augment the network based on these patterns. Therefore, although an initial profile may not completely satisfy every user, it will adapt to user preferences after some period of time.
Refining and Augmenting the Semantic Network
The key idea to automatically refine, evolve, and augment the semantic network is to monitor usage patterns. Once the initial semantic network (or a given profile) has been created by a domain expert, users can query the metadata repository for data sources. The system provides exact answers and recommends additional data sources (displayed visually as in Figure 3). Then, the users select (click on) those data sources potentially relevant to their research. They submit their queries to the data sources, while the metadata repository keeps copies of queries to identify query patterns. Based on the usage of these patterns by users, we can infer additional relationships that form between data sources. These relationships
Figure 3. Visualiing a semantic network as a hyperbolic tree
54 Journal of Database Management, 18(1), 43-67, January-March 2007
Copyright © 2007, Idea Group Inc. Copying or distributing in print or electronic forms without written permission of Idea Group Inc. is prohibited.
are used to automatically expand, enhance and refine the semantic network.
As an example, suppose two users have asked for data sources related to ‘fish popu-lation.’ User1 selects all four data sources in Figure 2, while User2 selects only fish, temperature, and land data. Let F, T, S, L represent fish, temperature, surfaces, and land, respectively. We assume that users agree to incorporate every edge connect-ing two sources that they selected in the network, but disagree with all other edges of sources they did not select. For example, User1 agrees with the edges F-T, T- S, and S-L. However, User2 agrees with the edge F-T, but not the other two. The issue is how User2 selects the land data, which is only related to fish via surface data in the current network, and User2 does not select surface. We assume the user agrees with relationship between fish and land, where fish is an exact answer and land is a selected
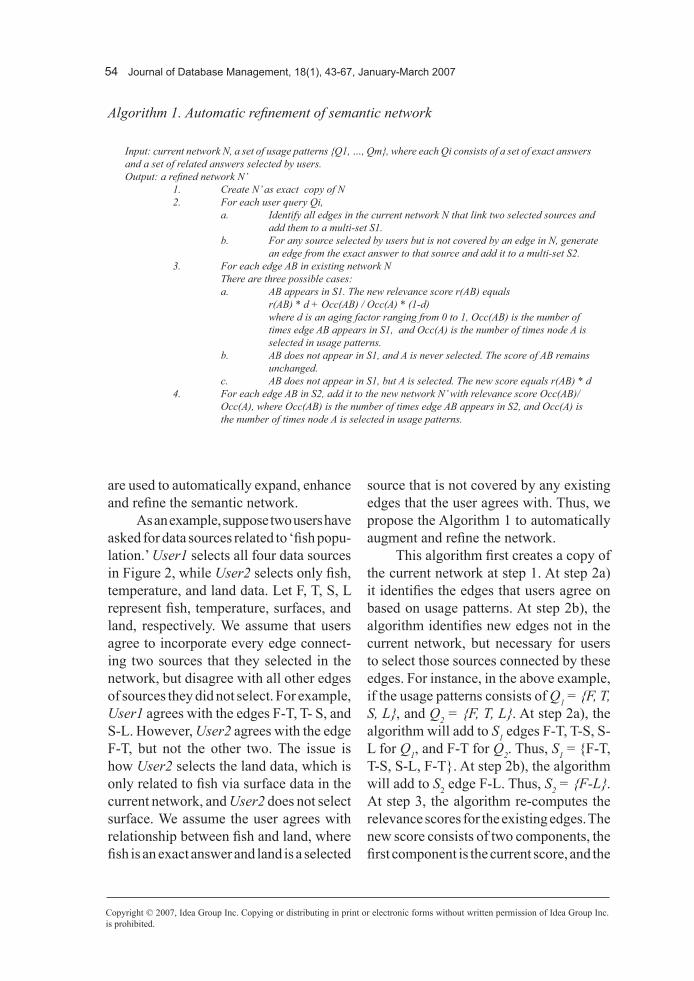
source that is not covered by any existing edges that the user agrees with. Thus, we propose the Algorithm 1 to automatically augment and refine the network.
This algorithm first creates a copy of the current network at step 1. At step 2a) it identifies the edges that users agree on based on usage patterns. At step 2b), the algorithm identifies new edges not in the current network, but necessary for users to select those sources connected by these edges. For instance, in the above example, if the usage patterns consists of Q1 = {F, T, S, L}, and Q2 = {F, T, L}. At step 2a), the algorithm will add to S1 edges F-T, T-S, S-L for Q1, and F-T for Q2. Thus, S1 = {F-T, T-S, S-L, F-T}. At step 2b), the algorithm will add to S2 edge F-L. Thus, S2 = {F-L}. At step 3, the algorithm re-computes the relevance scores for the existing edges. The new score consists of two components, the first component is the current score, and the
Algorithm 1. Automatic refinement of semantic network
Input: current network N, a set of usage patterns {Q1, …, Qm}, where each Qi consists of a set of exact answers and a set of related answers selected by users.Output: a refined network N’ 1. Create N’ as exact copy of N 2. For each user query Qi, a. Identify all edges in the current network N that link two selected sources and add them to a multi-set S1. b. For any source selected by users but is not covered by an edge in N, generate an edge from the exact answer to that source and add it to a multi-set S2. 3. For each edge AB in existing network N There are three possible cases: a. AB appears in S1. The new relevance score r(AB) equals r(AB) * d + Occ(AB) / Occ(A) * (1-d) where d is an aging factor ranging from 0 to 1, Occ(AB) is the number of times edge AB appears in S1, and Occ(A) is the number of times node A is selected in usage patterns. b. AB does not appear in S1, and A is never selected. The score of AB remains unchanged. c. AB does not appear in S1, but A is selected. The new score equals r(AB) * d 4. For each edge AB in S2, add it to the new network N’ with relevance score Occ(AB)/ Occ(A), where Occ(AB) is the number of times edge AB appears in S2, and Occ(A) is the number of times node A is selected in usage patterns.

Journal of Database Management, 18(1), 43-67, January-March 2007 55
Copyright © 2007, Idea Group Inc. Copying or distributing in print or electronic forms without written permission of Idea Group Inc. is prohibited.
second component is the score based on usage patterns. These two components are combined using a weight d, which is also called an aging factor because it determines how quickly the new score converges to the usage patterns. We set the aging factor d = 0.5 in this article. In the above example, the new scores are:
R(fish-temperature) = 0.9 * 0.5 + 1 * 0.5 = 0.95
R(temperature-surfaces) = 0.9 * 0.5 + 0.5 * 0.5 = 0.7
R(surfaces-land) = 0.9 * 0.5 + 0.5 * 0.5 = 0.7
R(fish-land) = 0.5 * 0.5 = 0.25.
Data navigation: A Visual Approach Visualization of data can be proven
to be a significant decision support tool. It can provide deep insights into data that are very difficult to capture by automatic means. Since environmental data often have different spatial and temporal granularities, environmental researchers are interested in viewing data at multiple resolutions. For example, a spike in stream flow, pre-cipitation, and nitrogen content will tell a scientist that there is an influx of nitrogen in the stream due to a precipitation event. However, a steady increase or decrease in stream flow, precipitation, and nitrogen content for several years will indicate a possible change in the longer term. Further-more, the recent development of wireless sensors and sensor networks has allowed for the collection of environmental data at high temporal resolution. In consequence, researchers often need to visualize this data for long time scales, that is, at lower resolutions.
Therefore, we present an effective multi-resolution visualization method us-ing wavelets to help researchers discover
patterns, trends, and surprises. The main benefit of using wavelets compared to using fixed levels of resolutions is that wavelets allow finer and more flexible levels of resolutions. For example, fixed levels al-low users to view stream temperature at minutes, hours, and days, while wavelets allow users to view the temperature at one minute, two minute, or four minute spans, and so on.
In this article, we apply wavelet transformations—we used Haar wavelets (Goswami & Chan, 1999), and we are cur-rently experimenting with other wavelet transforms—for numerical attributes. If the data contains spatial or temporal attributes (e.g., indicating the location or time the measurements were collected), we always sort the data records in the spatial or tem-poral order and apply wavelet transforma-tions to the sequence of the measurement attributes in this order. Otherwise, we view the measurement attributes as a sequence in the order that records are stored in the da-tabase, and apply wavelet transformations. Of course, in the latter case, the different levels of resolutions do not have spatial or temporal meanings, and only provide a lower-resolution view of the data.
The generated wavelet coefficients are then stored in an Object-Relational database (Oracle 10g). We have developed an algorithm (see Goswami & Chan, 1999) to reconstruct not only the complete set of the original data but also a certain subset of it, at appropriate levels of resolutions. The utility of reconstructing a subset of the original dataset stems from the fact that a decision maker may want to find out only that part of the original dataset that was used to generate a particular coefficient.
We developed a visualization tool to help environmental scientists visually inspect temporal and spatial datasets for

56 Journal of Database Management, 18(1), 43-67, January-March 2007
Copyright © 2007, Idea Group Inc. Copying or distributing in print or electronic forms without written permission of Idea Group Inc. is prohibited.
noticeable trends and relationships. Figure 4 depicts a prototype interface developed in Visual Basic which allows users to spatially locate and select data collection sites and visualize time-series data for the selected sites. The top pane connects to the ESRI’s ArcSDE® Geodatabase system where the user can navigate spatially using zooming and panning tools. The bottom pane con-nects to a DBMS which stores raw data along with wavelet-transformed data at various levels of temporal resolution. The left side of the interface allows the user to (1) select the site or sites of interest spatially or from a list, (2) select the time period of the visualization, (3) select the dataset (4) select the type of visualization, and (5) interactively control the temporal resolution of the visualization. The user can select a site, or sites, either spatially by using the GIS interface, or by selecting specific sites based on the site name. Once a site is chosen, the user can select the time period of the visualization by providing the date and time. Then the user can select whether
he or she may want to visualize the data using a line graph, bar graph, or scatter plot. The visualization is then displayed in the bottom pane of the interface. The slider below the displayed data allows the user to control the temporal resolution of the visualization. The slider goes from the resolution of the raw data on the left to the level n wavelet transformation on the right. The scale on the slider can change, based on a combination of the time period of the raw dataset and the level of wavelet trans-formations available. Data at the selected resolution will be reconstructed from the stored wavelet coefficients and shown to users. Figure 4 shows the McDonogh stream temperature site along with time series data at the 64 minute resolution for the month of June, 2004.
Pattern Discovery through Multi-Resolu-tion Data Mining
Multi-resolution data mining is similar in concept to online analytical mining (OLAM) (Han, 1998; Han, Chee,
Figure 4. Visual navigation of data

Journal of Database Management, 18(1), 43-67, January-March 2007 57
Copyright © 2007, Idea Group Inc. Copying or distributing in print or electronic forms without written permission of Idea Group Inc. is prohibited.
& Chiang, 1998). Conceptually, it allows a user to mine the data at different levels of the dimension hierarchy. We propose to augment the dimensional hierarchies with wavelet coefficients at different levels of decomposition and provide mining capa-bilities including association rule mining, classification, and clustering. This approach provides the benefits of OLAM, but in addition, it enables users to select the ap-propriate levels of resolution that would be ideally suited for mining the data. If the data is noisy, wavelet decomposition could reduce noise in the data and would result in a better classifier. We illustrate the efficacy of using wavelet decomposition in classification and its resilience on noise in the following section.
IMPlEMEntAtIon AnD ExPErIMEntAl rEsults
We have conducted preliminary ex-periments to validate our approaches of using semantic networks to help environ-mental researchers find related data sources and using wavelets to identify patterns in different data resolutions. Our major find-ings are:
• Users of our system concluded that our query expansion and visualization interface surpasses the traditional exact query interface. In all cases we tested, our query expansion interface returned more data sources than the exact query interface. They also found value in the automatic adaptation and augmentation of the semantic network based on profiles and refinement techniques.
• Wavelet transformation is a promising tool to discover patterns at different resolutions of data. Our experiments
demonstrated that for a real data set and a benchmark data set, wavelet transformation preserved most pat-terns in the data while it was used to convert data to a lower resolution. More interestingly, our results also showed that wavelet transformation is very robust to noise in data and in some cases even improved the quality of discovered patterns.
We first describe the implementation details, and then proceed to experimental results.
ImplementationWe used Oracle 10g to store metadata
of data sources and semantic networks us-ing the database schema in Figure 5. We use three relational tables (sources, edges, network) to store information about data sources, keywords, and relevance scores. The Edges table stores the edges and their relevance scores in the semantic network. The Network table stores the relevance scores between any pair of nodes in the semantic network, which is computed from the Edge table. We implemented the algorithms described in the previous section as PL/SQL stored procedures for the con-
Figure 5. Database schema for the semantic network
Sources
PK id
source_namekeywords
Edges
PK srcPK dest
score
Network
PK srcPK dest
score
58 Journal of Database Management, 18(1), 43-67, January-March 2007
Copyright © 2007, Idea Group Inc. Copying or distributing in print or electronic forms without written permission of Idea Group Inc. is prohibited.
struction, query expansion, and dynamic augmentation of the semantic network.
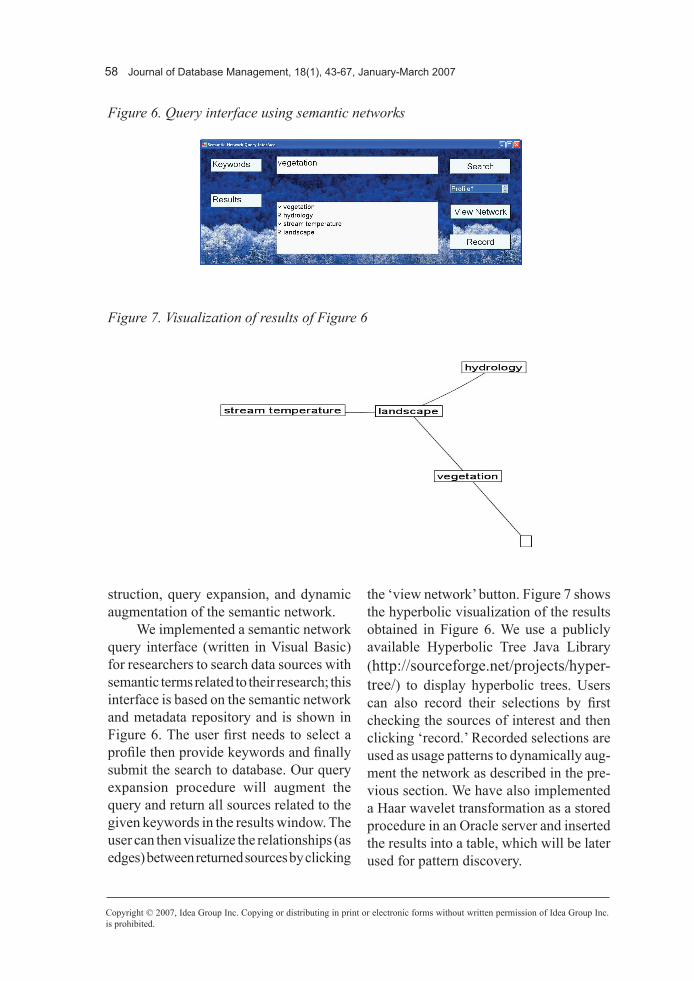
We implemented a semantic network query interface (written in Visual Basic) for researchers to search data sources with semantic terms related to their research; this interface is based on the semantic network and metadata repository and is shown in Figure 6. The user first needs to select a profile then provide keywords and finally submit the search to database. Our query expansion procedure will augment the query and return all sources related to the given keywords in the results window. The user can then visualize the relationships (as edges) between returned sources by clicking
the ‘view network’ button. Figure 7 shows the hyperbolic visualization of the results obtained in Figure 6. We use a publicly available Hyperbolic Tree Java Library (http://sourceforge.net/projects/hyper-tree/) to display hyperbolic trees. Users can also record their selections by first checking the sources of interest and then clicking ‘record.’ Recorded selections are used as usage patterns to dynamically aug-ment the network as described in the pre-vious section. We have also implemented a Haar wavelet transformation as a stored procedure in an Oracle server and inserted the results into a table, which will be later used for pattern discovery.
Figure 6. Query interface using semantic networks
Figure 7. Visualization of results of Figure 6

Journal of Database Management, 18(1), 43-67, January-March 2007 59
Copyright © 2007, Idea Group Inc. Copying or distributing in print or electronic forms without written permission of Idea Group Inc. is prohibited.
Experiments with semantic networks
Setup: We evaluated our semantic network approach using data sets collected by the Baltimore Ecosystem Study (http://www.beslter.org/). Table 1 summarizes the details of these data sets.
We asked an environmental researcher to define the edges in the initial semantic network between these data sets. The re-searcher created three different semantic networks corresponding to three different profiles of users interested in vegetation, stream temperature, and stream chemistry respectively. Figure 8 shows the networks where Pi identifies the score in the ith profile. In this experiment, the researcher consid-ered the relationships bidirectional.
We ran two experiments to test our search interface and the semantic network refinement algorithm. In the first experi-ment, we asked another researcher to use our search interface to find related data sources and asked him to give us feedback on the appropriateness of the results. Due to limited resources, we asked that researcher
to take on alternate roles of three different types of users and then we selected one of the three profiles. The researcher posted three example queries as follows:
• Query 1: What data sets are related to riparian vegetation? The researcher selected profile 1 and searched the data sources with keyword ‘vegetation.’
• Query 2: What factors contribute to the fluctuations in stream tempera-ture? The researcher selected profile 2 and used ‘stream temperature’ as the keyword.
• Query 3: What factors may affect the stream chemistry? The researcher selected profile 3 and used ‘stream chemistry’ as the keyword.
In the second experiment, we asked the researcher to select a set of data sources in the results of Query 4 that he thought was most related to the question he asked. We then ran our algorithm to refine the semantic network based on his selection and compared the results for Query 4 with the results using the original network. Our
Data Source Name Description LocationVegetation Riparian vegetation of the Gwynns Falls
Watershed in Baltimore areahttp://www.ecostudies.org/pub/besveg/riparian.zip
Hydrology Streamflow data collected along the Gwynns Falls in Baltimore area
http://waterdata.usgs.gov/md/nwis/nwisman?site_no=01589352
Stream Temperature Stream temperature of the Gwynns Falls Watershed
As an Excel file on local file server
Meteorology Baltimore meteorological station data http://www.ecostudies.org/pub/bes_206.zip
Stream Chemistry Stream chemistry data of the Gwynns Falls Watershed
As a text file on local file server
Landscape Satellite image data of Baltimore area landscape (forests, grass, crops, etc.)
As a text file on local file server
Table 1. Data sources used in semantic network experiments

60 Journal of Database Management, 18(1), 43-67, January-March 2007
Copyright © 2007, Idea Group Inc. Copying or distributing in print or electronic forms without written permission of Idea Group Inc. is prohibited.
search interface returned the following results:
• Query 1: Vegetation, hydrology, stream temperature, and landscape.
• Query 2: Stream temperature, me-teorology, and landscape.
• Query 3: Hydrology, meteorology, stream chemistry, and landscape.
In all cases, the exact search interface only returned one data source with the search keyword, while our search interface returned multiple sources (4 for Query 1 and 3, and 3 for Query 2). We also asked the researcher to look at the results returned by our interface, and he found the answers returned by our search interface actually related to these research questions.
In the second experiment, the user selected only the first three data sources for Query 3. When the researcher ran Query 3 on the refined network, the ‘landscape’ data source is no longer in the search results
due to the refinement. This reflected the user selection.
In summary, our experiments veri-fied that our system exploits data source relationships that are maintained in se-mantic networks and supplies users with additional data sources that are relevant to their original search, but they might not be aware of.
Experiments for Knowledge Discovery using Wavelet transformations
We conducted several experiments to test our hypothesis that wavelet transforma-tion results in preserving patterns in data. In the first experiment, we used remote sensing data from the Landsat 7 ETM+ sensor. Data from the Landsat 7 ETM+ sensor is typically used by environmental scientists to characterize the landscape in terms of land cover. The Landsat 7 ETM+ sensor captures wavelength values for 8 spectral bands based on the reflectance of the earth’s surface. Table 2 shows the range
spectral bandwidth ranges for landsat 7 EtM+ sensor (µ)band number Wavelength range recommended Application
Band 1 0.45 - 0.52 (blue-green) soil and vegetation discrimination and forest type mapping
Band 2 0.53 - 0.61 (green) vegetation discrimination, plant vigorBand 3 0.63 - 0.69 (red) detection of roads, bare soil, and vegetation type
Band 4 0.78 - 0.90 (near-infrared) biomass estimation, separation of water from vegetation, soil moisture discrimination
Band 5 1.55 - 1.75 (mid-infrared) discrimination of roads, bare soils, and water
Band 6 10 .4 - 12 .5 ( the rma l infrared) measuring plant heat stress and thermal mapping
Band 7 2.09 - 2.35 (mid-infrared) discrimination of mineral and rock types, interpreting vegetation cover and soil moisture
Band 8 .52 - .90 (panchromatic) for enhanced resolution and increased detection ability
Table 2. Adapted from A Primer on Landsat 7 (http://imaging,geocomm,com/features/sensor/landsat7)

Journal of Database Management, 18(1), 43-67, January-March 2007 61
Copyright © 2007, Idea Group Inc. Copying or distributing in print or electronic forms without written permission of Idea Group Inc. is prohibited.
of wavelengths captured in each band and its recommended application.
We downloaded a Landsat 7 ETM+ scene from October 5, 2001, covering central Maryland (path 15/row 33), from the Global Land Cover Facility (http://glcf.umiacs.umd.edu/data/). We extracted spectral information from the Landsat im-age and a subset was evaluated for a 1.2 km2 area in northern Baltimore County, Maryland. We then manually classified land cover values of crop, grass, forest, or water based on high resolution aerial photography.The resulting dataset consisted of eight attributes representing the spectral bands and one class attribute representing the four distinct land cover values. The spectral bands were used to identify whether the land cover is ‘grass,’ ‘forest,’ ‘water,’ or ‘crops’.This yielded 1193 instances that were divided into two groups. Group 1 had 616 instances that were used for training and group 2 had 577 instances that were used for testing. We performed the follow-ing steps. We (1) divided the data into two
disjoint sets – a test set and a training set; (2) performed first level of Haar wavelet transformation on the raw data; (3) created a 50% stratified sample of the training set of the raw data; (4) created three classifiers based on raw data, 50% stratified sample, and wavelet transformed data; and (5) compared the predictive accuracy on test data for the three classifiers. Two sets of three different classifiers were built using an adaptive Bayes network, a naïve Bayes method, and support vector machines (with linear kernel function) for the raw data and approximate coefficients from a Haar wavelet transformation of the raw data. We used Oracle 10g as the database and Oracle Data Miner for the mining functions. The reason for testing with a stratified sample is that the Haar wavelet transform reduces the data size by half. Hence the size of the training set for raw data is twice as large as that of the wavelet transformed data. As shown in Figure 9, in two out of three methods (naïve Bayes and support vec-tor machine), the use of a Haar wavelet
Figure 9. Performance comparison
Performance comparison
0.79
0.8
0.81
0.82
0.83
0.84
0.85
0.86
0.87
0.88
0.89
Adaptive Bayes Network Naïve Bayes Support Vector Machine
Data mining algorithms
Pred
ictiv
e ac
cur a
cy
Raw data50% stratified sampleWavelet transfomed data
62 Journal of Database Management, 18(1), 43-67, January-March 2007
Copyright © 2007, Idea Group Inc. Copying or distributing in print or electronic forms without written permission of Idea Group Inc. is prohibited.
transform resulted in a better classifier than both (1) the raw data with twice the size of the training set and (2) a 50% stratified sample that had the same size of the train-ing set. For the adaptive Bayes network, a wavelet transform resulted in 2% loss of predictive accuracy as compared with the raw data, but had a slightly higher predic-tive accuracy when tested with a training set of the same size.
In addition, we decided to test the sensitivity of classifier accuracy on a noisy dataset. For these experiments, we used the Iris plant dataset from the UCI machine learning repository (http://www.ics.uci.edu/~mlearn/MLSummary.html). The dataset contained 150 instances with four attributes and three class labels. The attributes represent sepal length, sepal height, petal length, and petal width and the class variable refers to one of three types of iris plant. Again, the same environment was used to test the predictive accuracy of three classifiers: an adaptive Bayes network, a naïve Bayes method, and support vec-tor machine. In each case, we introduced random noise following standard normal distribution to 10%-40% of the instances. As shown in Figures 10a-c, use of the Haar wavelet transform resulted in a classifier with a comparable predictive accuracy to the raw data. It is evident that the raw data outperforms the wavelet transformed data with 40% noise with the disparity in performance being more pronounced in the adaptive Bayes and naïve Bayes methods. This indicates a threshold in the noise-to-signal ratio below which the benefit of wavelet transformation is lost. Wavelets can be applied to any numerical attributes assuming that the data is sorted in the order that they are stored in the data-base. This approach has also been used by many existing studies (Matias et al., 1998;
Smith et al., 2004; Vitter & Wang, 1999; Vitter et al., 1998). The only difference is that the levels of resolutions do not have temporal or spatial meanings. While more research is needed to establish the efficacy of wavelet transformation, these prelimi-nary experiments do indicate that wavelet transformation holds promise as a robust tool for pattern discovery at multiple levels of data and as a method for data reduction in very large datasets with little degradation in predictive accuracy.
conclusIonIn this article, we have described a
methodology for data integration and pat-tern discovery for environmental research using data semantics. We used semantics to integrate multiple data sources to answer user queries for environmental research. Our methodology to describe the data sources is based on a metadata approach and takes advantage of data interrelation-ships represented as a semantic network. User queries are automatically expanded using a relevance score matrix and a se-mantic network, which can be visualized as a hyperbolic tree. We have utilized user profiles to capture diverse user preferences to precisely answer user queries, and have presented an algorithm to automatically expand, augment and refine the semantic network by observing usage patterns. We have demonstrated that our semantic integration techniques offer a powerful, straightforward and user-friendly approach for the visualization of significant amounts of environmental data sources.
In addition to enabling search for data in the integrated system described above, we also allow users to navigate through multi-dimensional data through visualization, implemented using wavelet
Figure 10. Performance comparison on noisy data

Journal of Database Management, 18(1), 43-67, January-March 2007 63
Copyright © 2007, Idea Group Inc. Copying or distributing in print or electronic forms without written permission of Idea Group Inc. is prohibited.
transformation. We have used Haar wave-lets that decompose data by averaging and differencing consecutive, non-overlapping pairs of data at each level of decomposition. Thus, users can visualize multiple levels of data and roll-up or drill down at different levels of hierarchy. They can also apply data mining techniques such as classifica-tion at different levels of resolution. We have illustrated that patterns in the data are well preserved at first level decomposition with 50% reduction in data size. We have also demonstrated the resilience of wavelet transformation to noisy data.
The research presented in this article is being enhanced by further development of the described methodologies and further experimentation with pattern discovery at multiple levels of resolution. We plan to in-corporate data mining and machine learning techniques to aid in the enhancement and refinement of the semantic network. The methodology presented in this article can also be applied to other application areas where search, visualization, and pattern discovery of data from multiple sources are needed.
AcKnoWlEDgMEntsThis material is based upon work
partly supported by the National Science Foundation under Grant Nos. DEB-0423476 and BES-0414206 and by U.S. Environmental Protection Agency under grants R-82818201-0 and CR83105801. Although the research described in this article has been funded in part by the U.S. Environmental Protection Agency, it has not been subjected to the agency’s required peer and policy review and therefore does not necessarily reflect the views of the agency and no official endorsement should be inferred.
rEfErEncEsAleman-Meza, B., Halaschek-Wiener, C.,
Arpinar, I. B., Ramakrishnan, C., & Sheth, A. P. (2005). Ranking complex relationships on the Semantic Web. IEEE Internet Computing, 37-44.
Batini, C., Lenzerini, M., & Navathe, S. (1986). A comparative analysis of methodologies for database schema integration. ACM Computing Surveys, 18(4), 323-364.
Bowers, S., Lin, K., & Ludascher, B. (2004). On integrating scientific resources through semantic registration. Paper presented at the Scientific and Statisti-cal Database Management.
Bowers, S., & Ludascher, B. (2004). An ontology-driven framework for data transformation in scientific work-flows. Paper presented at the Interna-tional Workshop on Data Integration in the Life Sciences.
Chang, K. C.-C., He, B., & Zhang, Z. (2005). Toward large scale integra-tion: Building a MetaQuerier over databases on the Web. Paper presented at the CIDR.
Chui, C. K., & Lian, J. (1996). A study of orthonormal multiwavelets. Applied Numerical Mathematics: Transac-tions of IMACS, 20(3), 273-298.
Daubechies, I. (1992). Ten lectures on wavelets. Capital City Press.
Dispensa, J. M., & Brulle, R. J. (2003). The Sprawling Frontier: Politics of Watershed Management. Submitted to Rural Sociology.
Doan, A., Domingos, P., & Halevy, A. Y. (2003). Learning to match the sche-mas of data sources: A multistrategy approach. Machine Learning, 50(3), 279-301.
64 Journal of Database Management, 18(1), 43-67, January-March 2007
Copyright © 2007, Idea Group Inc. Copying or distributing in print or electronic forms without written permission of Idea Group Inc. is prohibited.
EML.Ecological Metadata Language. http://knb.ecoinformatics.org/software/eml/
Fankhauser, P., Kracker, M., & Neuhold, E. J. (1991). Semantic vs. structural resemblance of classes. SIGMOD Record, 20(4), 59-63.
Friedman, M., Levy, A., & Millstein, T. (1999). Navigational plans for data integration. Paper presented at the AAAI/IAAI.
Georgakopoulos, D., Karabatis, G., & Gantimahapatruni, S. (1997). Speci-fication and management of interde-pendent data in operational systems and data warehouses. Distributed and Parallel Databases, An International Journal, 5(2), 121-166.
Goswami, J. C., & Chan, A. K. (1999). Fundamentals of wavelets: Theory, algorithms and applications: John Wiley.
Halevy, A. Y., Ives, Z. G., Suciu, D., & Ta-tarinov, I. (2003). Schema mediation in peer data management systems. Paper presented at the ICDE.
Han, J. (1998). Towards on-line analyti-cal mining in large databases. Paper presented at the ACM SIGMOD.
Han, J., Chee, S., & Chiang, J. (1998). Is-sues for on-line analytical mining of data warehouses. Paper presented at the Proceedings of 1998 SIGMOD’96 Workshop on Research Issues on Data Mining and Knowledge Discovery DMKD, Seattle, Washington.
Han, J., & Kamber, M. (2000). Data Mining: Concepts and Techniques: Morgan Kaufmann.
Hyperion. The Hyperion Project. http://www.cs.toronto.edu/db/hyper-ion/.
Jain, H., & Zhao, H. (2004). Federating heterogeneous information systems using Web services and ontologies. Paper presented at the Tenth Americas Conference on Information Systems, New York.
Kalfoglou, Y., & Schorlemmer, M. (2003). Ontology mapping: The state of the art. Knowledge Engineering Review, 18(1), 1-31.
Karabatis, G., Rusinkiewicz, M., & Sheth, A. (1999). Interdependent database systems. In Management of Hetero-geneous and Autonomous Database Systems (pp. 217-252). San Francisco, CA: Morgan-Kaufmann.
Kimball, R. (2002). The data warehouse toolkit (2nd ed.).
Kumar, N., Gangopadhyay, A., & Karabatis, G. (in press). Supporting mobile de-cision making with association rules and multi-layered caching. Decision Support Systems.
Lamping, J., Rao, R., & Pirolli, P. (1995). A Focus+Context Technique Based on Hyperbolic Geometry for Visualizing Large Hierarchies. Paper presented at the Proceedings ACM Confer-ence Human Factors in Computing Systems.
Levy, A. Y., Rajaraman, A., & Ordille, J. J. (1996). Querying heterogeneous information sources using source descriptions. Paper presented at the VLDB.
Mallat, S. G. (1989). A theory for mul-tiresolution signal decomposition: The wavelet representation. IEEE Transactions on Pattern Analysis and Machine Intelligence, 11, 674-693.
Masterman, M. (1961). Semantic message detection for machine translation,
Journal of Database Management, 18(1), 43-67, January-March 2007 65
Copyright © 2007, Idea Group Inc. Copying or distributing in print or electronic forms without written permission of Idea Group Inc. is prohibited.
using an interlingua. NPL, pp. 438-475.
Matias, Y., Vitter, J. S., & Wang, M. (1998). Wavelet-based histograms for selec-tivity estimation. Paper presented at the ACM SIGMOD.
Miller, R. J., Hernandez, M. A., Haas, L. M., Yan, L., Ho, C. T. H., Fagin, R., et al. (2001). The clio project: managing heterogeneity. SIGMOD Record, 30(1).
Mitchell, T. M. (1997). Machine learning: McGraw-Hill.
ORS.Open Research System. http://www.orspublic.org
Ouksel, A., & Sheth, A. P. (1999). Special issue on semantic interoperability in global information systems. SIGMOD Record, 28(1).
Papakonstantinou, Y., Garcia-Molina, H., & Ullman, J. (1996). Medmaker: A mediation system based on declara-tive specifications. Paper presented at the ICDE.
Percival, D. B., & Walden, A. T. (2000). Wavelet methods for time series analy-sis. Cambridge University Press.
Rahm, E., & Bernstein, P. A. (2001). A survey of approaches to automatic schema matching. VLDB Journal, 10(4).
Ram, S., Khatri, V., Zhang, L., & Zeng, D. (2001). GeoCosm: A semantics-based approach for information integration of geospatial data. Paper presented at the Proceedings of the Workshop on Data Semantics in Web Information Systems (DASWIS2001), Yokohama, Japan.
Ram, S., & Park, J. (2004). Semantic con-flict resolution ontology (SCROL): An ontology for detecting and resolv-ing data and schema-level semantic
conflicts. IEEE Transactions on Knowledge and Data Engineering, 16(2), 189-202.
Ram, S., Park, J., & Hwang, Y. (2002). CREAM: A mediator based envi-ronment for modeling and access-ing distributed information on the Web. Paper presented at the British National Conference on Databases (BNCOD).
Rice, J. A. (1994). Mathematical statistics and data analysis. Duxbury Press.
Rusinkiewicz, M., Sheth, A., & Karabatis, G. (1991). Specifying interdatabase dependencies in a multidatabase en-vironment. IEEE Computer, 24(12), 46-53.
Sarawagi, S., Agrawal, R., & Megiddo, N. (1998). Discovery-driven exploration of OLAP data cubes. Paper presented at the International Conference on Extending Database Technology.
SEEK. The Science Environment for Ecological Knowledge. http://seek.ecoinformatics.org
Sheth, A., Aleman-Meza, B., Arpinar, I. B., Bertram, C., Warke, Y., Ramak-rishanan, C., et al. (2004). Semantic association identification and knowl-edge discovery for national security applications. Journal of Database Management, 16(1).
Sheth, A., Arpinar, I. B., & Kashyap, V. (2003). Relationships at the heart of Semantic Web: Modeling, discover-ing, and exploiting complex semantic relationships. In M. Nikravesh, B. Azvin, R. Yager & L. A. Zadeh (Eds.), Enhancing the power of the Internet studies in fuzziness and soft comput-ing. Springer-Verlag.
Sheth, A., Bertram, C., Avant, D., Ham-mond, B., Kochut, K., & Warke, Y.

66 Journal of Database Management, 18(1), 43-67, January-March 2007
Copyright © 2007, Idea Group Inc. Copying or distributing in print or electronic forms without written permission of Idea Group Inc. is prohibited.
(2002). Managing semantic content for the web. IEEE Internet Comput-ing, 6(4), 80-87.
Sheth, A., & Karabatis, G. (1993, May). Multidatabase Interdependencies in Industry. Paper presented at the ACM SIGMOD, Washington DC.
Smith, J. R., Li, C.-S., & Jhingran, A. (2004). A wavelet framework for adapting data cube views for OLAP. IEEE Transactions on Knowledge and Data Engineering, 16(5), 552-565.
Stollnitz, E. J., Derose, T. D., & Salesin, D. H. (1996). Wavelets for Computer Graphics Theory and Applications: Morgan Kaufmann Publishers.
Tatarinov, I., & Halevy, A. Y. (2004). Ef-ficient Query Reformulation in Peer-Data Management Systems. Paper presented at the SIGMOD.
TopicMap.XML Topic Maps (XTM) 1.0 http://www.topicmaps.org/xtm/
UDDI. Universal description, discovery
and integration. http://www.uddi.org
Vitter, J. S., & Wang, M. (1999). Ap-proximate computation of multidi-mensional aggregates of sparse data using wavelets. Paper presented at the ACM SIGMOD.
Vitter, J. S., Wang, M., & Iyer, B. (1998). Data Cube Approximation and Histo-grams via Wavelets. Paper presented at the 7th CIKM.
W3C. Semantic Web. http://www.w3.org/2001/sw/.
Zhao, H., & Ram, S. (2002). Applying classification techniques in semantic integration of heterogeneous data sources. Paper presented at the Eighth Americas Conference on Information Systems, Dallas, TX.
Zhao, H., & Ram, S. (2004). Clustering schema elements for semantic integra-tion of heterogeneous data sources. Journal of Database Management, 15(4), 88-106.
Zhiyuan Chen received the PhD degree in computer science from Cornell University in 2002. Presently, he is an assistant professor in the Information Systems Department at University of Maryland, Baltimore County (UMBC). His research interests include XML and semi-structured data, privacy-preserving data mining, data integration, automatic database tuning, and database compression.
Aryya Gangopadhyay is an associate professor of Information Systems at UMBC. He has a PhD in Information Systems from Rutgers University. His current research interests are in the areas of knowledge discovery in databases and privacy issues in information systems. He has published over 50 peer-reviewed articles in academic publications such as Decision Support Systems, IEEE Transactions on Knowledge and Data Engineering, Information Resources Management Journal, Artificial Intelligence in Engineering, IEEE Computer, and Journal of Management Information Systems. He is in the editorial board of the International Journal of E-Business Research and the Journal of Electronic Commerce in Organizations.

Journal of Database Management, 18(1), 43-67, January-March 2007 67
Copyright © 2007, Idea Group Inc. Copying or distributing in print or electronic forms without written permission of Idea Group Inc. is prohibited.
George Karabatis is an assistant professor of information systems at the University of Maryland, Baltimore County (UMBC). He holds degrees in computer science (PhD and MS) and mathematics (BS). His research interests are on various aspects of information technology related to database systems, including semantic information integration, bioinformatics and applications for mobile handheld devices. Prior to his current appointment he was a research scientist at Telcordia Technologies (formerly Bellcore) where he led several telecommunications projects involving database related technologies. His work has been published in journals, conference proceedings and book chapters.
Michael P. McGuire is the geospatial data services manager for the Center for Urban Environmental Research and Education at UMBC and provides technical support to the Baltimore Ecosystem Study for data management and spatial analysis Mr. McGuire holds a Bachelor of Science degree in geography from Towson University and an MS in information systems from UMBC where he is now pursuing his PhD. Prior to his appointment at UMBC, Mr. McGuire held positions at the Baltimore County Office of Planning and Maryland Department of the Environment. His research interests include spatial data warehousing, information visualization, and decision support systems.
Claire Welty is the director of the Center for Urban Environmental Research and Education and professor of civil and environmental engineering at University of Maryland, Baltimore County. Dr. Welty’s work has primarily focused on in transport processes in aquifers; her current research interest is in urban watershed hydrology, particularly in urban groundwater. Prior to her appointment at UMBC, Dr. Welty was a faculty member at Drexel University for 15 years. She holds a PhD in civil and environmental engineering from MIT and is currently a member of the Water Science and Technology Board of the National Research Council.