selling shares to worker-investors: analyzing the ... · 2 selling shares to worker-investors:...
TRANSCRIPT

1
Preliminary draft: Please do not cite or circulate without the authors’ permission
Selling Shares to Worker-Investors:
Analyzing the Ouverture du Capitalat France Télécom
Draft dated July 12, 1999
Francois DegeorgeHEC School of Management
Dirk JenterHarvard University
Alberto MoelHarvard Business School
Peter TufanoHarvard Business School and NBER

2
Selling Shares to Worker-Investors:Analyzing the Ouverture du Capital at France Télécom
In 1997, France Télécom, the French telecommunications firm, went through apartial privatization or “Opening of Shareholding.” As part of this process, thegovernment offered current and prior France Télécom employees the opportunity to buyportfolios of shares with various combinations of discounts, required holding periods,leverage, tax treatment, and levels of downside protection. We adapt a neoclassicalmodel of investment decision-making that takes into account firm-specific human capitaland holding period restrictions to predict how employees might respond to the shareoffers. Using a new database that tracks over 200,000 eligible participants, we analyze theemployees' characteristics and their decisions regarding (a) whether to participate; (b)how much to invest; and (c) what form of stock alternatives they selected.
As predicted by the neoclassical model, participation increases with wealth andcurrent income, and decreases with job tenure (our measure of firm-specific humancapital). However, the tenure effect is small, and civil servants and non-retired formeremployees—all of whom have less human capital at risk—participate less, inconsistentwith our predictions. Consistent with the concept that as the retirement horizondecreases, risk aversion increases, older workers tend to invest less frequently. Withrespect to investment amounts, wealthier and better-paid workers invest more andworkers with greater tenure invest less, as predicted by the model and consistent with theparticipation results. However, the amount of funds invested in the stock plans seemsdriven by a different set of forces than the decision to participate. Older workers, civilservants, men, former employees and retirees are less likely to participate in the offering,but if they do, they tend to invest more (or no less) than others. We suspect that thisphenomenon reflects a "threshold effect." If an employee's desired investments (andperceived participation benefits) do not exceed his cost of analyzing the offering, he doesnot participate; conditional on participating, however, his investments will be large.Marketing and communication efforts by the firm seem reduce this cost of analysismaterially. Finally, we find that the characteristics of the chosen portfolios (holdingperiod restrictions and downside protection) are broadly consistent with theoreticalpredictions from our neoclassical model.
Contact information: Degeorge, HEC School of Management, 78351 Jouy en Josas Cedex, France([email protected]); Jenter, Moel and Tufano, Harvard Business School, Boston, MA 02163([email protected]; [email protected]; [email protected])Acknowledgements: We would like to thank Gérard Gruet-Masson, Karine Daniel and Frédéric Dubacq ofFrance Télécom for kindly providing us with France Télécom data, and for helpful discussions. We wouldlike to thank Nicholas Barberis, Shlomo Benartzi, Marc Bertoneche, John Campbell, George Chacko, JohnGourville, William Greene, G.S. Maddala, Daniel McFadden, Jack Porter, Georges Trepo, Luis Viceira,Luc Wathieu, Ivo Welch and seminar participants at the Darden School (University of Virginia), LondonBusiness School, Séminaire Bachelier, UCLA and the French Finance Association Meetings (AFFI) fortheir comments and suggestions. This research was supported by the Division of Research at the HarvardBusiness School under the Global Financial System project and by Fondation HEC. Frédéric Pannecièreprovided able research assistance. The views expressed here are those of the authors and do not reflect theviews of France Télécom.

1
1. Introduction
Many of the proposed solutions to the misalignment of managers’, workers’, and
shareholders’ interests recommend that managers and workers hold shares in the firms in
which they work.1 By giving employees the financial incentives of shareholders, they
will act to increase shareholder value. These prescriptions are embodied in a number of
institutional practices: the payment of stock (and stock options) to executives and workers
as a portion of their compensation, the establishment of Employee Stock Ownership
Plans (ESOPs) at firms, the sale of discounted stock to employees, and government
mandates that workers of privatized firms buy shares in the firms for which they work.
Yet selling stock to their employees often proves a substantial challenge for
companies. In many developed countries, there is still little tradition of individuals
investing in the stock market. Moreover, for diversification purposes workers may be
reluctant to hold their employer’s stock.2 To the contrary, workers whose undiversified
human capital fluctuates with the fate of their employer may prefer to invest their
financial assets outside the firm. Thus the sale of company stock to employees represents
a large-scale marketing challenge. Designers of schemes to encourage workers to buy
shares must motivate workers to buy and hold the firm’s stock, while respecting the
budget constraints of the firm (or government).
In this paper, we study one of the larger privatizations in Europe, which faced this
problem: France Télécom’s 1997 Ouverture du Capital or “opening of shareholding.”
The state-owned French telecommunications giant was planning to sell shares to private
investors, and under French law, needed to induce employees to invest as well. The firm
created four distinct investment vehicles to allow and encourage employees to invest.
The schemes were all based upon the firm’s common stock, but differed along five
dimensions: the level of discounts and free shares granted to employees; the access to
1 See for instance Blinder (1990) and the articles therein, Jones and Kato (1995), and Scholes and Wolfson(1990). Employee stock ownership can also serve as a means for corporate tax savings and as a takeoverdeterrent. The case for employee ownership is advanced by the National Center for Employee Ownership(http://www.nceo.org)2 Brennan and Torous (1999) show that the welfare costs of under-diversification can be large.

2
subsidized financing and additional leverage; the period that employees were required to
hold the stock; the tax treatment; and finally, the degree of downside protection offered to
the employee in the event that the stock price declined below the initial offering price.
Our paper analyzes the employees’ response to the firm’s stock offering proposal.
Our database consists of information on each of the more than 200,000 past and present
France Télécom workers eligible to participate. For each eligible participant, we have
personnel data including their age, tenure, rank, gender, and employment status (civil
servant, non-civil servant, retiree, or former employee). We also have information on the
number and type of shares requested and obtained for each employee.
We have two related goals in writing this paper. The first is to describe the
employee response to the investment offers, addressing three related questions. Which
employees chose to participate in the employee stock offering plan? How much did they
invest in the plan? And how did the employees choose from among the four different
alternatives?
Our second goal is to extend existing theory to produce testable implications
about the investment choices of the worker-investors at France Télécom. Drawing
primarily upon neoclassical models of optimal investment and consumption, we build a
stylized model of the investment choices facing a risk-averse worker-investor whose
human capital is partially firm-specific, i.e., his labor income is correlated to the firm’s
fortunes. (The model is detailed in the Appendix). We can then examine how the size of
human vs. financial capital, the degree of firm-specificity in human capital, the investors’
horizon, and the degree of relative risk aversion should influence the investment choice of
the worker-investor. We then attempt to relate these unobserved parameters to observed
employee characteristics in order to draw implications about different investment choices.
For example, our sample includes current workers (both civil servants and employees-at-
will), retirees, and prior workers still in the workforce. We appeal to these differences to
capture levels and firm specificity of human capital.
We acknowledge that we cannot “test” whether the prescriptions of optimal
investment theory are correct. Even if the France Télécom employees were to behave
exactly according to theory, observable measures of the simplest of theoretical variables

3
are very noisy and often highly correlated. Nevertheless, given the dearth of empirical
studies of investor behavior, a study of this kind can begin to illuminate how human
capital and other factors influence individual’s investment decisions.
We find that the decisions of whether to participate in the offering, and of how
much to contribute, are driven by different factors. Specifically, several groups of
employees –civil servants, men, and former employees and retirees – participated less
frequently, but conditional on participating, invested more. It appears that a threshold
level of desired investment must be attained for participation to occur. For some groups,
this threshold may be higher (and participation likelihood lower), but conditional on
meeting it, personal contribution is higher. We conjecture that this threshold arises due to
the cost of analyzing the France Télécom offering, and offer some supportive empirical
evidence. Overall, our findings hint at the importance of marketing efforts in the
employee stock offering.
We find some evidence of a human capital effect, but the magnitudes are small.
We use tenure at France Télécom as a proxy for a worker’s firm-specificity of human
capital, and we find that workers with tenure one standard deviation above the mean are
0.5% less likely to participate in the offering, and make 6-9% smaller personal The small
size of the human capital effect may be consistent with the observation that little human
capital is at risk in France, or rather that employees falsely act as-if this were so.
The effects predicted by the neoclassical model for financial wealth and salary are
borne out by the data: workers with higher financial wealth and salary participate and
invest more. Consistent with the concept that as retirement horizon decreases, risk
aversion increases, older workers tend to invest less. Finally we find modest gender-
related differences in participation and investment.
The remainder of the paper is organized as follows: Section 2 provides a brief
background on privatizations in general and on the Opening of Shareholding at France
Télécom. Section 3 describes the alternatives the government and France Télécom made
available to eligible participants in the employee stock plan. These choices allowed
employees to trade-off larger discounts in return for either longer holding periods or some
downside protection. Section 4 reviews the existing theory of investment decision-

4
making and discusses the predictions of this theory as applied to our problem. The
formal model we use is detailed in the Appendix to the paper. Section 5 describes the
data and the variables we use. Section 6 provides the core of the empirical analysis, in
which we report on the three aspects of employee response: the decision to participate,
the quantity of funds invested, and the portfolio of attributes (discounts, holding period,
and downside protection) selected. We examine the cross-sectional dispersion of
employee choices as a function of observable characteristics. Finally, Section 7 briefly
concludes and discusses next steps for this project.
2.
2. The privatization of France Télécom3
The political context surrounding the privatization of France Télécom was
complex and the conservative governments in place between 1993 and 1997 were divided
on the issue. Advocates of privatization, including the firm’s top executives, argued that
a state-owned France Télécom could not compete effectively in a deregulated European
telecommunications market. The full liberalization of the European telecommunications
market was scheduled for January 1, 1998, and across the continent, state-owned
telecommunications firms were turned over to private control. Telefonica of Spain was
privatized in February 1997; Italy partially privatized Telecom Italia in 1995; and
Deutsche Telekom was privatized in 1996 and 1997.
Initially, France Télécom’s unions were strongly against its privatization. The
vast majority of the firm’s employees were civil servants, who enjoyed job security and a
generous pension scheme that privatization could jeopardize. On October 12, 1993, 75%
of France Télécom employees went on strike against privatization. France Télécom
negotiated an agreement with unions which defused employees' fears successfully. Under
the June 1996 deal, the State would keep a stake of at least 51% in France Télécom;
current employees would keep their civil servant status even after privatization, while
new employees would acquire private sector status; and France Télécom would make a
one-time payment to the State to fund its employees' pensions.
3 For a study of a related French privatization, see Collat and Tufano (1994).

5
By April 1997, all hurdles had been cleared and the privatization of France
Télécom was ready. President Chirac called general elections, which brought a socialist
government in power. Its campaign platform explicitly opposed the privatization of
France Télécom. It thus seemed as if the offering would have to be postponed until a new
political majority came to power. Instead, the socialist government performed a quick
about-face, and in September 1997 officially announced a slightly scaled-back
privatization of France Télécom. The official reason given for the change in policy was
the need to list the France Télécom stock so that a stock swap between France Télécom
and Deutsche Telekom could be arranged. Fiscal realism played a role too. Countries
wishing to join in the European monetary union had to maintain a ratio of budget deficit
to GDP below 3%, and privatization proceeds were counted as revenues toward this goal.
Finally, an important driver of the socialist change of heart was the upcoming full
deregulation of European telecommunications, as witnessed by the string of privatizations
in Italy, Germany and Spain. Yet, the political unease felt by the French socialist
government about privatizing France Télécom was still palpable in the label chosen for
the offering: not a privatization, but an "Opening of Shareholding" (Ouverture du
capital).
The Opening of Shareholding took place on September 23, 1997. The offer price
for individual investors was set at FF 182, while the price for institutional investors was
FF 187. The individual investor tranche was oversubscribed by 2.91 times, while the
institutional investor tranche was oversubscribed 20 times. The first day closing price
was FF 206.50, for a one-day return of 13.5% from the individual investor offer price.4
Employee ownership
Achieving a high level of employee ownership was an explicit goal of the
government and France Télécom management, not least to defuse any remaining hostility
to privatization within France Télécom. Having a large number of employees purchasing
France Télécom stock would amount to a vote of confidence in privatization and in the
4 By comparison, the first day returns of prior French privatizations were 7.17% for UAP, 10.65% for Elf,16.15% for Rhone-Poulenc, 1.74% for Usinor, -8.29% for Pechiney, and 15.46% for BNP.

6
company's strategy. It would also create the proper incentives for workers. Finally,
French law dictated that employees purchase shares in the firm, or else the firm would
bear the carrying cost of the unsold employee shares.
The challenge of selling France Télécom stock to the France Télécom workforce
was substantial.5 In general, the fraction of French individuals with prior experience in
stock investing was quite low. In 1986, only 8.4% of French households were estimated
to hold stocks, and in 1992, this percentage was estimated at 11.8%. French research
showed that less well-to-do households (such as the blue-collar workers at France
Télécom) were less inclined to hold shares. 6 An overwhelming majority (78%) of France
Télécom employees were civil servants. Their choice to be civil servants might indicate a
low tolerance for bearing risk or a minimal interest in the private sector. Although no
data are available on employees’ portfolios of financial assets, it is likely that only a
minority were familiar with the basic mechanisms of stock market investing.7 Finally, at
least some employees might appreciate the appeal of diversification—i.e., that they might
not want to put all of their eggs in one basket—and might prefer to invest elsewhere.
France Télécom devoted substantial resources to marketing the employee portion
of the offering. Executive management wished to see as many employees as possible
participate – even if they contributed small amounts.8 Three thousand employees were
trained to market the offering throughout the company. A Minitel9 service allowed
employees to simulate the value of the various France Télécom offerings under various
scenarios for the France Télécom stock price.10 Literature distributed to employees
exhorted employees to participate: “All of you who have contributed to make France
5 Former employees and retirees who left France Télécom after 1991 were also eligible for the employeeoffering. 6 See Arrondel and Masson (1990) and Szpiro (1995).7 We have been told that many employees did not understand why the stock price simulations in the offeringdocuments included cases in which the stock price fell. After the offering, whenever the stock price wentdown, France Telecom received telephone calls from employees asking for an explanation.8 However, confidentiality was guaranteed. No one in the France Télécom hierarchy had any knowledge ofwhether their subordinates, peers, or bosses participated in the offering. 9 Minitel is an interactive teletext-based electronic information system widely used by French households.10 The actual offering price was announced several days before employees were to submit their sharerequests.

7
Télécom the great company that it is today, by becoming shareholders, can now become
partners in its future success.” 11
While the firm could expend personnel resources to make the offering a success, the
financial incentives the government could offer to employees were constrained by law
and politics. The amount of concessions was determined by negotiation with the
government. In this instance, the ultimate offer to employees was reported to be “the best
ever agreed to by the State to employees of companies that list their shares in the Stock
Exchange.” It was not feasible to merely give the shares to employees, so to induce
workers to buy shares (albeit at a discount) the security designers needed to create an
attractive set of investments.
3. The privatization of France Télécom: The offering schemesThe challenge of designing employee stock offerings that simultaneously
addressed the poor liquidity of most employees, their risk aversion, their poorly
diversified human capital and their hesitation with holding shares had been an issue in all
of the prior French privatizations. For its “Opening of Shareholding,” France Télécom
adapted the program initially used by the French Trésor and Rhône-Poulenc in 1993.12 In
literature describing the program to employees, the company outlined the principles that
dictated the design of the offerings:
“To make the purchase of France Télécom shares accessible to everyone, the offerreserved for employees follows five principles:
• concentrate a majority of benefits on the first few thousand francs in investment.• help each of you to finance your investment by offering payment terms and by
offering a plan with a bank loan.• offer a number of choices, and the possibility of investing in more than one plan at
the same time.• give incentives for long-term shareholding to foster the creation of a stable
shareholder base.• respect the freedom of choice of each agent and guarantee the confidentiality of
the operation.”
11 France Telecom document, “Guide for the Salaried Shareholder,” 1997. Subsequent quotes detailing theplan come from this document.12 See Collat and Tufano (1994).

8
The desire to offer employees choices was manifested in the fact that France
Télécom offered its employees four different share ownership programs. Each share
ownership program varied along five dimensions: (a) discounts, which could come in the
form of discounts from the public offering price as well as bonus (matching funds) and
free shares; (b) access to subsidized financing and additional leverage; (c) the length of
the required holding periods; (d) tax-free treatment; and (e) protection from losses in the
form of implicit put options.
Four different share ownership schemes were structured, representing different
bundles of these attributes: Abondix, Multiplix, Simplix, and Disponix. In general terms,
the employee could get bigger discounts, more attractive financing, tax-free treatment or
protection from losses by committing to hold the France Télécom shares for a longer
period of time. Table I shows a summary of each program’s attributes.
All 174,091 current French employees of France Télécom (or of more than 50%-
owned subsidiaries) were eligible to participate. In addition, 30,985 former employees
who left the firm between 1991 and 1997 were eligible to participate, but could purchase
only two of the four plans (Simplix and Disponix). The group of former employees
includes 22,357 retirees as well as 8,628 former employees who left prior to retirement.
(a) Disponix: “Be able to sell the shares at any point in time.”
The Disponix alternative contained the fewest benefits and the fewest employee
restrictions in terms of required holding period. The name of the plan derived from the
fact that the shares were available immediately and at the employee’s disposal
(disponible) as there was no mandatory holding period. Shares in this program carried no
purchase discount and had to be bought at the individual offer price of FF 182.00. If the
shares were held for more than one year, the government would give participants one free
share for each three shares (up to 37 shares), which effectively translated into a maximum
33% premium for participants. The Disponix program offered no financing benefits and
the employee had to pay for the shares in cash at the time of purchase. There was no

9
downside protection were the employee to hold the shares and they were to drop in value.
Dividends and capital gains from this program were taxable.13
(b) Simplix: “Achieve a balance between offering plan benefits and holding period.”
In return for agreeing to hold the France Télécom shares for two years, employees
who participated in the simple or Simplix share program would enjoy a number of
additional benefits including discounts, free shares, and subsidized financing. Shares
could be purchased in this program at a 20% discount from the offering price (FF
145.60.) If the shares were held for more than three years, the government would give
one free share for each share up to 20 shares, and one free share for each four shares
above 20.14 Like the Disponix alternative, dividends and capital gains from this program
were taxable and the plan contained no downside protection.
(c) Abondix: “Acquire numerous advantages and invest for the long term.”
If the employee was willing to hold the shares for five years, he or she could enjoy
the Abondix alternative, which offered additional bonus (or matching) shares, tax-free
treatment, and an additional financing alternative. The purchase price, payment options,
and free shares were identical to Simplix. But participants in the Abondix program
received three additional benefits. The first was the high company-matched bonus shares
(called the abondement), which is comparable to an employer-matching program. The
company would give a 100% bonus for the first FF 3,000 of Abondix requested. For
example, if the employee contributed FF 3,000, the company would match the
employee’s contribution one-for-one, so that the employee could buy FF 6,000 of shares
at 145.6, or 80% of the initial offer price. The matching rate was 50% for the next FF
13 Under the French tax regime, the first FF 8,000 of dividends for individuals, and the first FF 16,000 forcouples are tax free. Above this, dividends are taxed at regular income rates, which would range from 28%to 37% for the bulk of France Télécom employees. Capital gains are taxed at a 20.9% rate.14 Payment for the shares in the program could be made in one of three different ways: (a) in cash, (b) inthree interest-free payments of 30% upon delivery, 30% after a year, and 40% after two years, or (c) in 36equal monthly interest-free payments.

10
6,000 (up to a maximum of FF 3,000) and a 25% for the next FF 66,000. No bonus
would be given for purchases above FF 75,000 (3,000 + 6,000 + 66,000).
Second, because the shares would be held in the company retirement plan, the
bonus shares, capital gains, and paid dividends would be tax-free (although social
security contributions of 3.9% would be applicable). Third, payment could be made
through the exchange (transfer) of equivalent value assets from the company pension plan
(known as the PEG), although payments made through transfers would carry no bonus.
While the participant in Abondix agreed to hold the shares for five years,
redemption was allowed in years 3 through 5 under special circumstances. In case of
“early redemption” by the employee, the shares would be sold at market price to pay off
the 20% discount, the bonus, and a 5% penalty of the value of the shares sold. Any
excess would be transferred to the employee’s pension plan.
(d) Multiplix: “Multiply, with full security, your savings capacity.”
The Multiplix share purchase program offered a unique combination of leverage
and downside protection. The employee could purchase shares at FF 145.60 (a 20%
discount from the offering price) and would receive a 50% bonus for the first FF 2,000 of
Multiplix requested.15 For each one share the employee bought in Multiplix, he would
enjoy 100% appreciation beyond the offer price (FF 182) on ten shares. In addition, the
employee was guaranteed a 25% total return on his personal contribution at the end of
five years (or 4.6% per year).16 In the five years that the employee participated in the
Multiplix program, he would forgo all dividends and associated tax credits on the shares.
Bonus shares and capital gains would be tax free, as the shares would be held in the group
savings plan.
Functionally, the Multiplix scheme is quite different from the other three plans.
Where they offer linear payoffs, Multiplix offers a non-linear, option-style payoff. The
payoff could be represented a number of ways. Perhaps the simplest is as two
15 If the employee contributed FF 3,000, the company would provide another FF 1,000 which could be usedto buy shares at 80% of the offer price.16 Early redemption would void the 25% guaranteed return on the employee contribution.

11
components (a) a risk-free zero-coupon bond paying 1.25 times the employee’s personal
contribution plus bonus, and (b) 10 call options struck at the offer price for each share
that the employee bought directly. Figure 1 plots the final portfolio value after five years
of an initial FF 9,000 investment in either Abondix or Multiplix, including all bonuses and
free shares. Legally, this payoff was delivered through a unique “loan” which allowed
the employees to buy nine additional shares for each one purchased through personal
contribution and bonus.17 As is apparent from the figure, the Multiplix option dominates
investments in Abondix for a wide range of final stock prices; it is both downside
protected, and offers much larger upside. It is only over a narrow range of ending stock
prices (FF 80 to FF 200, versus an initial offer price of FF 182) that Abondix is marginally
better.
Means of payment, taxation, and holding period requirements were the same as
those of Abondix (except that the employee could not transfer funds from the company
pension plan to pay for the Multiplix shares).
(e) Program constraints and portfolio composition
Overall, the share alternatives were quite attractive to the employees. To give a
sense, were an employee to invest 9000 FF, he could buy about 12,000 FF of stock under
the Disponix plan, 16,312 FF under Simplix and 25,610 FF under Abondix. (These ignore
the subsidized financing, avoidance of transaction costs, and tax-free status under
Abondix). Were he able to invest 9,000 FF in Multiplix, he would receive a package
worth between 27,500 and 39,000 FF, depending on the volatility of France Télécom
stock. These are substantial benefits, large enough to attract employee attention.
• Under the principle of allowing employees freedom of choice, the program
allowed employees to participate in more than one plan, subject to certain
limitations as stated below.
17 What makes this loan peculiar is that the repayment is effected through the withholding of the dividendsand tax credits (over the five year life of the plan) and a variable repayment schedule at maturity that is afunction of the ultimate France Télécom stock price. In effect this loan repayment schedule is equal to thepositive difference between the value of ten shares less the payoff to the employee described above. Figure1 assumes that the dividend plus tax credit yield on France Télécom is 3.6%.

12
• Total contributions to the pension plan (under the Abondix and Multiplix
programs) each year could not exceed 1/4 of the employees’ gross France
Télécom income. The loan implicit in Multiplix would count towards this
limit. This rule is often a binding constraint on portfolio design.
• The total personal investment into Multiplix could not exceed FF 9,000.
• The total bonus paid into the pension plans could not exceed FF 22,500, and
the Abondix bonus would be allocated before the Multiplix bonus.
• In order to participate in Multiplix, employees must have bought at least one
share in one of the other programs.
• The value of all free shares received under the Abondix, Disponix and Simplix
programs combined could not exceed FF 6,860, or 37 to 47 shares, depending
on the discount offered (0% or 20%). Free shares are paid first to Disponix,
then to Simplix, and finally to Abondix.
• The maximum request for shares could not exceed FF 823,200. The bonus and
the bank loan implicit in Multiplix counted towards this total, while free shares
were excluded.
• Were the employee offering to be oversubscribed, the rationing rules would
determined and announced by France Télécom and the government at that
time. Formal allocation rules were not announced in advance.
With combinations of the four alternatives, employees could create highly
customized shareholding packages. They could vary the degree to which investments
were taxable, the average holding period, the average payment option, the average total
discount (taking into account discounts, bonuses and free shares) and the average number
of shares with downside protection. However, the constraints outlined above were often
binding and must be considered in any analysis.
If we were to ignore taxes, risk aversion, needs for liquidity, and heterogeneity
among workers, we could solve the linear programming problem suggested by the
constraints above to calculate the “optimal” (value-maximizing) investment package.
Given the extreme discounts offered, investors would certainly participate in the offering.
Our calculations show that Abondix and Multiplix, which offer the highest discounts,

13
dominate the optimal portfolios. Simplix enters the value-maximizing portfolios only for
small personal investments to take advantage of the free shares, and again for large
personal investments when the constraint on the combined investment into Abondix and
Multiplix bind. In brief, investors would prefer combinations with the largest effective
discounts, as they place no value on liquidity. This results in the purchase of the
maximum amounts of Abondix and Multiplix allowed under the constraints. Whenever
the combined constraint on Abondix and Multiplix is binding, Abondix is the preferred
choice over Multiplix.
This analysis is far too simplistic in that it ignores all of the very real and
important aspects of the actual problem facing employees and security designers hoping
to encourage these employees to buy any of the alternatives:
• Employees are risk-averse.
• Employees have a mix of human and financial capital.
• Human capital can be risky and also firm-specific, i.e., its value can be related
to the value of France Télécom. Note that human capital risk is not simply the
probability of being fired (which is zero for civil servants, and may not be very
high for other employees, in view of the high costs of firing workers in
France). If France Télécom performs poorly, its employees are unlikely to
obtain salary raises or promotions, they may be subject to forced job
relocations, or France Télécom may find it hard to attract and retain talented
co-workers.
• Employees may be unable to borrow against their illiquid positions and thus
the holding period of an investment may be important.
• The pool of workers is heterogeneous with respect to these characteristics.
To understand what the optimal portfolio might be in these circumstances is much more
complicated, and requires us to more formally model the joint consumption, investment
and portfolio choices of investors

14
4. Applying investment decision-making theory at France TélécomThe designers or marketers of the France Télécom schemes would have liked to
know who might buy the products, how much they might buy, and what variety they
might prefer. We can reframe these marketing questions as portfolio allocation problems
and use financial theory to help predict consumer response:
• Purchase: What investors would choose to add a risky asset (France Télécom stock)
to their portfolios vs. either adding a safe asset or consumption?
• Purchase size: What is the optimal mix of risky and safe assets in an individual’s
portfolio?
• Product choice: How might investors differ in the price they might pay for down-side
protection (Multiplix)? For shorter required holding periods (Disponix)?
Models of savings and portfolio choice provide theoretical bases for framing these
investment decisions, where France Télécom employees must tradeoff risk, return, and
liquidity. Risk can be adjusted by buying more downside protection, return could be
changed by buying schemes with larger discounts, and liquidity could be altered by
choosing a package with shorter holding periods. The correlation between the proposed
risky asset (France Télécom stock) and the individual’s stock of human capital
complicates the employee decision. This section discusses the existing approaches to this
portfolio selection problem, and develops a stylized model that produces empirical
predictions regarding employees’ investment choices.
Extant theoretical approaches
There are two principal strands of theory dealing with portfolio choice decisions,
standard neoclassical models and behavioral finance approaches to the portfolio selection
problem.
Standard neoclassical models, as developed in Samuelson (1969) and Merton
(1969,1971), derive optimal consumption-portfolio decisions from utility maximization
by rational consumers. Preferences are assumed to be well-behaved and stable, and the
resulting optimal portfolio describes how a rational individual should allocate his or her
savings between different assets. A number of extensions of these models consider

15
portfolio allocation decisions when investors have non-diversified human capital or when
they face uncertain labor income. Bertaut and Halliasos (1997) solve a three period life-
cycle model in which investors choose portfolios in order to buffer against long-run
career uncertainty. They find that higher variance and persistence of labor income shocks
reduce the holding of risky stock relative to labor income. The implications of this model
would be that employees with more risky human capital would be less likely to
participate in the France Télécom offerings, and on the margin more likely to prefer a
scheme with downside protection like Multiplix.
Viceira (1997) solves an infinite horizon consumption and portfolio selection
problem where labor income is subject to permanent and transitory shocks, and
employees face an exogenously given probability of retirement per period. He shows that
the demand for the risky asset declines as workers approach retirement, implying that
younger workers would be more likely to participate in the risky France Télécom share
offering. If labor income shocks were positively correlated with the risky asset (as would
be expected in the case of employees purchasing France Télécom stock), Viceira
demonstrates a negative hedging demand for the risky asset. This demand tends to offset
the retirement savings motives, and in extreme cases, the demand for the risky asset
(France Télécom stock) may be smaller for younger workers than for older ones.
Bodie, Merton, and Samuelson (1992) choose a somewhat different strategy to
model labor income uncertainty. They allow human capital to be partly random and
partly under the control of the investor. Their main result is that flexibility in labor
supply induces higher risk taking. Negative portfolio returns are smoothed out by
increased labor supply, especially for young workers, who can assume relatively more
risk in their financial portfolio. This implies greater participation by younger France
Télécom workers.
There is relatively little empirical work addressing how well these models perform
in predicting investing behavior. Guiso, Jappelli and Terlizzese (1996) test the
propositions that uninsurable income risk and expected future borrowing constraints
reduce the share of risky assets in a household’s portfolio. They employ the 1989 Bank of
Italy Survey of Household Income and Wealth, which combines data on household asset

16
holdings with data on subjective assessments of income risk and demographics of 8274
Italian households. Risky financial assets are defined as the sum of long-term
government bonds, corporate bonds, investment fund units, and equities. The average
share of risky assets in the financial portfolio is 5.7%, and the median share is 0%. They
find that the share of risky assets is lowest for young households and increases by 20
percentage points over the life-cycle to reach its peak at age 61. This supports the
hypothesis that the young are more likely to be borrowing constrained buffer-stock
savers, and goes against the argument of Bodie, Merton and Samuelson (1992).
A quite different theoretical approach to understanding investors’ choices comes
from the behavioral finance literature. This approach derives predictions about individual
behavior based on a set of anomalies reported in the psychology literature and
observations from experimental studies. In this literature individuals are not rational
utility-maximizers as in the neoclassical framework, but instead suffer from mental biases
and use simplifying heuristics when assessing decision situations.
Kahneman and Tversky (1979) first incorporated behavioral biases in a formal
decision theoretic model in their prospect theory model.18 Their formulation encompasses
a number of behavioral effects, one of which – loss aversion – is of particular importance
for portfolio allocation. Loss aversion means that investors perceive losses relative to the
status quo as worse than equivalent foregone gains, and that investors behave strictly risk-
averse even for infinitesimal gambles. Hence prospect theory predicts a strong preference
for certain outcomes even over favorable bets. In the context of the employee stock
offering at France Télécom, prospect theory pushes investors to minimize the downside
risk of their investments, while being less concerned about large up-side potentials. This
might push employees toward the Multiplix scheme.
A related phenomenon is described by regret theory: Investors alter their behavior
in order to avoid regret even if the resulting decisions are incompatible with expected
utility maximization. Regret favors inaction and standard behavior, since the potential
pain from regret dominates the potential gain from a beneficial decision. Clarke, Krase
18 See Laibson and Zeckhauser (1998) for a review of the impact of prospect theory on behavioraleconomics.

17
and Statman (1994) argue that because of regret considerations, investors will tend to
follow the crowd. It is easier to justify a bad decision ex-post when everyone else made
the same mistake, and more difficult when an investor made an unconventional decision.
Applied to the employees of France Télécom, regret theory implies more uniformity in
the investment decisions than predicted by the neoclassical framework. Regret theory
itself does not give clear guidance as to what investment strategy is likely to emerge as
consensus behavior.
Mental accounting as described in Thaler (1984) and Shefrin and Statman (1993,
1994) and Thaler (1998) refers to the tendency of investors to subdivide their total wealth
into disjoint accounts and apply different decision rules to different accounts in isolation
without pursuing overall utility maximization. In Shefrin and Thaler (1988), agents
distinguish current wage income, asset income and future income, and spend differently
out of the present values of these three mental accounts. Applied to the decision situation
faced by the France Télécom employees, the mental accounting hypothesis casts doubt on
the notion that investors consider their human capital when allocating their financial
portfolio.
Another behavioral bias that might be relevant in the asset selection decision of
France Télécom employees is the naïve diversification phenomenon of Benartzi and
Thaler (1999). For example, some pension plan investors follow what Benartzi and
Thaler call the 1/n strategy, whereby they divide their contributions evenly across the
funds offered in the plan. This strategy, if followed by France Télécom employees, could
lead to significant deviations from the neoclassical optimal portfolio weights, and
substantial welfare losses.
The theory of self-control has received considerable attention in the behavioral
economics literature (Schelling (1984), Thaler and Shefrin (1981), Shefrin and Statman
(1984)). Agents are seen as having a high myopic time preference rate and suffer from
inner conflicts between myopic and long-run objectives. The problem to restrain one’
short-term behavior leads to the adaptation of rules and self-imposed constraints on
behavior. An example of self-restraining rules is the large role non-discretionary schemes
play in retirement saving. Social security contributions and defined contribution plans are

18
interpreted as institutionalized rules that help individuals to overcome myopic
temptations. Investors seem to follow a strict rule that prevents going into debt under
almost all circumstances. The implications of self-control considerations for the
employees at France Télécom are twofold: Firstly, the long holding periods of the
Abondix and Multiplix packages may be attractive because they can constrain myopic
consumption decisions. Secondly, if investors follow a rule against borrowing, then the
fact that the Multiplix package was framed as including a bank loan may be detrimental to
its success.
While we are able to intuit some predictions of behavioral theory, when applied to
the problem at hand, it is difficult to produce clear testable hypotheses.19 While we will
frame our analysis primarily in terms of neoclassical investment behavior, we
acknowledge that behavioral forces could provide alternative explanations for our results.
Predictions from a simple model of portfolio selection
While the neoclassical models of investment behavior are rich, no one model is
designed to capture the essence of the problem faced by the France Télécom employees.
In particular, employees have risky human capital tied to the value of the France Télécom
stock, have a choice of liquidity (holding period), and can buy assets with down-side
protection. There are constraints on the amounts investors can put into the long-lived
assets, and the bonuses and free shares cause the expected return on any asset to be a
decreasing function of the invested amounts. It is not clear a priori what the optimal
investment behavior is given this unusual investment opportunity set. As an illustration,
consider the constraint that the total amount invested into the two long-lived assets cannot
be larger than one quarter of annual labor income, with the loan implicit in Multiplix
counting towards the constraint. Here the neoclassical investor cannot simply decide on
the optimal asset mix on the basis of his preferences for expected return and downside
protection. Instead the investor has to take into account that buying one unit less of
Multiplix allows him to purchase ten additional units of Abondix whenever this constraint
19 Shiller (1997) discusses the difficulties in testing the behavioral approaches.

19
is binding.
We developed a simple, three-period model to obtain predictions with respect to
the employees’ decisions about participation, level of investment, and choice of
investment vehicle in this particular setting. The model explicitly analyzes how
employees would choose among a set of investments that are realistic representations of
the choices facing the France Télécom workers. In addition to the France Télécom
offerings, the investor is given the choice of a riskless asset and an additional risky asset
unrelated to France Télécom. The Appendix details the setup of model and relates it to
the existing literature. Starting from a realistic baseline calibration, we analyze the
consumption, savings and the optimal period 1 investment by the worker-investor as a
function of his relative risk aversion, his initial financial wealth, the level of labor
income/human capital, the firm specificity of his human capital, and the idiosyncratic
riskiness of labor income.20 Selected predictions are discussed in the following
paragraphs, and all predictions are summarized in Table II.
Participation rate and investment intensity. The model predicts that all
employees will participate in at least one of the stock choices. At face value, as more
than a third of eligible participants choose not to participate, the model obviously fails to
capture some critical aspect of their decision-making.
However, the model does predict that the intensity of participation will vary
across the population. Bearing out simple intuition and echoing earlier models, it predicts
that employees who are more willing and able to bear financial risk hold more risky
securities:
• More risk-averse employees shift away from the risky France Télécom assets
20 The standard calibration of the three period model uses the following parameter values: Initial wealth W1equals FF 200,000 and initial labor income equals FF 180,000 p.a. The relative risk aversion (RRA)parameter is set to 5 and varied between 2 and 20. This range is arbitrary, but relates to extant empiricalwork. Friend and Blume (1975) find an aggregate relative risk aversion coefficient of 2. More recentfindings attempt to calculate RRA coefficients for subsets of investors. Brav and Geczy (1996) find thatRRA parameters for US households in 1980-1991 range from 3 to upwards of 20. Mankiw and Zeldes(1991) find RRA parameters of 36 to 100. The individual time preference rate is equal to the risk-freeinterest rate at 5 percent. The risk parameters in the baseline calibration are a 30 percent annual volatilityfor the France Télécom stock return, a 25% volatility for the orthogonal ‘market’ asset and a 5 percentvolatility for the independent labor income shock. ρ, the parameter controlling the covariation betweenstock returns and labor income, is set to 0.1.

20
towards cash until they hold only moderate amounts of the downside protected
Multiplix. With the baseline calibration, the predicted personal contribution
falls from FF 59,800 for log-utility (relative risk aversion of 1) to FF 2,700 for
relative risk aversion of 20.
• Workers whose labor income is more correlated to the firm invest less in the
risky financial assets offered by France Télécom. Again with the baseline
calibration, the predicted personal contribution is at FF 42,800 for no
correlation and falls to FF 2,100 for strongly positive correlation between
labor income and stock returns (ρ greater than 0.3).
• When labor income (human capital) increases for a given financial wealth then
the intensity of participation increases, but less than proportional to the
increase in total wealth. The predicted personal contribution rises from FF
13,600 for no labor income to FF 45,800 for an annual labor income of FF
2,000,000. This less than proportional increase corresponds to the hedging
motive in Viceira’s (1997) model: Increasing labor income while holding
financial wealth constant implies that the investor has more total wealth, but
also more exposure to France Télécom. While the wealth gain induces the
employee to invest more, the positive correlation between labor income and
stock returns dampens the desired investment. The net effect is weak and not
monotone, and depends on the ratio of labor income to financial wealth21.
• The effect of adding idiosyncratic risk to the labor income process has an
ambiguous effect on the intensity of participation. The unavoidable risk in
human capital discourages risk taking in the financial portfolio, but at the
same time increases the savings rate for precautionary reasons. For relative
risk aversion of 5 we find the net effect on personal contribution to be
positive, while for relative risk aversion of twelve it is negative.
21 The relationship between labor income and personal contribution is not monotonically increasing. This isdue to the constraint that not more than ¼ of annual salary can be invested into the two long-lived assetscombined. Whenever we increase annual salary for constant initial wealth, this constraint is gradually

21
Mix of investments among participants. The decision of how to allocate the
personal savings among the France Télécom assets and the outside alternatives is severely
restricted by the rules of the offering. Because the Multiplix plan delivers downside
protection yet appreciation on ten shares, it is a nearly dominant security and without
additional constraints would be part of all participating employees’ choices. (More
generally, Leland (1980) suggests that downside protected investments should be more
attractive to investors who are more risk averse, and we see a similar pattern in our
model.) However, due to the constraint on the total amount investable in Multiplix and
Abondix combined, the investor has to trade-off each unit of Multiplix against ten units of
Abondix whenever the constraint is binding. We focus on the predictions for the relative
allocations to the France Télécom assets, since any holdings of outside risky or riskless
assets are not observable to us. The model abstracts from the distinction between
Disponix and Simplix and analyzes the choice between the long-lived assets Abondix and
Multiplix and a short-lived asset based on France Télécom stock.
• As relative risk aversion increases, the investor's portfolio of France Télécom
assets shifts from 87% in the short-lived asset with relative risk aversion of 1
to 100% in Abondix with relative risk aversion of 5 and finally to 100% in
Multiplix with relative risk aversion of sixteen and higher.
• As the firm-specificity of human capital (ρ) increases, the pattern is very
similar to increasing relative risk aversion: With no correlation, the portfolio
of France Télécom assets is 71% in Abondix and 29% in the short-lived asset,
shifts to 100% in Abondix with ρ equal to 0.1 and finally to 100% in Multiplix
with ρ equal to 0.3 and larger.22
• When labor income increases for given financial wealth, the investor shifts
relaxed, essentially enlarging the investment opportunity set available to the investor.22 The effects of risk aversion, human capital, firm-specificity of human capital and idiosyncratic laborincome risk are not always monotone. An investor with low risk aversion or low exposure to FranceTélécom may buy Multiplix purely to capture the high returns, an investor with medium risk aversion ormedium exposure may not buy Multiplix due to the constraint on the combined investment into the long-lived assets, and an investor with high risk aversion or high exposure may again buy Multiplix to takeadvantage of the downside protection. We find these non-monotonicities to be a robust phenomenon in ourcalibrations, but they are not large enough to reverse the broad patterns described in the text.

22
from the short-lived France Télécom asset to Abondix and finally to Multiplix.
With no labor income, the investor is 100% in the short-lived France Télécom
asset, shifts to 100% in Abondix with annual labor income of FF 100,000 and
finally to 100% in Multiplix with labor income of FF 1,000,000. This pattern
is caused by both the income-based constraint on the total investment in long-
lived assets and by the negative effect of increased human capital on the desire
to take on additional exposure to France Télécom.
In our model, as the willingness or ability to take additional exposure to France
Télécom decreases, the average holding period of the portfolio of France Télécom assets
increases. This result is due to the investors’ ability to substitute away from the France
Télécom assets in favor of outside assets. For very low risk aversion, no firm-specificity
of human capital or little human capital relative to financial capital, the slightly
discounted short-lived France Télécom asset is part of the optimal portfolio. Increasing
either risk aversion or the exposure to France Télécom causes the investor to replace the
short-lived asset by asses unrelated to France Télécom, leaving only the long-lived France
Télécom assets in the observable portftolio.
The model delivers a set of predictions about the factors that should drive
participation, extent of contribution, and the mix of stock plans utilized. These
predictions are framed with respect to a handful of theoretical parameters: the amount of
labor income, the firm specificity of that labor income, the idiosyncratic risk of that labor
income, and the employee’s risk aversion. The empirical challenge is to find the best-
possible proxies for these parameters, which we discuss in the following section.
5. Data descriptionOur data set consists of a unique database of 205,076 current and former
employees of France Télécom. The data was kindly provided to us by France Télécom’s
Internal Shareholders Department. For each individual we have data on age, gender, job
tenure, job category, salary level, whether the employee is currently employed or retired,
and the location of the employee’s business unit. We also have information on the
number of shares demanded and obtained by each employee. Finally, we have the postal

23
code of the employee’s home, which we have matched to demographic data from the
INSEE, the French government statistical agency. Table III provides summary statistics
for some of the observed variables.
Amount of human capital: The present value of labor income (human capital) is a
function of the current level of salary, its growth rate, and the time horizon over which
salary will be received. Current salary captures the first component and age captures the
third aspect of human capital, with younger workers generally having more human capital
(future value of labor income) than older workers. In addition, we can identify retirees,
whose human capital (future labor earnings) is presumably small.
Firm specificity of human capital: We have a number of proxies for the firm-
specificity of human capital. First, we can identify former (non-retired) workers versus
current workers. The former would have no France Télécom firm-specific capital, as they
were no longer in the firm’s employ. For current workers, we use job tenure as a proxy
for firm-specificity of human capital. Prior theoretical and empirical research suggests
that tenure is a relatively good measure of this variable.23 In the empirical analysis, we
distinguish the tenure effect between civil servants and non-civil servants. While the
23 A number of theoretical rationales can be found in the labor and contracting literature why higher jobtenure should be associated with higher salaries and human capital. Following Becker (1964), the simplestmodels assume the acquisition of firm-specific skills over time, which increase the marginal productivity onthe current job, but are useless when the current employment relationship is terminated. Wages that risewith job tenure leave workers with a stake in the specific value of the employment relationship and thusprovide incentives for the acquisition of firm-specific skills. A different strand of the literature relies onsearch and matching models to explain the relationship between tenure and human capital. In Jovanovic(1984), the quality of the match between employee and employer reveals itself gradually over time. Goodmatches are more likely to survive than bad matches and result in a higher marginal product and wagepayment to the worker. While Jovanovic deals only with voluntary unemployment, the effect of involuntarylayoffs in his framework is straightforward: A well-matched employee has on average longer tenure andmore to lose from the termination of the relationship. The reduction in human capital through aninvoluntary layoff is equal to the monetary value of having found a good match. The empirical evidence onthe relationship between job tenure and firm-specific capital is convincing. Topel (1991) finds that 10 yearsof current tenure raise the wage of the typical male worker in the US by more than 25 percent above andbeyond the effect of general labor market experience. Workers with longer prior job seniority suffersubstantially greater losses from lay-offs than worker with less prior tenure. A person with 15 years ofcurrent tenure would suffer an immediate 33% loss in salary if his or her job were exogenously terminated.Topel interprets his results as evidence of firm-specific human capital acquisition over time. Thisinterpretation has been challenged by Williams (1991), who presents evidence that Topel's results are morelikely to be due to differences in the quality of the match between employer and employee. For ourpurpose, the two interpretations are equivalent, since both imply that an employee with higher tenure willsuffer greater losses through an exogenous termination of the employment relationship.

24
firm-specificity of human capital increases in tenure for both groups, we would anticipate
that the job security implicit in the civil servant status makes this effect less relevant for
civil servants. We use the log of tenure, rather than tenure itself, because firm specificity
of human capital is probably non-linear: an employee will likely acquire more firm-
specific skills in his first two years in the company than in his last two.
Idiosyncratic shock to human capital: The possibility of a sudden shock to human
capital should affect the workers investment decision. Here we exploit the differences
between the civil servant employees of France Télécom and the non-civil servants. The
former have much more job security than the latter and thus, we argue have lower levels
of idiosyncratic labor shocks.
Financial wealth: We do not directly observe the financial wealth of the workers,
but we constructed two instruments to proxy for this variable. First, we know the postal
code for each worker’s home. We match these postal codes to the INSEE (French
National Statistical Service) database, and use the average income of the households in
the same postal code as a rough measure of wealth. Our logic is that choice of residence
is a function of wealth (and income) and given the large disparities between towns and
neighborhoods, it captures some of the unmeasured variation in household wealth.
We also construct a second measure of wealth, based on the idea that financial
wealth is related to accumulated salary. Workers that earned higher salaries and who are
older have an opportunity to accumulate greater financial assets. We create a rough
measure of this opportunity for accumulation with an interaction term that multiplies
current salary by the years in the work force (age minus 18). This is a crude instrument
for family wealth, as it fails to capture elements like inherited assets, spouse’s income,
and spending needs (function of family size and age.)24 In a multivariate setting, it is
difficult to interpret, as it must be evaluated alongside of the age and salary variables
from which it was constructed.
24 The correlation between the INSEE measure and the years in the workforce times current salary is 0.68,indicating that they capture similar economic factors.

25
Other control variables: To test Viceira’s predictions that time to retirement can
affect employee’s retirement motives to invest in risky assets, we also control for
employee age and age-squared. Age is a variable that could have many interpretations in
this analysis. Not only does it capture years to retirement, but also it affects human
capital, financial capital and the ratio of the two.25 Younger people have large future
labor income but smaller financial assets, whereas older people have smaller remaining
future labor income and larger financial assets. At some point, financial assets begin to
dwindle as people use them to pay for children’s education, support of aging parents or
retirement, and to capture this non-linearity, it is appropriate to include not only an “age”
variable, but a squared age term as well.
Prior research, such as Barber and Odean (1999) suggests that men and women
make different investment decisions. They attribute this to differences in self-confidence,
but more generally gender differences could reflect other factors as well, such as risk
aversion. To account for these differences, we include gender as a control variable.
Omitted variable bias and risk aversion: In spite of the uniqueness and breadth of
our database, we acknowledge that some potentially very helpful data have not yet been
made available. For example, we have no information on employees’ marital status,
number of children, whether their spouse is an employee of France Télécom, and whether
the employee is a homeowner: clearly, such variables have bearing on France Télécom
employees’ participation in the share offering. Nor do we have information on
employees’ promotion history, union affiliation, training, or other portfolio holdings,
which may have influenced employees’ attitudes toward the offering.
While some of these variables might be made available at some time, the one key
variable that will always be unavailable is risk aversion. However, other observable
variables could be related to risk aversion. Absolute risk aversion should decrease with
total wealth and income. Wealthier workers may be more willing to buy risky assets than
less wealthy workers. The endogenous decision to become a civil servant may reflect
higher risk aversion; if so, civil servants might be less likely to participate in the offering.
25 See the discussion in Bodie, Merton and Samuelson (1992).

26
Risk aversion may change over a person’s lifetime, so older people may become more
risk averse. Risk aversion could differ between men and women. It is prudent to
remember that there is no independent measure of risk aversion, virtually all observable
variables may be correlated with it, and thus it may be difficult to interpret the empirical
results.
6. Empirical resultsIn this section of the paper, we analyze the behavior of all individuals to whom
the investment schemes were offered. The discussion is divided in five parts. Part (a)
reports the frequency with which different groups of individuals participated in the
offering. Part (b) deals with the amounts individual investors offered to invest into the
schemes. Part (c) analyzes how individuals allocated their investment among the
portfolios with different attributes. Specifically, we study the holding period selected by
employees and the degree to which they sought down-side protection on their shares
through the purchase of Multiplix. Part (d) discusses the relation between the
participation and personal contribution results and our tentative explanation: threshold
effects. Part (e) presents possible behavioral explanations for our findings.
(a) Participation
While the theoretical model we developed predicted nearly universal participation
in the offering, only 62.8% of eligible current and former employees participated in the
France Télécom offering. This first-order mismatch between our simple model and reality
probably reflects the over-simplified nature of the model as we discuss in section (d).
We predict that employees with the lowest human capital exposure to France
Télécom stock should be the most willing participants in the offering. The participation
ranking should then be (1) former employees and retirees, (2) currently employed civil
servants, and (3) currently employed non-civil servants. Among current workers, higher
tenure should be inversely related to participation. Table IV presents univariate
participation percentages for different groups of potential investors. The observed ranking
of participation by employee groups is the exact opposite of our model prediction.

27
Current employees were more likely to participate than non-retired former employees
(68% vs. 22%). Among current employees, non-civil servants participated more than
civil servants (74% v. 67%).
Our model predicts that employees with higher labor income and especially
wealthier employees should be more willing to invest. Figure 4, Panel A reports
participation rates by salary grade. As predicted, employees with higher salaries (and
presumably greater wealth) are more likely to participate. In the extreme, participation
among the “cadre dirigeant” or executives was 100%.
To check whether these univariate results are driven by heterogeneity among
employees in other dimensions, we run a probit regression of the probability of
participation on individual characteristics, reported in Table V. Consistent with the
univariate results, former employees were less likely to participate than are current
employees. To gauge the economic effect of the various factors, we calculate the marginal
probabilities from the Probit, setting all other variables at their mean levels. Former
(non-retired) workers are 72 (40) percentage points less likely to participate than current
workers. The reluctance of former employees to participate despite their lack of firm-
specific capital in France Télécom may perhaps be explained by any number of factors
not included in our model. First, they could only choose from a subset of the plans; the
two most financially attractive packages (Abondix and Multiplix) were not offered to
them. It may also have been harder to market the offering to retirees and former
employees, as they were not physically present at France Télécom at the time of the
offering.26 They may have had pessimistic views of the future of France Télécom,
evidenced by their decision to leave the firm.27
Employees with higher salaries and greater financial wealth (as proxied by the
INSEE measure or a constructed wealth measure) are more likely to participate.
Inspecting the relationship between salary grades and coefficients, there is nearly a
26 Marketing efforts may also have been impeded by legal uncertainty as to which former employees wereeligible.27 However, the evidence from previous French privatizations was that substantial short-term and long-termabnormal returns had been realized (See footnote 4).

28
monotonically increasing relationship between salary levels and the propensity to
participate, even after controlling for age, tenure, civil servant status and job category.
Moving from the lowest salary grade for “ordinary employees” to the lowest salary grade
for “middle managers,” the probability of participating increases by 52-58 percentage
points. These findings are consistent with the notion that employees with greater total
wealth have lower absolute risk aversion and are therefore more willing to invest in risky
assets.
We predicted that civil servants, facing more certain labor income, might be more
willing to participate. They are not. In Table V, we see that they participate less
frequently in the stock plans than do non-civil servants. Based on the probit marginals
evaluated at the means, civil servants are about 5 percentage points less likely to
participate (calculated from the second specification in Table V). One explanation for
the lower participation among civil servants could be higher average risk aversion,
evidenced by their revealed preference of taking a civil servant position. An alternative
explanation is that perhaps some residual opposition against the privatization existed.
Such opposition may have been more likely among employees who joined France
Télécom fully expecting a lifelong public sector career, and who may have felt betrayed
when France Télécom turned itself into a capitalist entity.
If tenure captures firm-specificity of human capital, longer-tenure workers should
be less likely to participate. The evidence in Table V gives weak support to this
prediction: among current employees, both civil servants and non-civil servants, workers
with longer tenure were less likely to participate. However, this effect is small. A current
worker with tenure one standard deviation above the mean is less than 0.5 percentage
points less likely to participate than workers with tenure at the mean. The small
magnitude of this coefficient could reflect the observation that there is little human
capital risk at FT, and hence only minor effects of differential firm-specific human
capital.
We find that older employees are less likely to participate in any of the stock
purchase plans, with workers one standard deviation older about 2% less likely to
participate. According to Viceira’s (1997) model, investors closer to retirement will be

29
more risk-averse, since they expect their propensity to consume out of wealth to go up
soon. Hence our finding is consistent with the idea that this negative effect of age on the
demand for risky assets overwhelms the positive effect of diminished firm-specific
human capital on the hedging demand for the risky asset.28 In the extreme, we see that
retirees are much less likely to participate in the stock plan than are current workers, also
consistent with Viceira’s hypothesis. Retirees were 42-47% less likely to participate,
evaluating the probit coefficients at their mean values.
Finally, while we have no clear hypothesis for why gender should affect the
decision to participate in the stock plans, it does have an effect. Women were about 4-6%
more likely to participate than men. This might result from differences in family status:
French households are more likely to have two incomes if the woman works than if the
man works. It could also reflect differences in risk aversion29, or a more careful reading of
the plan documents. We merely report the result as consistent with the notion that gender
has some impact on this investment decision.
(b) Personal contribution
The simple neoclassical model we develop predicts that the “average worker” (as
determined by our baseline calibration but with no human capital at risk) should invest
about 26,000 FF in the offer (see Table VII, panel B). This actual investment among
workers, conditional on participating, is roughly this amount, as shown in Panel A of
Table VII. This equivalence is mildly comforting, in that it suggests that the model is
capturing results of a similar order of magnitude to those we observe in the data.
Does human capital—and the firm specificity of that human capital—affect the
amount employees choose to invest? In Figure 2, Panel B we graph the desired
contribution against tenure (our proxy for firm-specificity of human capital) for currently
employed individuals in different age groups. We expect the human capital effect to be
28 The hedging demand is negative due to the positive correlation between human capital and stock returns.For a given level of wealth and firm-specificity of human capital, diminishing human capital makes thenegative hedging demand smaller in absolute value.29 Sunden and Surette (1998) document that women invest their retirement savings more conservatively thando men, even after controlling for marital status, age, and risk return/preferences.

30
strongest for individuals in the middle of their career (in the age group 35 to 50):
individuals in this age group have a significant portion of their total wealth in the form of
firm-specific human capital and display a wide spread in individual job tenure. Panel B in
Figure 2 illustrates that the desired contribution is strongly decreasing in tenure for
current employees in this age group. For all other groups the relationship is essentially
flat.
Table VI summarizes the requested amounts (conditional on participation) and
the average ratio of personal contribution to monthly salary for subgroups of employees.30
While retirees and not-retired former employees were less likely to participate, when they
do invest, they make comparatively large investments. We discuss this finding in section
(d) below.
In Panel A of Table VII we present observed personal investments by employees
with different levels of wealth and income, and contrast them with selected predictions
from our model in Panel B. As we note above, the model predictions are of the same
order of magnitude as the observed behavior. Furthermore, investments differ markedly
among various subgroups of employees, both in theory and in practice.31
To more thoroughly analyze these relationships, we carry out three multivariate
analyses of personal contribution on individual characteristics: Tobit, double-hurdle and a
truncated regression model.32 Unlike the Tobit model, the double hurdle and truncated
regressions frameworks allow the determinants of the participation decision to differ from
the amount of investment decision without merely throwing away zero-investment
observations and biasing the results. This added flexibility can accommodate several
reasonable deviations from the standard choice setting: Even when the optimal
contribution level is non-zero, participation may still not occur due to search, information
30 The data for monthly salary was available only as averages for the three employee groups of (1) workersand technicians, (2) middle managers and (3) managers. Executives and employees of France Télécomsubsidiaries were dropped from the sample for this analysis.31 We cannot exactly match the predicted to actual investments because we have a noisy measure offinancial wealth. As we move from low to high salary levels in Panel A, we cannot hold financial wealthconstant.32 We focus on the investment amounts demanded as opposed to the amounts granted. Due to theoversubscription of the offering, the actual invested amounts were smaller than the stated demand in manycases.

31
and transaction costs. Similarly, the potential investor may first decide whether the
offering is worth analyzing, and only if the answer is in the affirmative, go on to decide
the desired contribution level.
The truncated regression specification (which we report in Table VIII) uses a
MLE framework, correcting for the bias that would occur if one merely ignored the non-
participation data (See Hausman and Wise (1975) or Greene (1993)). The double-hurdle
specification is closely related to the censored regression model first proposed by Tobin
(1958) and the sample-selection models described by Heckman (1976). It follows the
model of Cragg (1971), in which the first-hurdle is a probit model for participation, and
the second hurdle is a censored regression for the contribution level similar to Tobin's
model. We estimate both equations simultaneously using full information maximum
likelihood.33 The results of the truncated regression and double-hurdle models are
similar, and differ markedly from the Tobit model.34 The Tobit results are consistent with
the probits reported in Table V, which suggests that they are dominated by the
participation decision. However, the analysis of contribution amounts under the double-
hurdle and truncated regression methods suggests that there may be substantial
differences between the decisions of whether and how much to participate. We therefore
focus on the results from the double-hurdle and truncated regression model in this
section.
In Table VIII, we find a negative effect of tenure on invested amounts for current
employees, whether civil servants or other employees.35 This result is consistent with the
prediction from our model that as human capital becomes more firm specific, the amount
invested should fall. However, the magnitude of the effect is modest. One standard
deviation of tenure above the mean is associated with 5.6%-8.6% less investment.
Surprisingly, the larger effect is for civil servants whose firm-specific human capital
should be less at risk.
33 For an in-depth treatment of limited dependent variable models with selectivity, see Lee (1983). A recentapplication of the techniques employed in this section can be found in Maki and Nishiyama (1996).34 Because of this similarity, we do not report the results of the double-hurdle model.35 This result is driven primarily by the subgroup of male employees; for female civil servants and femalenon-civil servants, there is no relationship between tenure and amount of contribution.

32
In addition, we see that higher-paid workers and those with greater wealth (as
measured by the INSEE measure) are not only more likely to participate, but also to
invest more in the stock offering plan. Moving from salary grade 11 to salary grade 31
(31 to 41) results in a 62% (51%) increase in personal contribution. These results are also
consistent with the comparative statics from our model. While the model predicts a less
than proportional increase of personal contribution as a function of labor income, this
prediction is derived holding wealth constant. Clearly the INSEE measure is an imperfect
proxy for wealth, and the labor income coefficients are likely to pick up much of the
residual variance in wealth.
However, the situation with respect to age, civil servant status, retirees/former
employee status and gender is complicated. The Tobit results mimic those of the probit:
older workers, civil servants, men, former employees and retirees are less likely to
participate. However, the double hurdle or truncated regression models suggest that
conditional on participating, these participants invest more (or no less than) than others.36
This is strong evidence that the decisions of whether and how much to invest may be
driven by different factors. We further discuss this issue in subsection 6 (d) below.
(c) Type of Offer
How did participating employees allocate their funds among the four plans? Table
IX, Panel A reports the actual frequencies with which the different assets are chosen. For
current employees, the two long-horizon plans with large discounts were favored:
Abondix is the most preferred package, followed by Multiplix.37 Panel B reports the
frequencies of particular asset combinations by different groups of individuals. For
current employees, pure Abondix is by far the most preferred choice, followed by the
Abondix-Multiplix combination. Employees heavily weighted their portfolios to long-
horizon/high discount offerings, with all but 2.2% of participating employees buying
Abondix, Multiplix or both. We also see this in Table VII, which reports that the average
36 The marginal effects on personal contribution are as follows: retired workers: 15% more; formeremployees: 17% more; women: 18% less; and 10 years older: 9% more.37 The numbers in Table IX, Panel A do not add to one because portfolios may contain multiple assets.

33
participant selects a plan with required holding period of 4.6 years, thus heavily tilting his
portfolio to the long-horizon plans. In general, the average employee portfolio is very
much like the the utility-maximizing portfolios we derive from our model.
Our model not only suggests the overall composition of the “optimal portfolios,”
but also how portfolio characteristics should vary among participants. We would expect
the wealthiest participants to invest in short-horizon plans, as they were limited in their
participation in long-horizon plans. Similarly, we would expect that the fraction of the
portfolio that is downside protected (invested in Multiplix) should rise with risk aversion,
firm-specific human capital exposure, and idiosyncratic risk. Due to the limits on the
French Franc contributions on Multiplix, it should decline as a fraction of holdings for
wealthier workers. Figure 3 plots actual portfolio allocations by employee
characteristics. Panels A to D present the averages of the portfolio weights chosen by
current employees as a function of salary grade, age, tenure of non-civil servants and
tenure of civil servants respectively. (Simplix and Disponix have been aggregated into a
single measure labeled “stock” to facilitate comparison with the model predictions.) The
graphs show that liquid assets are more popular with very young and very old investors.
This observation conforms with general neoclassical model predictions: These employees
are most likely to need to consume out of their investments between the offering date and
the maturity of the long-lived assets.38 However, tenure—our measure of firm-specificity
of human capital—has no material effect on the chosen portfolio allocations. The marked
increase in weightings in the short-term “stock” choices for better paid workers in Panel
A is inconsistent with the theoretical predictions.
In Table X, we analyze the composition of the chosen portfolios as a function of
employee characteristics. We stress the functional characteristics of the portfolios: the
average chosen holding period and the fraction of the portfolio protected by puts
(invested in Multiplix). This analysis is conducted only for employees who chose to
contribute and is limited to current employees (as former employees and retirees did not
38 While this is most certainly true for very young employees, one might argue that old employees close toretirement have accumulated significant lifetime savings. Since we do not observe financial wealth, wecannot test whether the near-retirees purchase stock despite having a large buffer-stock of savings.

34
have access to the longest horizon or payoff protected plans.)
With respect to holding period, we have several testable hypothesis: Holding period
should increase in the firm-specificity of human capital, in relative risk aversion and in
labor income. We see the first two effects in the first column of Table X. As we predict,
chosen holding periods rise with tenure, our measure of firm-specific human capital, and
is higher for civil servants, who are likely to be more risk averse. Holding period should
decrease with initial financial wealth, which is confirmed by the negative coefficient on
the INSEE wealth measure. The finding that holding period decreases in labor income is
inconsistent with our predictions, and again most likely caused by insufficient control for
wealth. (Salary and wealth effects should go in opposite directions, and the more precise
salary variable is probably picking up wealth effects.) In addition, we find that women
choose longer holding periods than men.
The second column in Table X analyzes the fraction of the portfolio invested in
Multiplix, the plan with downside protection. Our model predicts the desired downside
protection to be increasing in relative risk aversion, firm specificity of human capital,
labor income and weakly in idiosyncratic labor income risk. Consistent with the
predictions, we find that the downside-protected share is increasing in tenure. The result
that civil servants, whom we expect to be more risk averse, purchase less Multiplix goes
against our predictions. The effect is barley significant though and most likely caused by
civil servants having less idiosyncratic and firm-specific risk in their labor income. Labor
income decreases the downside-protected share, which is again most likely due to
insufficient controls for financial wealth. Given the limitations on the amount that
employees could invest into Multiplix, our model predicts a strong negative coefficient on
wealth. This prediction is confirmed by the negative coefficient on the INSEE wealth
measure.
Overall, a few preliminary salient facts emerge from the analysis of portfolio
allocations. Investors seem undeterred by long holding periods. Over 90 percent of
currently employed participants choose some assets with the five-year holding periods,
and over 90 percent of former employees choose some assets with a two-year holding

35
period.39 The portfolio compositions are roughly consistent with our predictions regarding
wealth and firm-specific human capital, suggesting that the neoclassical model is not at
odds with the data.
(d) Reconciling participation and personal contribution: A threshold effect
To us, the most puzzling finding is that decisions of whether and how much to
invest seem to be driven by different factors, rather than result from a single optimizing
decision by employees. Specifically, older workers, civil servants, men, former
employees and retirees are less likely to participate, but conditional on participating, these
participants invest more than others. One possible explanation is that a threshold level of
desired investments must be attained for participation to occur. For some groups, this
threshold may be higher, and therefore conditional on meeting it, personal contribution is
higher.
What might account for such a threshold? Our suspicion, reinforced with our
discussions with management, is that our findings could be explained by the “cost” (in
time and effort) for employee to evaluate the France Télécom offer, which was not trivial,
especially workers not used to investing in the stock market. The offering documents
sent to employees include a fair bit of legal paperwork, and as section 3 attests, analyzing
the nuances of the four different plans can be taxing (even for finance academics!) We
suspect that investors with less investable funds, perceiving less of a benefit from
reviewing the offer, might simply choose to ignore the paperwork, but those with more
investable funds might have taken the time to complete their analysis. As in models with
search costs, the employees for whom this “analysis” cost is higher are less likely to
participate, but conditional on participating will invest more.
Testing this explanation is hard because it is not obvious why this “analysis cost”
should vary across groups. It could be that various groups differ in their innate levels of
diligence (for example, male employees may have spent less time analyzing the offering
in detail than female employees) but we have we no way of measuring these differences.
39 The assets with five-year holding periods were not available to former employees.

36
France Télécom assured us that the marketing effort devoted to the offering was spread
evenly across employees, so there is no reason to think that some employees got better
access to information than others. However, it seems clear from our conversations with
managers that the marketing effort was significantly lower toward former employees and
retirees than toward current employees. Having former employees and retirees invest in
France Télécom was not a top priority of management. This difference was reflected in
the marketing effort: the offering was “pushed” toward current employees, not toward
former employees or retirees. Current employees could hear presentations on the offer
and compare notes with one another, former employees had to make the decision on their
own. We hypothesize that this difference could explain the difference in participation
and personal contribution. If "search costs" were lower for current employees, and
according to our threshold story, we would expect the determinants of participation and
personal contribution to diverge less for current employees than former employees or
retirees. Comparing Tables VI and IX, we find that such is indeed the case, lending
support to our threshold explanation.40
While we believe the threshold story is quite plausible, we are open to alternative
explanations. Another possibility is that these differences could be attributed to certain
groups of employees attempting to “game” the system by requesting more shares than
they actually wanted, in order to end up with a post-rationing amount they desired. As we
note earlier, the rationing rules were not announced in advance, so it may have been
difficult to place orders strategically. Further, we were told that employees were
surprised that any rationing took place, suggesting that their requested investments were
their desired investments. Nevertheless, suppose employees were completely prescient,
and could predict how many shares they would be allocated conditional on their requests.
Then, it would be appropriate to analyze the not their original orders, but their post-
rationing allocations of shares. When we repeated Table VIII using the ex post measure
of wealth invested, the results are virtually identical to those we report in the table. This
40 Under the assumption of non-zero thresholds for participation, the truncated regression and Tobitregression in Table IX are misspecified. Both regression models assume a threshold level of zero, and theestimated coefficients will be biased when the true thresholds differ from zero.
37
suggests that while gaming may have been a problem, it cannot explain the inconsistency
between the determinants of participation and investment amount.
(e) Can behavioral decision theory explain France Télécom employees’ response to theoffering?
Behavior finance, grounded in the psychological aspects of decision making,
provides alternative explanations for only some of the empirical results we report here.
Based on a naïve understanding of loss aversion, we would have expected Multiplix to
prove to be even more attractive than our model predicts, as it offered complete downside
protection, as well as a sizeable share of the upside on the France Télécom stock.
However, more than half of participants invested nothing in Multiplix (Table IX) and the
fraction of contribution in protected shares was not substantially larger than we
anticipated (Table VII.) Far from being "irrational," employees seem to have correctly
recognized the subtle constraints put on the combined investment in Multiplix and
Abdondix, whereby it can be optimal to substitute Abondix for Multiplix.41 We can only
conjecture that loss aversion was either not sufficiently strong or may have conflicted
with a self-control rule against borrowing: the fictional bank loan embedded in Multiplix
may not have been recognized as fictional.
The small size of the human capital effects may be due to many factors42, but
could be consistent with the mental accounting hypothesis (Thaler 1998). If employees
assigned their France Télécom human capital to a different account than their France
Télécom financial capital, they will not have perceived the increased risk exposure due to
the correlation of the two. Given the mental accounting effects documented in the
behavioral literature when just money is at stake, the mental separation of human and
financial capital is plausible.
41 Employees also did not follow a naïve 1/N rule, attempting to equally allocate their funds among allchoices, as has been found in other circumstances. See Bernartzi and Thaler (1999.)42 If tenure is an imperfect measurement of the firm-specificity of human capital, the coefficient on tenure inour regressions will be attenuated. More importantly, human capital may not be greatly at risk in France.

38
Loyalty effects may have been at work in the offering. Employees in the high-
salary range may be better performers and therefore feel greater loyalty to France
Télécom, and express it through more participation and more personal contribution.
We find these post-hoc behavioral explanations of our findings unsatisfying, in
part reflecting of what Laibson and Zeckhauser (1998) label the “promiscuous prediction
problem”: behavioral theories may yield opposite predictions, and allow too many
degrees of freedom. However, as Laibson and Zeckhauser note, “the promiscuous
prediction problem also plagues mainstream economics. Both behavioral models and
standard economics models are often so flexible that almost any outcome can be
explained by them.”
7. ConclusionsThe “opening of shareholding” at France Télécom offers an interesting setting for
analyzing the investment decisions of individuals with human and possibly financial
capital at risk. We develop a neoclassical model that attempts to capture the essential
features of the decision facing employees, and compare the predictions of our model to
the observed participation of France Télécom employees.
The data are consistent with many predictions from the simple neoclassical model.
In general terms, we expect that employees who are better able and willing to bear risk
will participate in the stock offers. We find evidence to this effect. Wealthier workers
and those who are better paid are more likely to buy shares in France Télécom, consistent
with the predictions of the model, and invest more in the firm. They also invest more in
short-horizon assets and less in Multiplix, given the plan limitations on their investments
in long-horizon assets.
Our most surprising finding is that the decisions whether to participate and how
much to invest are driven by different factors. It seems that a threshold level of desired
investments must be attained for participation to occur, perhaps because of the cost to
employees of analyzing the offering. We interpret this finding as manifesting to the
importance of marketing efforts in the employee stock offering, but recognize that
alternative explanations might be at work

39
Our empirical analysis reveal two other puzzles: human capital considerations
suggest that former employees should have been the most eager participants, followed by
currently employed civil servants, and finally by non civil servants. We find the opposite
pattern. To be sure, we do find some evidence of human capital effects, but they are
small: one standard deviation of tenure above the mean is associated with 0.5% less
likelihood of participation, and with 5.6%-8.6% less personal contribution, conditional on
investing. Secondly, we find that men and women invest differently with respect to their
likelihood of participating, the levels of their investments and their chosen portfolios.
In future versions of this work, we hope to have access to finer measures of the
empirical variables and establish our findings with some greater confidence. Even if we
were to succeed in getting more data, we acknowledge that empirical work of this sort is
almost by definition messy and incomplete. Nevertheless, further empirical studies of
investor behavior, while imperfect, can yield new insights into the investment decision-
making process of households.

40
Appendix
Setup of a simple model of portfolio selection
Our stylized three-period model provides intuition and testable predictions of the
determinants of portfolio choice in a setting with risky labor income, incomplete markets
and a binding choice of holding period. Markets are incomplete along three dimensions:
Firstly, there is no borrowing at either the risky or riskless rate. This extends the liquidity
constraints which have gained prominence in the literature on precautionary savings
(Browning and Lusardi (1996)). Second, idiosyncratic labor income risk is not insurable.
Since labor income is exogenous in our model, the associated risk is related to the
concept of unavoidable background risk (Gollier and Pratt (1996)). Finally, there are no
markets in the long-lived assets between the date of purchase and the maturity date.
There are two distinguishing characteristics of our model. First are the state-
dependent period two budget constraints: An investor cannot sell any of the long-lived
assets purchased in period one to finance consumption or new investments in period two.
Thus the period two consumption and investment decision depends on three factors: The
amount of consumable financial wealth, realized period-two labor income, and the value
of and composition of the non-consumable portion of financial wealth. Second are the
numerous discounts, matching bonuses and free shares as well as the constraints on the
amounts that can be invested. It is not clear whether the general predictions from the
portfolio selection literature continue to hold with this unusual investment opportunity
set, which we therefore model explicitly.
Worker-investors choose their investment and consumption in three periods,
subject to shocks to both risky financial assets and risky labor income. The investment
choice set—modeled to closely reflect the choices facing the France Télécom workers—
includes the assets from the France Télécom offering and additionally the standard risk-
free asset and a risky asset unrelated to France Télécom.
In the first two periods, the investor decides about his current consumption and
about the composition of his financial portfolio. In period one, the investor has the
choice between five different assets. The first asset is the standard risk-free bond. The
second asset is a slightly discounted share in France Télécom. The share can be traded in
41
period 2, and is meant to represent a simplified version of the Disponix and Simplix
products, which have short holding periods (one and two years respectively) in exchange
for reduced purchase discounts.43 To capture the discounts, the investors receive free
shares as a function of the number of shares purchased based on the actual terms of the
Disponix offering.
Additionally, there are two illiquid, long-lived assets based on the France Télécom
stock. These assets cannot be sold in the intermediate period, such that any investment
has to be held until period three. The first illiquid asset, Abondix, is nothing more than
the standard France Télécom stock, sold at a 20% reduced price. Abondix also comes
with a matching bonus and delivers a number of free shares as a function of the number
of units purchased. The second long-lived asset, Multiplix, is downside protected:
Investors have to pay the same price as for Abondix and are guaranteed a return of 25%
on their personal investment in period three. On top of the guaranteed repayment,
investors receive a matching bonus in period one and ten times the positive difference
between the period three share price and the period one share price as final payoff.
Multiplix thus delivers the upside on ten shares for each share purchased, and the
guaranteed personal investment is augmented by an additional matching bonus.44
The model takes into account the rules applied to the granting of bonuses and free
shares in the offering, and incorporates the constraints put on the amounts that can be
invested into the long-lived assets. In particular, for each level of period one labor
income, not more than 25% of this amount can be invested in Multiplix and Abondix
combined. The bonuses as well as the implicit leverage in Multiplix count towards the
constraint.45
Finally, the period one investment opportunity set contains a risky asset unrelated
to France Télécom. This captures the possibility to invest into the stock market or other
43 In reality, Disponix and Simplix have different number of free shares, purchase discounts and holdingperiod tradeoffs which we do not adequately capture in our simple model. We make this simplification inorder to concentrate on the longer-lived assets and to make the model more tractable.44 For simplicity, we ignore tax considerations and subsidized financing.45 The rules under which the discounts, bonuses and free shares are granted as well as the relevantconstraints are described in detail in the body of the paper.

42
risky assets independently from the France Télécom offering. Realistically, one would
have to take into account that the French stock market, and probably most risky assets
available to French retail investors, are correlated with the return on the France Télécom
stock. Instead we make the simplifying assumption that the return on the unrelated risky
asset is orthogonal to the return on the France Télécom stock.
In period two, the investor has to hold on to any illiquid assets Abondix and
Multiplix bought in period one. He then faces the standard consumption-savings
decision, and has to allocate any additional savings between the two short-term risky and
the riskless asset. The only assets available for investment at in period 2 are risk-free
bonds, standard France Télécom shares and the independent risky asset. We assume that
the investor receives no utility from bequests and consumes all his wealth in period
three.46
The uncertainty in our model unfolds as follows. The one-period return on the
France Télécom share is given by:
2,1for ,, =++= tpremiumRR tFTftFT ε
where RFT,i is the gross risk-free rate, premium is the equity premium and εFT,t is a mean-
zero shock to the stock return between period t and period t+1. Similarily, the return on
the unrelated risky asset is given by:
2,1for =++= tpremiumRR tft ε
The investor in our model receives labor income in each period. Period one labor
income L1 is known with certainty, but second and third period labor income is risky. It
is subject to two random shocks, one of which corresponds to the shock to the France
Télécom stock. This formalizes the notion that human capital is a risky asset, and related
to the performance of the employing firm. The second shock represents idiosyncratic
labor income risk, such as illness, layoffs, or unexpected income windfalls. Shocks to
labor income are persistent, such that a shock at t=2 affects income at t=3. Formally,
period 2 labor income is given by:
46 We are in the process of extending the model to reflect a longer investor horizon. For this time, wereflect this concern by over-weighting utility derived from t = 3 consumption (ending wealth).

43
)1()1( 1,1,12 LFTLL εερ +⋅⋅+=
where εFT,1 is the shock to the France Télécom stock return and εL,1 is a mean-zero
idiosyncratic labor income shock. The covariation between labor income and stock
returns is strictly increasing in the parameter ρ. Labor income in period 3 continues to be
subject to shocks to the France Télécom stock:
)1( 2,23 FTLL ερ ⋅+=
For simplicity, we set the idiosyncratic labor income shock in period three to zero. To
prevent our investor from simply hedging the positions in the illiquid assets at t=2, we
assume that short sales of both risky and riskless assets are prohibited.47 All three sources
of risk - εFT,t , εt and εL,t - are mutually independent.
The preferences of our investor are described by a constant-relative-risk-aversion
utility function, a formulation that is common in the neoclassical portfolio selection
literature, and we assume the standard Von Neumann-Morgenstern time-separability
conditions. Thus the investor's objective function is to maximize utility of consumption
over the three periods, which is given by48
γ
δδ
γ
−=
++=
−
1)(
and)()()(),,(
1
32
21321
tt
ccu
cucucucccU
where δ represents the time discount factor, and γ is the coefficient of relative risk
aversion.
In order to solve the model, we assume that each of the three sources of risk – the
France Télécom shock, the shock to the unrelated asset and the labor income shock – can
take on only one of two values in each period. We represent the underlying uncertainty in
the form of a binomial tree and solve the model numerically by backward induction.
47 Were employees able to sell stock short, they would have immediately purchased infinite amounts of thediscounted asset, shorted them and earned arbitrage profits by “monetizing” the discount.48 Because we are trying to model the tradeoff between liquidity and return, we cannot assume that theinvestor is maximizing over final wealth, since in that case the portfolio weight on the liquid, low returnasset would be zero.

44
The standard calibration of the model uses the following parameter values: Initial
wealth equals FF 200,000 and initial labor income equals FF 180,000 p.a. The relative
risk aversion (RRA) parameter is set to 5 and varied between 2 and 20. This range is
arbitrary, but relates to previous empirical work49. The individual time preference rate is
equal to the risk-free interest rate at 5%. The risk parameters in the baseline calibration
are a 30% annual volatility for the France Télécom stock return, a 25% volatility for the
unrelated risky asset and a 5% volatility for the independent labor income shock. The
outside risky asset has a more attractive Sharpe-ratio than the France Télécom stock,
capturing the idea that holding (for example) an indexed fund offers in general a more
favorable risk-return tradeoff than holding a single stock. The parameter controlling the
covariation between stock returns and labor income, ρ, is set to 0.1
49 See footnote 20 for a discussion of the relevant literature.
45
References
Arrondel, L., and A. Masson, 1990, “Hypotheses de cycle de vie, diversification etcomposition du patrimoine: France 1986”, Annales d’Economie et de Statistique17, 1-45.
Barber, B. and T. Odean, 1998, "Boys will be boys: Gender, overconfidence, andcommon stock investment," unpublished manuscript.
Becker, G. S., 1964, Human Capital: A Theoretical and Empirical Analysis, with SpecialReference to Education, New York: Columbia University Press (for NBER).
Benartzi, S., and R. H. Thaler, 1999, “Naïve diversification strategies in definedcontribution savings plans”, unpublished manuscript, UCLA.
Bertaut, C. C., and M. Haliassos, 1997, “Precautionary portfolio behavior from a life-cycle perspective", Journal of Economic Dynamics and Control 21, 1511-1542.
Blinder, A. S, ed., 1990, "Paying for productivity: A look at the evidence", Center forEconomic Progress and Employment series, Washington, D.C., BrookingsInstitution, xii, 308.
Bodie, Z., R. C. Merton, and W. F. Samuelson, 1992, “Labor supply flexibility andportfolio choice in a life cycle model”, Journal of Economic Dynamics andControl, 427-449.
Brav, A., and C. Geczy, 1996, “An empirical resurrection of the simple consumptionCAPM with power utility”, unpublished manuscript (Fuqua School of Business).
Brennan, M. J., and W. N. Torous, 1999, “Individual decision-making and investorwelfare”, unpublished manuscript, UCLA.
Browning, M., and A. Lusardi, 1996, "Household saving: Micro facts and macrotheories," Journal of Economic Literature.
Clarke, R. G., S. Krase, and M. Statman, 1994, “Tracking errors, regret, and tactical assetallocation”, Journal of Portfolio Management 20(3). 16-24.
Collat, D., and P. Tufano, 1994, "The Privatization of Rhône-Poulenc", Harvard BusinessSchool Case 295-049.
Cragg, J. G., 1971, "Some statistical models for limited dependent variables withapplication to the demand for durable goods", Econometrica 39, 829-844
Friend, I., and M. Blume, 1975, “The asset structure of individual portfolios and some

46
implications for utility functions”, Journal of Finance 30, 585-603.
Gollier, C., and J. W. Pratt, 1996, “Risk vulnerability and the tempering effect ofbackground risk”, Econometrics, 64, 1109-1123
Greene, W. H. 1993, Econometric Analysis, Upper Saddle River, NJ, Prentice-Hall.
Guiso, L., T. Jappelli; and D. Terlizzese, 1996, “Income risk, borrowing constraints, andportfolio choice”, American Economic Review 86 (1), 158-172.
Hausman, J.A and D. A. Wise, " Social Experimentation, Truncated Distributions, andEfficient Estimation", Econometrica, Vol. 45 (4 May ), 919-38.
Heckman, J. J., 1976, "The common structure of statistical models of truncation, sampleselection and limited dependent variables and a simple estimator for suchmodels", Annals of Economic and Social Measurement 5/4.
Jones, D. C., and T. Kato, 1995, "The productivity effects of employee stock-ownershipplans and bonuses: Evidence from Japanese panel data", American EconomicReview, Vol. 85 (3 June), 391-414.
Jovanovic, B., 1984, "Matching, turnover, and unemployment", Journal of PoliticalEconomy, Vol. 92 (1 February), 108-22,
Kahneman, D., J. Knetsch, and R. H. Thaler, 1991, "The endowment effect, loss aversion,and status quo bias: Anomalies", Journal of Economic Perspectives 5, (Winter),193-206.
Kahneman, D., and A. Tversky, 1979, "Prospect theory: An analysis of decision underrisk", Econometrica, Vol. 47 (2 March), 263-91.
Laibson, D., and R. Zeckhauser, 1998, “Amos Tversky and the ascent of behavioraleconomics,” Journal of Risk and Uncertainty, Vol. 16, 1 (April), 7-47.
Lee, L.-F., 1983, "Generalized econometric models with selectivity", Econometrica 51,507-512
Leland, H. E., 1980, “Who should buy portfolio insurance?” Journal of Finance 35, 581-594.
Maki, A., and S. Nishiyama, 1996, "An analysis of under-reporting for micro-data Sets:The misreporting or double-hurdle model", Economics Letters 52, 211-220
Mankiw, N. G. and S. P. Zeldes, 1991, “The consumption of stockholders andnonstockholders,” Journal of Financial Economics 29, 97-112.

47
Merton, R. C., 1969, "Lifetime portfolio selection under uncertainty: the continuous-timecase", Review of Economics & Statistics, Vol. 51 (3 Aug.), 247-57.
Merton, R. C., 1971, "Optimum consumption and portfolio rules in a continuous-timemodel", Journal of Economic Theory, Vol. 3 (4 Dec), 373-413.
Prelec, D. and G. Loewenstein, 1998, "The red and the black: Mental accounting ofsavings and debt", Marketing Science, Vol,. 17 (1), 4-28.
Samuelson, P. A., 1969, "Lifetime portfolio selection by dynamic stochasticprogramming", Review of Economics & Statistics, Vol. 51 (3 Aug), 239-46.
Schelling, T. C., 1984, "Self-command in practice, in policy, and in a theory of rationalchoice", American Economic Review, Vol. 74 (2 May), 1-11.
Scholes. M. S., and M. A. Wolfson, 1990, “Employee stock ownership and corporaterestructuring: Myths and realities”, Financial Management 19 (Spring), 19-28.
Schubert, R., M. Brown, M. Gysler and H.W. Brachinger, 1999, “Financial decision-making: are women really more risk-averse?”, American Economic Review, Vol.89, 2 (May), 381-385.
Shefrin, H. M., and M. Statman, 1993, ''Behavioral aspects of the design and marketing offinancial products'', Financial Management (Summer).
Shefrin, H. M., and M. Statman, 1994, "Behavioral capital asset pricing theory", Journalof Financial & Quantitative Analysis, Vol. 29 (September 3), 323-49.
Shefrin, H. M., and M. Statman, 1984, "Explaining investor preference for cashdividends", Journal of Financial Economics, Vol. 13 (2 June), 253-82.
Shefrin, H. M., and R. H. Thaler, 1988, "The behavioral life-cycle hypothesis", EconomicInquiry, Vol. 26 (4 October), 609-43.
Shiller, R. J., 1997, ''Human behavior and the efficiency of the financial system'',Working Paper, Yale University, 1997, prepared for Taylor, J.B and Woodford,M., (eds.), ''Handbook of Macroeconomics'', forthcoming.
Sundén, A. E. and B. J. Surrette, 1998, "Gender differences and the allocation ofretirement assets in retirement savings plans," American Economic Review 88 (2May), 207-211.
Szpiro, D., 1995, "La diffusion des produits financiers aupres des menages en France,1995," Economie et Statistique 281, 41-68.

48
Thaler R. H., 1980, "Toward a positive theory of consumer choice", Journal ofEconomics Behavior and Organization I, 39-60.
Thaler, R. H., 1985, "Mental accounting and consumer choice", Marketing Science, Vol.4 (3 Summer), 199-214.
Thaler, R.H., 1998, “Mental accounting matters,” forthcoming in Daniel Kahneman andAmos Tversky (eds.), Choices, Values and Frames, Cambridge University Press.
Thaler, R. H., 1990, "Saving, fungibility, and mental accounts", Journal of EconomicPerspectives, Vol. 4 (1 Winter), 193-205.
Thaler, R. H., and H. M. Shefrin, 1981, "An economic theory of self-control", Journal ofPolitical Economy, Vol. 89 (2 April), 392-406.
Tobin, J., 1958, "Estimation of relationships for limited dependent variables",Econometrica 26, 24-36
Topel, R. H., 1991, "Specific capital, mobility, and wages: wages rise with job seniority",Journal of Political Economy, Vol. 99 (1 February), 145-76.
Tversky, A., and D. Kahneman, 1991, "Loss aversion in riskless choice: A reference-dependent model.", The Quarterly Journal of Economics, Vol. 106 (4 November),1039-61.
Viceira, L. M., 1997, "Optimal portfolio choice for long-horizon investors withnontradable labor income," manuscript, Harvard University.
Williams, N., 1991, "Reexamining the wage, tenure and experience relationship", Reviewof Economics & Statistics, Vol. 73 (3 August), 512-17.

49
Figure 1: Payoff of Multiplix vs. Abondix for the maximum allowed Multiplixinvestment amountFinal portfolio value after five years of an initial FF 9,000 investment in either Abondix orMultiplix, including all bonuses and free shares, assuming that the dividend plus taxcredit yield on France Télécom is 3.6%.
Payoff to Abondix and Multiplix (FF 9,000 Personal Contribution)
-
50,000
100,000
150,000
200,000
250,000
0 20 40 60 80 100 120 140 160 180 200 220 240 260 280 300 320 340 360 380 400 420 440 460 480 500Value of FT in Five Years
Port
folio
Val
ue
AbondixMultiplix

10000
20000
30000
40000
50000
60000
70000
Tenure (years)
age < 35age 35 to 50age > 50
Figure 2: Employee participation and contributionPanel A plots participation rate against salary gradeworkers. Panel B plots the amount of requested empl
0.00
0.10
0.20
0.30
0.40
0.50
0.60
0.70
0.80
0.90
1.00
11 12 13 21 22 23 31 32 33 41 42 43 44Salary Grade
RetireesFormer employeesCurrent civil servantsCurrent non-civil servants
Panel A
45 46
50
s, for the different classes of eligible current or former France Télécomoyee investment, as a function of age and tenure.
Panel B

51
Panel A
Av e r a g e p o r tfo lio w e ig h ts a s a fu n c t io n o f s a la r y g r a d e
M u lt ip lixS t o c k
A b o n d ix
0
0 .1
0 .2
0 .3
0 .4
0 .5
0 .6
0 .7
0 .8
0 .9
1
1 1 1 2 1 3 2 1 2 2 2 3 3 1 3 2 3 3 4 1 4 2 4 3 4 4 4 5 4 6S a la ry G ra d e
Panel C
Average portfolio w eights as a function of tenure for non civil servants
MultiplixStock
Abondix
0
0.1
0.2
0.3
0.4
0.5
0.6
0.7
0.8
0.9
1
0 2 4 6 8 10 12 14 16 18 20 22 24 26 28 30 32 34 36 38 40
Tenure
Panel B
Av e r a g e p o r t fo l io w e ig h ts a s a fu n c t io n o f a g e
M u lt ip lixS t o c k
A b d o n d ix
00 .1
0 .20 .30 .4
0 .50 .60 .70 .8
0 .91
1 9 2 1 2 3 2 5 2 7 2 9 3 1 3 3 3 5 3 7 3 9 4 1 4 3 4 5 4 7 4 9 5 1 5 3 5 5 5 7 5 9 6 1 6 3A g e
Panel D
Average por tfo io w eights as a functionof tenure for civil servants
Multip lixS tock
Abondix
0
0.1
0 .2
0 .3
0 .4
0 .5
0 .6
0 .7
0 .8
0 .9
1
0 2 4 6 8 10 12 14 16 18 20 22 24 26 28 30 32 34 36 38 40
Tenure
Figure 3: Average observed portfolio allocations as a function of employee characteristicsAverages of the portfolio weights chosen by current employees as a function of salary grade, age, tenure of non-civil servants andtenure of civil servants respectively. Simplix and Disponix have been aggregated into a single measure labeled stock to facilitatecomparison with the model predictions.

52
Table IDescription of the France Télécom Privatization Offerings to Employees
This table summarizes the characteristics of the four share programs offered to France Télécom employees during its privatization a
Program Discount Matching Bonus Free Shares b TaxTreatment
RequiredHoldingPeriod
Payment Options Guarantees Limits
Abondix 20% off ofoffer price
!100% for first FF 3000!50% for next FF 6000!25% for next FF 66000
!One for eachshare purchased upto FF 3000!One for eachfour sharespurchased for thenext FF 3860
Tax free c 5 years !In cash!In three payments over twoyears d
!In 36 monthly payments e
!Through transfer fromcompany pension plan f
None PEG limits g
Multiplix h 20% off ofoffer price
!50% for first FF 2000!Plus 9 x ( personalcontribution and bonus) as aguaranteed bank loan.!The investor forgoesdividends and tax credit
None Tax free c 5 years !In cash!In three payments over twoyears d
!In 36 monthly payments e
!25 % return overfive years onpersonal contribution!guaranteedrepayment of thebank loan
!PEG limits g
!Personalcontribution lessthan FF 9000
Simplix 20% off ofoffer price
None !One for eachbought share up toFF 3000!One for eachfour sharespurchased for thenext FF 3860
Taxable 2 years/3 years forfree shares
!In cash!In three payments over twoyears!In 36 monthly payments e
None 5 times theannual SocialSecurity limit(FF 823,200 in1997)
Disponix none None !One for eachthree shares boughtup to FF 6860
Taxable i none/1 year forfree shares
In cash only None 5 times theannual SocialSecurity limit)
a. Eligibility: Eligible for all programs are (i) the personnel of France Télécom or of French subsidiaries of which France Télécom owns more than 50% of capital. To be eligible for access to the groupsavings plan PEG (Multiplix+Abondix) requires furthermore at least three month seniority at the time of subscription. Only current employees can purchase Multiplix and Abondix. Employees with badcredit history are not eligible for participation in Multiplix.b. The free shares have a global limit of FF 6,860 for all share programs combined. Free share payments will be made to Disponix first, then Simplix, and last, Abondix. The maximum request for sharescannot exceed 5 times the Social Security limit, or FF 823,200 for 1997.c. Since the shares are held by the group savings plan (PEG), the bonus, capital gains and paid dividends are tax free. Social security contributions (CSG/CRDS) are applicable.d. The three payments of 30% at delivery, 30% after one year and 40% after two years are interest free.e. The 36 monthly payments are interest free.f. Payments made through transfers from the pension plan carry no bonus.g. The total annual investment in the group savings plan (PEG) cannot be larger than one quarter of the annual salary of the employee. Furthermore, the total bonus paid into PEG cannot exceed FF22,500, whereby the Abondix bonus is allocated before the Multiplix bonus.h. In order to participate in Multiplix, the employee must have bought at least one share in one of the other programs.i. Under the French tax regime, the first FF 8,000 of dividends for individuals, and the first FF 16,000 for couples are tax free. Above this, dividends are taxed at regular income rates, which wouldrange from 28% to 37% for the bulk of France Télécom employees. Capital gains are taxed at a 20.9% rate.

53
Table IIPredictions from a simple model of portfolio selection
This table presents the predictions from the model of portfolio selection described in the Appendix. Panel Ashows the comparative statics for the level of personal investment as a function of relative risk aversion, laborincome, financial wealth, and idiosyncratic risk. Panel B shows the statics for the choice between FranceTélécom assets as a function of the same parameters.
Panel A: Comparative statics for the level of personal investment
Increasing relative risk aversion (RRA)lowers the amount of personal investment.
The predicted contribution falls from FF 59,800 for RRA=1 to FF 2,700 forRRA=20.
Increasing the correlation between laborincome (human capital) and the stockdecreases the personal investment.
The predicted contribution falls from FF 42,800 for no correlation (ρ=0) toFF 2,100 for strongly positive correlation (ρ=0.3).
Increasing labor income (human capital)increases the amount of personalinvestment.
The predicted personal contribution rises less than proportionally from FF13,600 for no labor income to FF 45,800 for an annual labor income of FF2,000,000. The effect is not monotonic.
Increasing initial financial wealthincreases the amount of personalinvestment.
The increase is less than proportional due to the income-linked constraints oninvestment into the long-lived assets.
Increasing the idiosyncratic risk in laborincome has an ambiguous effect onpersonal investment.
The net effect of increasing precautionary savings and decreasing risk takingis positive for low levels of risk aversion (RRA=5) and negative for highlevels of risk aversion (RRA=12).
Panel B: Comparative statics for the choice among France Télécom assets
Increasing relative risk aversion (RRA)shifts the portfolio from short-lived FranceTélécom assets first to Abondix and then toMultiplix.
The portfolio is 87% in short-lived France Télécom assets for RRA=1, 100%in Abondix for RRA=5 and 100% in Multiplix for RRA≥16.
Increasing the correlation between laborincome (human capital) and the stock shiftsthe portfolio from short-lived FranceTélécom assets first to Abondix and then toMultiplix.
The portfolio is 29% in short-lived France Télécom assets and 71% inAbondix for no correlation (ρ=0), 100% in Abondix for ρ=0.1 and 100% inMultiplix for strongly positive correlation (ρ≥0.3).
Increasing labor income (human capital)shifts the portfolio from short-lived FranceTélécom assets first to Abondix and then toMultiplix.
The income based constraint does not allow much investment into the long-lived assets for low levels of labor income. As labor income increases, theconstraint is relaxed, but the increased exposure of total wealth to FranceTélécom shifts the demand towards the downside protected Multiplix. Forhigh labor income, the Multiplix demand is constraint by the FF 9,000 limit.
Increasing initial financial wealthdecreases the portfolio share invested intothe two long-lived assets.
The income-linked constraint on the investment into the long-lived assetsbecomes binding as financial wealth is increased.
Increasing the idiosyncratic risk in laborincome tends to shift the portfolio fromAbondix to Multiplix for workers with highRRA.
The effect is restricted to workers with high RRA. For employees withRRA=12, increasing idiosyncratic labor income risk from 0 to 20% shifts theportfolio from 50% in Abondix and 50% in Multiplix to 100% in Multiplix.

54
Table IIIDescriptive statistics on characteristics of individuals eligible
to participate in France Télécom employee share offerings
This table below show information about the 205076 employees eligible to participate in the FranceTélécom employee offering scheme in 1997. Panel A reports age and job tenure (date of employmentthrough time of offer.) Panel B shows the breakdown by type of participant, job category, and gender.Panel C presents the sample by salary grade. Salary grade code 11 is the lowest and 46 is the highest salarylevel. Salary grade codes below are for employees at majority owned subsidiaries of France Télécom.Salary grades 11 to 23 indicate ordinary employees and technicians. In this group the average monthlysalary in 1997 was FF 12,562 for men and FF 11,928 for women. 31 to 33 are middle managers, with anaverage salary of FF 17,104 for men and FF 16,059 for women. Finally, 41 to 47 are managers, with anaverage monthly salary of FF 25,445 for men and FF 22,548 for women. CD stands for cadre dirigeant(executive) while OE, AM and CA refer to employees at subsidiaries and stand for clerical/technicalemployee, foremen and manager respectively.
Panel AAge
(years)Job tenure
(years)Mean 44. 5 19.9Standard Deviation 10.4 10.5Number of observations 200,216 200,606
Panel BType of
employeeNumber Job category Number Sex Number
Currentemployee
174091 Civil servant 143781 Male 124444
Formeremployee, notretired
8628 Non civil servant 38010 Female 80146
Retiree 22357Total 205076 Total 181791 Total 204590
Panel CSalary Level Number Salary Level Number
11 1102 42 698112 3066 43 320013 17313 44 137821 41514 45 65022 52000 46 16123 24212 CD 13031 4128 OE 920732 6559 AM 266433 12167 IN 265041 4651 CA 7189
Total 200925

55
Table IVOffering Participation Statistics
Participation ratios and total number of eligible employees for each class of employee:current, former, retired, civil servant and non-civil servant.
Allpotentialinvestors
Currentemployees
Currentlyemployed
civil servants
Currentlyemployed non-civil servants
Retired Formeremployees
(not retired)Participationratio
62.8% 68.0% 66.5% 73.5% 37.8% 21.6%
Total number ofindividuals
205,076 174,091 135,891 38,200 22,357 8,628

56
Table VProbit analysis of participation in France Télécom
employee share offering program
The dependent variable is a dummy variable that equals one if the employee requested any sharesunder any of the four programs. The independent variables are log tenure, age, age squared,claimant category, salary grade and job category (not reported). The claimant category dummiesare to be interpreted relative to current employees and the salary grade dummies relative to salarylevel 11, the lowest.
Coefficient p-value Coefficient p-valueConstant -0.6062 0.0000 -0.6618 0.0000Log Tenure
current civil servants -0.0484 0.0000 -0.0170 0.0739current non-civil servants -0.1576 0.0000 -0.0310 0.0017former employees 0.2319 0.0000 0.2417 0.0000
Age -0.0103 0.0000 -0.0068 0.0000Age squared 0.0000 0.4166 -0.0001 0.0161Civil servant dummy -0.0484 0.1102 -0.1416 0.0000Female dummy 0.1622 0.0000 0.1489 0.0000Retiree dummy -1.3061 0.0000 -1.3292 0.0000Former employee dummy -2.0147 0.0000 -2.1618 0.0000Wealth measure [(age-18)*salary]
current employees 0.0043 0.0007retirees 0.0018 0.2615former employees -0.0030 0.2133
INSEE wealth measure 0.0044 0.0013 0.0038 0.0020Salary levels
11 (lowest) * *12 0.2793 0.0000 0.6169 0.000013 0.4361 0.0000 0.6525 0.000021 0.7564 0.0000 0.9776 0.000022 0.9305 0.0000 1.1424 0.000023 1.2699 0.0000 1.4781 0.000031 1.3941 0.0000 1.6512 0.000032 1.5356 0.0000 1.7919 0.000033 1.4779 0.0000 1.7288 0.000041 1.8115 0.0000 2.1548 0.000042 1.6576 0.0000 1.9341 0.000043 1.8514 0.0000 2.0727 0.000044 2.2084 0.0000 2.4705 0.000045 1.9041 0.0000 2.1713 0.000046 (highest) 2.5012 0.0000 2.7575 0.0000AM* 1.4063 0.0000CA 1.7469 0.0000IN 2.1224 0.0000OE 0.8105 0.0000N 151943 167229
* The lettered salary grade codes are for employees at majority owned subsidiaries of France Télécom.
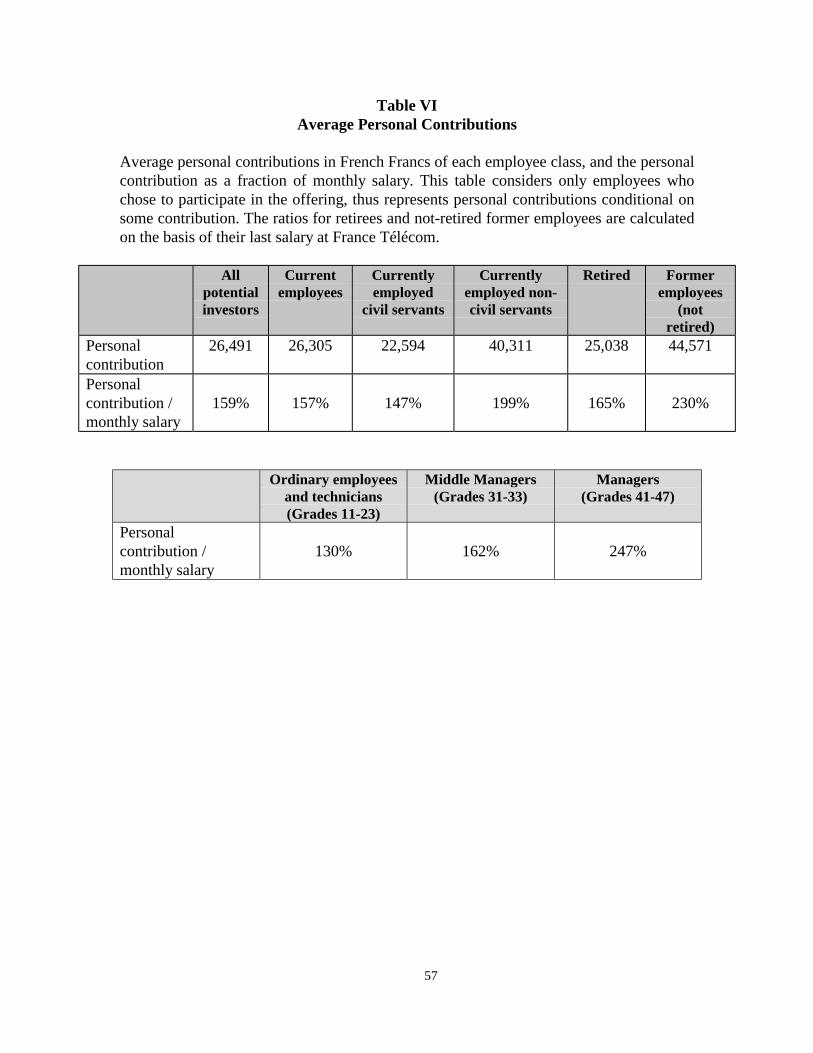
57
Table VIAverage Personal Contributions
Average personal contributions in French Francs of each employee class, and the personalcontribution as a fraction of monthly salary. This table considers only employees whochose to participate in the offering, thus represents personal contributions conditional onsome contribution. The ratios for retirees and not-retired former employees are calculatedon the basis of their last salary at France Télécom.
Allpotentialinvestors
Currentemployees
Currentlyemployed
civil servants
Currentlyemployed non-civil servants
Retired Formeremployees
(notretired)
Personalcontribution
26,491 26,305 22,594 40,311 25,038 44,571
Personalcontribution /monthly salary
159% 157% 147% 199% 165% 230%
Ordinary employeesand technicians(Grades 11-23)
Middle Managers(Grades 31-33)
Managers(Grades 41-47)
Personalcontribution /monthly salary
130% 162% 247%

58
Table VIIContrasting the observed investment behavior with the predictions from the portfolio selection model
The table below shows the investment behavior of current employees and selective predictions from the three-period model. In Panel A, wedistinguish between three salary levels: Low salary corresponds to ordinary employees and technicians with average salary of FF 12,250, mediumsalary to middle managers with average salary of FF 16,500 and high salary to managers with average salary of FF 24,000. Employees with highwealth are identified as the top 5% quintile of the INSEE wealth measure, employees with low wealth as the bottom 5% quintile of the INSEEwealth measure. In Panel B, the salary levels are set equal to the actual France Télécom salary grades used in Panel A. Low initial financialwealth is set to FF 200,000, medium wealth to FF 300,000 and high financial wealth to FF 600,000. Relative risk aversion is set to either 2 or 5,and the parameter of covariation (ρ) between labor income and stock returns to either 0 or 0.1. All other parameters are set equal to the standardcalibration described in the Appendix.

59
Panel A: Investment behavior of current employeesAll currentemployees
Civilservants
Non civilservants
full samplePersonalinvestment
FF 26,305 FF 22,594 FF 40,311
Average holdingperiod
4.6years 4.6 years 4.5years
Downsideprotected share
8.3% 8.6% 7.0%
low wealth, low salaryPersonalinvestment
FF 13,524 FF 12,563 FF 20,109
Average holdingperiod
4.8 years 4.8 years 4.7 years
Downsideprotected share
7.6% 7.9% 5. 5%
low wealth, high salaryPersonalinvestment
FF 58,486 FF 57,597 FF 61,64
Average holdingperiod
4.4 years 4.5 years 4.3 years
Downsideprotected share
9.0% 9.3% 7. 7%
high wealth, low salaryPersonalinvestment
FF 16,457 FF 16,345 FF 17,118
Average holdingperiod
4.8 years 4.8 years 4.6 years
Downsideprotected share
6.3% 6.55% 5.15%
high wealth, high salaryPersonalinvestment
FF 89,518 FF 91,170 FF 87,521
Average holdingperiod
4.31 years 4.33 years 4.29 years
Downsideprotected share
7.94% 8.12% 7.72%
Panel B: Predicted investment behaviorRRA=5,
ρρρρ=0RRA=5,
ρρρρ=0.1RRA=2,
ρρρρ=0.1medium wealth, medium salaryPersonalinvestment
FF 26,615 FF 19,273 FF 49,903
Average holdingperiod
3.90 years 5.00 years 2.51 years
Downsideprotected share
3.45% 4.76% 2.22%
low wealth, low salaryPersonalinvestment
FF 22,868 FF 12,313 FF 57,666
Average holdingperiod
3.15 years 5.00 years 3.15 years
Downsideprotected share
7.69% 14.29% 0.00%
low wealth, high salaryPersonalinvestment
FF 27,533 FF 12,390 FF 40,152
Average holdingperiod
4.20 years 5.00 years 3.86 years
Downsideprotected share
10.00% 33.33% 4.76%
high wealth, low salaryPersonalinvestment
FF 35,487 FF 22,944 FF 75,811
Average holdingperiod
2.5 years 3.40 years 1.47 years
Downsideprotected share
0.00% 0.00% 0.00%
high wealth, high salaryPersonalinvestment
FF 38,883 FF 22,925 FF 67,570
Average holdingperiod
2.79 years 5.00 years 1.63 years
Downsideprotected share
3.45% 7.69% 1.75%

60
Table VIIITruncated regression and Tobit analysis of personal contribution levels
The dependent variable is the log of total employee contribution. The independentvariables are log tenure, age, age squared, claimant category, salary grade and jobcategory (not reported). The claimant category dummies are to be interpreted relative tocurrent employees and the salary grade dummies relative to salary level 11, the lowest.The first column shows the results using the truncated regression model (Greene 1993),while the second column shows the results of a standard Tobit .
* The lettered salary grade codes are for employees at majority owned subsidiaries of France Télécom.
Coefficient p-value Coefficient p-valueConstant 8.7416 0.0000 -1.7905 0.0000Log Tenure
current civil servants -0.0654 0.0000 -0.0719 0.0922current non-civil servants -0.0608 0.0000 -0.1495 0.0004former employees -0.0936 0.0071 1.6916 0.0000
Age 0.0090 0.0000 -0.0268 0.0000Age squared -0.0001 0.0301 -0.0004 0.0333Civil servant dummy 0.0633 0.0013 -0.4828 0.0000Female dummy -0.1795 0.0000 0.5265 0.0000Retiree dummy 0.1446 0.2419 -8.5946 0.0000Former employee dummy 0.1661 0.0807 -13.1820 0.0000INSEE wealth measure 0.0180 0.0000 0.0296 0.0000Salary levels
11 (lowest) * *12 0.0941 0.1479 3.6865 0.000013 0.2276 0.0002 3.7353 0.000021 0.3151 0.0000 5.8340 0.000022 0.4859 0.0000 6.7672 0.000023 0.6243 0.0000 8.4187 0.000031 0.6175 0.0000 9.0306 0.000032 0.7640 0.0000 9.6151 0.000033 0.9217 0.0000 9.6140 0.000041 1.1289 0.0000 10.7452 0.000042 1.3967 0.0000 10.5509 0.000043 1.6815 0.0000 11.2656 0.000044 1.9549 0.0000 12.4027 0.000045 2.1855 0.0000 12.2274 0.000046 (highest) 2.5225 0.0000 13.8525 0.0000AM* 0.8157 0.0000 8.3605 0.0000CA 1.4463 0.0000 10.1470 0.0000IN 0.8403 0.0000 10.1455 0.0000OE 0.5126 0.0000 5.3309 0.0000N 167229 167229
Truncated regression Tobit regression model��������������������������������������������������������������������������������������������������������������������������

61
Table IXChoice of Assets and Asset Combinations
Panel A reports the participation percentages for each type of the four assets broken down byemployee type. The Transfer class corresponds to the purchase of Abondix using the employee’sexisting pension plan assets. Retirees and former employees were not allowed to purchaseAbondix or Multiplix. These percentages need not add up to one as employees could participatein multiple share schemes. Panel B reports the fraction of each class of employee that purchasedeach combination of assets, focusing on the most popular asset combinations.
Panel AAll potential
investorsCurrent
employeesCurrently
employed civilservants
Currentlyemployed non-civil servants
Retired Formeremployees (not
retired)Abondix 90.5% 97.2% 98.2% 93.7% n/a n/aTransfer(Abondix)
10.9% 10.9% 11.2% 9.7% n/a n/a
Multiplix 40.9% 44.4% 45.6% 40.0% n/a n/aDisponix 11.5% 11.0% 10.9% 11.1% 16.7% 22.2%Simplix 21.8% 16.3% 15.3% 20.4% 92.8% 94.5%
Panel BCurrent
employeesCurrently
employed civilservants
Currentlyemployed non-civil servants
Retired Former employees(not retired)
Abondix 40.8% 40.7% 41.1% n/a n/aAbondix-Multiplix
29.0% 29.8% 25.9% n/a n/a
Abondix-Transfer
4.2% 4.2% 4.0% n/a n/a
Abondix-Simplix
3.4% 3.2% 4.2% n/a n/a
Abondix-Transfer-Multiplix
3.2% 3.5% 2.4% n/a n/a
Abondix-MultiplixDisponix-Simplix
2.3% 2.3% 2.4% n/a n/a
Abondix-Disponix
2.2% 2.2% 2.2% n/a n/a
Simplix 1.5% 0.8% 4.1% 82.9% 77.8%Disponix 0.4% 0.4% 0.6% 5.6% 5.5%Disponix-Simplix
0.3% 0.2% 0.8% 11.5% 16.7%

62
Table XHolding Period and Downside Protection Measures as a Function of
Employee Characteristics
Two-sided censored Tobit regressions for holding period and downside protection as a function ofemployee characteristics. The dependent variable in the first column is the average contribution-weightedex ante holding period, in years. The dependent variable in the second column is the fraction of theemployee’s personal contribution invested in Multiplix (protected by puts). This analysis is conducted onlyfor employees who chose to contribute and is limited to current employees (as former employees andretirees were not eligible for long-term plans, including Multiplix). The independent variables are logtenure, age, age squared, claimant category, the INSEE wealth measure, salary grade, and job category (notreported). The claimant category dummies are to be interpreted relative to current employees and the salarygrade dummies relative to salary level 11, the lowest
Coefficient p-value Coefficient p-valueConstant 5.4418 0.0001 0.3034 0.0001Log Tenure
current civil servants 0.1440 0.0001 0.0092 0.0001current non-civil servants 0.1150 0.0001 0.0105 0.0001
Age -0.0003 0.8485 -0.0003 0.0983Age squared 0.0004 0.0013 0.0000 0.0001Civil servant dummy 0.3200 0.2334 -0.0808 0.0299Female dummy 0.3642 0.0001 0.0013 0.4254INSEE wealth measure -0.0216 0.0001 -0.0021 0.0001Salary levels
11 (lowest) * *12 1.8574 0.0001 0.1186 0.000113 1.3939 0.0001 0.0929 0.000121 1.3498 0.0001 0.0869 0.000122 1.0028 0.0001 0.0865 0.000123 0.9135 0.0001 0.0852 0.000131 0.8467 0.0001 0.0824 0.000132 0.6639 0.0001 0.0777 0.000133 0.4479 0.0019 0.0721 0.000141 0.3685 0.0120 0.0635 0.000142 0.0892 0.5327 0.0592 0.000143 -0.1670 0.2540 0.0406 0.008844 -0.3685 0.0174 0.0195 0.222945 -0.6914 0.0001 -0.0123 0.486146 (highest) -1.0176 0.0001 -0.0443 0.0709AM* 1.2447 0.0001 0.0822 0.0001CA 0.3810 0.0076 0.0528 0.0005IN 0.7851 0.0001 0.1019 0.0001OE 1.3901 0.0001 0.0961 0.0001N 102258 105302
Holding period Downside protection������������������������������������������������������������������������������������������������������������������������
* The lettered salary grade codes are for employees at majority owned subsidiaries of France Télécom.