,.:sell'enlth canadian masonry symposium mc.mal;rer
TRANSCRIPT
,.:Sell'enlth Canadian Masonry Symposium MC.Mal;rer University ffimruoo1n, Ontario June 4-7, 1995
Effect of openings on the Behavior of Reinforced Masonry Shear Walls Using Nonlinear Finite Element Analysis
Gouda Ghanem
ABSTRACT
In order to implement reinforced masonry as a cost-efficient building in Egypt, Design Code and Standard Specification for masonry should be developed. This requires longterm research effort in this area to provide an adequate data base for the design procedures, this paper is a contribution to that effort. . Failure characteristics and load carrying capacity of reinforced masonry shear walls depends mainly upon the level of axial precompression, masonry strength, wall geometry, boundary conditions, and size and locations of openings. This paper presents only the effect of openings size and location on the behavior of reinforced masonry shear walls. The analysis of such shear walls is based on two-dimensional, four nodes parabolic isoparametric quadrilateral fmite element with idealized nonlinear stress-strain relations for reinforced masonry. In this program the masonry and reinforcement are modeled separately and their interaction is included by using for node isoparametric plane stress overlay element occupying the same space. The results show that the location and size of openings have a significant effect on failure mode, stiffness, load-deflecion curve, and ultimate strength of shear walls.
INTRODUCTION
The analysis of reinforced masonry shear walls in multistory buildings has received the attention of many engineers in recent years. Conventionally shear walls are introduced into tall buildings for the purpose of offering resistance to movements, those caused by wind and earthquakes. Many time, however for either architectural or environmental reasons engineers introduce a series of openings into shear walls, there by reducing their efficiency
Assistant Professor, Helwan University, Cairo, Egypt
263 Ghanem

and altering their deformation characteristics. From the standpoint of structural analysis, the problem is highly redundant and it is required to determine the stresses and strains of the shear walls around openings is required. For this reason, the analysis of shear walls with openings would contribute to practical engineering design. The intention herein is to illustrate the use of the finite element method in determining stresses and load carrying capacity as well as rigidity of shear wall with openings. The placement and size of openings in walls affects both the appearance of the building and its structural response. Therefore, it is very important that the locations for windows, doors, and services be rationally planned at an early stage of design (Drysdale et al 1992). Depending upon the size and location of openings, large variations in the stiffness of a shear wall can result (Amrhein, J. 1992). Walls with vertically aligned openings tend to be divided into separate strips with greatly reduced total stiffness. In the case of aligned openings, the separate wall strips can be interconnected either just by floor slab alone or by specially designed short, deep coupling beams. This coupling of the shear walls introduces a complexity in masonry construction because of the difficulty of providing contiguity at the intersection of the walls and horizontal beams. Several different methods of analysis have been used for coupled reinforced concrete and unreinforced masonry shear walls to determine the design requirements and to predict displacements. It is reported (Sinha et al 1975) that standard methods of analysis do not provide reliable predictions of either stresses or displacement for coupled unreinforced masonry walls. The cantilever method which ignores any coupling, was found to overestimate the extreme fiber stresses and the deflections. The continuum method, assuming wall interaction, provided a reasonable estimate of stress, but it underestimated deflection. The conclusion is that analysis based on an equivalent frame or wide column frame for large shear wall strips is a reasonable approach. However, the results can vary widely, depending on whether centerline span lengths are used or rigid arms are introduced at the ends of members. The effect of shear deformation can also be significantly underestimated. Unlike the other methods, the finite element analysis can model nonlinear strain and stress distribution along the wall and produces results consistent with test results, which also showed decreasing rigidity at higher shear loads. Reinforced masonry is composed of different material namely; concrete blocks, mortar, grout and steel reinforcement. Each element has different properties which make the behavior of the wall panel more complex. In addition, the existence of bed and head joints makes the material anisotropic. The analytical model presented in this paper is intended to be used for the prediction of load-displacement relationships, stiffness and load carrying capacity of shear walls. Shear walls frequently contain openings of different sizes and locations. In the case of small openings for running cables and ducts the effect may be negligible.
COMPUTER CODE PROGRAM
The program was a two-dimensional, four nodes parabolic isoparametric quadrilateral finite element with idealized nonlinear stress-strain relations for reinforced masonry. The model have been driven by either forces and/or displacements and strain have been used in the constitutive properties. The material models are formulated (Ewing, et al 1990) in terms of element principal strains. The masonry and reinforcement are modeled separately, and their interaction is included by using four node isoparametric plane stress overlay elements and specialized stress-strain relations. In the layered model, two quadrilateral elements occupy the same space, overlaying each other, where one layer represents the masonry and the other represents the reinforcement. Although the material models for masonry and reinforcement are described separately, the element is considered to be smeared hybrid element, where the computed strains are assigned to both materials. The smeared model assumes that the reinforcement is distributed over the whole element and that the two
264 Ghanem

components (reinforcement and masonry) are in full bond at the nodes. The bond slip between the two components is considered to be a material property of the masonry component in tension, and this property is defined by a tension stiffening model. The reinforcement is represented by an orthotropic material with a bilinear stress-strain relationship and includes unloading. The masonry is represented by a material with bimodular orthotropy, and includes tension stiffening, compression softening, and strain softening, as well as a degrading unloading rule. The pre-cracking strength of the masonry under a biaxial state of stress is given and indicates a reduction in compressive strength and stiffness after tensile cracking, as well as a tension stiffening effect. The stress-strain curves were described by two second order polynomial, one for the pre-cracking branch and the other for the post-peak branch. The tension stiffening was described by an exponential function. The masonry model incorporates a tension crack orientation adjustment approach, where the orientation of the final cracks can be different from the initial cracks (a smeared crack rather than a discrete crack approach). The model also includes a compressive strength reduction after tensile cracking normal to the principal compressive strains. The strength reduction is a function of the magnitude of the principal strains that are normal to the principal compressive strains. Moreover, the model includes a compressive strength increase due to lateral compressive confinement when both principal strains are in compression. The strength increase depends on the magnitude of the principal compressive strains that are normal to the principal compressive strains. The above mentioned topics result in the nonlinearity type.
OBJECTIVE
The main objective of this paper is studying the effect of opening location and size on : - Load -Deflection curves - Load carrying capacity - Wall Stiffness - Failure mode
Also examining and evaluating the applicability of calculating wall stiffness using the method suggested by Concrete Masonry Association of California Publication.
SPECIMENS
The shear wall panels considered in this analysis are square panel with side length equal to 3.0 m (36 ft.) with aspect ratio of one. The shear walls are dealt with as cantilever loaded horizontally at the top. A total of 22 shear walls with different opening size and location are chosen for the analysis. Nine cases for windows were taken into consideration with variation in their position with respect to the horizontal and vertical directions. the opening dimensions were 0.3 of the side wall dimensions. the position of the openings were located at top (L T, MT & RT), mid height (LM, MM & RM) and bottom (LB, MB .& RB). For the same location, three different sizes of window openings were chosen as square with side length equal to 004, 0.3 & 0.2 of the side dimension of the wall panel (eight cases). Three cases for door were chosen at left, middle & right (LD, MD & RD). The door is rectangular in shape with height equal to 0.7L and width equal to 0.3L. For comparison purposes, one wall specimen has door and window opening (LD-RM) was considered. Size, shape and location of all openings are presented in Figure 1. In all walls the steel reinforcement ratio were 0.1 % in both vertical and horizontal direction. The material considered in this analysis are concrete block masonry units with uniaxial compressive strength of 150 kg/cm2 (2100 psi), tensile cracking strength of 5 kglcm2 (72 psi), strain at peak strength of 0.0025, masonry modulus of 150000 kg/cm2
(2100000 psi) & poisson's ratio of 0.16 and reinforcement with grade 60 (3600 kglcm2).
265 Ghanem

RESULTS
Load-Deflection Relationships The lateral load - top deflection relationships for all wall panels are shown in Figs. 2 & 3. The shape of the load-deflection curve beyond the ultimate load varies from wall to another depending upon the location and size of openings and their position with respect to the point of load application. As expected the highest stiffness and load capacity was noted for wall W (without openings) and walls RT, MM & L T have the best perfonnance while wall LD-RM is the worst. The existence of the opening near the side of the load application and at the center of the wall gave a better perfonnance than the case where the opening is at the opposite side of the wall. This may be attributed to the fact that the load needs enough width to effectively act on the overall wall height.
Load Carrying Capacity The load carrying capacity of the wall panels tends to increase with the decrease of openings size, but the rate of increase depends upon the opening location. For central openings at top, changing opening size from O.3L to O.2L increases the load carrying capacity by about 45% while decreasing the opening size from OAL to O.2L the increase in load is about 67%. On the other hand, for edge opening at top the load increases by about 18% when opening decrease from O.3L to O.2L but the increase is about 79% for decreasing the opening size from OAL to 0.2L. For edge opening at bottom, the increase in load capacity is about 7% when opening size decreases from 0.3L to 0.2L but the increase is about 54% for decreasing opening from OAL to O.2L. This means that there is no direct relationship between decreasing opening size and increasing load capacity, becomes it depends upon the opening location as indicated in Fig. 3. For the same opening size, the load capacity varies from one wall to another according to the location of the opening with respect to the position of load application. For openings located at top of walls, the load capacity increases by about 38% as the opening moves towards the load. On the other hand for openings at mid height and bottom of the wall, the load capacity increases by about 40% as the opening moves towards the center of the wall. Central openings decrease the load carrying capacity slightly, while edge openings lead to excessive load capacity decrease, especially when the openings are located near the side of the load application point. So, it is convenient to put the opening in the center to accommodate the probability of load in either of the two directions. It can be said that the central opening is the best regardless the direction of the load. In vertical direction for the same opening size as the opening moves towards the bottom, the load carrying capacity decreases. The load carrying capacity of walls having opening door type LD, MD & RD is about 50%,44% & 34% of the load capacity of the solid wall W respectively. It can be noticed that the effect of door opening in reducing the load capacity is significant but the reduction due to location of door opening is not significant as clearly seen in Fig. 2.
Stiffness To show the variation of the initial and final lateral stiffness of shear walls due to existence of openings, the value of lateral load is divided by the corresponding lateral displacement (P/o) for each case and compared with the wall without openings. As shown in Fig. 4 as the opening size increases, the initial and final stiffness decreases depending upon its location with respect to the load application. The highest stiffness is always is registered when the opening at the top and decreases as the opening moves downwards. For small openings (0.2L), the relative initial stiffness of walls MT, LT, LM & LB is 0.88, 0.97, 0.85 & 0.6 respectively. The final stiffness is almost the same for these walls except
266 Ghanem

wall LB for which the reduction in final stiffness is about 55%. For large openings (OAL), the corresponding relative initial stiffness is 0045, 0.55, 0047 & 0.38 respectively and the final stiffness is almost the same for all walls but the reduction in final stiffness for wall LB is about 62% as indicated in Fig. 5. The variations of relative initial and final stiffness across the length of wall are indicated in Figs. 6 & 7. It is also evident from the figures that the highest relative initial and final stiffness are registered when the openings are at top or at the center of the wall. The recorded maximum relative initial stiffness is 0.74 for wall RT, while the maximum relative final stiffness is 0.95 & 0.86 for walls RT & LT respectivelly. The door opening reduces the wall stiffness to 45% for central door and to 34% for wall RD. Wall LD-RM shows a significant drop in stiffness. The presence of a window in addition to door opening, result in reducing the stiffness to 20% of that registered for a solid wall.
Failure Mode In accordance with the crack patterns and the overall shape of the load-deflection curves, two types of behavior modes could be identified from the finite element analysis (major event file and force deflection file). Wall specimens W, LT, MM, LM, RT, MM & RM with a shear mode, show a diagonal cracks in elements at the center of the wall and yielding of the horizontal reinforcement. Wall specimens LD, MD, RD, LD-RM, LB, RB & MB with a flexure response mode, show horizontal cracks in masonry elements in the tension side (indicated by change in wall stiffness in elastic range) followed by yielding of the vertical reinforcement and compression failure in elements in the other side where these elements have a compressive strength greater than the uniaxial strength of masonry. It can be noticed that walls having openings at bottom exhibited a flexure response especially wall LD-RM show a clear flexure failure, while walls having openings at mid height or top exhibited a shear response. The reason for this behavior is that these walls are without a diagonal elements or bond beams which can resist shear stresses developed.
Evaluation of Calculating Stiffness of Perforated Walls Empirically The determination of the stiffness of a wall with openings consisting of several connected piers was suggested in a Concrete Masonry Association of California Publication. In this method the deflection of the solid wall as a cantilever is determined then the cantilever deflection of an interior strip having a height equal to that of the highest .opening is calculated and subtracted from the solid wall deflection. This step thereby removes the entire portion of the wall containing all the openings. Then the deflections of all the piers within that interior strip are determined from their own individual stiffness and added to the modified wall deflection to arrive at the total deflection of the actual wall with openings. The reciprocal of this value becomes the stiffness of !hat wall. By applying this approach to the tested walls for calculating the wall stiffness and comparing these with the results from finite element analysis, it can renoted that for all cases the relative stiffness calculated empirically is overestimating those obtained analytically either for initial or final stiffness as presented in table (1). This method doesn't take into consideration the effect of opening location with respect to the position of the load. The relative stiffness calculated empirically is constant regardless the vertical location of the opening. This method needs enhancement in order to consider the material orthotropy, nonlinearity and position of openings relative to the point of load application. A more thorough evaluation of this method will be considered in the future papers.
267 Ghanem
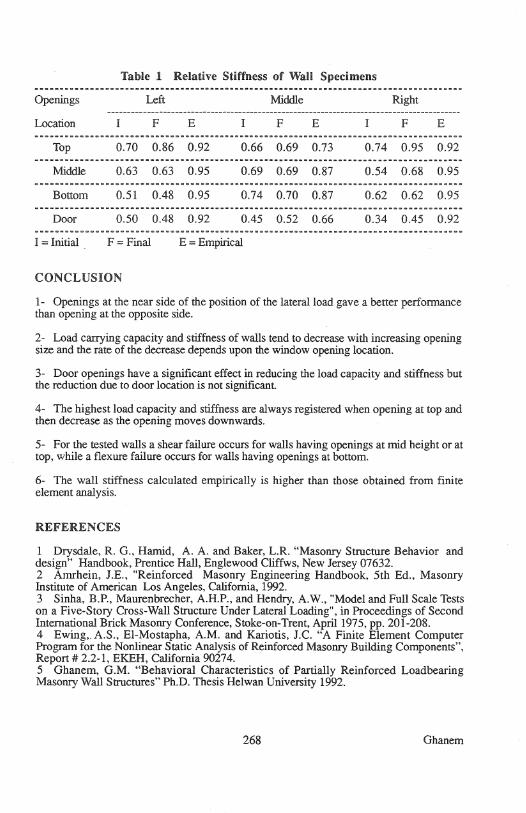
Table 1 Relative Stiffness of Wall Specimens
Openings Left Middle Right
Location F E F E I F E
Top 0.70 0.86 0.92 0.66 0.69 0.73 0.74 0.95 0.92
Middle 0.63 0.63 0.95 0.69 0.69 0.87 0.54 0.68 0.95
Bottom 0.51 0.48 0.95 0.74 0.70 0.87 0.62 0.62 0.95
Door 0.50 0.48 0.92 0.45 0.52 0.66 0.34 0.45 0.92
I = Initial F = Final E = Empirical
CONCLUSION
1- Openings at the near side of the position of the lateral load gave a better performance than opening at the opposite side.
2- Load carrying capacity and stiffness of walls tend to decrease with increasing opening size and the rate of the decrease depends upon the window opening location.
3- Door openings have a significant effect in reducing the load capacity and stiffness but the reduction due to door location is not significant.
4- The highest load capacity and stiffness are always registered when opening at top and then decrease as the opening moves downwards.
5- For the tested walls a shear failure occurs for walls having openings at mid height or at top, while a flexure failure occurs for walls having openings at bottom.
6- The wall stiffness calculated empirically is higher than those obtained from finite element analysis.
REFERENCES
1 Drysdale, R. G., Hamid, A. A. and Baker, L.R. "Masonry Structure Behavior and design" Handbook, Prentice Hall, Englewood Cliffws, New Jersey 07632. 2 Amrhein, J.E., "Reinforced Masonry Engineering Handbook, 5th Ed., Masonry Institute of American Los Angeles, California, 1992. 3 Sinha, B.P., Maurenbrecher, A.H.P., and Hendry, A.W., "Model and Full Scale Tests on a Five-Story Cross-Wall Structure Under Lateral Loading", in Proceedings of Second International Brick Masonry Conference, Stoke-on-Trent, April 1975, pp. 201-208. 4 Ewing,. A.S., EI-Mostapha, A.M. and Kariotis, J.c. "A Finite Element Computer Program for the Nonlinear Static Analysis of Reinforced Masonry Building Components", Report # 2.2-1, EKEH, California 90274. 5 Ghanem, G.M. "Behavioral Characteristics of Partially Reinforced Loadbearing Masonry Wall Structures" Ph.D. Thesis Helwan University 1992.
268 Ghanem

W LD-RM -1 M 0 -1
'" -1
0 t-o
L O.3L OAL 0.3 L , J" .; II It , LD MD RD
-1 r-0
904 L. Q.3 !;
LM MM RM -1
;; -1 M
0
-1 ": 0
0.3 L OAL • O~3 L, - • LT MT RT
LB MB RB
Figure 1 Size, Shape and Location of Openings
269 Ghanem

~ ~ w W LT
~
i Q.. LM
Mf ;g WM :.;: FiT
~~ ",8 AM "N '" " ~ ...
..l "2 e ~ ~ .. "
... ..l~ §
0.0 0.5 1.0 1.5 0.0 0.5 1.0 1.5 Wall Top Deflection (in.) Wall Top Deflection (in.)
Openings at Top Openings at Mid Height
~ ~ w LS
W
MS LD
·e.8 ~ MD RS "-ON ;g~ AD
'" 'C LD·RM
" '" " " ..l ...l ;; ;; ~8 ~8
... __ m_ ... ---"--.. -...l j-
0.0 0.5 1.0 1.5 0.0 0.5 1.0 1.5
Wall Top Deflection (in.) Wall Top Deflection (in.)
Openings at Bottom Door Openings
Figure 2 Effect of Opening Location on Load Deflection Curves
270 Ghanem

~ ~ w W
O.2l O.3l
O.3l O.2L 00 ~
Q. OAL "- OAl ~~ ;gg
'" "" "" .. '" 0 0 ..l ..l
;; ~ .. " :l
§ ~g .. ..l ..l_
eT tr IT 0 0
0.0 0.5 1.0 1.5 0.0 0.5 1.0 1.5
Wall Top Defleclion (in.) Wall Top Deneclion (in.)
~ ~ W
O.2l W
~ O.3l O.2l
'" O.4l O.3l ;g g "i
~ O.4l
'" ~ "" .. 0
" ..l "
~ 0 ..l
~ ;;
..l § !l § .. ...1
IT rr 0
0.0 0.5 1.0 1.5 0.0 0.5 1.0 1.5
Wall Top Deflection (in.) Wall Top Deflection (in.)
Figure 3 Effect of Opening Size on Load Deflection Curves
271 Ghanem

2.0 --- LM .......•...... LT
'" 1.6 '" .. --0- LB = .... ~
---+--- MT CF.i
., 1.2 .~
R = 1.0 c; 0; c;: 0.8
] '= ... 0.4
0.0 0.0 0.2 0.4 0.6
Opening Size I Wall Length
Figure 4 Effect of Opening Size on Initial Stiffness
2.0 ---+--- LM .......•..... LT
'" 1.6 --0- LB '" ... --- MT = .... = ;;; 1.2
'" R = 1.0
.::: c; 0; 0.8 c;:
';j
= ~ 0.4
0.0 0.0 0.2 0.4 0.6
Opening Size I Wall Length
Figure 5 Effect of Opening Size on Final Stiffness
272 Ghanem

p 1.0
~ '" 0.8 " !;
2i:i
'" 0.6 .f:
'" OJ ~ 0.4
~ 0:
0.2 ...
............................................................. " ••• """. ... fJ .. ,,·,," .................................................................. .
- Top ---0--- Middle
- Bottom .. · .... 0·.... Door
0.0 '-------------'------------' 0.0 0.5 1.0
Openin~ Loc~t!on Over Wall Length
Figure 6 Effect of Opening Location on Initial Stiffness
P 1.0 r-------~~-------------..iI_-
'" '" .. ~ 0.8 2i:i
0.6
-; £ 0.4
-.. _---.... _------------------
- Top · ...... 0· .... Middle ---@--- Bottom --a-- Door 0.2 '--_________ --' ____ --'-_____ ..L..I
0.0 0.5 1.0 Opening Location Over Wall Length
Figure 7 Effect of Opening Location on Final Stiffness
273 Ghanem