sell-in versus sell-through revenue recognition: an
TRANSCRIPT

SELL-IN VERSUS SELL-THROUGH REVENUE RECOGNITION:
AN EXAMINATION OF FIRM CHARACTERISTICS AND
FINANCIAL INFORMATION QUALITY
A Dissertation
by
STEPHANIE JEAN BINGER RASMUSSEN
Submitted to the Office of Graduate Studies of Texas A&M University
in partial fulfillment of the requirements for the degree of
DOCTOR OF PHILOSOPHY
August 2009
Major Subject: Accounting

SELL-IN VERSUS SELL-THROUGH REVENUE RECOGNITION:
AN EXAMINATION OF FIRM CHARACTERISTICS AND
FINANCIAL INFORMATION QUALITY
A Dissertation
by
STEPHANIE JEAN BINGER RASMUSSEN
Submitted to the Office of Graduate Studies of Texas A&M University
in partial fulfillment of the requirements for the degree of
DOCTOR OF PHILOSOPHY
Approved by:
Chair of Committee, Anwer S. Ahmed
Committee Members, Dudley L. Poston, Jr. Senyo Y. Tse Connie D. Weaver Head of Department, James J. Benjamin
August 2009
Major Subject: Accounting

iii
ABSTRACT
Sell-in versus Sell-through Revenue Recognition: An Examination of
Firm Characteristics and Financial Information Quality. (August 2009)
Stephanie Jean Binger Rasmussen, B.S., Minnesota State University Moorhead;
M.B.A., The University of Tennessee at Knoxville
Chair of Advisory Committee: Dr. Anwer S. Ahmed
This study examines revenue recognition methods used by high technology firms
for sales to distributors. Revenue is either recognized when products are delivered to
distributors (sell-in) or when distributors resell products to end-users (sell-through).
This is the first empirical study to examine the firms that use these revenue recognition
methods and the quality of financial information reported under the methods.
I use a logistic regression to compare 479 firm-year observations in the computer
and electronic equipment industries that use either the sell-in method or the sell-through
method. I find that firms with higher growth opportunities and strong corporate
governance are less likely to use the sell-in method. In addition, corporate governance
strength moderates the association between use of the sell-in method and both capital
requirements and management incentive compensation.
Using ordinary least squares regression, I also examine two proxies for financial
information quality: the ability of accounting information to predict future cash flows
and the association between accounting information and stock returns. Results of these

iv
regressions suggest that financial information quality is higher under a deferred revenue
recognition method (sell-through). Specifically, the ability of accounting information to
predict future cash flows and the association between accounting information and returns
are both higher for sell-through firms than for sell-in firms.
The results of this study suggest that systematic differences exist between sell-in
firms and sell-through firms and financial information quality differs between the two
revenue recognition methods.

v
DEDICATION
I dedicate this dissertation to my husband and my parents.
To my husband, Jason, who has made significant personal sacrifices over the past
four years so that I could pursue my PhD. Thank you for your constant love and support
throughout the ups and downs of my doctoral studies. I am so grateful that you were
willing to help me follow my dream.
To my parents, Ron and Jean Binger, who have always encouraged and
supported me. Thank you for being incredible parents and role models.

vi
ACKNOWLEDGEMENTS
I thank my dissertation chair, Anwer Ahmed, for his support and encouragement
throughout the dissertation process. I also thank the other members of my dissertation
committee, Senyo Tse, Connie Weaver, and Dudley Poston, for their willingness to
provide insight and feedback. These individuals are all wonderful examples of
researchers and educators. It has been a privilege to learn from them.
I thank James Benjamin and the Department of Accounting at Texas A&M
University for steady financial support throughout my doctoral studies and the
opportunity to attend conferences in order to develop my research interests.
My doctoral studies would not have been nearly as enjoyable without the help
and encouragement of my fellow doctoral students. I thank all of my colleagues for their
insight and assistance with coursework, research, and teaching. I am particularly
indebted to Cory Cassell, Mike Drake, and Jaime Schmidt. I don‘t think we completely
understood what was ahead of us when we started the PhD program together in 2005. I
am thankful not only for the help we provided each other over the years, but also for the
strong friendships we developed along the way.
Finally, I would be remiss not to acknowledge the support and encouragement of
my friends at ON Semiconductor: Wendy Clancy, Bernard Gutmann, and Carl Mangine.
I thank these former colleagues for graciously answering my questions and taking the
time to offer me a refresher on sell-in and sell-through accounting.

vii
TABLE OF CONTENTS
Page
ABSTRACT .............................................................................................................. iii
DEDICATION .......................................................................................................... v
ACKNOWLEDGEMENTS ...................................................................................... vi
TABLE OF CONTENTS .......................................................................................... vii
CHAPTER
I INTRODUCTION ................................................................................ 1 II BACKGROUND AND PRIOR RESEARCH ..................................... 8
Revenue Recognition Practices of High Technology Industries .... 8 Financial Information Quality ........................................................ 10 Prior Research on Revenue Recognition ........................................ 11
III HYPOTHESES DEVELOPMENT ...................................................... 13 Costs and Benefits of the Revenue Recognition Methods ............. 13 Empirical Predictions ..................................................................... 15
Financial Information Quality ........................................................ 20
IV FIRM CHARACTERISTICS AND REVENUE RECOGNITION ..... 22
Research Design ............................................................................. 22 Sample Selection ............................................................................ 26
Descriptive Statistics and Correlations .......................................... 27 Multivariate Analyses .................................................................... 29 Supplemental Analysis ................................................................... 33
V FINANCIAL INFORMATION QUALITY AND REVENUE RECOGNITION .................................................................................... 35
Ability of Accounting Information to Predict Future Cash Flows . 35 Association between Accounting Information and Stock Returns . 39 Supplemental Analyses .................................................................. 43

viii
CHAPTER Page VI CONCLUSION .................................................................................... 45 REFERENCES .......................................................................................................... 47
APPENDIX A ........................................................................................................... 55
APPENDIX B ........................................................................................................... 58
VITA ......................................................................................................................... 70

1
CHAPTER I
INTRODUCTION
This study examines revenue recognition methods used by high technology firms
for sales to distributors. Distributors purchase products from manufacturers and resell
the products to end-users. This activity is common within high technology industries,
and current accounting standards allow firms some discretion on when to recognize
revenue from sales to distributors. Two revenue recognition methods exist: the sell-in
method and the sell-through method. I address two research questions in this study.
First, what firm characteristics are associated with technology firms‘ choice of revenue
recognition method for sales to distributors? Second, does the quality of financial
information differ between the two revenue recognition methods?
Under the sell-in method, firms recognize revenue when the product is delivered
to the distributor (i.e. product is sold into the distribution channel). Under the sell-
through method, firms defer revenue recognition until the distributor resells the product
to an end customer (i.e. product is sold through the distribution channel). Sales to
distributors usually meet the Staff Accounting Bulletin (SAB) No. 104 revenue
recognition requirements that persuasive evidence of an arrangement exists and delivery
has occurred.1 The decision to use the sell-in or sell-through method generally depends
upon the remaining two SAB 104 requirements: the final selling price is fixed or
determinable and collectability is reasonably assured. Sales in high technology
This dissertation follows the style of The Accounting Review. 1 The revenue recognition principles contained in SAB 104 are relatively unchanged from SAB 101 (SEC 1999, 2003). The main purpose of SAB 104 was to rescind accounting guidance within SAB 101 that was superseded by the FASB‘s Emerging Issues Task Force (EITF) 00-21.

2
industries are often subject to rights of return and to pricing adjustments due to price
reductions in the marketplace. A conservative interpretation of SAB 104 suggests that
the final selling price for any distributor sales subject to pricing adjustments or rights of
return are indeterminable. However, interpretive guidance within SAB 104 suggests that
a selling price is determinable if product returns and pricing adjustments can be
reasonably estimated.2 The probability of collection depends on the fixed or
determinable nature of the final selling price and if collections depend on the distributor
reselling the products. Based on these factors, the sell-in method is typically considered
the more aggressive method (Glass, Lewis & Co. 2004; Greenberg 2006). However, the
discretion provided under SAB 104 allows high technology firms enough flexibility to
justify using either revenue recognition method.3
Understanding the characteristics of firms that use different revenue recognition
methods and financial information quality under those methods is important for many
reasons. First, revenue is arguably the most important component of earnings. Revenue
is usually the largest item on the income statement and it is often viewed as a strong
indicator of firm performance (Turner 2001). A former chairman of the SEC argued that
early or premature revenue recognition is a fundamental problem in accounting (Levitt
1998), and misreported revenue is a leading cause of financial restatements (GAO
2 Guidance about fixed and determinable sales prices refers to Statement 48, para. 6 and 8, which state that revenue cannot be recognized if a firm is unable to make a reasonable estimate of product returns (FASB 1981). SAB 104 also directs users to SOP 97-2, para. 26 and 30-33, which states that prices on products sold to distributors are not fixed and determinable if the seller is unable to make reasonable estimates of pricing adjustments (AICPA 1997). 3 The first two disclosure examples in Appendix A suggest that sales arrangements with distributors are essentially identical for the firms identified, yet one firm uses the sell-in method and the other uses the sell-through method.

3
2007).4 Overstated revenue has also been documented as the cause of at least 50 percent
of Accounting and Auditing Enforcement Releases (AAER) (Feroz et al. 1991; Dechow
et al. 1996; Dechow et al. 2007).
Second, evidence on the effects of sell-in and sell-through methods on firm
reporting quality is potentially useful to standard setters. The FASB has undertaken a
joint project with the IASB to create a comprehensive revenue recognition standard
(FASAC 2006). While it is unclear if the comprehensive revenue recognition standard
will allow both the sell-in and sell-through methods, Lynn Turner, former SEC Chief
Accountant, has expressed concerns about the sell-in method (Greenberg 2006):
I have had to deal with the issue of whether you recognize revenue upon sell-in versus sell-through as an audit partner, a CFO and as a regulator, and now as an advisor to institutions. In all of these, I found nothing good about revenue recognition upon sell-in. Sooner or later, the urge to stuff the channel, especially when things are not going well and numbers for the next quarter are short, is very tempting.
The FASB‘s current Statement of Concepts (FASB 1978, para. 37) and a recent
exposure draft of the proposed future conceptual framework (FASB 2008) both argue
that financial reporting should provide information that capital providers and other
parties can use to assess an entity‘s future net cash flows. Although current period cash
flows may be the same under both the sell-in and sell-through methods if distributors
settle accounts receivable prior to product resale, the ability of accounting information to
predict future cash flows may differ between the two methods. It is also unclear whether
4 Cost/expense errors and revenue errors were the leading causes of restatements from January 1997-September 2005. In this period, 27.4 (27.2) percent of restatements were due to cost/expense (revenue) errors (GAO 2007).

4
sell-in or sell-through accounting information is most consistent with firm values.5 To
my knowledge, this is the first study to empirically examine financial information
quality under the sell-in and sell-through methods.
Finally, the evidence presented in this study may be useful for firms in industries
that use the sell-in and sell-through methods for revenue recognition. Insights about the
characteristics of firms that use different revenue recognition methods and the quality of
financial information under the two methods may be helpful to firms that are examining
their own revenue recognition practices and/or considering an accounting method
change.
In order to address my research questions, I study 479 unique firm-year
observations in the computers and electronic equipment industries during 2001-2005. I
classify firms in these industries as sell-in or sell-through based on their 10-K revenue
recognition disclosures.
I first investigate the characteristics of firms that use the sell-in and sell-through
methods. Specifically, I test for associations between use of the sell-in method and
proxies for capital requirements, management incentive compensation, growth
opportunities, and corporate governance strength. I find that use of the sell-in method is
negatively associated with growth opportunities and corporate governance strength. I
also find that as capital requirements and management incentive compensation increases,
5 Prior research does examine the association between stock returns and accounting information under other revenue recognition practices (e.g. Altamuro et al. 2005; Zhang 2005; Srivastava 2008). These studies all examine firms that were required by standard changes to use less aggressive revenue recognition practices. The evidence presented in these studies suggests that the association between accounting information and stock returns was stronger when firms were allowed to accelerate revenue recognition than when they were required to delay it.

5
firms with strong corporate governance are less likely to use the sell-in method than
firms with weak governance. Thus, corporate governance strength moderates the
association between use of the sell-in method and other factors.
Next, I examine whether financial information quality differs between the sell-in
method and the sell-through method. It is not clear that one method is consistently more
reliable than the other method. The sell-in method may suffer from errors in estimating
product return and/or pricing adjustment accruals. Managers may also use the discretion
allowed under this method to enhance performance through channel stuffing or accrual
manipulation6. Meanwhile, reliability concerns exist for sell-through accounting if
distributor inventory and resale data contain errors or are not updated on a timely basis.
It is also unclear if financial statement users perceive differences in relevance between
the two revenue recognition methods. The sell-in method provides timely information
about expected future demand but not current end-user demand. On the other hand, the
sell-through method more accurately reflects end-user demand and is a signal of
conservative accounting practices.
I use two proxies to test for financial information quality differences between the
sell-in and sell-through methods: (1) the ability of accrual accounting information to
predict future cash flows, and (2) the association between accounting information and
contemporaneous stock returns. I find that sell-through firms‘ accrual accounting
information is more highly associated with future cash flows than sell-in firms‘
6 Channel stuffing occurs when (1) manufacturers pull in and ship distributor orders originally scheduled to be delivered in the next accounting period or (2) distributor inventory levels significantly exceed the amount historically needed to service end customers.

6
information. These results are consistent with Forester (2008) who finds that the ability
of accrual accounting information to predict future cash flows is better for firms using
deferred revenue recognition practices. I also find that accounting information reported
under the sell-through method is more strongly associated with contemporaneous stock
returns than accounting information reported under the sell-in method. This suggests
that the sell-through method provides more timely accounting information than the sell-
in method. Taken together, the results of these two tests suggest that the sell-through
method produces higher quality financial information than the sell-in method.
This study contributes to the literature in a number of ways. First, this study
examines revenue recognition practices that have not previously been examined: the
sell-in method, which offers companies the opportunity to accelerate revenue
recognition, and the sell-through method, under which revenues are likely to be
recognized relatively conservatively. Second, this study provides additional evidence
that use of conservative revenue recognition methods is associated with higher growth
opportunities and strong corporate governance (Skinner 1993; Altamuro et al. 2005). In
addition, corporate governance strength moderates the association between revenue
recognition practices and certain firm characteristics. Finally, this study suggests that
financial information quality is higher under a deferred revenue recognition practice.
This result is important because prior research offers mixed evidence regarding financial
information quality under aggressive and delayed revenue recognition methods
(Altamuro et al. 2005; Zhang 2005; Forester 2008). The evidence presented in this study
should be of interest to investors, practitioners, auditors, and regulators.

7
The remainder of this paper is organized as follows. Chapter II discusses
background and prior research while Chapter III develops my hypotheses. Chapter IV
examines the association between firm characteristics and revenue recognition practices.
Chapter V examines financial information quality under the sell-in and sell-through
methods. Chapter VI concludes.

8
CHAPTER II
BACKGROUND AND PRIOR RESEARCH
Revenue Recognition Practices of High Technology Industries
The sell-in and sell-through methods differ with respect to the timing of revenue
recognition for sales to distributors. Under the sell-in method, revenue and cost of goods
sold are recognized upon product delivery to the distributor. Under the sell-through
method, revenue is deferred until notification is received that the distributor has resold
the product. Accounts receivable are typically recorded when the distributor receives the
products, and the distributor often pays for the products before they are resold.
Distributors typically have some limited right of return, but 10-K filings suggests that
most distributors do not have unlimited return privileges on regular purchases.7 I expect
firms‘ revenue recognition method to be relatively sticky over time since a cumulative
effects adjustment would be needed if firms change accounting methods.
If distributor purchases equal distributor resales, sell-in revenue differs from sell-
through revenue by the amount of return and pricing adjustment allowances required
under the sell-in method. However, if distributor purchases exceed resales, then revenue
is higher under the sell-in method than the sell-through method. For example, Apogee
Technology initially reported fiscal 2003 sell-in product revenue of $9.3 million and
later retroactively reported 2003 sell-through product revenue of $7.8 million when it
7 Distribution agreements between manufacturers and distributors typically do include clauses that allow the distributors to return any product on hand if the relationship between the two parties is terminated (e.g. Arrow Electronics 2004 10-K filing; Avnet 2005 10-K filing; Ingram Micro 2005 10-K filing). However, most manufacturers and distributors enter into agreements with the intent of maintaining a long-term relationship.

9
changed accounting methods (Apogee Technology 2004 10-K/A filing).8 The difference
is because distributor purchases were significantly higher than resales. This example
indicates that revenue recognition practices can significantly affect reported operating
performance.
Current U.S. GAAP provides some revenue recognition guidance for product
sales to distributors. As discussed earlier, revenue recognition under SAB 104 requires
(1) persuasive evidence that an arrangement exists, (2) delivery has occurred, (3) final
selling price is fixed or determinable, and (4) collectability is reasonably assured. SAB
104 also notes that product returns estimations, and thus determination of a final selling
price, for sales to distributors may be difficult due to the following factors: channel
stuffing, difficulty in observing distributor inventory and resale data, and the
significance of a distributor to the seller‘s business. 9 Estimates of future pricing
adjustments may also be difficult, and SAB 104 refers financial statement preparers to
SOP 97-2 for guidance on this issue.10
The distributor is considered the customer for revenue recognition purposes but
is not the end-user of the products. Distributors attempt to stock products they can
resell, and they purchase inventory based on existing customer orders and expectations
8 Apogee adopted the sell-through method after an investigation by its audit committee found that the firm‘s use of the sell-in revenue recognition method did not comply with U.S. GAAP. 9 It is important to note that it would also be difficult for a firm to use the sell-through revenue recognition method if distributor resale and inventory data are not easily obtainable. 10 High technology firms offer pricing adjustments to their distributors in order to compensate for price reductions in the marketplace or to incentivize sales of certain products (Lee et al. 2000; CSFB 2004). Since the exact amount of pricing adjustments is often not known until the distributor resells the product, firms use historical resale information to estimate pricing adjustment.

10
about future orders. 11 If actual distributor resales significantly vary from forecasted
orders and speculative beliefs, sell-in revenue will not provide timely information about
future end-user demand.
Accounting for revenue from sales to distributors is important for high
technology firms because these firms depend heavily on distributors to service
customers. An equity research report suggest that distributors service more than 25
percent of global semiconductor/electronic component sales (CSFB 2004), and
manufacturer 10-K filings suggest that 50 percent or more of their sales can go through
distributors (e.g. Fairchild Semiconductor 2004 10-K filing; Cypress Semiconductor
2005 10-K filing). Distributors provide (1) access to an additional ―sales force,‖ (2)
aggregation and service of small orders, and (3) reduced collection risk (CSFB 2004).
Financial Information Quality
The quality of financial accounting information should be of interest to all parties
that create or use financial statements. Earnings quality is often used as an indicator of
overall financial information quality in prior studies (Schipper and Vincent 2003;
Francis et al. 2006). The FASB‘s Conceptual Framework implies that decision
usefulness is the appropriate benchmark to assess the effectiveness and quality of
accounting information (Concepts Statement No. 2, FASB (1980), paras. 30 and 32).
However, financial statement users often define decision usefulness differently.
11 One equity research report suggests that the composition of electronic component distributors‘ inventory
is as follows: 25 percent to support existing customer orders, 50 percent to support expected future customer orders, and 25 percent as speculative inventory to support unanticipated demand (CSFB 2004).

11
Prior studies use accounting-based and market-based measures of earnings
quality (see Francis et al. 2006 for a thorough discussion).12 Accounting-based measures
assume that higher quality earnings allow for better estimation of future cash flows,
earnings, or earnings components. In general, more persistent, more predictive, and less
variable earnings are assumed to be of higher quality (e.g. FASB 1980; Penman and
Zhang 2002; Zhang 2005). Earnings are also assumed to be higher quality when accrual
estimation errors are smaller (e.g. Dechow and Dichev 2002).
Market-based measures assume that higher quality accounting information better
represents firm value and reflects the good and bad news in stock returns in a timely
manner. Studies using returns-earnings regressions view stronger associations as
evidence of more relevant and reliable accounting information, and thus higher earnings
quality (e.g. Barth, Beaver, and Landsman 2001). Other studies measure the timeliness
and conservatism in earnings using earnings-returns regressions and view more timely
and more conservative earnings as being of higher quality (e.g. Basu 1997; Ball et al.
2000).
Prior Research on Revenue Recognition
There is limited research on firms‘ revenue recognition methods and their impact
on financial information quality. Prior research suggests that firms with external
financing needs, financial covenants, or weaker corporate governance are more likely to
accelerate revenue recognition (Bowen et al. 2002; Marquardt and Weidman 2004;
12 Additional ex-post indicators of earnings quality include financial restatements, bankruptcies, litigation, and discontinuities around earnings targets (Degeorge et al. 1999; Anderson and Yohn 2002; Ecker et al. 2006).

12
Altamuro et al. 2005).13 Other studies examine firms that adopted accounting standards
intended to delay revenue recognition (Altamuro et al. 2005; Zhang 2005; Forester 2008;
Srivastava 2008). In general, these studies examine short time periods after standard
changes and find that accelerated revenue recognition results in more timely and relevant
accounting information.14 However, Forester (2008) examines a longer period and finds
that the initial decline in earnings informativeness is due to a temporary disturbance
caused by deferred revenues resulting from SAB 101 adoption. After these deferred
revenues are recognized, Forester (2008) finds that the deferred revenue recognition
method improves earnings informativeness in later periods.
13 Prior research also finds that more than 50 percent of AAERs are due to overstated revenue (Feroz et al. 1991; Dechow et al. 1996; Dechow et al. 2007). Revenue recognition errors are one of the leading causes of restatements from 1997-2006 (GAO 2007) and are associated with more negative stock price reactions and a higher likelihood of litigation than other restatements (Anderson and Yohn 2002; Wu 2003; Palmrose and Scholz 2004). Other research finds that firms manipulate revenue to meet or beat earnings benchmarks (Caylor 2008; Stubben 2006). 14 Zhang (2005) also finds that accelerated revenue recognition results in less reliable revenue for her sample (i.e. larger accounts receivable errors and less reduced revenue predictability).

13
CHAPTER III
HYPOTHESES DEVELOPMENT
The first objective of this study is to investigate characteristics of firms that use
the sell-in and sell-through methods. Based on the fact that both methods are used in
practice and the assumption that SAB 104 generally offers enough discretion for high
technology firms to justify using either method, I expect that firms use the method they
perceive offers the greatest net economic benefit. I use prior accounting research and
anecdotal evidence to identify potential costs and benefits of the sell- and the sell-
through methods. I then offer hypotheses about firm characteristics that I expect to be
associated with use of the revenue recognition methods.
Costs and Benefits of the Revenue Recognition Methods
Several commentators characterize the sell-in method as more aggressive than
the sell-through method (Glass, Lewis & Co. 2004; Greenberg 2006). However, the sell-
in method does offer benefits. Because the sell-in method recognizes revenue upon
delivery to distributors, it provides a more timely reflection of actual business
transactions. Texas Instruments gives this reason for using the sell-in method
(Greenberg 2006). Sell-in revenue recognition also provides information about expected
product demand (i.e. future distributor resales).
Potential costs of using the sell-in method arise from the estimations and
discretion allowed under this method. The requirement to maintain product return and

14
pricing adjustment accruals creates the possibility of unintentional estimation errors. 15
In addition, managers can manipulate performance by channel stuffing and/or adjusting
product return and pricing adjustment allowances. Both of these factors increase the risk
of accounting misstatements (Glass, Lewis & Co. 2004). For example, Symbol
Technologies restated two years of prior financial statements due to a variety of revenue
recognition issues, including selling prices that were later deemed undeterminable
because of pricing adjustments subsequently awarded to distributors (Symbol
Technologies 2002 10-K filing). This company switched to the sell-through method as
part of its financial restatement process.
The benefits of using the sell-through method relate to its conservative nature.
This method more accurately reflects end-user demand and offers no incentive to stuff
the distribution channel.16 Accordingly, firms may use the sell-through method to signal
the quality of their financial information. Levine and Hughes (2005) model a setting
where conservative accounting choices provide positive signals about future cash flows.
Conservative accounting should also reduce the risk of shareholder litigation, which is
typically associated with overstated rather than understated net assets and earnings
(Kellog 1984; St. Pierre and Anderson 1984; Watts 2003).
Obtaining the benefits of the sell-through method does come at a cost. First,
firms using the sell-through method depend on the reliability of distributor resale and
15 Some firms cite estimation difficulties due to frequent price changes and technological obsolescence as reasons for using the sell-through method (e.g. Intel 2007 10-K filing; Micron 2007 10-K filing; Supertex 2007 10-K filing). 16 Increased focus on end-user demand and reduction of distributor inventory were both mentioned by ON Semiconductor and International Rectifier when they announced plans to use the sell-through method (ON Semiconductor press release 4/25/01; International Rectifier conference call 8/4/08).

15
inventory data.17 Chipalkatti et al. (2007) note that it may be difficult to obtain
distributor data, remove data errors, validate the data, and convert data received from
multiple distributors into one consistent format.18 In order to deal with these issues, the
sell-through revenue recognition process requires additional internal controls beyond
those controls used for revenue recognition of non-distributor customer sales. Second,
practitioners have stated that it is difficult to find sell-through accounting resources.
Sell-through firms admit to: (1) advising other firms on sell-through accounting
practices, and (2) using spreadsheets and home grown systems to facilitate sell-through
accounting due to limited off the shelf software products that meet their needs.
Empirical Predictions
The costs and benefits discussion in the previous section leads to a number of
predictions about associations between firm characteristics and use of the sell-in and
sell-through methods. The first characteristic I expect to be associated with the revenue
recognition method used is a firm‘s capital requirements. Firms with existing capital or
need of new capital may use the sell-through method in order to signal a commitment to
more conservative accounting. Prior research finds that lenders benefit from
conservative accounting by receiving more timely signals of default risk, and that
lenders reward borrowers using conservative accounting with lower interest rates (e.g.
Ahmed et al. 2002; Zhang 2008). In addition, firms undergoing an initial public offering
17 Distributor data issues also affect sell-in firms‘ product return and pricing adjustment estimates.
However, all revenue recognition for sell-through firms depends on distributor data. I view problems with distributor data to be a greater risk for sell-through firms than for sell-in firms. 18 Texas Instruments cites its lack of confidence in Asian distributor data as one reason it uses the sell-in method (Greenberg 2006), and a recent KPMG (2006) study indicates that 20 percent of resale reports from channel partners may contain missing data or errors.

16
have been found to report more conservatively than private firms suggesting that
conservative accounting is valued by equity providers (Ball and Shivakumar 2008).
Firms with ample capital may use the sell-through method because they attempted to
obtain the benefits just described when they issued debt or equity in prior periods.
However, firms with existing capital or need of new capital may instead use the
sell-in method because it offers greater opportunity to manipulate financial performance
through accrual manipulation and/or channel stuffing activities. Sweeney (1994) finds
that firms with existing debt implement income increasing accounting changes in order
to avoid debt covenant violations. Other research suggests that firms needing new
capital manage earnings by accelerating revenue recognition prior to issuing debt or
equity (Bowen et al. 2002; Marquardt and Weidman 2004). In both cases, firms attempt
to mislead capital providers by reporting better financial performance than they
otherwise would. Due to the competing evidence with respect to the association
between capital requirements and accounting methods, my first hypothesis is non-
directional:
H1: Use of the sell-in method is systematically related to firms’ capital
requirements.
The second characteristic I expect to be associated with firms‘ revenue
recognition method is the level of incentive compensation available to management.
Prior research on management compensation and accounting practices finds mixed
results. One stream of this research suggests that executives manage earnings in order to
increase current period compensation. Cheng and Warfield (2005) find that as equity

17
incentives increase firms are more likely to meet or beat earnings benchmarks, and
Matsunaga and Park (2001) find that CEO annual cash bonuses are significantly reduced
if firms fail to meet quarterly earnings benchmarks in at least two quarters. Other
research finds strong positive associations between high equity incentives and both
income increasing abnormal accruals (Cheng and Warfield 2005) and the absolute value
of discretionary accruals (Bergstresser and Philippon 2006; Cornett et al. 2008). Other
studies suggest that firms are more likely to experience accounting restatements or fraud
when equity incentives are high (e.g. Burns and Kedia 2006; Efendi et al. 2007).
However, another stream of research finds contrary evidence on the association
between management incentive compensation and accounting practices. Hribar and
Nichols (2007) find that the positive association between equity incentives and absolute
discretionary accruals does not hold after controlling for cash flow volatility. Erickson
et al. (2006) and Armstrong et al. (2008) find no evidence of an association between
equity incentives and accounting fraud or restatements. In fact, Armstrong et al. (2008)
find evidence that accounting fraud is less likely when management‘s equity incentives
are high, suggesting that equity incentives align manager and shareholder interests.
Because it is unclear from prior research if firms with incentive compensation will use
more aggressive or more conservative accounting methods, my second hypothesis is
non-directional:
H2: Use of the sell-in method is systematically related to management incentive
compensation.
The third characteristic I expect to be associated with revenue recognition
practices is firms‘ growth opportunities. Growth opportunities increase uncertainty
18
because growth firms have options to make future investments that are difficult to
observe (Watts and Zimmerman 1986). Watts and Zimmerman (1986) argue that firms
may enter into contracts that restrict managers‘ accounting choices in order to
compensate for uncertainties associated with growth opportunities. In addition to this
expectation, uncertainty in general should result in more conservative accounting to
reduce the likelihood of inappropriate payments to managers and/or shareholders
(Ahmed et al. 2002; Watts 2003). The FASB defines conservatism as ―a prudent
reaction to uncertainty to try to ensure that uncertainty and risks inherent in business
situations are adequately considered‖ (Concepts Statement No. 2, FASB 1980). Based
on the expectation that firms with higher growth opportunities, and thus more
uncertainty, use more conservative accounting methods my third hypothesis is as
follows:
H3: As growth opportunities increase firms are less likely to use the sell-in
method than the sell-through method.
The firm characteristics discussed thus far can be viewed as incentives that that
may be associated with firms‘ accounting methods. However, accounting methods may
also be associated with corporate governance mechanisms put in place to constrain or
monitor managers. Prior research suggests that corporate governance strength is
associated with accounting choices, and that managers are more likely to exercise their
accounting discretion to increase income when corporate governance is weak (e.g.
Becker et al. 1998; Klein 2002; Altamuro et al. 2005; Bowen et al. 2008). Prior research
also suggests that accounting is increasingly conservative as corporate governance
strength increases (Beekes et al. 2004; Ahmed and Duellman 2007; Garcia Lara et al.

19
2009). Since the sell-through method is considered the more conservative approach and
allows for less accounting discretion by management, my fourth hypothesis is as
follows:
H4: Firms with strong corporate governance are less likely to use the sell-in
method than the sell-through method.
While corporate governance strength may directly affect firms‘ accounting
methods as predicted by Hypothesis 4, it is also possible that corporate governance
indirectly affects firms‘ accounting practices. An indirect effect would occur if
corporate governance weakens or strengthens the associations predicted in Hypotheses
1-3. For example, assume that use of the sell-in method is positively associated with
management incentive compensation because managers prefer an accounting method
that allows more opportunities to manage earnings. Strong governance mechanisms‘
demand for conservative accounting may reduce managers‘ willingness to choose more
aggressive accounting practices, thus weakening the association between use of the sell-
in method and management incentives. While many accounting studies examine the
direct effect of corporate governance by simply adding governance proxies to the
empirical model, some recent accounting studies examine the indirect effect of
governance by partitioning samples based on corporate governance strength or by
examining the interaction of governance proxies with other variables of interest (e.g.
DeFond and Hung 2004; Larcker and Richardson 2004; Lee et al. 2008). Although these
studies address different research questions, they typically find evidence that the

20
predicted associations between dependent and independent variables are significantly
affected by corporate governance strength.19
The board of directors, institutional shareholders, and the external auditor all act
as monitors over management (Fama and Jensen 1983; Shleifer and Vishny 1986;
Beasley and Salterio 2001). I expect that the monitoring strength of these parties will
impact the association between incentives and accounting methods used by managers.
Under strong monitoring, the accounting methods used will likely be influenced by both
management incentives and demands of the corporate governance mechanisms. Thus, I
expect that corporate governance strength will affect the associations examined in the
first three hypotheses. Because Hypothesis 4 predicts that strong governance
mechanisms will demand conservative accounting and less accounting discretion, my
fifth hypothesis is as follows:
H5: Firms with capital requirements, management incentives, and growth
opportunities are less likely to use the sell-in method when corporate governance
is strong than when corporate governance is weak.
Financial Information Quality
The costs and benefits of the sell-in and sell-through methods discussed earlier
suggest that relevance and reliability of information produced under the two methods
may differ. Both methods can suffer from unintended reductions in reliability. Under
the sell-in method, managers may misestimate product return and/or pricing adjustment
accruals. Under the sell-through method, revenues may be less reliable if: (1)
19 For example, DeFond and Hung (2004) find that the association between poor firm performance and likelihood of CEO turnover is stronger when strong country-level corporate governance mechanisms exist. This finding suggests that corporate governance plays an important role in the identification and removal of poorly performing CEOs.

21
distributor inventory and resale data contain errors that are not detected by management,
(2) distributor inventory and resale data are not updated on a timely basis, or (3) proper
internal controls do not exist for this revenue recognition process. The sell-in method
may also yield unreliable revenue estimates if managers use their discretion to enhance
performance through channel stuffing or accrual manipulation.
Financial statement users may perceive relevance differences between the two
methods. The sell-in method provides timely information about expected future demand
but not current end-user demand. On the other hand, the sell-through method reflects
end-user demand and is a signal of conservative accounting practices. Due to potential
relevance and reliability differences between the sell-in and sell-through methods, it is
an empirical question if financial information quality differs between the two methods.
My final hypothesis is non-directional:
H6: Financial information quality differs between the sell-in and sell-through
revenue recognition methods.

22
CHAPTER IV
FIRM CHARACTERISTICS AND REVENUE RECOGNITION
Research Design
U.S. GAAP requires that firms disclose their revenue recognition policies (APB
1972; SEC 1999, 2003). Each year I classify firms as using the sell-in or sell-through
revenue recognition method for sales to distributors based on their 10-K revenue
recognition disclosures. Sell-In is a dichotomous variable equal to one if the firm uses
only the sell-in method to recognize revenue for distributor sales and equal to zero if the
firm uses the sell-through method to recognize revenue for all sales to one or more
distributors. 20 Because this definition of Sell-In classifies firms using both the sell-in
and sell-through methods as sell-through firms, it should bias against finding results in
all my empirical tests. Appendix A contains examples of revenue recognition
disclosures and classification of the method as either sell-in or sell-through.
I use the following logistic regression model to test Hypotheses 1-4 which
predict the characteristics of firms that use the sell-in method21:
Sell-Init = α0 + α1 Levit + α2 IntCoverit + α3 RaisedCapitalit + α4 Bonusit + α5 EquityIncentit + α6 R&Dit + α7 MTBit + α8 Govit + α9 LnAssetit + α10 ROAit + α11 Retvolit + α12 Ageit + α13 Compit + ε (1)
where
20 Firms may use the sell-in method as their primary method for revenue recognition but use the sell-through method in order to recognize revenue for new products that have little or no sales history. SAB 104 would require the sell-through method for new product sales because no historical information is available to estimate product returns and pricing adjustments for these new products (SEC 2003). I classify firms in this situation as sell-in firms because the revenue recognition method used is related to the product sold and not the customer. 21 The sample used to estimate Model 1 includes multiple annual observations per firm. Since I expect revenue recognition method usage to be relatively sticky over time, I also estimate Model 1 with only one observation per firm. Results of this supplemental test are discussed at the end of this section.

23
Sell-In = an indicator variable equal to 1 if the firm uses the sell-in revenue
recognition method for sales to distributors, and otherwise 0; Lev = long-term debt scaled by fiscal year-end total assets; IntCover = interest expense scaled by operating income before depreciation; RaisedCapital = an indicator variable equal to 1 if the firm issued new debt and equity
greater than 20 percent of average annual assets during the current fiscal year, and otherwise 0;
Bonus = the CEO‘s annual bonus compensation scaled by the sum of the CEO‘s
annual salary and bonus, averaged over years t-2 through t; EquityIncent = the percentage of a CEO‘s total compensation that would result from a
one percent increase in stock price, averaged over years t-2 through t; R&D = R&D expenses scaled by fiscal year-end total assets; MTB = the market value of equity divided by the book value of equity at fiscal-
year end; Gov = an indicator variable equal to 1 if the firm is classified as having strong
corporate governance, and otherwise 0; LnAsset = the natural log of fiscal year-end total assets; ROA = net income scaled by average total assets; Retvol = the standard deviation of daily stock returns over the prior fiscal-year
(minimum of 100 daily observations for each firm-year to calculate the daily stock return);
Age = the number of years since the firm was first listed in CRSP; and Comp = an indicator variable equal to 1 if the firm‘s primary industry is
computers, and otherwise 0.
Hypothesis 1 predicts that an association exists between capital requirements and
use of the sell-in method. I use ―capital requirement‖ to encompass the ability to
maintain existing capital as well as obtain additional capital. Lev proxies for the firm‘s

24
debt level which has been found to be significantly associated with accounting choice
across a variety of studies (Christie 1990; Fields et al. 2001). IntCover proxies for the
risk of debt covenant violation because Dichev and Skinner (2002) find that the interest
coverage ratio is one of the most commonly used accounting measures in debt
agreements. RaisedCapital proxies for the firm‘s need to raise new equity and/or debt,
and prior research suggests that firms requiring new external financing accelerate
revenue recognition (Bowen et al. 2002; Marquardt and Weidman 2004). Positive
(negative) and significant coefficients on Lev, IntCover, and RaisedCapital would
suggest that firms are more (less) likely to use the sell-in method as capital requirements
increase.
Hypothesis 2 predicts that an association exists between management incentive
compensation and use of the sell-in method. Bonus captures the CEO‘s non-salary cash
compensation while EquityIncent captures potential equity related incentive
compensation for the CEO. I include proxies for both types of compensation since prior
research finds that associations often differ between accounting methods used by firms
and the two types of incentive compensation (e.g. Aboody et al. 2000; Aboody et al.
2004; Efendi et al. 2007). Average values of the measures over the past three years are
used instead of current year values in an attempt to capture the persistence of executive
compensation over time. Positive (negative) and significant coefficients on Bonus and
EquityIncent suggest that firms are more (less) likely to use the sell-in method as
management incentive compensation increases.

25
Hypothesis 3 predicts that use of the sell-in method is less likely as growth
opportunities increase. R&D and MTB proxy for growth opportunities. Intuitively,
R&D expenditures likely lead to growth opportunities (Ahmed 1994). MTB is also
likely to capture growth opportunities (Lindenberg and Ross 1981). However, a
limitation of MTB is that it also proxies for economic rents earned on assets-in-place
(Lindenberg and Ross 1981; Ahmed 1994; Roychowdhury and Watts 2007). I expect
negative and significant coefficients for both R&D and MTB.
Hypothesis 4 predicts that use of the sell-in method is less likely when corporate
governance is strong. Gov proxies for corporate governance strength and is defined
based on board size and independence, institutional ownership, and industry specialist
auditor usage. Stronger governance, or oversight, is suggested by smaller boards (Lipton
and Lorsch 1992; Jensen 1993), higher board independence (Beasley 1996; Klein 2002),
higher institutional ownership (Shleifer and Vishny 1986), and use of an industry
specialist auditor (Owhoso et al. 2002; Balsam et al. 2003). A detailed definition of Gov
is available in Table 1. I expect a negative association between Gov and Sell-In.
The remaining variables in Model 1 control for other firm characteristics that
may be associated with firms‘ revenue recognition methods. I control for firm size
(LnAsset), profitability (ROA), business uncertainty (Retvol), age (Age), and industry
(Comp). 22 Table 1 provides detailed definitions of all variables included in Model 1.
22 Ideally, I would also like to control for how much of the firms‘ revenue comes from distributor
customers (i.e. the importance of the distributor to the seller‘s business). I attempted to hand collect this
information at the same time I reviewed 10-K filings in order to classify firms as using the sell-in method or the sell-through method. Some firms report the percentage of annual revenue attributable to all distributors or some set of top distributors (i.e. top 2 or top 3) either in aggregate or separately by distributor. Other firms do not provide any information about the percentage of revenue attributable to

26
Hypothesis 5 predicts that firms with capital requirements, incentive
compensation, and growth opportunities are less likely to use the sell-in method when
corporate governance is strong than when it is weak. I use the following logistic
regression model to test this hypothesis:
Sell-Init = α0 + α1 Levit + α2 Lev×Govit + α3 IntCoverit + α4 IntCoverit×Govit + α5 RaisedCapitalit + α6 RaisedCapitalit×Govit + α7 Bonusit + α8 Bonusit×Govit + α9 EquityIncentit + α10 EquityIncentit×Govit + α11 R&Dit + α12 R&Dit×Govit + α13 MTBit + α14 MTBit×Govit + α15 Govit + α16 LnAssetit + α17 ROAit + α18 Retvolit + α19 Ageit + α20 Compit + ε (2)
Under Hypothesis 5, I expect negative and significant coefficients for each of the
interaction terms between Gov and other variables of interest.
Sample Selection
Table 2 presents the steps utilized to obtain a sample of firms. I first obtain all
firm-year observations from the Compustat Annual database for 2001-2005 in the
computer and electronic equipment industries. I choose this time period because SAB
101 or SAB 104 was in effect for the entire period. SAB 101 offered additional
guidance on revenue recognition disclosures, and revenue recognition disclosures may
have been less reliable prior to the issuance of this guidance. I select the computer and
electronic equipment industries because these industries use sell-in and sell-through
accounting (Glass, Lewis & Co. 2004; Greenberg 2006; Chipalkatti et al. 2007).23 After
these restrictions, 4,515 firm-year observations remain.
distributor customers. Due to the variation in reporting methods and the fact that many firms choose not to disclose information about the percentage of revenue attributable to distributor customers, I was not able to obtain a measure of revenue from distributors to include in Model 1. 23 I follow Fama and French‘s (1997) industry classifications, as updated on Kenneth French‘s website to
reflect 49 industries, such that computers includes SIC 3570-3579, 3680-3689, and 3695; electronic

27
I exclude observations missing data required for the firm characteristic and
revenue recognition method model (Model 1). Specifically, I delete observations
missing necessary Compustat data (1,470 observations), ExecuComp data (2,341
observations), RiskMetrics (formerly IRRC) data (141 observations), and CRSP data (1
observations). These restrictions result in a sample of 562 firm-year observations. I
hand collect revenue recognition disclosures for these firms. I exclude 83 firm-year
observations because either the firm does not sell products to distributors or an annual
10-K filing was unavailable. The final sample consists of 479 firm-year observations for
119 unique firms.24
Descriptive Statistics and Correlations
Panel A of Table 3 presents descriptive statistics for firm characteristic and
revenue recognition method variables. The sell-in method is used by 66 percent of the
firm-year observations while the sell-through method is used by 34 percent of the firm-
year observations. Nine of the 119 unique firms switched methods during the years they
appear in my sample. In all but one case, the firms switched from the sell-in method to
the sell-through method. All remaining variables are winsorized at the top and bottom
one percent except IntCover, natural logs, and indicator variables. IntCover is capped at equipment includes SIC 3622, 3661-3666, 3669, 3670-3679, 3810, and 3812 (http://mba.tuck.dartmouth.edu/pages/faculty/ken.french/). The definition of computer industry used in this study excludes software firms. This choice is made because the revenue recognition decisions made by software firms are often not easily comparable to the revenue recognition decisions of other firms in this study due to the multiple-element arrangements inherent in many software sales. 24 In addition to the computer and electronic equipment industries, Glass, Lewis and Co. (2004) also suggest that the sell-in and sell-through methods are used by pharmaceutical companies. However, they indicate that nearly all of the pharmaceutical firms they examine use the sell-in method. I hand collected revenue recognition disclosures for 195 pharmaceutical firm-year observations during the sample period and found that 97 percent of these observations used the sell-in method. Due to the small amount of variation in revenue recognition method use among these firms, I exclude the pharmaceutical industry from all analyses reported in this study.

28
2.0, and the ratio is set to 2.0 for all observations with negative operating income before
depreciation. Based on mean and median tests, the univariate statistics indicate that sell-
in firms are significantly older, have higher leverage, and are more likely to have issued
new debt or equity in the past year than sell-through firms. However, sell-in firms have
significantly lower R&D expenditures, lower stock return volatility (Retvol), and lower
CEO equity incentives than sell-through firms. Thirty-six percent of the sample firms
are classified as having strong corporate governance, and sell-in and sell-through firms
do not significantly differ with respect to governance strength.
Panel B presents descriptive statistics by industry. Use of the sell-in method
significantly differs between the two industries: 81 percent of computer firms and 62
percent of electronic equipment firms use the sell-in method. Sell-in usage differences
between the computer and electronic equipment industries may be due to differences in
the importance of distributors for these industries. As noted in footnote 25, the amount
of manufacturer revenue attributable to distributor customers is not reported by all
manufacturers. However, for sample firms that did report this information, a firm‘s top
distributor accounts for 12 percent and 26 percent of total revenue, on average, for firms
in the computer and electronic equipment industries respectively. This suggests that use
of the sell-in method may be more likely in industries with fewer sales through
distributors.25 Other than use of the sell-in method, the computer and electronics firms
25 Commentators suggest that use of the sell-in method decreased in the computer and electronic equipment industries over the past decade, but this trend has not occurred in the pharmaceutical industry (Glass, Lewis and Co. 2004; Greenberg 2006). Use of the sell-in method appears to be an accepted practice in the pharmaceutical industry.
29
are relatively similar and only significantly differ with respect to size and CEO equity
incentives.
Panel C of Table 3 presents correlations for the firm characteristic and revenue
recognition method variables. These univariate statistics support many of the inferences
suggested by the mean and median statistics. The correlations suggest that use of the
sell-in method is more likely for older firms and firms with higher leverage, but less
likely as business uncertainty (Retvol), R&D expenditures, equity incentives, and MTB
increase. All variance inflation factors are below 3.0, suggesting that multicollinearity
will not pose a problem in the multivariate analyses.
Multivariate Analyses
Table 4 presents results for the models that examine firm characteristics and
revenue recognition methods. Since the sample used for these analyses contains
multiple observations for each firm, Z-statistics are calculated using Rogers‘ (1993)
standard errors clustered by firm to correct for correlated firm-level errors. Using the
sample average of 66 percent as the probability that a firm will use the sell-in method,
Model 1 classifies 73 percent of all observations correctly, 73 percent of known sell-in
observations correctly, and 75 percent of known sell-through observations correctly.
The area under the receiver operating characteristic (ROC) curve is 80 percent,
suggesting that the model has excellent predictive power (Hosmer and Lemeshow
2000).26
26 The area under the ROC curve measures the probability that a randomly selected sell-in firm would have a higher fitted value from the model than a randomly selected sell-through firm.

30
Model 1 examines Hypotheses 1-4. Hypothesis 1 predicts an association
between Sell-In and firm capital requirements. The results for Model 1 indicate that the
Lev, IntCover, and RaisedCapital coefficients are all insignificantly different from zero.
These results suggest that use of the sell-in method is not influenced by firms‘ capital
requirements.27 Hypothesis 2 predicts an association between Sell-In and management
incentive compensation. Both Bonus and EquityIncent are insignificantly different from
zero.28 These results suggest use of the sell-in method is not sensitive to bonus and
equity incentives. Hypothesis 3 predicts a negative association between Sell-In and
growth opportunities. R&D is negatively and significantly associated with Sell-In (p <
0.01), but the MTB coefficient is insignificantly different from zero.29 The insignificant
MTB coefficient is not surprising since MTB is not a clean proxy for growth
opportunities, as discussed in earlier in this section. These results provide some
evidence that use of the sell-in method is less likely for firms with high growth
opportunities.
Hypothesis 4 predicts that use of the sell-in method is less likely when corporate
governance is strong. The negative and significant Gov coefficient supports this
prediction (p = 0.01). With respect to the control variables, Age and Comp are both
positively and significantly associated with Sell-In (p = 0.03 for both coefficients). The
27 In an untabulated test, I estimated Model 1 separately by industry. None of the capital requirement proxies are significant for the electronic equipment industry. However, the Lev coefficient is positive and significant (p = 0.04) and the RaisedCapital coefficient is negative and significant (p = 0.07) for the computer industry. 28 Results are unchanged if current year Bonus and EquityIncent measures are used instead of three year averages. Excluding the industry indicator variable or all control variables from Model 1 does result in a negative and significant EquityIncent coefficient (p = 0.05 and p = 0.01, respectively). 29 When Model 1 is estimated separately by industry, the R&D coefficient is negative and significant for the electronic equipment industry.

31
Age coefficient suggests that older firms may use the sell-in method because they likely
have a more reliable sales history which they can use to estimate product returns and
pricing adjustments. In summary, the results obtained from estimating Model 1 provide
support for Hypotheses 3 and 4 only.
Model 2 examines Hypothesis 5 and also re-examines Hypotheses 1-4.
Hypothesis 5 predicts that firms with capital requirements, management incentives, and
growth opportunities are less likely to use the sell-in method when corporate governance
is strong than when corporate governance is weak. Model 2 classifies 75 percent of all
observations correctly, 75 percent of known sell-in observations correctly, and 73
percent of known sell-through observations correctly. The area under the ROC curve is
82 percent.
In terms of the capital requirement proxies, RaisedCapital is positively and
significantly associated with Sell-In (p = 0.07), and RaisedCapital×Gov is negatively
and significantly associated with Sell-In (p = 0.04). These results indicate that firms with
weak governance that raised new capital are more likely to use the sell-in method than
the sell-through method. However, when corporate governance is strong, firms raising
new capital are significantly less likely to use the sell-in method than firms with weak
governance, and financing is not associated with the revenue recognition method for
strong governance firms (RaisedCapital + RaisedCapital×Gov). These results support
Hypotheses 1 and 5.
In terms of the management incentive proxies, Bonus×Gov and
EquityIncent×Gov are both negatively and significantly associated with Sell-In (p =0.02

32
and p = 0.01, respectively). The main effect of the Bonus and EquityIncent coefficients
for firms with strong governance (Bonus + BonusGov and EquityIncent +
EquityIncentGov) are also negative and significant (p = 0.03 and p = 0.01,
respectively). These results indicate that use of the sell-in method is sensitive to the
amount of cash and equity based management incentive compensation, but only when
corporate governance is strong. These results support Hypotheses 2 and 5.
Interactions between Gov and growth opportunity proxies are insignificantly
different from zero, yet the main effect of R&D remains negative and significant (p <
0.01). This result supports Hypothesis 3 and indicates that as R&D expenditures
increase firms are less likely to use the sell-in method regardless of corporate
governance strength. After interacting Gov with the capital requirement, management
incentive, and growth opportunity proxies, the main effect of governance is
insignificantly different from zero.30
In summary, the evidence presented in Table 4 provides some support for
Hypothesis 1-5. Firms that raise new capital are more likely to use the sell-in method than
the sell-through method when corporate governance is weak. However, strong corporate
governance reduces the association between Sell-In and the proxy for new capital. Use
of the sell-in method is less likely as bonus and equity incentives increase, but only for
firms with strong corporate governance. Finally, use of the sell-in method is less likely
30 Inferences with respect to all interactions in Model 2 are unchanged if the industry indicator variable or all other control variables are excluded from the model. I also substitute revenue volatility (based on the prior 12 quarters) for stock return volatility, and inferences related to the variables of interest and interactions are unchanged. In this specification, the revenue volatility coefficient is positive and significant (p = 0.06).

33
as R&D expenditures increase and for firms with strong corporate governance.
Although prior research examines the association between revenue recognition methods
and corporate governance (Bowen et al. 2002; Altamuro et al. 2005), I show that strong
governance is not simply additive. In this study, the associations between revenue
recognition methods and firm characteristics differ based on corporate governance
strength.31
Supplemental Analysis
As mentioned previously, only 9 of 119 sample firms changed their revenue
recognition method during the years they are included in the analyses. This indicates
that the revenue recognition choice is sticky over time for my sample firms. As an
alternative test, I re-estimate Model 2 with only one observation per firm. Untabulated
results are consistent using either the first or last year that each firm appears in the
sample. Use of the sell-in method is significantly less likely as cash bonus compensation
(Bonus) and R&D expenditures increase, regardless of corporate governance strength.
Use of the sell-in method is less likely as equity incentives (EquityIncent) increase, but
only when corporate governance is strong. Finally, Age remains positively and
significantly associated with Sell-In. None of the capital requirement proxies and their
31 Because the definition of Sell-In classifies firms that use the sell-through method exclusively as well as firms that use both sell-in and sell-through methods as sell-through firms, I also estimate a multinomial logit model which differentiates between exclusive use of sell-in, exclusive use of sell-through, and combined use of both methods. Only 40 of the 479 observations exclusively use the sell-through method, which results in low power for comparisons of these observations to the other categories of revenue recognition methods used. However, inferences gleaned from the analysis contrasting firms exclusively using the sell-in method to those firms that use both sell-in and sell-through are largely consistent with the results tabulated in Table 4.

34
interactions with Gov are significantly associated with Sell-In when only one observation
per firm is used to estimate the model.

35
CHAPTER V
FINANCIAL INFORMATION QUALITY AND REVENUE RECOGNITION
Ability of Accounting Information to Predict Future Cash Flows
Research Design
Hypothesis 6 predicts that the quality of financial information differs between the
sell-in and sell-through methods. The first construct of financial information quality that
I examine is the ability of accrual accounting information to predict future cash flows.
Statement of Financial Accounting Concepts No. 1 posits that ―financial reporting
should provide information to help investors, creditors, and others assess the amounts,
timing, and uncertainty of prospective net cash inflows to the related enterprise‖ (FASB
1978, para. 37). If distributors settle accounts receivable shortly after they receive
inventory, current period cash flows would be the same under the sell-in and sell-
through methods. However, it is unclear if the ability to predict future cash flows differs
between the two methods.
Accounting studies often examine the ability of current period earnings to predict
future cash flows (e.g. Dechow et al. 1998; Barth, Cram, and Nelson 2001; Altamuro et
al. 2005). Prior research implies the following cash flow and earnings models for my
study:
OCFi,t+1 = α0 + α1 Sell-Init + α2 Earningsit + α3 Sell-InitEarningstt + ε (3)
OCFi,t+1 = α0 + α1 Sell-Init + α2 Earningsit + α3 Sell-InitEarningstt + ε (4)
where

36
OCF = quarterly cash flow from operations scaled by total assets; Earnings = quarterly earnings scaled by total assets; OCF = change in quarterly cash flow from operations from the same quarter of
the preceding fiscal year, scaled by total assets, and; Earnings = change in quarterly earnings from the same quarter of the preceding
fiscal year, scaled by total assets. Sell-In is as previously defined.32
Model 3 examines the association between earnings levels and future cash flows levels.
Model 4 controls for seasonal effects on earnings and cash flows by examining the
association between unexpected earnings (i.e. seasonal change) and unexpected future
cash flows.
Because the timing of revenue recognition for sales to distributors differs
between the sell-in and sell-through methods, the accounts primarily affected by these
methods are revenue and cost of goods sold. Gross margin is the first subtotal on the
income statement that captures this information. Although earnings also captures
revenue and cost of goods sold information, many other line items impact earnings that
are not affected by the revenue recognition method used. Decomposing earnings into
gross margin and other expenses allows me to examine how use of the sell-in method
affects the association between gross margin and future cash flows.33
Because the high technology industries included in this study are likely to
experience seasonality in earnings, I examine Hypothesis 6 with a model similar to 32 Because a firm‘s choice to use either the sell-in or sell-through is endogeneity, I conduct supplemental tests at the end of this section to correct for potential endogeneity in all financial information quality tests. 33 Although other line items below gross margin will be affected by use of the sell-in or sell-through method, such as income taxes and management compensation, the vast majority of the impact from the revenue recognition method should occur in gross margin.

37
Model 4, after decomposing earnings into gross margin and other expenses. I use the
following model to determine if the ability of accrual accounting information to predict
future cash flows differs between sell-in and sell-through firms, controlling for fixed
firm and time effects:
OCFi,t+1 = α0 + α1 Sell-Init + α2 GrossMarginit + α3 OtherExpit
+ α4 Sell-InitGrossMargintt + α5 Sell-InitOtherExptt + ε (5)
where
ΔGrossMargin = change in quarterly gross margin from the same quarter of the preceding fiscal year, scaled by total assets, and;
ΔOtherExp = change in quarterly other expenses (gross margin minus earnings)
from the same quarter of the preceding fiscal year, scaled by total assets. The main variable of interest in Model 5 is Sell-InΔGrossMargin, which is used to test
Hypothesis 6. A positive (negative) and significant coefficient on Sell-
InΔGrossMargin indicates that use of the sell-in method increases (decreases) the
ability of unexpected gross margin to predict unexpected future cash flows compared to
the sell-through method. Stated differently, a positive (negative) and significant
coefficient on Sell-InΔGrossMargin suggests that use of the sell-in method increases
(decreases) financial information quality.
Multivariate Analysis
Estimation results for the regression of seasonal changes in cash flows during
quarter t+1 on seasonal changes in gross margin and other operating expenses during
quarter t are presented in Table 5. The sample consists of quarterly data for firm-year
observations included in the analysis of firm characteristics and revenue recognition

38
practices. ΔGrossMargin is positively and significantly associated with the seasonal
change in future cash flows (p < 0.01) and ΔOtherExp is negatively and significantly
associated with the seasonal change in future cash flows (p < 0.01). The main variable
of interest, Sell-In×ΔGrossMargin, is negatively and significantly associated with
ΔOCFt+1 (p < 0.01). This result suggests that the ability of unexpected gross margin
information to predict unexpected future cash flows is significantly lower for sell-in
firms than for sell-through firms.34 This finding supports Hypothesis 6, which predicts
that financial information quality differs between the sell-in and sell-through methods.
The inferences drawn from Table 5 are consistent with Forester‘s (2008) finding
that accrual accounting information better predicts future cash flows for firms that defer
revenue recognition. Forester (2008) initially examines cash flow predictability
immediately following a revenue recognition policy change. Consistent with Altamuro
et al. (2005) he finds a decline in the ability of accounting information to predict future
cash flows under a deferred revenue recognition method. However, Forester (2008)
finds that this initial decline in predictability is later reversed. Since I do not identify
when firms begin using the sell-in or sell-through method and very few of my sample
firms change their revenue recognition method during the sample years, my analysis is
more like the subsequent periods studied by Forester (2008) than the initial reaction
studied by Altamuro et al. (2005).
34 Inference are unchanged if average total assets is used as the scalar for all accounting variables in Model 5. As a sensitivity test, I also use a levels specification of Model 5, where the dependent variable is one, two, three, or four-quarter ahead cumulative cash flows. The interaction between Sell-In and GrossMargin is negative and significant with a one-tailed test when the dependent variable is four-quarter ahead cumulative cash flows. Lack of significant results for the other quarters is likely due to the fact that this specification does not control for the impact of seasonal differences on operating performance.

39
Association between Accounting Information and Stock Returns
Research Design
The second construct of financial information quality that I examine relates to the
association between accounting information and stock returns. Since stock prices reflect
economic events more promptly than accounting information, accounting information is
considered more timely if it is more strongly associated with contemporaneous stock
returns (Ball et al. 2000; Francis et al. 2006). It is unclear how the market responds to
sell-in and sell-through accounting news and which method produces more ―timely‖
information.
I use the following regression model to study the timeliness of accounting
information under the sell-in and sell-through methods, controlling for fixed firm and
time effects.
GrossMarginit/MVEi,t-1 = α0 + α1 AdjRetit + α2 Sell-Init + α3 Negit + α4 Betait
+ α5 MTBit + α6 Sizeit + α7 Persistit
+ α8 AdjRetit×Sell-Init + α9 AdjRetit×Negit
+ α10 AdjRetit×Betait + α11 AdjRetit×MTBit
+ α12 AdjRetit×Sizeit + α13 AdjRetit×Persistit + ε (6)
where
GrossMargin/MVE = quarterly gross margin, scaled by market value of equity at the beginning of the quarter;
AdjRet = cumulative stock returns beginning 2 days after the prior quarter‘s
earnings announcement and ending one day after the current quarter‘s earnings announcement, adjusted by the value weighted
market index in CRSP; Neg = an indicator variable equal to 1 if AdjRet is less than 0, and
otherwise 0.

40
Beta = an indicator variable equal to 1 if the firm‘s systematic risk is
greater than the sample median for the quarter; and otherwise 0; MTB = an indicator variable equal to 1 if the market-to-book ratio is
greater than the sample median for the quarter, and otherwise 0; Size = an indicator variable equal to 1 if the firm‘s natural log of assets at
the beginning of the quarter is greater than the sample median for the quarter, and otherwise 0; and
Persist = an indicator variable equal to 1 if gross margin persistence is
greater than the sample median for the quarter, and otherwise 0. Sell-In is as previously defined. Model 6 is similar to the model Zhang (2005) uses to examine the timeliness of
accounting information around a revenue recognition standard change for software
firms. Zhang (2005) uses revenue as her dependent variable but I use gross margin
because both revenue and cost of goods sold are affected by the sell-in and sell-through
methods.
I include five controls for factors expected to affect the association between
accounting information and stock returns (Collins and Kothari 1989; Basu 1997). Neg
proxies for a bad news signal reflected in stock returns. Beta proxies for the firm‘s
systematic risk. MTB proxies for growth opportunities. Persist proxies for the
persistence of gross margin based on a seasonal ARIMA model. Finally, I control for
firm size (Size). Each of these proxies is included in Model 6 and interacted with the
market-adjusted stock returns for the quarter (AdjRet). Detailed definitions of all
variables contained in Model 6 are included in Table 1.
The main variable of interest in Model 6 is AdjRetSell-In, which tests
Hypothesis 6. A positive (negative) and significant coefficient on AdjRetSell-In

41
indicates that use of the sell-in method increases (decreases) the timeliness of accounting
information compared to the sell-through method. Thus, a positive (negative) and
significant coefficient on AdjRetSell-In suggests that use of the sell-in method increases
(decreases) the quality of financial information.
Multivariate Analysis
Estimation results for the regression of gross margin on market-adjusted stock
returns and control variables are presented in Table 6. The sample consists of quarterly
data for firm-year observations included in the analysis of firm characteristics and
revenue recognition practices.
The AdjRet coefficient is positive and significant (p < 0.01). In terms of the control
variables, MTB, Persist, AdjRet×MTB, and AdjRet×Persist are all negatively and
significantly associated with gross margin. The main variable of interest, AdjRet×Sell-
In, is negatively and significantly associated with gross margin (p = 0.03). 35 This result
supports Hypothesis 6 and suggests that gross margin information reported under the
sell-in method is actually less timely, or does a poorer job of reflecting information
already incorporated into stock returns, than gross margin information reported under the
sell-through method.
Although Altamuro et al. (2005) and Forester (2008) do not explicitly examine
the timeliness of accounting information under different revenue recognition methods, 35 I conduct two sensitivity tests with respect to the this analysis. First, I estimate Model 6 without fixed effects. The adjusted R2 drops from 0.74 reported in Table 6 to 0.23. The AdjRet×Sell-In coefficient remains negative but is insignificantly different from zero. Due to the increased explanatory power when fixed effects are included, I base my inferences on the Model 6 specification reported in Table 6. Second, I estimate Model 6 with seasonal change in gross margin scaled by beginning of quarter MVE as the dependent variable. The adjusted R2 of this fixed effects model is 0.23, and the AdjRet×Sell-In coefficient is negative, but insignificantly different from zero.

42
Zhang (2005) examines timeliness for software firms before and after the adoption of
SOP 91-1. She finds that revenue information is more timely when firms recognize
revenue early. In contrast, I find that revenue recognition is more timely when firms
delay revenue recognition.
The results reported in my study may differ from Zhang (2005) for at least two
important reasons. First, Zhang (2005) examines revenue recognition methods for
software sales made to end customers while I examine revenue recognition methods for
product sales made to distributors. While distributors attempt to anticipate end customer
demand, they are not the end users of the products. In addition, sales agreements for end
customers and distributors are likely to differ with respect to product return privileges
and the possibility of future pricing adjustments. The timeliness of revenue information
could be affected by both of these factors. Second, the transparency of revenue
recognition disclosures changed dramatically in the past decade. Firms were not
required to disclose their revenue recognition policies until SAB 101 went into effect.36
Prior to SAB 101, firms only disclosed revenue recognition policies if they were deemed
―significant.‖ Since Zhang‘s (2005) sample period occurs entirely before SAB 101
while my sample period occurs entirely after SAB 101, it is unclear how disclosure
transparency differences between the sample periods may have affected the timeliness of
revenue information.
36 Zhang (2005) suggests that ―one reason for the paucity of research in [the revenue recognition] area is
the difficulty in obtaining data related to revenue recognition policies.‖ For this reason, many revenue
recognition studies examine periods before and after standard changes that prompted firms to recognize cumulative effects adjustments or disclose additional revenue recognition information (e.g. Altamuro et al. 2005; Zhang 2005; Forester 2008; Srivastava 2008).
43
In summary, the results presented in both Tables 5 and 6 support Hypothesis 6
and suggest that the financial information quality is lower under the sell-in method than
the sell-through method.
Supplemental Analyses
Use of the sell-in or sell-through method is an endogenous choice made by firms.
Econometrically, an endogeneity problem would occur in the financial information
quality tests if the firm characteristics associated with Sell-In are also correlated with the
dependent variables in Models 5 and 6. This could cause Sell-In to be correlated with
the error term, meaning the expected value of the error term differs from zero and OLS
assumptions are violated (Wooldridge 2002; Greene 2003). Because the potentially
endogenous variable is an indicator variable, I re-estimate Models 5 and 6 and use the
Heckman (1979) two-stage approach to correct for potential endogeneity (Heckman
1979; Wooldridge 2002).
For each potentially endogenous model, I regress Sell-In on the accounting
variables in the OLS regression model and all independent variables from Model 2. The
independent variables from Model 2 act as instrument variables.37 The logit results
allow me to calculate inverse Mills ratios, which equal the standard normal density
function divided by the cumulative distribution function. I include the appropriate 37 In order to appropriately use the two-stage approach, at least one exogenous instrument variable must be included in the first stage that is not included in the second stage, and the exogenous instrument variable should not be associated with the dependent variable in the second stage model (e.g. Heckman 1979; Wooldridge 2002). I use all independent variables from Model 2 as possible instrument variables in the first stage, but focus on the variables significantly associated with Sell-In as possible instruments. I find that Age is an appropriate instrument variable for the cash flow analysis while RaisedCapital is an appropriate instrument for the timeliness analysis. Age is not significantly correlated with ΔOCF, and Age is not significantly associated with ΔOCF if included in Model 5. Meanwhile, RaisedCapital is not significantly correlated with GrossMargin/MVE, and RaisedCapital is not significantly associated with GrossMargin/MVE if included in Model 6.

44
inverse Mills ratio as an additional control variable in Models 5 and 6. Untabulated
results indicate that inferences gleaned from Tables 5 and 6 are unchanged when the
inverse Mills ratio is included in the regression models.

45
CHAPTER VI
CONCLUSION
This study examines previously unstudied revenue recognition methods (sell-in
and sell-through revenue recognition for sales to distributors) and finds distinct
differences in the characteristics of firms that use these methods. Firms with higher
growth opportunities and stronger corporate governance are more likely to defer revenue
recognition (sell-through). In addition, firms with strong corporate governance are less
likely to use the sell-in method than firms with weak governance as capital needs and
management incentives increase. These results suggest that corporate governance
proxies should be included in accounting choices models and also interacted with other
factors expected to be associated with the choices.
This study also finds evidence suggesting that financial information quality is
higher under a deferred revenue recognition method. Specifically, the ability of
accounting information to predict future cash flows is higher for sell-through firms than
for sell-in firms. Accounting information reported under the sell-through method is also
more timely, meaning that this information is more strongly associated with
contemporaneous stock returns than accounting information reported under the sell-in
method. This evidence may be useful to standard setters currently examining existing
revenue recognition standards, financial statement users interested in the industries
studied, and practitioners within high technology industries.
The findings of this study with respect to financial information quality are
important because prior research offers mixed evidence regarding financial information

46
quality under different revenue recognition methods (Altamuro et al. 2005; Zhang 2005;
Forester 2008). Studies that examine short periods following standard changes
(Altamuro et al. 2005) and pre-SAB 101 revenue recognition practices (Zhang 2005)
suggest that more aggressive revenue recognition results in higher financial information
quality. However, my findings support recent work that suggests financial information
quality is higher under methods that defer revenue recognition (Forester 2008). Thus,
many settings need to be examined in order to more clearly understand the association
between revenue recognition practices and financial information quality.
47
REFERENCES
Aboody, D., M. E. Barth, and R. Kasznik. 2004. Firms' voluntary recognition of stock-based compensation expense. Journal of Accounting Research 42 (2): 123-150.
Aboody, D., R. Kasznik, and M. Williams. 2000. Purchase versus pooling in stock-for-stock acquisitions: Why do firms care? Journal of Accounting and Economics 29 (3): 261-286.
Accounting Principles Board (APB). 1972. Opinion No. 22: Disclosure of Accounting
Policies. New York, NY: American Institute of Certified Public Accountants.
Ahmed, A. S. 1994. Accounting earnings and future economic rents: An empirical analysis. Journal of Accounting and Economics 17 (3): 377-400.
Ahmed, A. S., B. K. Billings, R. M. Morton, and M. Stanford-Harris. 2002. Conservatism in mitigating bondholder-shareholder conflicts on dividend policy and in reducing debt costs. The Accounting Review 77 (4): 867-890.
Ahmed, A. S., and S. Duellman. 2007. Accounting conservatism and board of director characteristics: An empirical analysis. Journal of Accounting and Economics 43 (2-3): 411-437.
Altamuro, J., A. L. Beatty, and J. Weber. 2005. The effects of accelerated revenue recognition on earnings management and earnings informativeness: Evidence from SEC Staff Accounting Bulletin No. 101. The Accounting Review 80 (2): 373-401.
American Institute of Certified Public Accountants (AICPA). 1997. Statement of
Position 97-2: Software Revenue Recognition. New York, NY: AICPA.
Anderson, K. L., and T. L. Yohn. 2002. The effect of 10-K restatements on firm value, information asymmetries, and investors‘ reliance on earnings. Working paper, Georgetown University.
Armstrong, C. S., A. D. Jagolinzer, and D. F. Larcker. 2008. Chief executive officer equity incentives and accounting irregularities. Working paper, Stanford University.
Ball, R., S. P. Kothari, and A. Robin. 2000. The effect of international institutional factors on properties of accounting earnings. Journal of Accounting and
Economics 29 (1): 1-51.
Ball, R., and L. Shivakumar. 2008. Earnings quality in initial public offerings. Journal of
Accounting & Economics 45 (2-3): 324-349.

48
Balsam, S., J. Krishnan, and J. S. Yang. 2003. Auditor industry specialization and earnings quality. Auditing: A Journal of Practice & Theory 22 (2): 71-97.
Barth, M. E., W. H. Beaver, and W. R. Landsman. 2001. The relevance of the value relevance literature for financial accounting standard setting: Another view. Journal of Accounting and Economics 31 (1-3): 77-104.
Barth, M. E., D. P. Cram, and K. K. Nelson. 2001. Accruals and the prediction of future cash flows. The Accounting Review 76 (1): 27-58.
Basu, S. 1997. The conservatism principle and the asymmetric timeliness of earnings. Journal of Accounting and Economics 24 (1): 3-37.
Beasley, M. S. 1996. An empirical analysis of the relation between the board of director composition and financial statement fraud. The Accounting Review 71 (4): 443-465.
Beasley, M. S., and S. E. Salterio. 2001. The relationship between board characteristics and voluntary improvements in audit committee composition and experience. Contemporary Accounting Research 18 (4): 539-570.
Becker, C. L., M. L. Defond, J. Jiambalvo, and K. R. Subramanyam. 1998. The effect of audit quality on earnings management. Contemporary Accounting Research 15 (1): 1-24.
Beekes, W., P. Pope, and S. Young. 2004. The link between earnings timeliness, earnings conservatism and board composition: Evidence from the U.K. Corporate Governance: An International Review 12 (1): 47-59.
Bergstresser, D., and T. Philippon. 2006. CEO incentives and earnings management. Journal of Financial Economics 80 (3): 511-529.
Bowen, R. M., A. K. Davis, and S. Rajgopal. 2002. Determinants of revenue-reporting practices for internet firms. Contemporary Accounting Research 19 (4): 523-562.
Bowen, R. M., S. Rajgopal, and M. Venkatachalam. 2008. Accounting discretion, corporate governance, and firm performance. Contemporary Accounting
Research 25 (2): 351-405.
Burns, N., and S. Kedia. 2006. The impact of performance-based compensation on misreporting. Journal of Financial Economics 79 (1): 35-67.
Caylor, M. 2008. Strategic revenue recognition to avoid negative earnings surprises. Working paper, University of South Carolina.

49
Cheng, Q., and T. D. Warfield. 2005. Equity incentives and earnings management. The Accounting Review 80 (2): 441-476.
Chipalkatti, N., S. Chatterji, and S. Bee. 2007. Effective controls for sales through distribution channels. The CPA Journal 77 (9): 60-66.
Christie, A. A. 1990. Aggregation of test statistics: An evaluation of the evidence on contracting and size hypotheses. Journal of Accounting and Economics 12 (1): 15-36.
Collins, D. W., and S. P. Kothari. 1989. An analysis of intertemporal and cross-sectional determinants of earnings response coefficients. Journal of Accounting and
Economics 11 (2-3): 143-181.
Core, J., and W. Guay. 2002. Estimating the value of employee stock option portfolios and their sensitivities to price and volatility. Journal of Accounting Research 40 (3): 613-630.
Cornett, M. M., A. J. Marcus, and H. Tehranian. 2008. Corporate governance and pay-for-performance: The impact of earnings management. Journal of Financial
Economics 87 (2): 357-373.
Credit Suisse First Boston (CSFB). 2004. Component Distribution: Cushioned Semiconductor Play. December 21. Zurich, Switzerland.
Dechow, P. M., and I. D. Dichev. 2002. The quality of accruals and earnings: The role of accrual estimation errors. The Accounting Review 77 (4): 35-59.
Dechow, P. M., W. Ge, C. R. Larson, and R. G. Sloan. 2007. Predicting material accounting manipulations. Working Paper, University of California, Berkeley.
Dechow, P. M., S. P. Kothari, and R. L. Watts. 1998. The relation between earnings and cash flows. Journal of Accounting and Economics 25 (2): 133-168.
Dechow, P. M., R. G. Sloan, and A. P. Sweeney. 1996. Causes and consequences of earnings manipulation: An analysis of firms subject to enforcement actions by the SEC. Contemporary Accounting Research 13 (1): 1-36.
DeFond, M. L., and M. Hung. 2004. Investor protection and corporate governance: Evidence from worldwide CEO turnover. Journal of Accounting Research 42 (2): 269-312.
Degeorge, F., J. Patel, and R. Zeckhauser. 1999. Earnings management to exceed thresholds. The Journal of Business 72 (1): 1-33.

50
Dichev, I. D., and D. J. Skinner. 2002. Large sample evidence on the debt covenant hypothesis. Journal of Accounting Research 40 (4): 1091-1123.
Ecker, F., J. Francis, I. Kim, P. Olsson, and K. Schipper. 2006. A returns-based representation of earnings quality. The Accounting Review 81 (4): 749-780.
Efendi, J., A. Srivastava, and E. P. Swanson. 2007. Why do corporate managers misstate financial statements? The role of option compensation and other factors. Journal
of Financial Economics 85 (3): 667-708.
Erickson, M., M. Hanlon, and E. L. Maydew. 2006. Is there a link between executive equity incentives and accounting fraud? Journal of Accounting Research 44 (1): 113-143.
Fama, E. F., and K. R. French. 1997. Industry costs of equity. Journal of Financial
Economics 43 (2): 153-193.
Fama, E. F., and M. C. Jensen. 1983. Separation of ownership and control. Journal of
Law and Economics 26 (2): 301-326.
Feroz, E. H., K. Park, and V. S. Pastena. 1991. The financial and market effects of the SEC's accounting and auditing enforcement releases. Journal of Accounting
Research 29 (3): 107-142.
Fields, T. D., T. Z. Lys, and L. Vincent. 2001. Empirical research on accounting choice. Journal of Accounting and Economics 31 (1-3): 255-307.
Financial Accounting Standards Advisory Council (FASAC). 2006. Results of the Annual Survey on the Priorities of the FASB (October 2006). http://www.fasb.org/fasac/
Financial Accounting Standards Board (FASB). 1978. Statement of Financial
Accounting Concepts No. 1: Objectives of Financial Reporting by Business
Enterprises. Norwalk, CT: FASB.
———. 1980. Statement of Financial Accounting Concepts No. 2: Qualitative
Characteristics of Accounting Information. Norwalk, CT: FASB.
———. 1981. Statement of Financial Accounting Standards No. 48: Revenue
Recognition When Right of Return Exists. Norwalk, CT: FASB.
———. 2008. Conceptual Framework for Financial Reporting: The Objective of
Financial Reporting and Qualitative Characteristics and Constraints of
Decision-Useful Financial Reporting Information. Exposure Draft. Norwalk, CT: FASB.

51
Forester, C. 2008. Does more conservative revenue recognition improve the informativeness of earnings? Working paper, University of Minnesota.
Francis, J., P. Olsson, and K. Schipper. 2006. Earnings quality. Foundations and Trends
in Accounting 1 (4): 259-340.
Garcia Lara, J. M., B. Garcia Osma, and F. Penalva. 2009. Accounting conservatism and corporate governance. Review of Accounting Studies 14 (1): 161-201.
Glass, Lewis & Co. 2004. Revenue Recognition Policies, Practices and Disclosures - Pharmaceutical Industry. http://www.glasslewis.com
Government Accountability Office (GAO). 2007. Financial restatements: Update of public company trends, market impacts, and regulatory enforcement activities. In Report 06-678. Washington, D C: Government Printing Office.
Greenberg, H. 2006. A shift to ‗sell-in‘ accounting could be clue to brewing trouble. The
Wall Street Journal, June 17.
Greene, W. 2003. Econometric Analysis. 5th ed. Upper Saddle River, NJ: Prentice Hall.
Heckman, J. J. 1979. Sample selection bias as a specification error. Econometrica 47 (1): 153-161.
Hosmer, D. W., and S. Lemeshow. 2000. Applied Logistic Regression. 2nd ed. Upper Saddle River, NJ: Prentice Hall.
Hribar, P., and D. C. Nichols. 2007. The use of unsigned earnings quality measures in tests of earnings management. Journal of Accounting Research 45 (5): 1017-1053.
Jensen, M. C. 1993. The modern industrial revolution, exit and failure of internal control systems. Journal of Finance 48 (3): 831–880.
Kellog, R. L. 1984. Accounting activities, security prices, and class action lawsuits. Journal of Accounting and Economics 6 (3): 185-204.
Klein, A. 2002. Audit committee, board of director characteristics, and earnings management. Journal of Accounting and Economics 33 (3): 375-400.
KMPG LLP. 2006. Improved point-of-sale reporting benefits manufacturers, channels, and end users. A study of the high tech industry. http://www.kpmg.ca/en/industries/ice/pointofsale.html
Larcker, D. F., and S. A. Richardson. 2004. Fees paid to audit firms, accrual choices, and corporate governance. Journal of Accounting Research 42 (3): 625-658.

52
Lee, H. L., V. Padmanabhan, T. A. Taylor, and S. Whang. 2000. Price protection in the personal computer industry. Management Science 46 (4): 467-482.
Lee, K. W., B. Lev, and G. H. H. Yeo. 2008. Executive pay dispersion, corporate governance, and firm performance. Review of Quantitative Finance and
Accounting 30 (3): 315-338.
Levine, C. B., and J. S. Hughes. 2005. Management compensation and earnings-based covenants as signaling devices in credit markets. Journal of Corporate Finance 11 (5): 832-850.
Levitt, A. 1998. The numbers game. In speech delivered at the NYU Center for Law and Business. New York, NY. http://www.sec.gov/news/speech/speecharchive/1998/spch220.txt
Lindenberg, E., and S. Ross. 1981. Tobin‘s q and industrial organization. Journal of
Business 54 (1): 1-32.
Lipton, M., and J. Lorsch. 1992. A modest proposal for improved corporate governance. Business Lawyer 48 (1): 59-77.
Marquardt, C. A., and C. I. Wiedman. 2004. How are earnings managed? An examination of specific accruals. Contemporary Accounting Research 21 (2): 459-491.
Matsunaga, S. R., and C. W. Park. 2001. The effect of missing a quarterly earnings benchmark on the CEO's annual bonus. The Accounting Review 76 (3): 313-332.
Mayhew, B. W., and M. S. Wilkins. 2003. Audit firm industry specialization as a differentiation strategy: Evidence from fees charged to firms going public. Auditing: A Journal of Practice & Theory 22 (2): 33-52.
Owhoso, E. V., W. F. Messier, and J. G. Lynch. 2002. Error detection by industry specialized teams during sequential audit review. Journal of Accounting
Research 40 (3): 883-900.
Palmrose, Z.-V., and S. Scholz. 2004. The circumstances and legal consequences of non-GAAP reporting: Evidence from restatements. Contemporary Accounting
Research 21 (1): 139-180.
Penman, S. H., and X.-J. Zhang. 2002. Accounting conservatism, the quality of earnings, and stock returns. The Accounting Review 77 (2): 237-264.
Rogers, W. H. 1993. Regression standard errors in clustered samples. Stata Technical
Bulletin (13): 19-23.

53
Roychowdhury, S., and R. L. Watts. 2007. Asymmetric timeliness of earnings, market-to-book and conservatism in financial reporting. Journal of Accounting &
Economics 44 (1): 2-31.
Schipper, K., and L. Vincent. 2003. Earnings quality. Accounting Horizons 17 (Supplement): 97-110.
Securities and Exchange Commission (SEC). 1999. Staff Accounting Bulletin No. 101:
Revenue Recognition. Washington, DC: Government Printing Office.
———. 2003. Staff Accounting Bulletin No. 104: Revenue Recognition. Washington, DC: Government Printing Office.
Shleifer, A., and R. W. Vishny. 1986. Large shareholders and corporate control. Journal
of Political Economy 94 (3): 461-488.
Skinner, D. J. 1993. The investment opportunity set and accounting procedure choice. Journal of Accounting and Economics 16 (4): 407-445.
Srivastava, A. 2008. The challenges of improving revenue-recognition standard for multiple-element firms: Evidence from the software industry (SOP 97-2). Working paper, Northwestern University.
St. Pierre, K., and J. A. Anderson. 1984. An analysis of the factors associated with lawsuits against public accountants. The Accounting Review 59 (2): 242-263.
Stubben, S. R. 2006. The use of discretionary revenues to meet earnings and revenue targets. Doctoral dissertation, Stanford University.
Sweeney, A. P. 1994. Debt-covenant violations and managers' accounting responses. Journal of Accounting and Economics 17 (3): 281-308.
Turner, L. 2001. Revenue recognition. In speech delivered at the USC SEC and Financial Reporting Institute. Los Angeles, CA. http://www.sec.gov/news/speech/spch495.htm
Watts, R. L. 2003. Conservatism in accounting part 1: Explanations and implications. Accounting Horizons 17 (3): 207-221.
Watts, R. L., and J. L. Zimmerman. 1986. Positive Accounting Theory. Englewood Cliffs, NJ: Prentice-Hall.
Wooldridge, J. M. 2002. Econometric Analysis of Cross Section and Panel Data. Cambridge, MA: MIT Press.

54
Wu, M. 2003. Earnings restatements: A capital market perspective. Working paper, Hong Kong University of Science and Technology.
Zhang, J. 2008. The contracting benefits of accounting conservatism to lenders and borrowers. Journal of Accounting and Economics 45 (1): 27-54.
Zhang, Y. 2005. Revenue recognition timing and attributes of reported revenue: The case of software industry's adoption of SOP 91-1. Journal of Accounting and
Economics 39 (3): 535-561.

55
APPENDIX A
EXCERPTS FROM SELECT 10-K REVENUE RECOGNITION DISCLOSURES

56
Skyworks Solutions 2005 10-K: Sell-in
Certain product sales are made to electronic component distributors under agreements
allowing for price protection and/or a right of return on unsold products. A reserve for
sales returns and allowances for customers is recorded based on historical
experience or specific identification of an event necessitating a reserve.
Silicon Laboratories 2005 10-K: Sell-through
Certain of the Company‘s sales are made to distributors under agreements allowing
certain rights of return and price protection on products unsold by distributors.
Accordingly, the Company defers revenue and gross profit on such sales until the
distributors sell the product to the end customer.
Netgear 2005 10-K: Sell-in
In addition to warranty-related returns, certain distributors and retailers generally have
the right to return product for stock rotation purposes. Every quarter, stock rotation
rights are limited to 10% of invoiced sales to the distributor or retailer in the prior
quarter. Upon shipment of the product, the Company reduces revenue for an
estimate of potential future product warranty and stock rotation returns related to
the current period product revenue. Management analyzes historical returns, channel
inventory levels, current economic trends and changes in customer demand for the
Company‘s products when evaluating the adequacy of the allowance for sales returns,
namely warranty and stock rotation returns.
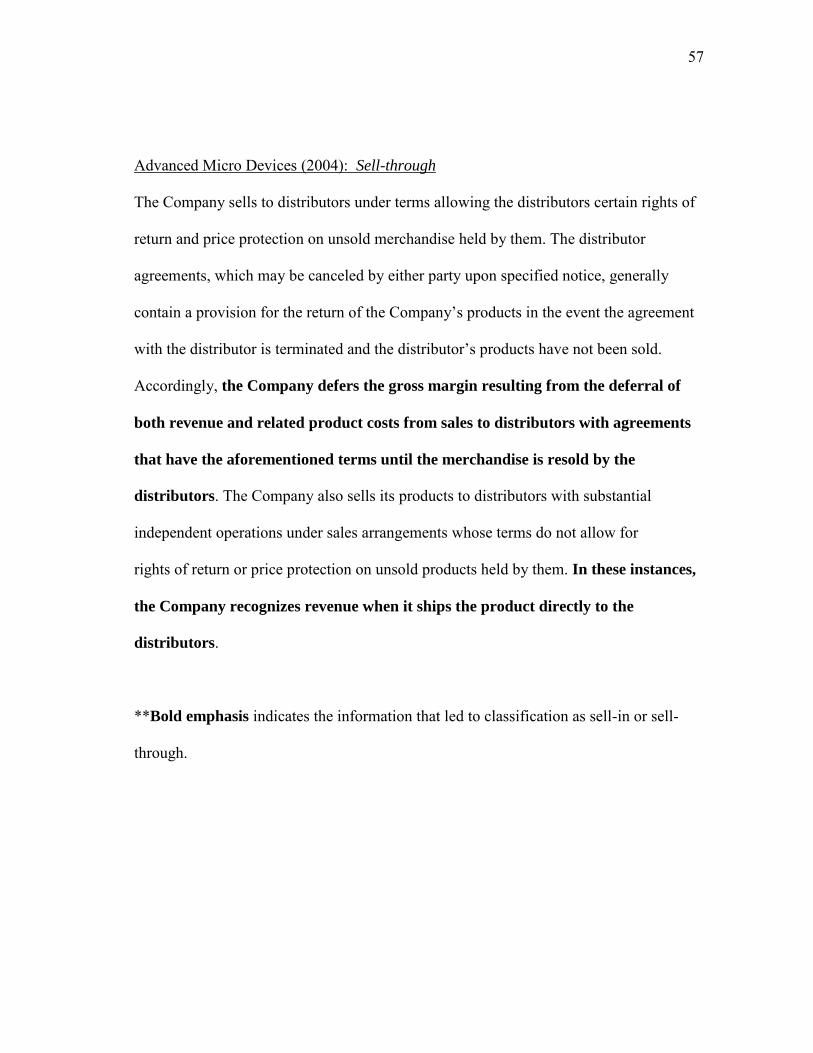
57
Advanced Micro Devices (2004): Sell-through
The Company sells to distributors under terms allowing the distributors certain rights of
return and price protection on unsold merchandise held by them. The distributor
agreements, which may be canceled by either party upon specified notice, generally
contain a provision for the return of the Company‘s products in the event the agreement
with the distributor is terminated and the distributor‘s products have not been sold.
Accordingly, the Company defers the gross margin resulting from the deferral of
both revenue and related product costs from sales to distributors with agreements
that have the aforementioned terms until the merchandise is resold by the
distributors. The Company also sells its products to distributors with substantial
independent operations under sales arrangements whose terms do not allow for
rights of return or price protection on unsold products held by them. In these instances,
the Company recognizes revenue when it ships the product directly to the
distributors.
**Bold emphasis indicates the information that led to classification as sell-in or sell-
through.

58
APPENDIX B
TABLES

59
TABLE 1
Variable Definitions
Sell-In = an indicator variable equal to 1 if the firm's annual 10-K indicates in the Notes to Financial Statements that it uses the sell-in revenue recognition method for sales to distributors; and otherwise 0.
Variables Included in Revenue Recognition Choice Model Age = the number of years since the firm was first listed in CRSP. Bonus = the CEO‘s annual bonus compensation scaled by the CEO‘s annual
salary [ExecuComp], averaged over years t-2 through t. Comp = an indicator variable equal to 1 if the firm‘s primary industry is
computers (SIC 3570-3579, 3680-3689, and 3695), and otherwise 0. EquityIncent = Onepct/(Onepct + Salary + Bonus) averaged over years t-2 through t.
Onepct equals the change in value of all granted stock options and common stock owned by the CEO for a one percent change in stock price. See Bergstresser and Philippon (2006) and Core and Guay (2002) [ExecuComp data].
Gov = an indicator variable equal to 1 if the firm is classified as having strong corporate governance and otherwise 0. Four measures are used to determine corporate governance strength: board size, board independence, institutional ownership, and use of an industry specialist auditor. Board size and board independence data are obtained from RiskMetrics (formerly IRRC). Institutional ownership data are obtained from Thomson Financial. Each firm-year observation is compared to the annual sample median for each of these three measures. A value of 1 is assigned to each measure if it indicates strong monitoring: above median board independence and institutional ownership or below median board size, otherwise a value of 0 is assigned. Compustat data is used to determine if the auditor is an industry specialist based on Mayhew and Wilkins (2003) definition of a differentiated auditor. Auditors considered a specialist are given a value of 1 for the specialist measure and a value of 0 otherwise. The sum of the four governance measures is totaled, and it ranges from 0 to 4. Firm-year governance sums are then compared to the annual median governance sum. Gov equals 1 for values above the median, else Gov equals 0.
IntCover = interest expense [Compustat Annual # 15] divided by operating income before depreciation [Compustat Annual # 13]. This ratio is capped at 2.0. All observations with negative operating income before depreciation are assigned a value of 2.0 for this ratio.
Lev = long-term debt [Compustat Annual # 9], scaled by total assets at the end of the fiscal year [Compustat Annual # 6].

60
TABLE 1 (continued)
LnAsset = natural log of the fiscal year-end total assets [Compustat Annual #6]. MTB = the fiscal-year end market value of equity [Compustat Annual # 25 *
# 199] scaled by the fiscal-year end book value of equity [Compustat Annual # 60+# 74].
R&D = research and development expense [Compustat Annual # 46], scaled by total assets at the end of the fiscal year [Compustat Annual # 6].
Raised Capital = an indicator variable equal to 1 if the firm issued new debt and equity [Compustat Annual # 108 + # 111] greater than 20 percent of average annual assets during the current fiscal year, and otherwise 0.
Retvol = the standard deviation of daily stock returns over prior fiscal-year (minimum of 100 daily observations for each firm-year to calculate the daily stock return) [CRSP]. Due to the narrow distribution of this variable (0.01 – 0.09), I multiply the value by 10 prior to running Model 1 so that it more closely represents an indicator variable.
ROA = net income [Compustat # 172], scaled by average total assets. Variables Included in Accounting Information and Cash Flow Model ΔGrossMargin = change in quarterly gross margin from the same quarter of the
preceding fiscal year [Compustat Quarterly # 2 - # 30], scaled by quarter-end total assets [Compustat Quarterly # 44].
ΔOCF = change in quarterly cash flows from operations from the same quarter of the preceding fiscal year [Compustat Quarterly # 108] scaled by quarter-end total assets [Compustat Quarterly # 44].
ΔOtherExp = change in other expenses from the same quarter of the preceding fiscal year [Compustat Quarterly # 2 - # 30 - #69], scaled by quarter-end total assets [Compustat Quarterly # 44].
Variables Included in Accounting Information and Stock Return Model Adj_Ret = cumulative stock returns beginning two days after the prior quarter‘s
earnings announcement and ending one day after the current quarter‘s
earnings announcement, adjusted by the value weighted market index [CRSP].
Beta = an indicator variable equal to 1 if the Beta is greater than the sample median for the quarter, and otherwise 0. Beta equals the systematic risk from the market model for the twelve month period ending before the start of the current quarter [CRSP].
MTB = an indicator variable equal to 1 if the market-to-book ratio is greater than the sample median for the quarter, and otherwise 0. Market-to-book ratio equals Compustat Quarterly (#14×#61)/(#59 + #52).

61
TABLE 1 (continued) GrossMargin/
MVE
= quarterly gross margin [Compustat Quarterly # 2 - # 30], scaled by market value of equity at the beginning of the quarter [Compustat Quarterly # 14× # 61].
Neg = an indicator variable equal to 1 if Adj_Ret is less than 0, and otherwise 0.
Persist = an indicator variable equal to 1 if gross margin persistence is greater than the sample median for the quarter, and otherwise 0. Gross margin persistence equals σ in the following seasonal ARIMA model:
(GrossMargint – GrossMargint-4) = σ(GrossMargint-1 – GrossMargint-5) + εt – θεt-4.
Size = an indicator variable equal to 1 if the firm‘s natural log of assets at the
beginning of the quarter (Compustat Quarterly # 44) is greater than the sample median for the quarter, and otherwise 0.

62
Compustat firm-years during 2001-2005
Within Computer and Electronics Industries
Base sample 4,515
Missing Compustat data (1,470)
Missing ExecuComp data (2,341)
Missing RiskMetrics (formerly IRRC) data (141)
Missing CRSP data (1)
Missing Sell-in classification (83)
Final sample
Firm years 479
Unique firms 119
TABLE 2
Sample Selection

63 63
Panel A: Descriptive Statistics for the Full Sample, Sell-In Firms, and Sell-Through Firms
Mean
25%
Quartile Median
75%
Quartile Mean
25%
Quartile Median
75%
Quartile Mean
25%
Quartile Median
75%
Quartile
Age a,b
20 8 14 28 22 8 15 32 15 9 13 20
Assets 3,932 349 1,109 2,572 4,213 317 1,004 2,704 3,377 482 1,470 2,408
Bonus 0.31 0.16 0.31 0.47 0.31 0.17 0.31 0.47 0.32 0.16 0.30 0.48
EquityIncent a,b
0.33 0.13 0.26 0.48 0.29 0.12 0.20 0.37 0.42 0.22 0.39 0.57
Gov 0.36 0.00 0.00 1.00 0.35 0.00 0.00 1.00 0.39 0.00 0.00 1.00
IntCover b
0.41 0.00 0.05 0.27 0.38 0.00 0.06 0.27 0.45 0.00 0.01 0.23
Lev a,b
0.10 0.00 0.01 0.19 0.11 0.00 0.04 0.20 0.08 0.00 0.00 0.14
MTB a,b
2.87 1.61 2.28 3.45 2.64 1.58 2.14 3.10 3.34 1.75 2.84 4.37
R&D a,b
0.09 0.06 0.09 0.12 0.08 0.05 0.08 0.11 0.12 0.09 0.11 0.14
RaisedCapital a,b
0.08 0.00 0.00 0.00 0.10 0.00 0.00 0.00 0.05 0.00 0.00 0.00
Retvol a,b
0.04 0.03 0.04 0.05 0.04 0.03 0.03 0.05 0.04 0.03 0.04 0.05
ROA -0.02 -0.06 0.02 0.07 -0.01 -0.05 0.02 0.06 -0.03 -0.08 0.02 0.09
Sell-In 0.66 0.00 1.00 1.00 1.00 1.00 1.00 1.00 0.00 0.00 0.00 0.00
Full Sample N = 479 Sell-In Firms N = 318 Sell-Through Firms N = 161
TABLE 3
Descriptive Statistics and Correlations for Variables Included in the Revenue Recognition Choice Model

64 64
Panel B: Descriptive Statistics by Industry
Mean
25%
Quartile Median
75%
Quartile Mean
25%
Quartile Median
75%
Quartile
Age 18 8 14 21 20 9 15 29
Assets a,b
6,003 547 1,609 4,855 3,255 337 941 2,404
Bonus 0.33 0.20 0.32 0.47 0.31 0.16 0.29 0.47
EquityIncent a,b
0.28 0.12 0.18 0.33 0.35 0.14 0.30 0.50
Gov 0.42 0.00 0.00 1.00 0.34 0.00 0.00 1.00
IntCover 0.41 0.01 0.06 0.37 0.40 0.00 0.05 0.23
Lev 0.09 0.00 0.03 0.15 0.10 0.00 0.01 0.19
MTB 2.72 1.56 2.14 3.20 2.92 1.62 2.36 3.58
R&D 0.09 0.05 0.08 0.12 0.10 0.06 0.09 0.12
RaisedCapital 0.07 0.00 0.00 0.00 0.09 0.00 0.00 0.00
Retvol 0.04 0.02 0.04 0.05 0.04 0.03 0.04 0.05
ROA -0.03 -0.08 0.02 0.06 -0.02 -0.05 0.02 0.08
Sell-In a,b
0.81 1.00 1.00 1.00 0.62 0.00 1.00 1.00
TABLE 3 (continued)
Computer Firms N = 118 Electronic Firms N = 361

65 65
Panel C: Correlations Based on the Full Sample of Firms
1 2 3 4 5 6 7 8 9 10 11 12 13 14
1 Sell-In 0.18 0.10 0.08 0.01 -0.30 -0.36 -0.18 -0.04 -0.05 -0.03 -0.14 0.11 0.17
2 Lev 0.11 0.59 0.20 0.08 -0.16 -0.10 -0.14 -0.04 0.32 -0.25 0.02 0.30 0.03
3 IntCover -0.05 0.15 0.13 -0.17 -0.11 0.09 -0.35 -0.06 0.06 -0.61 0.22 0.06 0.06
4 RaisedCapital 0.08 0.21 0.02 -0.09 -0.11 -0.05 0.02 0.08 -0.07 -0.04 0.04 0.08 -0.03
5 Bonus -0.02 -0.01 -0.26 -0.08 -0.20 -0.20 0.24 0.01 0.40 0.39 -0.19 0.25 0.06
6 EquityIncet -0.25 -0.08 0.02 -0.10 -0.20 0.23 0.33 -0.12 0.24 0.03 0.19 -0.19 -0.12
7 R&D -0.35 -0.08 0.30 -0.05 -0.22 0.17 0.06 -0.09 -0.22 -0.20 0.33 -0.20 -0.06
8 MTB -0.17 -0.07 -0.22 0.04 0.24 0.29 0.13 -0.03 0.19 0.50 -0.09 -0.04 -0.06
9 Gov -0.04 -0.01 -0.03 0.08 0.01 -0.14 -0.10 0.03 -0.14 0.14 0.00 -0.12 0.06
10 LnAsset -0.01 0.22 -0.19 -0.09 0.44 0.17 -0.23 0.12 -0.16 0.11 -0.24 0.38 0.11
11 ROA 0.06 -0.14 -0.60 -0.05 0.26 0.00 -0.27 0.28 0.17 0.07 -0.47 0.07 -0.06
12 Retvol -0.13 0.06 0.35 0.04 -0.15 0.18 0.33 0.04 -0.01 -0.22 -0.49 -0.29 -0.04
13 Age 0.20 0.20 -0.19 0.05 0.33 -0.20 -0.25 -0.07 -0.11 0.51 0.14 -0.32 -0.06
14 Comp 0.17 -0.01 0.01 -0.03 0.04 -0.11 -0.06 -0.04 0.06 0.14 -0.02 -0.03 -0.07
TABLE 3 (continued)
All variables are defined in Table 1 with the following exception. Assets is the total fiscal-year end assets (millions of dollars). All variables are winsorized at the top
and bottom one percent except for IntCover and indicator variables. IntCover is capped at 2.0, and the ratio is set to 2.0 for all observations with negative operating
income before depreciation. In Panel A, mean (median) differences between sell-in and sell-through firms at p < 0.10 using a two-tailed t (Wilcoxon Sum-Rank) test are
denoted by a (b)
. In Panel B, mean (median) differences between computers and electronics firms at p < 0.10 using a two-tailed t (Wilcoxon) test are denoted by a (b)
. In
Panel C, the upper (lower) diagonal of contains Spearman (Pearson) correlations. Bolded correlations are significant at the 0.05 level.

66
Variable Prediction Coeff. Z-Stat Prediction Coeff. Z-Stat
Capital Requirement Proxies
Lev ? 1.763 (1.15) ? 2.027 (1.22)
Lev ×Gov - -0.517 (-0.21)
IntCover ? 0.146 (0.53) ? 0.195 (0.62)
IntCover ×Gov - 0.106 (0.22)
RaisedCapital ? 0.335 (0.73) ? 1.305 (1.82) *
RaisedCapital ×Gov - -1.929 (-1.81) **
Management Incentive Proxies
Bonus ? -1.422 (-1.15) ? -0.185 (-0.13)
Bonus ×Gov - -3.709 (-1.99) **
EquityIncent ? -1.544 (-1.50) ? -0.308 (-0.31)
EquityIncent ×Gov - -5.082 (-2.50) ***
Growth Opportunities Proxies
R&D ? -1.945 (-3.83) *** ? -1.971 (-3.74) ***
R&D ×Gov - -0.576 (-0.68)
MTB ? -0.011 (-0.12) ? 0.003 (0.03) **
MTB ×Gov - 0.030 (0.16)
Governance
Gov - -0.804 (-2.35) *** - 2.581 (2.29)
Other Controls
LnAsset ? -0.293 (-1.29) -0.347 (-1.53)
ROA ? 0.972 (0.89) 1.333 (1.07)
Retvol ? 5.978 (0.63) ? 10.573 (1.02)
Age ? 0.037 (2.19) ** ? 0.039 (2.29) **
Comp ? 1.251 (2.13) ** ? 1.247 (2.20) **
Chi-square Tests Chi-Sq
Lev + Lev ×Gov ? 1.510 (0.40)
IntCover + IntCover ×Gov ? 0.301 (0.42)
RaisedCapital + RaisedCapital ×Gov ? -0.624 (0.67)
Bonus + Bonus ×Gov ? -3.893 (4.91) **
EquityIncent + EquityIncent ×Gov ? -5.390 (6.84) ***
R&D + R&D ×Gov - -2.547 (8.17) ***
MTB + MTB ×Gov - 0.033 (0.03)
TABLE 4
Coefficients and Z-Statistics from a Logistic Regression Comparing Firm Characteristics and
Use of the Sell-in and Sell-through Revenue Recognition Methods
Model 1 Model 2
Dependent variable = Sell-In

67
N 479 479
Pseudo R2
0.22 0.26
% Correctly Classified 73% 75%
Area under ROC curve 80% 82%
Model 1 Model 2
See Table 1 for definitions of all variables. *, **, and *** indicate statistical significance at the 0.10, 0.05, and 0.01 level, respectively,
for a one-tailed test when a prediction is made and a two-tailed test when no prediction is made. All z-statistics are calculated using
Rogers standard errors clustered by firm.
TABLE 4 (continued)

68
Variable Coeff. t-Stat
Intercept -0.060 (-3.01) ***
Sell-In 0.040 (3.19) ***
Δ GrossMargin 0.643 (9.13) ***
Δ OtherExp -0.088 (-2.76) ***
Sell-In× Δ GrossMargin -0.267 (-2.98) ***
Sell-In× Δ OtherExp 0.030 (0.69)
Firm and time fixed effects Yes
N 1,899
Adjusted R2
0.12
See Table 1 for definitions of all variables. All continuous variables are winsorized at the
top and bottom one percent. *, **, and *** indicate statistical significance at the 0.10,
0.05, and 0.01 level, respectively, for two-tailed tests.
TABLE 5
Coefficients and t-Statistics for a Firm and Quarterly Fixed-
Effects Regression of the Asssociation between
One-Quarter Ahead Seasonal Changes in Operating Cash
Flow, Current Period Seasonal Changes in Gross Margin and
Other Expenses, and Sell-In
Dependent variable = Δ OCF i,t+1

69
Variable Coeff. t-Stat
Intercept 0.038 (4.34) ***
AdjRet 0.066 (7.89) ***
Sell-In 0.003 (0.57)
Neg -0.001 (-0.37)
Beta -0.002 (-1.49)
MTB -0.014 (-8.41) ***
Size 0.004 (1.23)
Persist -0.003 (-2.03) **
AdjRet×Sell-In -0.012 (-2.14) **
AdjRet×Neg -0.006 (-0.64)
AdjRet×Beta -0.003 (-0.61)
AdjRet×MTB -0.027 (-5.30) ***
AdjRet×Size 0.005 (0.93)
AdjRet×Persist -0.015 (-2.92) ***
Firm and time fixed effects Yes
N 1,688
Adjusted R2
0.74
TABLE 6
Coefficients and t-Statistics from Regressions of the
Association between Gross Margin, Market-
Adjusted Quarterly Stock Returns, Sell-In , and
Control Variables
See Table 1 for definitions of all variables. All continuous variables are
winsorized at the top and bottom one percent. *, **, and *** indicate
statistical significance at the 0.10, 0.05, and 0.01 level, respectively, for
two-tailed tests.
Dependent variable =
GrossMargin t /MVE t-1

70
VITA
Stephanie Jean Binger Rasmussen Texas A&M University Mays Business School
Department of Accounting, 4353 TAMU College Station, Texas 77843-4353
Phone: 979-220-7620 E-mail: [email protected]
Education
2009 Ph.D. in Accounting, Texas A&M University Minor: Finance Dissertation Committee Chair: Dr. Anwer S. Ahmed 2000 M.B.A., Concentration Finance, University of Tennessee at Knoxville 1998 B.S. Finance, Minnesota State University Moorhead Professional Experience
2000-2005 ON Semiconductor
Key Positions Held: Financial Analyst, Sales and Marketing Controller, Cost Accounting Manager
Research Experience
2005-2009 Texas A&M University Graduate Research Assistant 1998-2000 University of Tennessee at Knoxville Graduate Research Assistant Teaching Experience
2008 Texas A&M University Instructor for Introductory Financial Accounting Conference Presentations
American Accounting Association, Annual Meeting, Anaheim, 2007 American Accounting Association, FARS Mid-year Meeting, Phoenix, 2007