self service strategy and execution - · pdf fileself service strategy and execution ... how...
TRANSCRIPT

Self Service Strategy and Execution
Ina Felsheim, Sr. Dir. Analytics Solution Management, SAP
April 2016

© 2016 SAP AG. All rights reserved. 1
The information in this presentation is confidential and proprietary to SAP and may not be disclosed without the
permission of SAP. This presentation is not subject to your license agreement or any other service or subscription
agreement with SAP. SAP has no obligation to pursue any course of business outlined in this document or any related
presentation, or to develop or release any functionality mentioned therein. This document, or any related presentation
and SAP's strategy and possible future developments, products and or platforms directions and functionality are all
subject to change and may be changed by SAP at any time for any reason without notice. The information in this
document is not a commitment, promise or legal obligation to deliver any material, code or functionality. This
document is provided without a warranty of any kind, either express or implied, including but not limited to, the implied
warranties of merchantability, fitness for a particular purpose, or non-infringement. This document is for informational
purposes and may not be incorporated into a contract. SAP assumes no responsibility for errors or omissions in this
document, except if such damages were caused by SAP´s willful misconduct or gross negligence.
All forward-looking statements are subject to various risks and uncertainties that could cause actual results to differ
materially from expectations. Readers are cautioned not to place undue reliance on these forward-looking statements,
which speak only as of their dates, and they should not be relied upon in making purchasing decisions.
Legal disclaimer
© 2016 SAP AG. All rights reserved. 2
Agenda
Self-service strategies and best practices
Self-service users, use cases, and tools
SAP Solutions for self-service
Summary and next steps

Self-Service Strategies and
Best Practices

© 2016 SAP AG. All rights reserved. 4
What do we mean by self-service?
• End users designing and deploying their own reports and analyses within an
approved and supported architecture and tools portfolio
How does it fit within your larger BI strategy?
Self-Service

© 2016 SAP AG. All rights reserved. 5
BI Projects Fail to Meet ExpectationsTechnology is Only One Consideration
Between 70% to 80% of corporate business intelligence projects fail (to meet expectations),
according to Gartner.
“Organizations tend to throw
technology at BI problems. You
could have the right tool, but it
could be doomed to failure
because of political and cultural
issues, an absence of executive
support so the message doesn't
get out, and poor communication
and training.”

© 2016 SAP AG. All rights reserved. 6
Business Requirements are Changing, and IT Must
Provide Solutions
Source: Forrester whitepaper

Self-Service Does Not Mean IT Shouldn’t
Be Involved.
"How can something be 'self-service' if it requires the IT
department to train and support users continually? That's
the conundrum of self-service BI,"
-- Wayne Eckerson

© 2016 SAP AG. All rights reserved. 8
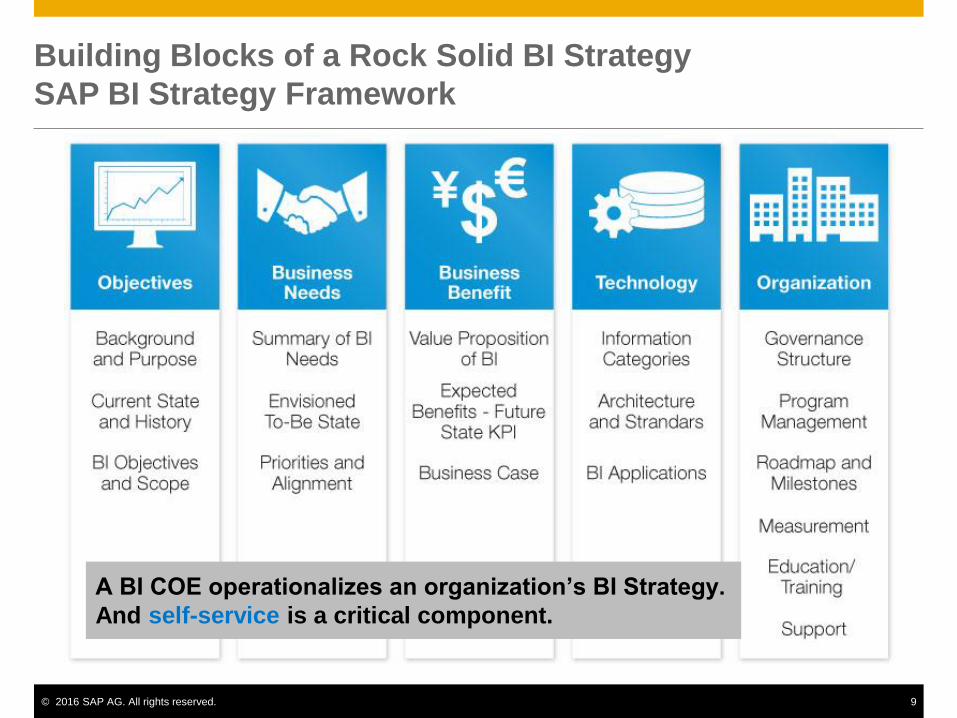
Rx for BI Success: BI Strategy + BI Center of Excellence (COE)
Understand Business Pains
Identify technology gaps
Focus on change management and adoption
BI Strategy creates an information driven culture:
The BI COE provides a sustainable framework to execute the
strategy and maintain it.
© 2016 SAP AG. All rights reserved. 9
Building Blocks of a Rock Solid BI Strategy
SAP BI Strategy Framework
A BI COE operationalizes an organization’s BI Strategy.
And self-service is a critical component.
© 2016 SAP AG. All rights reserved. 10
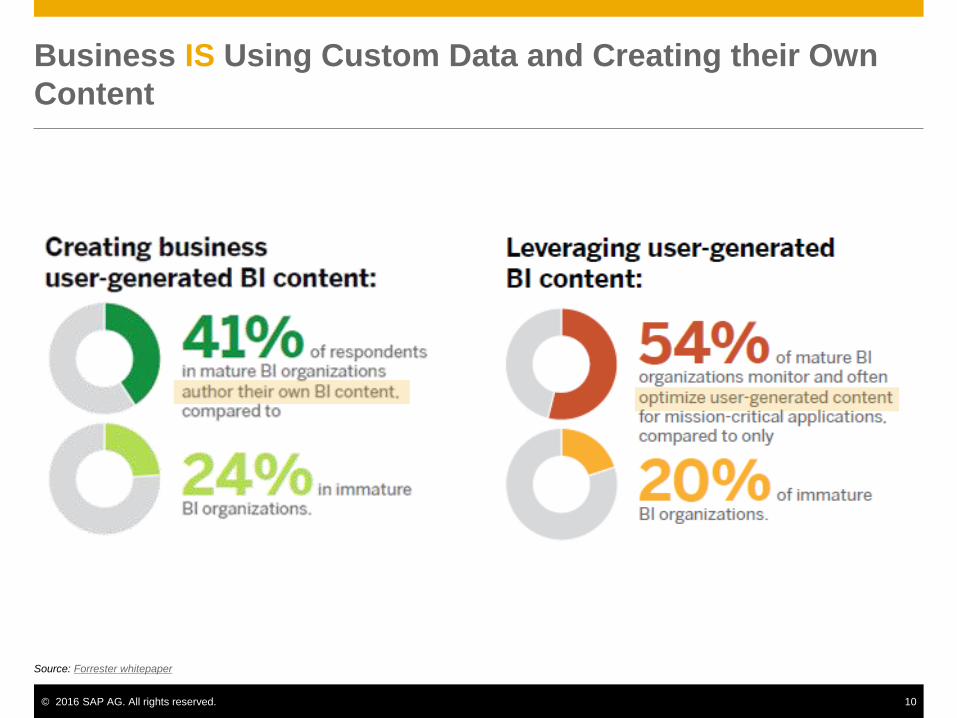
Business IS Using Custom Data and Creating their Own
Content
Source: Forrester whitepaper

© 2016 SAP AG. All rights reserved. 11
Prepare Your Data Foundation, and Make it User-Friendly
• Assist in finding the right
sources.
• Manage metadata for ease of
consumption.
• Perform routine cleansing and
de-duplication.
• Promote to enterprise sources,
with views.
• Move / Copy data as little as
possible.
• Make sure archived and
deleted information is
excluded.

© 2016 SAP AG. All rights reserved. 12
Silo’d Calculations Impact Your BusinessSee video here: http://events.sap.com/sapphirenow/en/session/16021

© 2016 SAP AG. All rights reserved. 13
IT: Facilitating Self-Service Success
• Know your users and required functionality.
• Identify special requirements beyond standard content.
• Choose BI tools that serve multiple use cases.
• Converge administrative features onto a single
platform.
• BI on BI is key for self-service success.

Culture and on-going management are
necessary.

© 2016 SAP AG. All rights reserved. 15
BICC Skills Requirements
Business + Analytics + IT
How BICCs are changing:
http://scn.sap.com/community/bu
siness-
intelligence/blog/2014/09/18/best
-practices-for-agile-biccs
© 2016 SAP AG. All rights reserved. 16
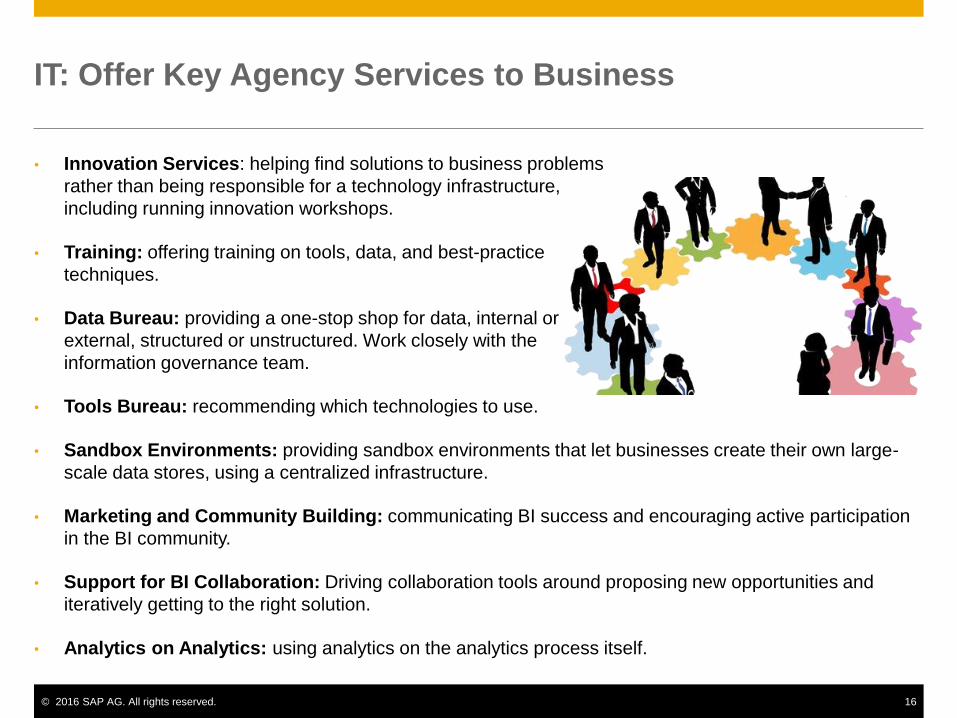
IT: Offer Key Agency Services to Business
• Innovation Services: helping find solutions to business problems
rather than being responsible for a technology infrastructure,
including running innovation workshops.
• Training: offering training on tools, data, and best-practice
techniques.
• Data Bureau: providing a one-stop shop for data, internal or
external, structured or unstructured. Work closely with the
information governance team.
• Tools Bureau: recommending which technologies to use.
• Sandbox Environments: providing sandbox environments that let businesses create their own large-
scale data stores, using a centralized infrastructure.
• Marketing and Community Building: communicating BI success and encouraging active participation
in the BI community.
• Support for BI Collaboration: Driving collaboration tools around proposing new opportunities and
iteratively getting to the right solution.
• Analytics on Analytics: using analytics on the analytics process itself.

Create a data playground for analysts to
prototype and explore.

© 2016 SAP AG. All rights reserved. 18
Tip: Data Strategy Must Support Self-Service
With increased data visibility, you need a solid
data strategy
• Which data sets will be promoted to enterprise
sources?
• Where does cleaning and transforming take
place?
• Where do calculations take place?
• Is there a feedback process in place for dealing
with found errors and inconsistencies in the data?
• How will you move the data to avoid creating
loads of data silos?
• Are your user permissions for sensitive or out-of-
area data set appropriately?
• How will data get promoted to enterprise sources?
• How will you share common reference data and
enrichment sources?
• How will you manage third party data sets, like
Dun and Bradstreet numbers or demographic
data?
Source: Forrester whitepaper

© 2016 SAP AG. All rights reserved. 19
Tips for Strategy Success Recap
• Fold self-service into your larger
enterprise BI strategy.
• Engage your BICC for governance.
• Make sure you have a data
foundation in place to support
access, volume, and performance.
• IT should offer agency-style
services to the business beyond
software environments.
Self-Service Users, Use
Cases, and Tools

© 2016 SAP AG. All rights reserved. 21
Self-Service Users
• Self-service for business users and decision makers
• Drill-down and filter dashboards or reports to the “right” level
• Self-service for finance professionals
• Access to BW and Essbase within Excel
• Combine data from BPC and BW in a single user experience
• Self-service for business analysts
• Mashup data from multiple data sources
• Easy to learn and create compelling visualizations
• Create simple dashboards to share insights
• Self-service dashboard composition for business users
• Compose their own dashboards from existing charts and crosstabs
• Self-service data discovery for casual users
• Find an answer to a business question in 10 minutes or less
• Learn the UX without training.
• Self-service reporting
• Easy access to data
• Build queries and format data as needed
• Create simple reports with little training, or more complex reports with more training
• Create document-style output

© 2016 SAP AG. All rights reserved. 22
Self-Service Providers: IT
• Secure the environment
• Ensure scalability and performance
• Enforce user access rights
• REUSE user access rights
• Schedule during downtimes
• Provide gated access to curated, enterprise sources
• Maintain audit trails of licenses, users, and data usage
• Monitor system performance

© 2016 SAP AG. All rights reserved. 23
Self-Service Power Users + Information Governance Users
• Facilitate usage from casual users
• Create templates in corporate colors, etc., for casual users to consume
• Oversee creation of custom data extensions or visualization extensions
• Create report pieces for others to consume
• Analyze more complex data sources
• Real-time data consumption
• Sensor data consumption
• Work with the information governance team to ensure the best data is
available and discoverable
• Validate that the metadata and descriptions for the sources is well documented.
• Decide which data sources to promote to enterprise, curated sources
• Validate quality of enterprise, curated sources. Feed suggestions back into information
governance organization.
© 2016 SAP AG. All rights reserved. 24
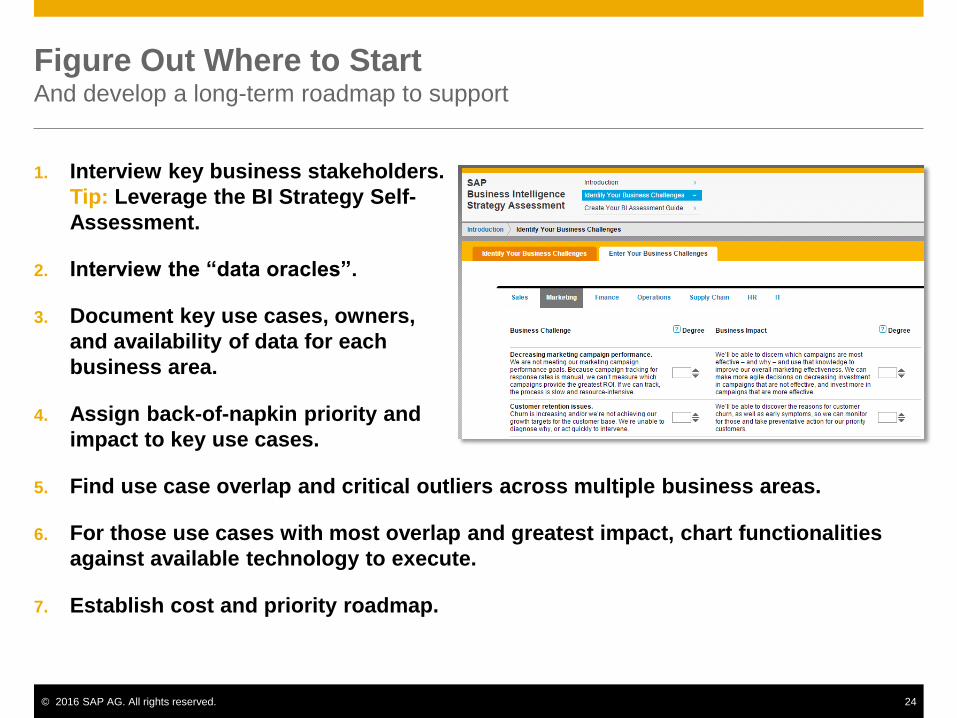
Figure Out Where to StartAnd develop a long-term roadmap to support
1. Interview key business stakeholders.
Tip: Leverage the BI Strategy Self-
Assessment.
2. Interview the “data oracles”.
3. Document key use cases, owners,
and availability of data for each
business area.
4. Assign back-of-napkin priority and
impact to key use cases.
5. Find use case overlap and critical outliers across multiple business areas.
6. For those use cases with most overlap and greatest impact, chart functionalities
against available technology to execute.
7. Establish cost and priority roadmap.
© 2016 SAP AG. All rights reserved. 25
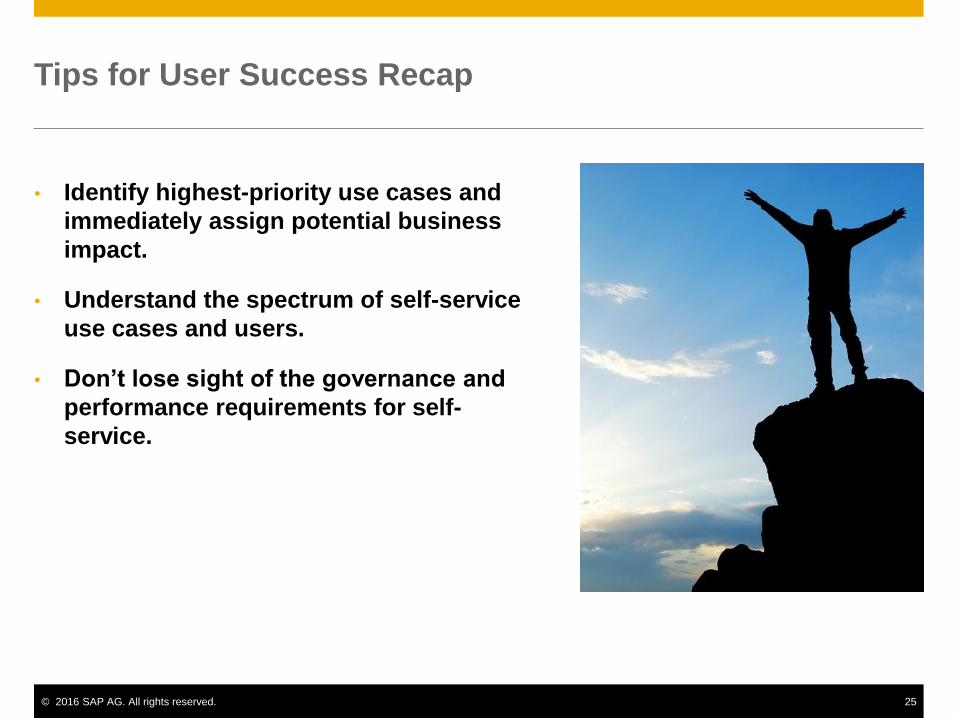
Tips for User Success Recap
• Identify highest-priority use cases and
immediately assign potential business
impact.
• Understand the spectrum of self-service
use cases and users.
• Don’t lose sight of the governance and
performance requirements for self-
service.
SAP Solutions for Self-
Services

© 2016 SAP AG. All rights reserved. 27
Agile visualization with SAP Lumirahttps://www.youtube.com/watch?v=o_g5H5Gq1hE

© 2016 SAP AG. All rights reserved. 28
Unlock Hidden Patterns by Connecting to Enterprise, Curated
Sources
Personal, corporate, and custom data
• Microsoft Excel, CSV, text files, web data
• SAP HANA, SAP Universe, SAP BW, Query with SQL
• Add custom data sources with partner and own built Data Access Extensions
Big data, big insights
• Amazon EMR Hive
• Apache Hive
• Cloudera Impala
Lumira Cloud
• Create new dataset from Microsoft Excel and CSV
• Connect to on-premise data via HANA Cloud Integration (HCI)
• Schedule data refresh using SAP Lumira Agent
SAP Lumira empowers business users to instantly access, combine, and transform data

© 2016 SAP AG. All rights reserved. 29
Increase Use of Data with Easy Data Preparation
Transform data
• Duplicate, hide, split, remove, rename columns
• Edit or replace values, add or trim text, convert case
• Rename datasets
Enrich data
• Create groups, measures, calculated dimensions, calculated
measures, numeric ranges as dimensions
• Define time, geography, and custom hierarchies
Gain additional insights
• Merge, append, or blend data
• Analyze associated data in facet view
• Create new datasets from existing visualizations
Cleanse, combine, and enrich data without needing IT
Actions are recorded and replayed when data is refreshed

© 2016 SAP AG. All rights reserved. 30
Tell Your Story with Stunning Visualizations
Powerful visualizations
• Flexible number formatting and conditional formatting (tables only)
• Sort, rank, filter, drill up, drill down, zoom in and out, and trellis
• Perform multidimensional analysis
• Easily add calculations
• Drill up and down hierarchies to filter all views on the page
Geospatial analytics
• Choropleth, geo bubble, geo pie charts
• Esri ArcGIS Online base maps with marker layers and clustering
• Grey, topographic, satellite, and streets views of Esri maps
Dynamic stories
• Animate data movements
• Easily email and print visualizations
• Visually engage audience with info charts, images, and pictograms
• Explore with input controls, filters, and drill down options
• Embed hyperlinks to text, images, pictograms, and shapes
• Add links to jump to another page or story

© 2016 SAP AG. All rights reserved. 31
Be the Smartest Person in the Room: and Prove It
Increase speed to insight with the predictive capabilities
embedded directly into Lumira. No waiting for a Data Scientist.
Reduce the burden for your team by removing the need to
collaborate for out-of-the-box predictive, and the need to
manage human-generated models.
Smart BI—no more blank canvas. Find Related
Visualizations and the data affecting your report simply by
clicking the button. Add Forecasting and Regression with a
simple menu choice.
Behind the scenes data preparation. With the embedded
predictive algorithms, we do multiple passes at the data to form
it correctly for the predictive algorithms.
Find new insights by merging enterprise, curated sources with
personal or web sources. Add reference data, environmental
data, and merge, append, and blend seamlessly.

© 2016 SAP AG. All rights reserved. 32
Share and Access Your Insights in Multiple Ways
Share with others
• Publish to trusted SAP Lumira platforms of your choice
• Export stories to Adobe PDF for sharing and printing
• Embed stories into web pages via URL
• Visualize, annotate and share insights from tablet
• Citrix XenApp, XenDesktop and Windows RDS support for
multi-user desktop environments
Bring insights together
• Link stories with web sites and other SAP applications
Share your datasets and stories to the platform of your choice
© 2016 SAP AG. All rights reserved. 33
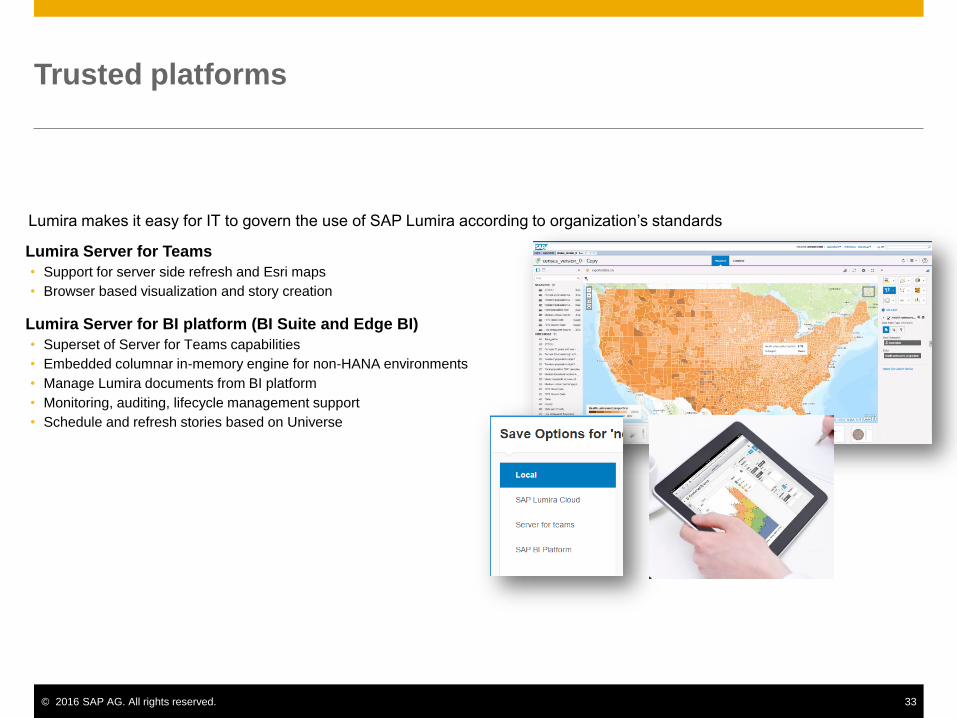
Trusted platforms
Lumira Server for Teams
• Support for server side refresh and Esri maps
• Browser based visualization and story creation
Lumira Server for BI platform (BI Suite and Edge BI)
• Superset of Server for Teams capabilities
• Embedded columnar in-memory engine for non-HANA environments
• Manage Lumira documents from BI platform
• Monitoring, auditing, lifecycle management support
• Schedule and refresh stories based on Universe
Lumira makes it easy for IT to govern the use of SAP Lumira according to organization’s standards

© 2016 SAP AG. All rights reserved. 34
Scale to Thousands of Users to Share Your Insights
Scale to many self-service users
with a single suite of tools
Use BI launch pad as a sharing
platform
Embed Lumira stories in private or
public web pages
Visualize, explore, annotate and
share insights from tablet
Explore data without creating custom
reports for users with Design Studio
templatesVideo here:
https://www.youtube.com/watch?v=1fd
xkwaJJGc

© 2016 SAP AG. All rights reserved. 35
Integration into Office
Access and administer BI within the most popular enterprise BI environment: SAP BI Platform
Access visualization capabilities in popular tools, like Excel and PowerPoint
Create live PowerPoint presentations
Build powerful Excel workbook BI applications
Support BW-Integrated Planning and BPC Embedded Models

© 2016 SAP AG. All rights reserved. 36
Build Interactive Dashboards
Modify and drill down
into the dashboard via
linked boards
Interact with the Hichert
chart
Compare each bar with
another one and
calculate absolute and
percentage deviations
on the fly
Lumira embedded
predictive forecasting

© 2016 SAP AG. All rights reserved. 37
Design Studio Template for Data ExplorationVideo here: https://www.youtube.com/watch?v=1fdxkwaJJGc

© 2016 SAP AG. All rights reserved. 38
SAP BusinessObjects Design Studiofor building analytic applications, personalized dashboards, and planning applications
Supports Universe data
sources, BW, and HANA
Empower end users to
compose their own
dashboards
Create input-enabled
planning applications against
BW-IP or the BPC Embedded
model
Native support for virtually all
BW metadata types
Deploy Design Studio
dashboards to all 3 platforms:
BI Platform, BW, and HANA

© 2016 SAP AG. All rights reserved. 39
Enable End Users To Create Their Own Composite
Dashboards
Smart Object Gallery
Application designers
determine the degree of re-
use of individual
components
Users are empowered to
create and recreate their
own composeable
dashboards
Agility benefit: End users
can quickly create the
dashboard layout they want
Governance benefit: IT
provides reusable, trusted
dashboard components

© 2016 SAP AG. All rights reserved. 40
SAP Cloud for Analytics Overview

© 2016 SAP AG. All rights reserved. 41
BI Capabilities

© 2016 SAP AG. All rights reserved. 42
Where to Find More Information
Lumira Main Site with Tutorials: http://saplumira.com
Lumira Official Product Tutorials: http://scn.sap.com/docs/DOC-26507
Lumira Extensions: http://www.sap.com/bi-partner-extensions
Lumira Blog: http://scn.sap.com/community/lumira/blog
Lumira on SCN: http://scn.sap.com/community/lumira
Lumira Enablement: http://scn.sap.com/docs/DOC-55921
Lumira Webinars: http://scn.sap.com/docs/DOC-52806
Lumira Roadmap http://service.sap.com/roadmaps * (then Analytics SAP Lumira)
* Requires login credentials to the SAP Service Marketplace

Summary and Next Steps

© 2016 SAP AG. All rights reserved. 44
Call to Action
• Run a holistic BI Strategy workshop: www.sap.com/bistrategy
• Establish your data strategy with an Information Governance Assessment
workshop. (Target: IT-Project Managers, Directors, LOB Leads).
• Get ready for the newest innovations by upgrading to BI 4.1. Schedule a BI
Upgrade Technical workshop (Target: IT-Project Managers, System
Administrators/Architects).
• Dive deeper with Lumira and Design Studio Technical 2-3 day workshop (Target:
BI Administrators, Designers, and Analysts).
• Play with the sample datasets that ship with Lumira Desktop
• Check out tutorial videos on YouTube and SCN