self-reported facilitators and barriers to trail use along
TRANSCRIPT

Self-Reported Facilitators and Barriers to Trail Use Along an Urban
Community Trail
By
Jacob Taylor
Submitted in Partial Fulfillment of the Requirements for the Degree
Master of Public Health
Supervised by:
Scott McIntosh, PhD
Department of Public Health Sciences
School of Medicine and Dentistry
University of Rochester
Rochester, NY
2013

Taylor MPH Thesis Paper
2
Table of Contents Section Pages
I. Abstract 3-4 II. Introduction 5-9
i. Project History 5-6 ii. Survey Development 6-8 iii. Survey Administration Protocol and Data Collection 8-9
III. Background 9-14 i. Health Status in the U.S./Rochester and Correlates 9-11
with Physical Activity
ii. Relationship with the Built Environment 11-13
iii. Impact of Trails on Physical Activity 13-14
IV. Specific Aims 15
V. Methods and Data Analysis Plan 15-18
i. Quantitative Analysis of Trail Data 16-17
ii. Qualitative Analysis of Market Data 18
VI. Results 19-37 i. Quantitative Results 19-34 ii. Qualitative Results 34-37
VII. Discussion 38-45 VIII. Limitations 46-36 IX. Conclusion 48-49 X. Acknowledgements 49 XI. References 50-53

Taylor MPH Thesis Paper
3
I. Abstract
Background: Physical inactivity and obesity continue to be among the biggest
contributors to public health problems in the United States. National guidelines
recommend the development of improved preventive and community opportunities
for individuals to engage in physical activity. Environmentally available public
spaces provide one such possibility for individuals to engage in more active
lifestyles. In the local Rochester community, the Genesee Riverway Trail is an
extensive environmental resource that is potentially being underutilized. This cross-
sectional study will investigate possible facilitators and barriers to use of this Trail.
Objective: Assess the relative odds of self-reported infrequent trail use associated
with perceived barriers and individual characteristics among a community sample
of adults.
Methods: This study used both qualitative and quantitative analysis approaches
and data from a trail survey conducted in the summer of 2012 by the Environmental
Health Sciences Center. Trail use is the dependent outcome of interest and was
dichotomized into frequent and infrequent users. Adjusted and unadjusted logistic
regressions were performed for each factor (e.g. perceptions of access and crime)
and Trail use. A qualitative thematic analysis of open-ended questions from a
separate survey of community members at the public market was conducted to
further explore the determinants of frequency of trail use.
Results: Roughly 42% (108/257) of the trail respondents reported using the trail
between 0-5 times per month, while 60% of the market respondents reported using
the trail never or less than 5 times per month. People who reported the trail was

Taylor MPH Thesis Paper
4
poorly connected to other places were more likely to be infrequent trail users
(OR=3.83, 95% CI 1.28-5.05). Living farther from the increased the likelihood of
being an infrequent trail user, an effect that varied by individual level characteristic.
Conclusion: A better understanding of what perceptions individuals have
surrounding trail use will allow more targeted interventions and improvements in
the local environment to support more active lifestyles and greater levels of physical
activity. The results from this study reveal target areas and sampling technique
issues that should be considered in further research and improvement
implementation projects.
Taylor MPH Thesis Paper
5
II. Introduction
Project History
In January of 2012 the Community Outreach and Engagement Core (COEC) of
the University of Rochester Environmental Health Sciences Center began a Health
Impact Assessment of the potential health implications of Rochester’s Local
Waterfront Revitalization Program (LWRP). The LWRP is a state funded program to
maintain and improve New York’s waterways. In the summer of 2012 community,
trail, and beach surveys were conducted to assess neighborhood well-being, how
waterfront resources are currently used, how current use impacts health, and how
those relationships might change based on LWRP recommendations.
Many insights were gained from the three surveys that influenced the
development of this study. Community surveys in the southeast quadrant of
Rochester were administered at community events and door to door. Among a
range of indicators, data showed that 58% of African Americans meet the CDC
recommendations for weekly physical activity compared to 71% of Whites.
Additionally, less crime was also indicated as a change that would strongly benefit
health.1
The trail survey was adapted from three sources: the National Bicycle and
Pedestrian Documentation Project2, the Parks and Trails NY Trail User Survey3, and
the Portland State University Trail Use Survey.4 Additional questions were added to
assess the barriers to using the trail more (e.g. more time, better connectivity,
proximity).1
Durand Beach and Ontario Beach were also investigated as public resources
given that they fall within the boundaries of the Local Waterfront Revitalization

Taylor MPH Thesis Paper
6
Program. The beach survey was developed largely from the Eastern Lake Ontario
Beach survey, which helped to identify use patterns. As with the trail survey,
questions were added to assess factors that might facilitate or inhibit beach use (e.g.
safety, maintenance, water quality). Among this particular sample, better water
quality, maintenance, and facilities were found to be factors that potentially mediate
beach use.
The previous surveys were conducted to assess neighborhood
characteristics, current use of public environmental space (specifically regarding to
Genesee River Trail and Beach Use), and perceptions of changes that might increase
or limit use. The trail survey is available in Appendix A.
Survey Development
In the Fall of 2012, I conducted an additional survey at the Rochester Public
Market. The goal was to obtain data from people who never or infrequently use
publicly available spaces as active resources. These data were intended to
compliment the data already gathered from the summer. This Market survey,
available in Appendix B, was adapted from both the trail and the beach surveys, and
included questions on use and a range of potential resource specific barriers. Part 1
of the market survey included questions about beach use and potential limiting
factors.
Part 2 of the Market survey assessed waterfront trail use in a similar way to
the Trail Survey. Questions on frequency, types of activity, and barriers to trail use
questions were kept largely the same. ‘Never’ was substituted for ‘It’s my first time’

Taylor MPH Thesis Paper
7
for the frequency question, and an additional “lack of knowledge barrier”1 was
added. Additionally, a question on perceived access to the trail and a question on
willingness to use the trails were added with the rationale that some non-users
might not think they can get to the trail or might simply have no desire to use them.
Finally, questions were added to investigate perceptions of crime among those who
use the trails or beaches infrequently. The two main questions added were: “In your
opinion, the safety and security along this trail is: (Excellent, Good, Fair, Poor, Don’t
know)”; “How often does crime prevent you from using the waterfront trails?
(Often, Sometimes, Rarely, Never, Don’t know).”
Monroe County has some of the highest crime rates in the state. In 2010,
Monroe County had an index crime rate of 3586.2 (vs. 2318.8 state rate), violent
crime rate of 389.1 (vs. 391.2), and property crime rate of 3197.1 (vs. 1928.6), all
per 100,000 people.5 Initial indications from the trail surveys revealed that safety
may be a potential barrier to use, especially among women, so questions were
added to more specifically address this concern.
The final part of the Market survey included the same demographic
questions from the previous surveys of race, ethnicity, age, gender, income, and
home address or cross street. From the literature it was also found that BMI,
education, and time spent in the community were related to physical activity and
trail use, so this information was also included.
Before data collection began the survey was pre-tested on 5 subjects to
assess ease of administration and quality of responses. Slight modifications were
1 Response added for the question: I would use the waterfront trails in the City of Rochester more often if…?

Taylor MPH Thesis Paper
8
made to produce the final survey. During data collection it was observed that some
of the spacing between questions was causing participants to miss or skip some
questions, especially in the demographic section; so a new version with improved
formatting was used about a third of the way through. Additionally, the original
survey contained open-ended questions to elicit reasons for why individuals were
not using the trails or beaches. However, about two-thirds through collection it was
determined that useful responses were not being gained, so the open-ended
questions regarding perceptions of access and trail use were removed from the
survey. This was done with the intention of shortening the survey to allow the
recruitment of more subjects. The University of Rochester Research Subjects Review
Board approved each survey iteration.
Market Survey Administration Protocol-Data Collection
Surveying was conducted at the Rochester Public Market (RPM) on Saturday
mornings between October 6th, 2012 and November 17th, 2012. The primary
investigator and another Masters of Public Health Student conducted all the surveys.
Before the first day of sampling, protocol and a standardized method for
approaching and conducting the surveys were reviewed to assure maximum
uniformity in collection.
Surveying was conducted at the Rochester Public Market because it was
hypothesized that if those individuals had the ability to get to the market, in theory
they could get to a trail or a beach too. Additionally, previous survey work at RPM
conducted by the research team indicated strong socioeconomic diversity, which
was an important consideration for this study. However, this design might have

Taylor MPH Thesis Paper
9
systematically failed to capture the individuals that truly cannot access
neighborhood resources, such as the Market and the trails or beaches. This was a
major drawback of this sampling method because those individuals are the least
likely to have social support and access to resources that can positively impact their
health. However, given the scope of the Health Impact Assessment project the
sampling frame was appropriate
After data collection, surveys were coded with an identification number and
entered into a database. Double entry of the data was conducted to ensure
agreement and reconcile entry errors. It should be noted that during data collection
a few qualitative accounts (i.e. need for more police patrol on trails, criminals
coming to the beaches) were volunteered by individuals. These were recorded
separately.
This study analyzed the barriers to potential trail use among both frequent
and infrequent users and will help inform future studies as well as the Health
Impact Assessment that will make recommendations to the City of Rochester for the
LWRP.
III. Background
Health Status in the U.S./Rochester and Correlates with Physical Activity
In the U.S., the current combined overweight and obesity prevalence is 68.0%
(95% CI, 66.3%-69.8%)6, a burden that many link to the lack of physical activity in
our population.7,8 In 2010, the Centers for Disease Control and Prevention found
that 25.4% of people nationally reported no leisure-time activity8 with more than
50% overall not receiving adequate amounts of exercise.9 These numbers persist

Taylor MPH Thesis Paper
10
despite accepted knowledge that regular physical activity can reduce the risk of
various cancers, cardiovascular events, and stroke.9 It was estimated that physical
activity along with poor diet accounted for 14% and 16.6% of the total causes of
death in 1990 and 2000, respectively.10 These striking numbers continue to demand
national guidelines to reduce physical inactivity and the subsequent contribution to
disease. As a result, reducing physical inactivity has become the primary objective
for the physical activity related goals for Healthy People 2020.11
Similar rates of physical inactivity and the subsequent overweight and
obesity burden are also reflected locally in Rochester, New York. In 2006, 61% of
adults in Monroe county were overweight or obese, 3% higher than the state
average.12 Although overall physical inactivity rates in Rochester decreased by 12%
from 2000 to 2006, this was a disproportionate decline as all subgroups improved
except African Americans and Latinos.12 African Americans and Latinos reported no
improvement or a slight decrease in activity (34% and 36%) for the two groups
respectively, while the overall rate of physically inactivity decreased from 27% to
15% for the county in the six year period.12 This disparate improvement in physical
activity could be one indication for why obesity rates increased at significantly
higher rates from 2000 to 2006 among African American and Latino populations. In
2006, 39% of African Americans and 37% of Latinos were obese, 7% and 20%
increases from 2000.12 This is contrasted with only 4% and 5% increases in obesity
among whites and non-Latino’s respectively during the same time period.12 These
numbers point to disparities in physical activity levels and corresponding burdens
of obesity within the community. Physical inactivity and related obesity is also felt

Taylor MPH Thesis Paper
11
economically, costing the United States $117 billion in 2010, further straining an
already resource-deprived health care system.9 Thus, there is an urgent need to
develop sustainable, cost-effective strategies for increasing physical activity and
improving overall health.
Relationship with the Built Environment
A growing body of literature shows that factors in the built environment can
both facilitate and restrict physical activity. One guiding framework suggests that
the built environment can broadly include four main groups: functionality, safety,
aesthetics, and destinations.13 Functionality characteristics include walking
surfaces, street width, traffic, and permeability; safety attributes include both
personal and traffic safety; aesthetic factors include streetscape and views; and
destination factors include the existence of facilities.13 These groupings include a
wide range of factors in the physical environment that can facilitate or limit the
likelihood an individual might engage in physical activity within a given community.
For instance, a well maintained walking path might be a functional predictor of
physical activity in a certain community, while lack of lighting might be a safety
barrier. Some positive associations between physical activity and built environment
characteristics such as convenience and accessibility to trails, connectivity of trails,
and safety and security within ones neighborhood have been observed.14,15 In one
population-based analysis from the Nevada Behavioral Risk Factor Surveillance
System, Yang et al. found that commute time, violence, population density, and
urbanization were all significantly associated with an individual's likelihood of
engaging in physical activity.16 Other studies have found no associations between

Taylor MPH Thesis Paper
12
neighborhood crime, accessibility, and aesthetic factors with physical activity.15,17
Associations within each domains have been thoroughly investigated, often
providing inconclusive results.
Many built environment characteristics can be objectively measured to
assess how various factors might predict rates of physical activity within a
population. In some ways objectively measuring both the quantity of and the
distance to trails, parks, and other recreational resources is beneficial to
substantiating claims that people may be physically active or not because of mere
accessibility to spaces to do so. Likewise, the density of a population and the degree
of urbanization might shed light on how factors in the environment that might deter
people from being physical activity.
Although many studies on the built environment have assessed structural
and objective measures that to varying degrees influence physical activity,
individual and personal level characteristics, as well as personal perceptions of the
built environment also heavily predict the degree to which someone is physically
active. The same study by Yang et al. also found that age, education, income, BMI,
and life satisfaction were significantly associated with the odds of engaging in
leisure time physical activity.16 In addition to socio-economic status factors,
perceived characteristics within the environment and local neighborhood often
influences the likelihood someone will be physically active. In one study by Roman
and Chalfin, perceived fear of walking due to crime in the neighborhood remained
significant even after objective measures of gang and violent crime numbers were
added to the model,14 suggesting that perceptions within the built environment
Taylor MPH Thesis Paper
13
have some influence on individual behavior. If individuals perceive that they won’t
be safe in recreational spaces or if they believe that getting to such a place is too far
away, then it is likely that they will not engage in physical activity in the outdoor
environment.
Impacts of Trails on Physical Activity
The development and existence of a trails within communities has been one
aspect of the built environment that has received increased attention in the
literature as permanent fixtures that have the potential to provide opportunities for
physical activity at potentially low costs.18 Individuals can use trails for
transportation, recreation, walking, cycling, and running among other activities that
allow opportunities for physical activity.
However, in 2011 the first ever review of the effects of trails on physical
activity found mixed effects, calling for further research to evaluate the potential
positive effects of trail use.19 Some studies observed no increases in physical
activity, while others have found that perceptions of living close to a trail were
associated with an increased odds of being active.20, 21
Within the literature, a social-ecological approach is often used to describe
different associations with trail use and physical activity.19 Individual characteristics
such as age, race, education, income, and gender have all produced varying
correlations with trail use. For instance in one study, intensity of trail use increased
with age,22 while in another study for every 10-year increase in age, respondents
were 33% likely to be users of a community trail.23 Similar mixed findings were
found with race and frequency of trail use.21, 24 The majority of studies found

Taylor MPH Thesis Paper
14
positive associations between education and trail use.23,25,26 Income and gender also
saw mixed results. For example, one study revealed that those with income of
$35,000 or more were 70% more likely to use a walking trail in a rural
community,26 whereas another study produced null associations between income
level and frequency of walking.25 In most of the studies examined males were
generally more likely to use trails and public space for physical activity.
This study specifically analyzed the different facilitators and barriers to trail
use. The most frequent correlation to trail use is access, or distance to a particular
trail. For instance, trail use differed with greater perceived distance to the trail, a
difference that was supported by objective measures.27 Other aspects of a trail such
as condition and maintenance of the trail have been found to be a facilitator or
barrier to use depending on the state of the factor. One study found that subjects
were 32% and 73% more likely to use a trail in excellent condition when compared
to a trail in fair or poor condition, respectively.28 Other factors such as trail facilities,
safety, services, and trail design have produced mixed results as either facilitators or
barriers to trail use.19 These factors were reviewed in this study as they relate to
perceptions of individuals in the Rochester area who might utilize the local Genesee
Valley Trail System.
This type of research has the potential to achieve the Healthy People 2020
objective of developing policies on the environment and trail systems to help
promote greater levels of physical activity in the community.11 Increasing research
in this area has shown that the creation of environmental opportunities for physical
activity, such as trails, increases overall level of physical activity in the community.

Taylor MPH Thesis Paper
15
In one study evaluating the effect of two new trails in West Virginia, 52% of regular
exercisers (> 3 times per week) and 98% of new exercisers (< 3 times per week)
reported increases in physical activity since using the trails, with statistically
greater increases in physical activity among new exercisers than regular
exercisers.29 This suggests that developing environmental opportunities for physical
activity is especially important for less active individuals. This is support by other
data that shows that trail users are more frequently active than non-trail users.30
Investigating how individuals exercise in the local Rochester community and what
perceptions are held about the local Genesee Trail System will provide useful
information for targeting interventions to help increase physical activity for the
least active individuals, as well as the larger community.
IV. Specific Aims
Primary Aim: Assess the relative odds of infrequent trail versus frequent
trail use with individual characteristics (e.g. Race, Income, Gender) and
perceived barriers (e.g. perceived lack of access or time) among a sample of
trail users.
Secondary Aim: Qualitatively describe the characteristics of infrequent or
never users among a sample of trail users and non-users.
V. Methods and Data Analysis
This study combined quantitative and qualitative approaches to analyze the
factors that predict trail use. The primary analysis used data collected on the
Genesee Riverway Trail by the Healthy Waterways project in June and July of 2012.
A second, qualitative and thematic analysis of the qualitative open-ended responses
Taylor MPH Thesis Paper
16
from the market survey was used to triangulate the data and helps interpret the
main findings. This second data set was collected from the Rochester Public Market
in October and November of 2012.
Quantitative Analysis of Trail Data
The primary analysis of the trail data examined the odds of infrequent trail
use associated with different individual characteristics (e.g. Race, Age, Income) and
perceived barriers (e.g. perceptions of a lack of access or time) to trail use.
Two questions from the survey were used to assess the potential barriers.
The first question asked about perceived safety and security on a Likert scale. The
responses were dichotomized into Excellent and Good vs. Fair and Poor to produce
the first safety concern barrier. The second question from the survey that was used
is “I would use the trail more often if…” Dichotomous responses were attained and
represent the following barriers: Lack of time, having to travel with small children,
poor major street connections, Far distance to places, poor connections to other
places, lack of safety/security, having to carry things, poor trail condition, use of
another trail, or lack of desire to use the trail more.
The dependent variable was “trail use.” Options for trail use in the past
month included: first time, 0-5 times, 6-10, 11-20, 21-29, daily, and don’t know. Trail
use was dichotomized into Frequent (> 5 times in the past month) vs. Infrequent
Users (< 5 times in the past month). A total of 265 trail surveys were collected.
Individuals were excluded if the outcome variable was missing or “don’t know,” or if
respondents were first time users with a home address outside of Monroe County
and the surrounding area. This was done to exclude individuals who were just

Taylor MPH Thesis Paper
17
visiting and using the trails only once. Analyses were run on the final sample of 257
individuals.
We estimated the relative odds of “infrequent trail use” associated with
perceived barriers using logistic regression. We regressed “infrequent trail use” (< 5
times in the past month vs. >5 times in the past month) against each self reported
barrier (Not enough time to use the trails, perceiving the trail poorly connected to
other places, feeling unsafe and insecure, no desire to use the trail more, and Likert
feelings of safety and security along the trail) and subject characteristics (Gender,
Age [18-29, 30-45, 46-55, < 45 vs. >45], Race [White, Non-White], Ethnicity [Non-
Hispanic, Hispanic], Income [$10,000-$39,000, $40,000-$74,999, >$75,000], and
Access [Within 0.5 miles from trail, Between 0.5 and 1.5 miles, Greater than 1.5
miles], separately. Each subject’s home address was geocoded by Healthy
Waterways project staff to produce an “access” variable, which we categorized into
distances from the trail of 0.5 miles, 0.5-1.5 miles, and greater than 1.5 miles from
the trail.
Next, a multivariable model was constructed, including all the perceived
barriers and individual level factors identified above in the univariate analyses, to
determine if they were all independent predictors of infrequent trail use. Only
subjects with complete data for all of the variables were included in the analyses
(N=234).
Finally, we evaluated if our results were sensitive to how we defined
“infrequent trail use.” First, we dichotomized trail use into less than or equal to 10
times per month vs. between 11 times and daily use per month. We then re-ran the

Taylor MPH Thesis Paper
18
models described above and compared effect estimates for each perceived barrier
and individual level characteristic from both sets of models. All analyses were
performed using ArcGIS10 and SAS Version 9.2 (SAS Institute, Cary, NC).
Analysis of Market Data
Analysis of the market data was conducted in two ways. First, descriptive
statistics from the market survey was compared to the trail survey and qualitatively
described for differences. The additional factors from the market survey on
perceptions of crime along the trail, education level, BMI, smoking status, and years
living in Monroe County provided further insight into the barriers to trail use.
The second part of the Market data analysis qualitatively analyzed a series of
open-ended responses that were reported on the market survey. Open-ended
questions were intended to prompt users who never used the trail to describe why
they had never used it. The primary investigator and a Healthy Waterways
researcher independently organized the responses into 4 domains, after which the
themes and categorization techniques were compared and reconciled. This thematic
analysis served to triangulate the previous quantitative approaches and improve the
reliability of the findings.
Taylor MPH Thesis Paper
19
VI. Results
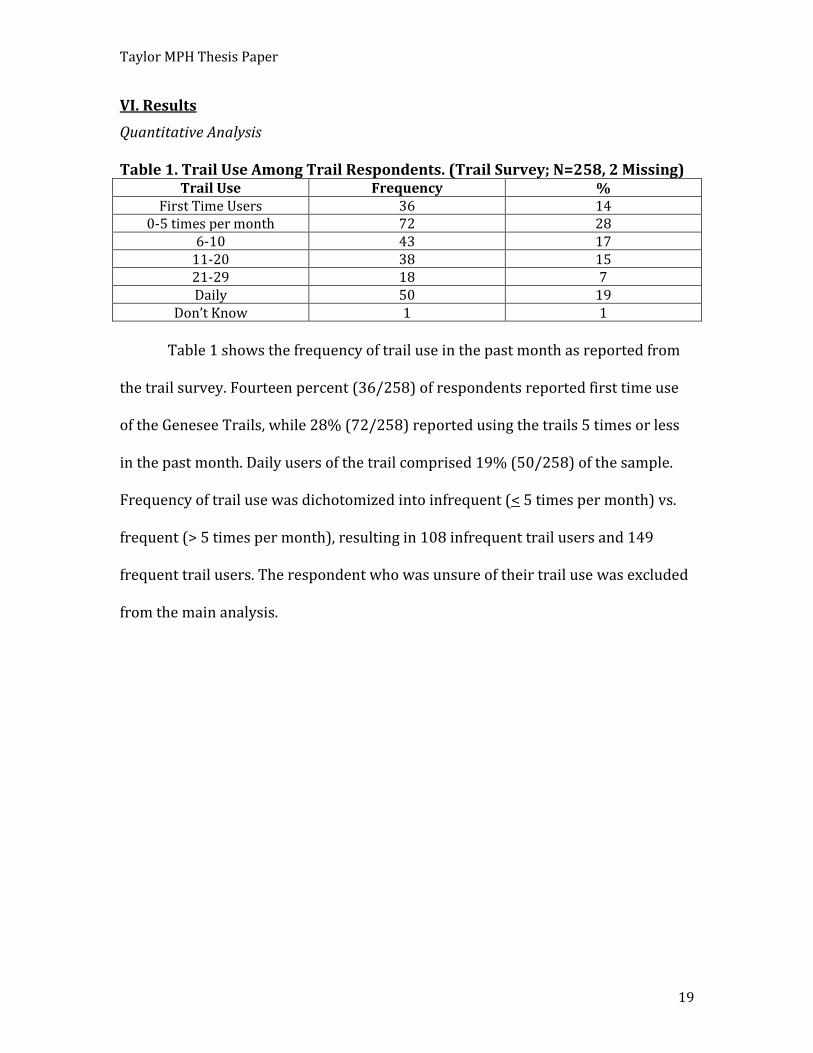
Quantitative Analysis Table 1. Trail Use Among Trail Respondents. (Trail Survey; N=258, 2 Missing)
Trail Use Frequency % First Time Users 36 14
0-5 times per month 72 28 6-10 43 17
11-20 38 15 21-29 18 7 Daily 50 19
Don’t Know 1 1
Table 1 shows the frequency of trail use in the past month as reported from
the trail survey. Fourteen percent (36/258) of respondents reported first time use
of the Genesee Trails, while 28% (72/258) reported using the trails 5 times or less
in the past month. Daily users of the trail comprised 19% (50/258) of the sample.
Frequency of trail use was dichotomized into infrequent (< 5 times per month) vs.
frequent (> 5 times per month), resulting in 108 infrequent trail users and 149
frequent trail users. The respondent who was unsure of their trail use was excluded
from the main analysis.

Taylor MPH Thesis Paper
20
Table 2. Distribution of Perceived Barriers of Survey Respondents by Infrequent or Frequent Trail Use. (Trail Survey; N=257)
Infrequent Trail Users (<5 Times a Month)
N=108
Frequent Trail Users (>5 Times a Month)
N=149
N % N %
Perceived Barriers Not enough time to use trails 46 43 46 31
Having to travel with children 1 1 1 1
Difficult to cross major streets 5 5 5 3
Places too far away to use trail 5 5 3 2
Trail poorly connected to other places
13 12 8 5
Feeling unsafe and insecure 4 4 15 10
Having to carry things 1 1 3 2
Poor trail condition 2 2 7 5
Use another trail 7 6 0 0
Lack of desire to use trail more 27 25 72 48
Missing 4 4 5 3
Safety and Security Along Trail Rated as Excellent/Good 80 74 115 77
Rated as Fair/Poor 17 16 30 21
Don’t know 10 9 3 2
Missing 1 1 1 1
Table 2 shows the distribution of perceived barriers broken down by
frequency of trail use. Forty-three percent of infrequent trails users thought the
most important barrier to trail use was not having enough time compared to 31% of
infrequent users. Twenty-five percent of infrequent users reported a lack of desire
to use the trail more, whereas 28% of frequent trail users viewed this as the most
important reason preventing increased trail use. Twelve percent of infrequent users
and 5% of frequent users reported a perception that the trail is poorly connected to
other places. Not feeling safe and secure was reported by only 4% of infrequent
users, but 10% of frequent users. This difference was not reflected when asked to

Taylor MPH Thesis Paper
21
rate safety and security along the trail on a Likert scale. The mean safety and
security rating among the respondents was 1.97, corresponding to “good” safety and
security along the trail. This was not different by frequency of use.
Taylor MPH Thesis Paper
22
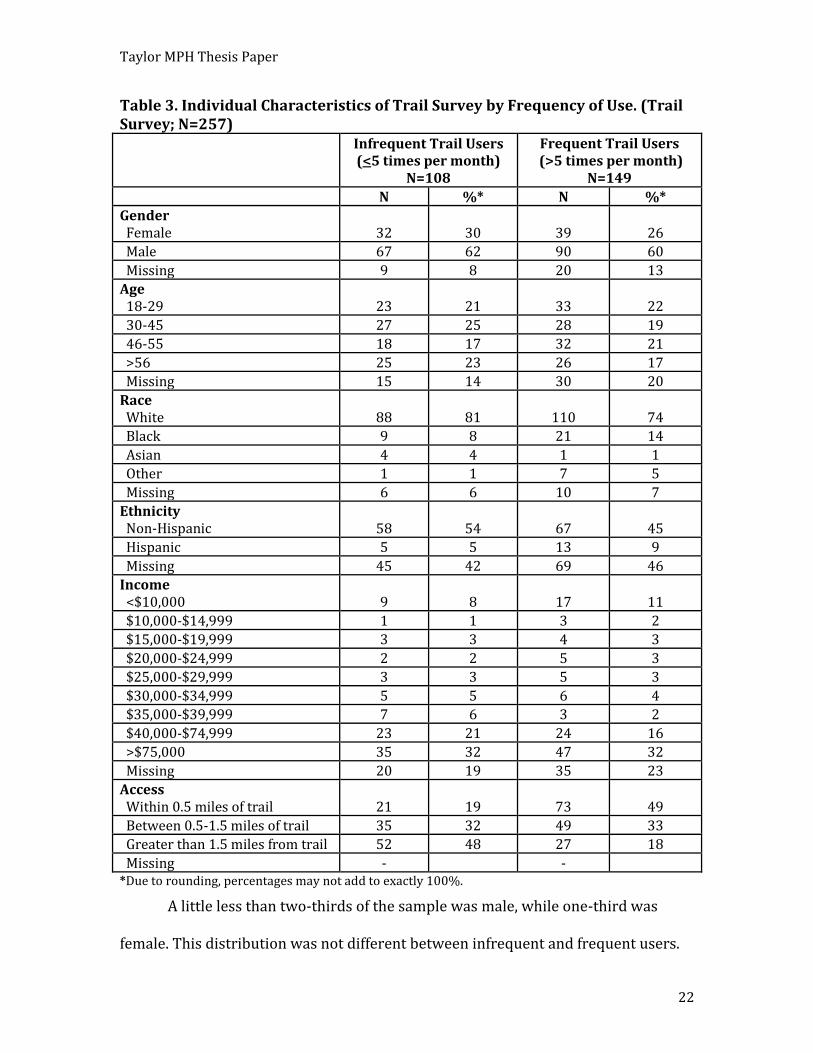
Table 3. Individual Characteristics of Trail Survey by Frequency of Use. (Trail Survey; N=257) Infrequent Trail Users
(<5 times per month) N=108
Frequent Trail Users (>5 times per month)
N=149
N %* N %*
Gender Female 32 30 39 26
Male 67 62 90 60
Missing 9 8 20 13
Age 18-29 23 21 33 22
30-45 27 25 28 19
46-55 18 17 32 21
>56 25 23 26 17
Missing 15 14 30 20
Race White 88 81 110 74
Black 9 8 21 14
Asian 4 4 1 1
Other 1 1 7 5
Missing 6 6 10 7
Ethnicity Non-Hispanic 58 54 67 45
Hispanic 5 5 13 9
Missing 45 42 69 46
Income <$10,000 9 8 17 11
$10,000-$14,999 1 1 3 2
$15,000-$19,999 3 3 4 3
$20,000-$24,999 2 2 5 3
$25,000-$29,999 3 3 5 3
$30,000-$34,999 5 5 6 4
$35,000-$39,999 7 6 3 2
$40,000-$74,999 23 21 24 16
>$75,000 35 32 47 32
Missing 20 19 35 23
Access Within 0.5 miles of trail 21 19 73 49
Between 0.5-1.5 miles of trail 35 32 49 33
Greater than 1.5 miles from trail 52 48 27 18
Missing - - *Due to rounding, percentages may not add to exactly 100%.
A little less than two-thirds of the sample was male, while one-third was
female. This distribution was not different between infrequent and frequent users.
Taylor MPH Thesis Paper
23
Of the respondents who provided information on race and ethnicity, the majority
was white (82%) and non-Hispanic (87%). In general the sample reported incomes
of greater than $40,000. Infrequent users were more likely to live greater than 1.5
miles from the Genesee Riverway Trail (48% vs. 18%), whereas frequent users were
more likely to live within 0.5 miles of the trail (49% vs. 19%).

Taylor MPH Thesis Paper
24
Table 4. Unadjusted Logistic Regressions of Infrequent Trail Use Associated with Perceived Barriers and Individual Characteristics. (Trail Survey; N=257)
* Effective Sample Size; Missing variables excluded from analysis ¥ Variables to be used in the Full Logistic Model
From Table 2 the perceived barriers that had a sample size adequate for
regression analyses (n=248) were “not having enough time,” “the trail being poorly
connected to other places,” “feeling unsafe and insecure,” “a lack of desire to use the
Unadjusted
N* OR 95% CI
Perceived Barriers Not enough time to use trails¥
248
1.63 0.96-2.74
Trail poorly connected to other places¥ 2.43 0.97-6.09
Feeling unsafe and insecure¥ 0.34 0.11-1.07
Lack of desire to use trail more¥ 0.33 0.19-0.58
Safety and Security Along Trail Rated as Fair/Poor vs. Excellent/Good 244 0.81 0.42-1.57
Individual Characteristics
Gender Male 228
1 -
Female 1.10 0.63-1.94
Age 18-29
212
1 -
30-45 1.38 0.65-2.93
46-55 0.81 0.37-1.77
>55 1.38 0.64-2.96
>45 vs. <45 0.91 0.53-1.56
Race¥ White 241
1 -
Non-White 0.74 0.49-1.14
Ethnicity Non-Hispanic 143
1 -
Hispanic 0.44 0.15-1.32
Income $10,000-$39,999
202
0.94 0.49-1.78
$40,000-$74,999 1.29 0.63-2.64
>$75,000 1 -
Access¥ Within 0.5 mile of trail
257
1 -
Between 0.5-1.5 miles of trail 2.48 1.30-4.76
Greater than 1.5 miles from trail 6.70 3.42-13.11

Taylor MPH Thesis Paper
25
trail more,” and the Likert safety and security responses (poor to excellent) (n=242).
Those who reported a time barrier were 1.63 times as likely to be an infrequent trail
user as those who did not report a time barrier (Table 4). A perception that the trail
was poorly connected to other places resulted in a 143% greater relative odds of
being an infrequent trail user. Perceiving the trail to be unsafe or lacking a desire to
use the trail was associated with a roughly 75% decreased relative odds of being a
trail user.
In the unadjusted analyses, there was little increased relative odds of being
an infrequent trail user associated with being male versus female. Age categorized
ordinally showed mixed associations with the odds of being an infrequent user,
while dichotomizing age (>45 vs. < 45) was associated with a small decreased in
relative odds of being an infrequent trail user. Non-whites had a 26% decreased
odds of being an infrequent trail user compared to whites. Income when categorized
into three groups also showed mixed associations, with a slight decrease (6%) in
odds of being an infrequent trail user for those with incomes between $10,000 and
$39,999, and a slight increase in odds for those with incomes between $40,000 and
$75, 000 (29%). In regards to accessing the trail, as distance from the trail increases
the relative odds of being an infrequent trail use also increases.

Taylor MPH Thesis Paper
26
Table 5. Adjusted Logistic Regressions Modeling Infrequent Trail Use with the Variables Identified in Table 4. (Trail Survey; N=232)
¥: Adjusted for the other variables in the model
Table 5 shows the regressions from the multivariable model that was
constructed to examine if all the factors identified as significant predictors of
infrequent trail use in the unadjusted analyses were all independent predictors
when including them all in the same model. Unadjusted and adjusted analyses were
run on the same sample of respondents (n=234). After deleting the observations
with missing data, the perceived barriers (time, safety) changed very little from the
crude regressions (Table 4). However, the relative odds of being an infrequent trail
user associated with perceiving the trail as poorly connected to other places
increased from OR=2.43 (95% CI= 0.97, 6.09) to OR=2.98 (95% CI= 1.08, 8.23). The
relative odds for Non-Whites decreased from OR=0.74 (95% CI= 0.49, 1.14) to
OR=0.58 (95% CI=0.28, 1.19) in the unadjusted multivariable model.
Adjusted regressions were then run on each of the variables adjusting for
each of the other variables that appeared to have substantial effect on trail use. After
adjustment, the only major difference in the odds estimates was for the perception
that the trail is poorly connected to other places, which increased from OR=2.98
(95% CI= 1.08, 8.23) to OR=3.83 (95% CI= 1.28, 2.25). The associations for both
perceived lack of time and safety and security on the trail moved toward the null.
Unadjusted Adjusted¥
Variables in the Model OR 95% CI OR 95% CI
Not enough time to use trails 1.60 0.93-2.74 1.35 0.75-2.45
Trail poorly connected to other places 2.98 1.08-8.23 3.83 1.28-2.45
Feeling unsafe and insecure 0.32 0.09-1.17 0.47 0.11-1.93
Non-White 0.58 0.28-1.19 0.58 0.26-1.28
Between 0.5-1.5 miles of trail 2.42 1.22-4.77 2.24 1.10-4.54
Greater than 1.5 miles from trail 6.56 3.26-13.22 6.36 3.06-13.19

Taylor MPH Thesis Paper
27
The associations between the distance variables and frequency of trail use
decreased slightly (~3-8%).
Table 6. Relative Odds of Infrequent Trail Use Associated with Perceiving the Trail as Poorly Connected to Other Places by Individual Characteristics. (Trail Survey; N=257)
Perceived Barriers N OR 95% CI
Trail Poorly Connected to Other Places
Female 67 1.17 0.16-8.85
Male 153 5.15 1.36-19.56
Age <45 108 3.09 0.89-10.76
Age >45* 93 - -
White 191 4.58 1.22-17.21
Non-White 41 1.52 0.22-10.38
Hispanic 18 8.00 0.53-120.64
Non-Hispanic 124 3.12 0.58-16.75
$10,000-$39,999 126 1.43 0.45-4.54
$40,000-$74,999* 45 - -
>$75,000* 78 - -
Within 0.5 mile of trail 92 5.23 1.26-21.73
Between 0.5-1.5 miles of trail 80 1.91 0.40-9.12
Greater than 1.5 miles from trail 76 2.31 0.25-21.79
* Contains zero cells
Stratification reveals that the relative odds of being an infrequent trail user
associated with perceiving the trail as poorly connected to other places varies by
individual characteristics. Males had almost five times the odds of being an
infrequent user as females if that perception is held. Similarly, White respondents
had 300% greater relative odds than Non-Whites of infrequent trail use associated
with a belief that the Trail is poorly connected to other places. This may indicate
that certain conditions of the trail are larger barriers to use for some groups more
than others. Stratifying also shows that all 17 respondents who perceived the trail
Taylor MPH Thesis Paper
28
as poorly connected to other places are under the age of 45 and have incomes
between $10,000 and $39,999.
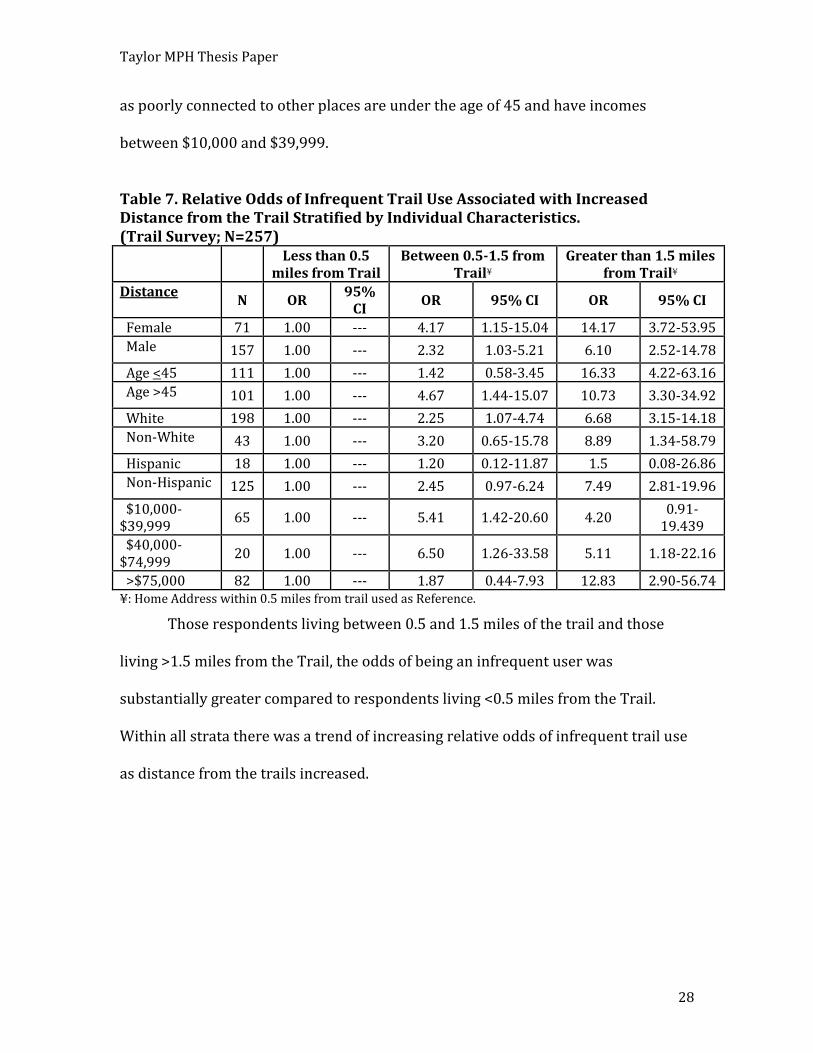
Table 7. Relative Odds of Infrequent Trail Use Associated with Increased Distance from the Trail Stratified by Individual Characteristics. (Trail Survey; N=257) Less than 0.5
miles from Trail Between 0.5-1.5 from
Trail¥ Greater than 1.5 miles
from Trail¥
Distance N OR
95% CI
OR 95% CI OR 95% CI
Female 71 1.00 --- 4.17 1.15-15.04 14.17 3.72-53.95
Male 157 1.00 --- 2.32 1.03-5.21 6.10 2.52-14.78
Age <45 111 1.00 --- 1.42 0.58-3.45 16.33 4.22-63.16
Age >45 101 1.00 --- 4.67 1.44-15.07 10.73 3.30-34.92
White 198 1.00 --- 2.25 1.07-4.74 6.68 3.15-14.18
Non-White 43 1.00 --- 3.20 0.65-15.78 8.89 1.34-58.79
Hispanic 18 1.00 --- 1.20 0.12-11.87 1.5 0.08-26.86
Non-Hispanic 125 1.00 --- 2.45 0.97-6.24 7.49 2.81-19.96
$10,000-$39,999
65 1.00 --- 5.41 1.42-20.60 4.20 0.91-
19.439
$40,000-$74,999
20 1.00 --- 6.50 1.26-33.58 5.11 1.18-22.16
>$75,000 82 1.00 --- 1.87 0.44-7.93 12.83 2.90-56.74 ¥: Home Address within 0.5 miles from trail used as Reference.
Those respondents living between 0.5 and 1.5 miles of the trail and those
living >1.5 miles from the Trail, the odds of being an infrequent user was
substantially greater compared to respondents living <0.5 miles from the Trail.
Within all strata there was a trend of increasing relative odds of infrequent trail use
as distance from the trails increased.

Taylor MPH Thesis Paper
29
Table 8. Trail Use Among Market Respondents (Market Survey; N=123, 4 Missing)
Trail Use N % Never 18 15
1-5 times per month 54 45 6-10 21 17
11-20 13 10 21-29 12 10 Daily 0 0
Don’t Know 1 0
Table 8 shows the distribution of trail use in a typical warm weather month as
reported from the Market survey. Fifteen percent (18/119) of respondents reported
that they had never used the trail, while 45% (54/119) of subjects reported using
the trail 1-5 times in a typical warm month. Ten percent of the sample used the trail
21-29 times per month, while no one reported using the trails daily. Frequency of
trail use was dichotomized in the same way as the trail user survey (<5 vs. >5 times
per month), resulting in 61% (72/118) infrequent users and 39% (46/118)
frequent users.

Taylor MPH Thesis Paper
30
Table 9. Distribution of Perceived Barriers of Market Respondents by Infrequent or Frequent Trail Use. (Market Survey; N=118)
Infrequent Trail Users (<5 Times a Month)
N=72
Frequent Trail Users (>5 Times a Month)
N=46
N % N %
Perceived Barriers Not enough time to use trails 48 67 24 52
Having to travel with children 3 4 1 2
Difficult to cross major streets 15 21 9 20
Places too far away to use trail 18 25 9 20
Trail poorly connected to other places 26 36 20 43
Feeling unsafe and insecure 34 47 8 17
Having to carry things 3 4 3 7
Poor trail condition 12 17 7 15
Use another trail 5 7 4 9
Lack of Knowledge about Trail 30 42 10 22
Safety and Security Along Trail Rated as Excellent/Good 23 32 32 70
Rated as Fair/Poor 34 47 13 28
Don’t know 15 21 1 2
Crime Prevent Trail Use Rated as Often/Sometimes 27 38 9 20
Rated as Rarely/Never 34 47 36 78
Don’t know 10 14 1 2
Missing 1 1 - -
Crime Prevent Walking in Neighborhood Rated as Often/Sometimes 14 19 5 11
Rated as Rarely/Never 56 78 41 89
Don’t Know 2 3 - -
Both infrequent and frequent users reported “not enough time” as the most
common barrier to trail use, 67% and 52% respectively. Infrequent trail users also
commonly reported the trail being poorly connected to other places (36%), feeling

Taylor MPH Thesis Paper
31
unsafe and insecure (47%), and a lack of knowledge about the trail (42%) as being
significant barriers to increased use. Forty-three percent of frequent users also
reported the trail being poorly connected to other places as a significant barrier.
Frequent users rated the safety and security along the trail substantially
better than infrequent users (70% vs. 32%). In addition, 47% of infrequent users
perceived the trail as fair or poor compared to only 28% of frequent users who
viewed the safety of the trail as such. Similarly, 38% of infrequent users reported
crime prevented trail use often or sometimes compared to only 20% of frequent
users.

Taylor MPH Thesis Paper
32
Table 13. Sensitivity Analyses of Trail Data. (Trail Survey; N=257)
Sensitivity Analyses were run to see if dichotomizing trail use differently
caused any other variables to produce associations with frequency of trail use. In
these analyses infrequent trail use was defined as < 10 times per month and
frequent trail use was defined as > 10 times to daily usage. This breakdown was
chosen to result in large enough groups to maintain reasonable power, as well as
reflect users that may be gaining closer to their recommended levels of physical
activity43 on the trail (3-7 times a week). The results from these analyses, shown
below in Table 13, did not substantially differ from the main analyses. However, it is
worth noting that the effect associated with the perception of feeling unsafe and
insecure moved toward the null, the effect for gender increased, and all of the
ordinal age and income effects increased over 1.0.
N*
Unadjusted
OR 95% CI
Perceived Barriers Feeling unsafe and insecure
248
0.96 0.37-2.47
Safety and Security Along Trail Fair/Poor vs. Excellent/Good
Individual Characteristics Gender Male
228 1 -
Female 1.59 0.89-2.87
Age 18-29
212
1 -
30-45 1.21 0.57-2.59
46-55 1.33 0.61-2.92
>55 1.07 0.50-2.31
>45 vs. <45 0.92 0.53-1.60
Income $10,000-$39,999
202
1.06 0.56-2.01
$40,000-$74,999 2.05 0.94-4.44
>$75,000 1 -

Taylor MPH Thesis Paper
33
Table 10. Individual Characteristics of Market Respondents by Frequency of Use. (Market Survey; N=118) Infrequent Trail Users
(<5 Times a Month) N=72
Frequent Trail Users (>5 Times a Month)
N=46
Individual Characteristics N % N %
Gender Female 35 49 23 50
Male 29 40 19 41
Missing 8 11 4 9
Age 18-29 10 14 15 33
30-45 14 19 9 20
46-55 26 36 11 24
>55 18 25 9 20
Missing 4 6 2 4
Race White 51 71 35 76
Black 12 17 4 9
Asian 2 3 2 4
Other 5 7 2 4
Missing 2 3 3 7
Ethnicity Non-Hispanic 52 72 34 74
Hispanic 1 1 4 9
Missing 19 26 8 17
Income <$10,000-$39,999 21 29 12 26
$35,000-$74,999 25 35 15 33
>$75,000 22 31 17 37
Missing 4 32 2 4
Education Some or No High School 0 0 0 0
High School Graduate 2 3 0 0
Vocational/Technical 2 3 1 2
Some College 17 24 5 11
College Graduate or higher 47 65 38 83
Missing 4 6 2 4
BMI <25 21 29 18 39
25-30 20 28 13 28
>30 18 25 8 17
Missing 13 18 7 15
Smoking Never Smoked 47 65 30 42
Currently Smoke 4 6 5 11

Taylor MPH Thesis Paper
34
Former Smoker 17 24 9 20
Missing 4 6 2 4
The Market sample had similar distributions of genders and race/ethnicity,
for frequent and infrequent users. Whites and Non-Hispanics made up 71% and
72% of the infrequent users, with a similar distribution for frequent users. About a
third of both infrequent and frequent users reported incomes in each of the three
categories. The majority of respondents were college graduates or higher for both
infrequent (65%) and frequent users (83%). More infrequent users (24%) reported
some college education compared to frequent users (11%). Thirty-nine percent of
frequent users had a Body-Mass-Index below 25 compared to 29% of infrequent
users, while 45% of frequent users were overweight or obese compared to 53% of
infrequent users. Sixty-five percent of infrequent users and 42% of frequent users
reported never smoking.
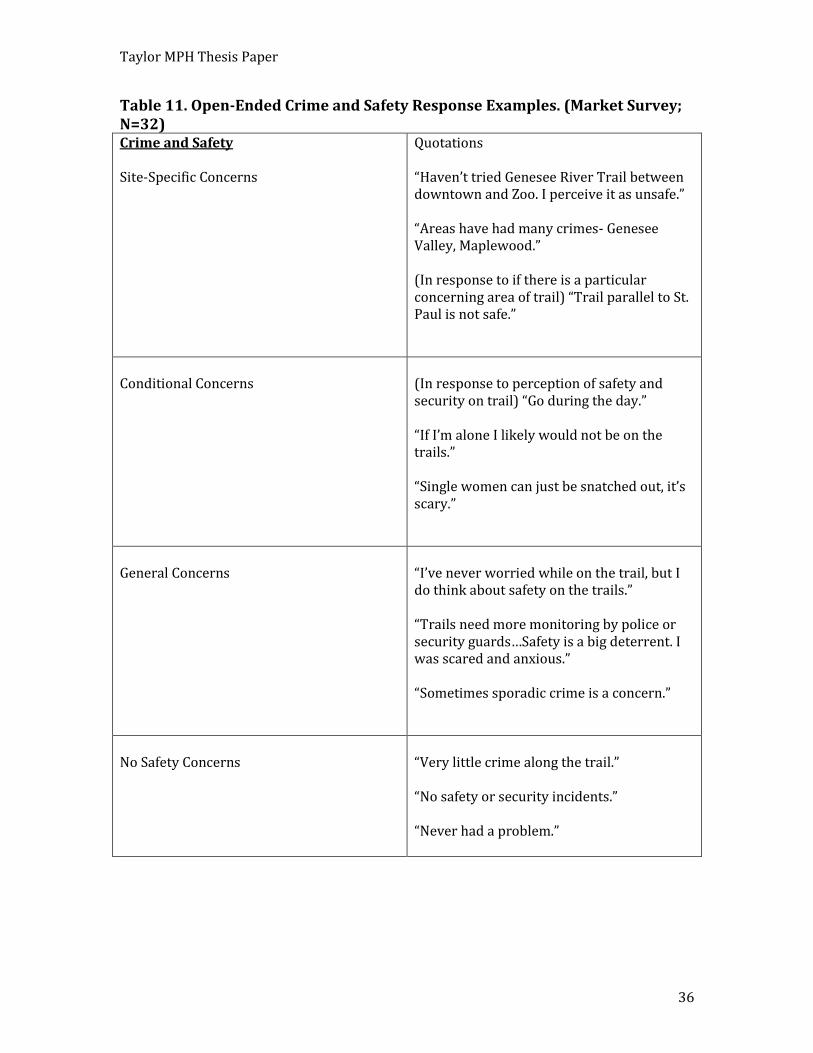
Qualitative Analysis of Market Data
Domains
The domains chosen for evaluation were crime and safety, and access and
distance. For the domain crime and safety, the themes that emerged were site-
specific concerns, conditional concerns, general concerns, and no safety concerns.
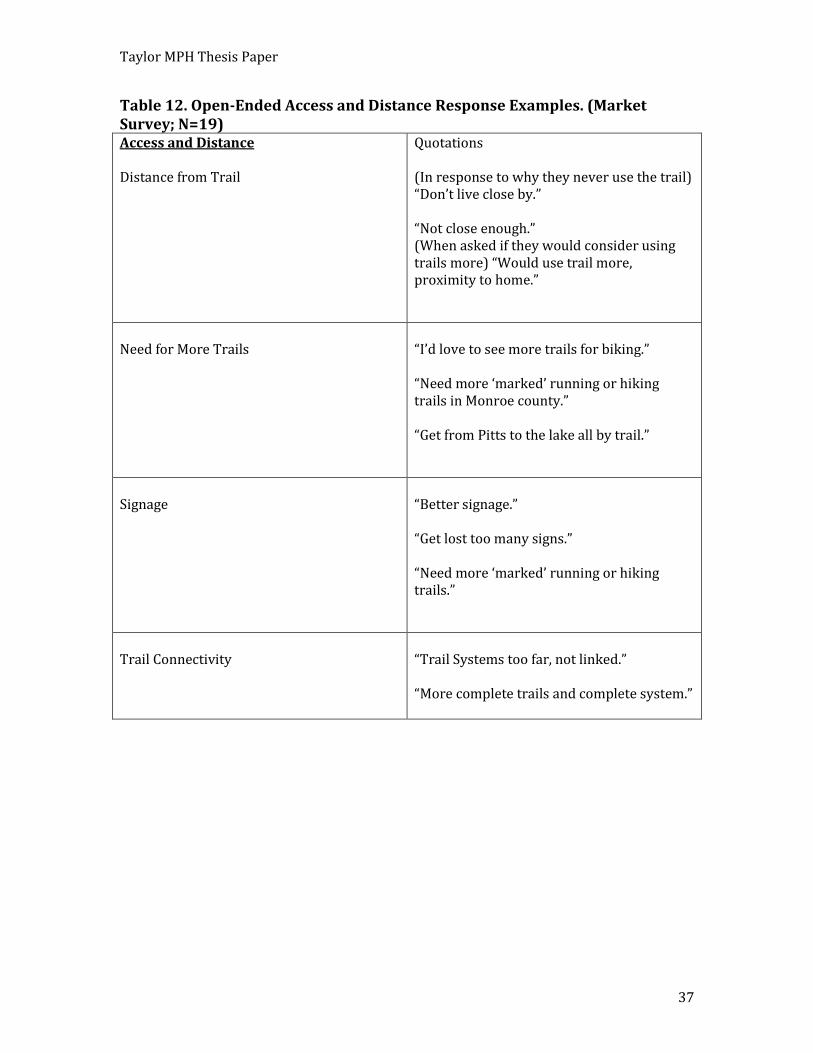
For the domain access and distance, the themes that emerged were trail
connectivity, trail signage, distance from trail, and a need for more trails. Additional
domains such as poor water quality, knowledge about the trails, and personal
reasons also emerged, but with far lower frequency.
Taylor MPH Thesis Paper
35
There were a total of 32 open-ended responses that related to crime and
safety. Thirteen of these comments related to site-specific safety concerns, or
perceptions that an area was particularly unsafe. Ten comments related to general
safety concerns. These comments related to generally perceiving the trail or people
on the trail as unsafe, rather than a particular condition of trail use that might
concern them. Conditional concerns, as defined as responses relating to a particular
state of using the trail such as night rather than a specific spot, made up five of the
32 comments and often related to fear of using the trail at night or alone as a single
woman. Five out of the 32 responses related to positive perceptions of safety and
comments of no safety issues on the trails. Examples of the responses are in Table
11 below.
Nineteen of the open-ended responses related to issues of access and
distance from the Genesee Trail System. The responses overwhelming related to the
theme of distance from the trail as a barrier to increased use. Five of the 19
responses related to the need for more trails in the area, particularly more biking
trails. Trail connectivity and signage issues comprised the remaining responses.
Examples of the themes and the responses are shown below in Table 12.
Taylor MPH Thesis Paper
36
Table 11. Open-Ended Crime and Safety Response Examples. (Market Survey; N=32) Crime and Safety Site-Specific Concerns
Quotations “Haven’t tried Genesee River Trail between downtown and Zoo. I perceive it as unsafe.” “Areas have had many crimes- Genesee Valley, Maplewood.” (In response to if there is a particular concerning area of trail) “Trail parallel to St. Paul is not safe.”
Conditional Concerns
(In response to perception of safety and security on trail) “Go during the day.” “If I’m alone I likely would not be on the trails.” “Single women can just be snatched out, it’s scary.”
General Concerns
“I’ve never worried while on the trail, but I do think about safety on the trails.” “Trails need more monitoring by police or security guards…Safety is a big deterrent. I was scared and anxious.” “Sometimes sporadic crime is a concern.”
No Safety Concerns
“Very little crime along the trail.” “No safety or security incidents.” “Never had a problem.”
Taylor MPH Thesis Paper
37
Table 12. Open-Ended Access and Distance Response Examples. (Market Survey; N=19) Access and Distance Distance from Trail
Quotations (In response to why they never use the trail) “Don’t live close by.” “Not close enough.” (When asked if they would consider using trails more) “Would use trail more, proximity to home.”
Need for More Trails
“I’d love to see more trails for biking.” “Need more ‘marked’ running or hiking trails in Monroe county.” “Get from Pitts to the lake all by trail.”
Signage
“Better signage.” “Get lost too many signs.” “Need more ‘marked’ running or hiking trails.”
Trail Connectivity
“Trail Systems too far, not linked.” “More complete trails and complete system.”

Taylor MPH Thesis Paper
38
VII. Discussion
In this study perceived barriers and individual characteristics were
evaluated as important predictors of infrequent trail use using both quantitative and
qualitative approaches to analyze two different community samples. From the trail
sample collected in the summer of 2012, the leading predictor of infrequent trail use
was a perception that the trail was poorly connected to other places (OR=3.83). This
finding is also supported from the percentage of market respondents with this
perception and the themes from the open-ended responses from the market sample.
Qualitative responses from the market data indicated individuals would use the trail
more if it were a more complete linked system. As expected, the trail data showed
that individuals were more likely to be infrequent users as the distance from their
home increased. There was a 124% to 536% greater odds of infrequent trail use
among those living more than 0.5 miles from the trail. This raises the question of
whether the primary barrier to frequent trail use is a perception that the trail is
poorly connected and accessible from other places with few access points, or it is
the distance of getting to the trail that prevents use. It is likely a combination of the
accessibility of the trail system, including it’s linkages to other parts of the
neighborhood and community such as the workplace or grocery store, and better
signage and connectivity, in addition to the distance the trail may be from an
individual’s home for more leisurely usage.
If individuals live farther from the trail it is logical that they would use the
trail less often compared to those who live in close proximity to the trail. However, it
is also likely that the farther individuals live from a trail, or the more they perceive

Taylor MPH Thesis Paper
39
the trail is poorly connected to other places, the less frequently they will use the
trail or perceive that they have enough time to even get to the trail. This is
supported by the fact that 72% of trail respondents reported they walked or biked
to get to the trail, and 26% reported they drove to the trail. Only 2% (5/265) of the
survey participants reported they took a bus to the trail. Thus, it is more likely that
an individual will use the trail infrequently if they live farther away, do not have
access to a car, and do not enjoy biking. This suggests the need to either create
greater access points to the trail or build more connections into local neighborhoods
to allow more individuals to access the trail system. Doing so could potentially
decrease the time burden individuals perceive in getting to the trail and increase
overall physical activity.
Additional secondary analyses revealed that 83% of Non-Whites living
within 0.5 miles from the trail and 74% of Non-Whites with incomes between
$10,000-$39,999 were frequent users, compared to 75% of Whites living within 0.5
miles from the trail and 55% of Whites with low incomes. This suggests that lower
income minorities, sub-populations more likely to live in the City of Rochester and
disproportionately have poorer health, may be more likely to be frequent trail users,
especially if they live close to the trail. Additionally, 67% of Non-Whites surveyed
preferred to run or walk on the trail, compared to 42% of Whites. Thus, for Non-
Whites who more prefer to walk or run on the trail improving the accessibility of the
trail could lead to higher levels of use. Future work should incorporate more in-
depth qualitative techniques and more precise quantitative measures of perceptions
to further determine how to improve the accessibility of the trail, especially for city
Taylor MPH Thesis Paper
40
residents who may be more inclined to use the trail due to the shorter distance from
their homes. Figuring out the specific breakdown of physical inactivity for various
high-risk populations and their associated perceptions around the trail is important
for developing targeted interventions to help promote greater levels of physical
activity not only for the larger community, but specifically for those high-risk groups
who need specific attention to change behavior and improve health. This is
especially important given City residents and African Americans have 8% and 23%
higher rates of physical inactivity than suburban residents and Whites,
respectively.12 These higher risk groups also consistently report worse overall
health with significantly higher rates of obesity and disease.12 This awareness of
tailoring relevant environmental interventions to high risk groups has been
emphasized for rural communities elsewhere in the literature,31 but should also be
underscored in urban policy and planning.
Individuals who perceived not having enough time to use the trails had 1.35
times the relative odds of being an infrequent trail user as those who did not report
that perception. This finding is supported by the market data in which 67% and
52% of infrequent and frequent users reported lack of time as a significant barrier
to increased use.
These results are in agreement with previous studies that found individuals
were 35% less likely to be trail users for every 0.25 mile increase distance from a
community trail.23 Other studies using both objective and subjective measures have
supported this negative relationship between home distance and trail use.21, 27, 32
This finding is also in agreement with the qualitative responses from the market
Taylor MPH Thesis Paper
41
sample in which 11 out of the 19 responses suggested limited use due to distance
from the trail.
Many have found that physical activity increases with improved
neighborhood connectivity and walkable access to various destinations.33, 34 Some
evidence also suggests that interventions to increase the connectivity and
walkability of neighborhoods leads to increased total physical activity.35 Thus,
increasing the total connectivity of the trail system in Rochester might lead to
increased physical activity, especially for certain groups.
Stratifying by distance also revealed that infrequent trail use varies by
individual characteristics as distance increases. Females were substantially more
likely than males to be infrequent trail users as home distance from the trail
increased. Although the sample was evenly split between walkers/runners
(48.64%) and bikers (49.81%), males were 2.22 times (95% CI 1.25-3.96) as likely
as females to be bikers, preferences sometimes cited in the literature.36 This
preference for biking might allow males from farther distances to more easily use
the trails and could explain why females are more likely than males to be infrequent
trail users as distance increases.
Additionally, those over the age of 45 were about 5 and 10 times more likely
to be infrequent users if they lived between 0.5-1.5 miles from the trail and farther
than 1.5 miles respectively, compared to those living within 0.5 miles from the trail.
This distinction is an important difference from the crude regressions, which found
older age to be slightly protective for infrequent trail use. Stratifying reveals that the
association between infrequent trail use and age is effect modified by distance from

Taylor MPH Thesis Paper
42
the trail increasing the odds of infrequent trail use as distance increases. This is
further evidence for the need for more trails integrated in local neighborhoods, as it
may be more difficult for older individuals to walk farther distances to access the
trails.
In addition to the convenience and availability of trails, crime and safety has
been another factor hypothesized in previous literature as a significant deterrent to
engaging in physical activity within the built environment.14,37 This study produced
largely inconclusive results in evaluating perceptions of crime and safety in regards
to trail use. The unadjusted regression for the association between perceiving the
trail as unsafe or insecure and infrequent trail use showed a protective effect. In
other words, those who believe the trail is safe and secure have roughly a 70%
decreased chance of being a frequent trail use. This effect remained after adjustment
in the full model (OR=0.47; 95% CI 0.11-1.93). Similarly, those who viewed safety
and security along the trail as either fair/poor had a 20% decreased odds of being
an infrequent trail user compared to those who viewed safety and security along the
trail as excellent/good. However, there may be a few explanations for this. First, the
sample size is extremely small; only 19 respondents from the full sample reported a
perception of feeling unsafe and insecure on the trail. Secondly, it is possible that
infrequent users are not aware of issues of safety and crime purely due to the fact
that they are inexperienced with conditions along the trail system. This is a
plausible explanation given 42% of the trail respondents were either first time users
or reported using the trail between 0 and 5 times in the preceding month. Lastly, if it
is presumed that frequent trail users have more experience with safety and crime

Taylor MPH Thesis Paper
43
issues, it is possible that they have developed safe strategies of dealing with such
concerns, but would still be more likely to report those concerns given their
experience and awareness. However, the results show no difference in average
ratings of safety and crime between the infrequent (µ=1.99) and frequent users
(µ=1.95), responding to a “Good” perception of Safety. From the trail survey, crime
and safety not only does not appear to be a barrier, but also could potentially be a
facilitator for some experienced users.
However, there may be some underlying factors that explain this lack of a
finding for safety and security concerns. When the survey locations were grouped
into South (Geneseee Valley Park West and East, Erie-Lackawanna Railroad Bridge,
and Ford St. Bridge), Central (South Ave., Cataract St., and Scrantom St.), and North
(Maplewood, Zoo Rd., Turning Point Park, Lake Ontario Parkway at River St., and
Lakeside at Durand Park), we see that user frequency is skewed towards the South
Region. Forty-seven percent respondents in the South region reported frequent use,
compared to only roughly 26% in both the Central and North regions of the trail.
When overlaying this with individuals who perceive conditions on the trail as
Excellent or Good we see a similar distribution in these regions, with 45% reporting
Excellent or Good safety and security conditions in the South, compared to only 28%
and 27% in the Central and North, respectively. Qualitative reports, as well as other
crime data has supported these perceptions of more dangerous conditions along
those regions of the trail. These safety issues may completely deter some people
from using the trail and should be investigated in the future using both quantitative
and qualitative methods. Policy makers should also specifically focus on these areas

Taylor MPH Thesis Paper
44
of the trail, in the aforementioned areas of accessibility and safety, where there are
denser low-income and minority populations suffering from poorer health and who
may have the most opportunity to increase their physical activity.
Moreover, the results from the market survey indicate that for some, crime
and safety is still a significant perception that limits frequent trail use. Forty-seven
percent of infrequent users from the market sample reported perceiving the trail as
unsafe and insecure, compared to only 17% of frequent users. Similarly, frequent
trail users consistently rated safety on the trail better than infrequent users when
asked to assess on a Likert scale. Seventy percent of frequent users viewed safety
and security along the trail as excellent/good compared to only 32% of infrequent
users; whereas 47% of infrequent users viewed safety and security as fair/poor
compared to only 28% of frequent users. These results contrast with the trail data.
Similar low percentages in the two groups reported crime prevented walking in
their neighborhood, a finding that differs from early research38 and is more in
agreement with recent studies.39 These safety perceptions might be a better
representation of what specifically limits users less familiar with the trail system as
60% of the market sample reported being a never user or an infrequent user (< 5
times a month).
None of the individual characteristics in the main trail analyses, apart from
home distance, produced any conclusive associations with frequency of trail use.
Females were found to be 10% more likely to be infrequent users, a finding similar
to a study by Troped al. that found males 90% more likely to be trail users than
females.23 However, Brownson et al. found females were more likely to use walking

Taylor MPH Thesis Paper
45
trails than males in a rural setting.26 Although some studies have found increased
age decreases the likelihood of individual trail use,23 others have found mixed
results for predicting frequency of trail use among different age categories,24, 25 as
found in this study. It is possible that younger and older age groups (18-29 and >55)
have characteristics, such as more perceived time, that could result in increased trail
use, whereas middle-aged people may be less likely to use the trails for the same or
different characteristics. These considerations and possible expectations should be
specifically examined in future studies to determine activity patterns and associated
perceptions corresponding with specific age groups. Non-Whites in this study were
roughly 40% less likely to be infrequent trail users compared to Whites, a result
consistent with other studies.25, 40 However, in this study Non-Whites compared to
Whites were more likely to use the trail infrequently as distance from the trail
increased. This may suggest that the integration of trails within certain
neighborhoods may be more important than others, an interesting indication
observed by Lindsey et al. that found increased trail traffic in neighborhoods with a
greater proportion of minority residents relative to whites.40 Associations with
income produced mixed effects, similar to what has been found previously in the
literature.25, 26 Given the higher density of minority and low-income populations in
the city, increased access may be most important at closer distances to the trail, but
less important for individuals farther from the trail who are more likely to be White,
wealthy, and have access to transportation.

Taylor MPH Thesis Paper
46
VIII. Limitations
This study has several limitations that should be considered when
interpreting our results. First, the trail survey had only 257 participants, which is
substantially lower than other interceptor-based surveys with over 400
individuals,24, 29 and telephone and population based samples with 1269 and 3717
subjects, respectively.26, 25 The smaller sample size likely reduced the precision of
the estimates, reflected in the reasonably wide 95% confidence intervals, making it
difficult to make firm conclusions. The data also suggest that this interceptor
method of trail sampling might not be the best method for collecting data on
perceptions of the trail, as the degree to which survey participants responded to the
question assessing perceived barriers was very low. Ninety-three percent
(238/257) of the trail participants reported two perceived barriers or less (of 11
possible barriers), whereas 58% (68/118) of the market participants responded to
two perceived barriers or less (of 11 possible barriers). Meanwhile 42% (50/118)
of the market participants reported between three and seven perceived barriers.
The low responses for perceived barriers from the trail sample not only did not
allow for regressions to be run due to insufficient sample size, but this sampling
error likely led to underestimated risks for each perceived barrier that was
calculated. Although it is possible that the lower response rate for perceived
barriers from the trail survey is due to there just being fewer barriers for trail users,
it is more plausible that trail users were likely in a rush to get back to their activity
and less likely to contemplate each barrier. This explanation is reasonable given
55% of the trail sample reported using the trail for exercise or recreation at the time

Taylor MPH Thesis Paper
47
they completed the survey. Given the higher percentage of responses to perceived
barriers from the market sample, further studies should consider survey settings
that allow individuals the time to complete the survey.
Additionally, the perceptions and results from this study cannot be
generalized to the entire Rochester population who do not use the trail or public
market. The trail data are 61% male, 77% white, and only 17% with income below
$25,000. The percentage of males in Monroe County and Rochester is around 48%,
while Whites make up 76% of the county population but only 44% of the city
population.41 Given that the Genesee Riverway Trail runs directly through the city,
the perceptions from this study might not be accurate representations of other
Rochester populations given the minimal minority representation. The same could
be said for income as both Monroe County and the City of Rochester have higher
percentages of individuals with incomes below $25,000, at 24% and 42%,
respectively.41 The demographic differences in the trail sample, especially from the
City of Rochester demographics, likely produced different associations from the true
source population through which the Genesee Trail runs. Future trail research
should focus on city respondent perceptions as improvements to the built
environment might have the biggest impacts on those groups in Rochester that
exhibit the highest rates of physical inactivity and disease.12
Another limitation of this study is that trail use is only being analyzed as it
specifically relates to the Genesee River Canal System, because this is the area that
falls within the Local Waterfront Revitalization Program for the City of Rochester.
Seven infrequent trail users indicated that they use a different trail, whereas none of

Taylor MPH Thesis Paper
48
the frequent users reported this option. This could have led to differential outcome
misclassification, which could have produced an overestimate of the true risk of
infrequent trail use, as some users might infrequently use the Genesee River Trail
but engage in other physical activity at other locations. However, the number is
relatively small so the effect is likely to be small.
The large amount of incomplete surveys could have also reduced the
statistical power of the effect estimates. Between 8% and 46% of respondents for a
given individual characteristic had missing information. However, the missing
responses were relatively the same within each variable in relation to frequent or
infrequent trail use.
Finally, given that this study is a cross-sectional exploratory design,
temporality cannot be assured. However, a recent review of the built environment
by Wendel-Vos et al. found no difference in findings between longitudinal and cross-
sectional designs among the 47 studies analyzed.15 Therefore, the results from this
study might be valid reflections of what might have been found from a prospective
study.
IX. Conclusion
To our knowledge, this is the first cross-sectional study of community trail
use to incorporate both quantitative and qualitative approaches from two different
study samples within the community. This study design also allowed deeper insight
into the perceptions of barriers to frequent trail use, as well as revealed sampling
technique issues that should be considered in future studies. The results from this

Taylor MPH Thesis Paper
49
study suggest that the convenience one feels around the availability and the time
commitment to use trails are important factors that influence trail use. Increasing
individuals’ perceptions of available time cannot be changed by policy, but one
solution is to create more integrated neighborhoods that have more trials connected
to more places within the neighborhood. Having more information about the
availability of the trails, coupled with increased access points has been cited in the
literature as one effective strategy to getting people more physically active.42 This
has promise for the local Rochester community as 42% of infrequent users from the
Market sample reported that they would use the trail more if they had more
knowledge about it. The associations between crime and safety should be
investigated further given the mixed results from this study and others in the
literature.
X. Acknowledgements
I would like to thank Dr. Scott McIntosh for mentoring me on this project and
serving on my MPH committee. I would also like to acknowledge Dr. Katrina Smith
Korfmacher for also serving on my MPH committee and for allowing me to use her
trail survey for secondary analysis and allowing me to collect the market data.
Finally, I want like to thank Dr. David Q. Rich for his ongoing guidance and support
on the analysis of the survey and for serving on my committee.
Taylor MPH Thesis Paper
50
XI. References
1. Korfmacher KS, Garrison V, and Sandhu S. “Genesee Riverway Trail Count and Survey
Data Report.” Rep. Environmental Health Sciences Center, University of Rochester, 27
Sept. 2012. Web. 22 Dec. 2012.
2. Institute of Transportation Pedestrian and Bicycle Council. "National Bicycle and
Pedestrian Documentation Project." 2012.Web. <http://bikepeddocumentation.org/>.
3. Parks and Trails New York. "Trail User Survey." No date. Survey provided by staff
member of PTNY. June 2012.
4. Portland State University. “Trail Use Survey.” No date. Survey provided by technical
assistance staff. May 2012.
5. DCJS, Uniform Crime/Incident-Based Reporting systems. Includes all reports received as
of 9/12/11. http://www.criminaljustice.ny.gov/crimnet/ojsa/countycrimestats.htm
6. Flegal KM, Margaret CD, Cynthia OL, and Lester CR. "Prevalence and Trends in
Obesity Among US Adults, 1999-2008." Journal of the American Medical Association
303.3 (2010): 235-41. Web. 31 Jan. 2013.
7. Moore L, Diezroux A, Evenson K, Mcginn A, and Brines S. "Availability of Recreational
Resources in Minority and Low Socioeconomic Status Areas." American Journal of
Preventive Medicine 34.1 (2008): 16-22. Web. 31 Jan. 2013.Rochester City and
8. Centers for Disease Control and Prevention. State Indicator Report on Physical Activity,
2010. Atlanta, GA: U.S. Department of Health and Human Services, 2010.
9. Schiller JS, Lucas JW, Ward BW, Peregoy JA. Summary health statistics for U.S. adults:
National Health Interview Survey, 2010. National Center for Health Statistics. Vital
Health Stat 10(252). 2012.
10. Mokdad, AH. "Actual Causes of Death in the United States, 2000." JAMA: The Journal
of the American Medical Association 291.10 (2004): 1238-245. Web. 31 Jan. 2013.
11. United States. U.S. Department of Health and Human Services. Healthy People 2020.
Web. 31 Jan. 2013.
12. United States. Monroe County Department of Public Health. Monroe County Adult
Health Survey Report, 2006- Survey Results. Web. 31 Jan. 2013.

Taylor MPH Thesis Paper
51
13. Pikora T, Giles-Corti B, Bull F, Jamrozik K, and Donovan R. "Developing a Framework
for Assessment of the Environmental Determinants of Walking and Cycling." Social
Science & Medicine 56.8 (2003): 1693-703. Web. 31 Jan. 2013.
14. Roman C, and Chalfin A. "Fear of Walking Outdoors A Multilevel Ecologic Analysis of
Crime and Disorder." American Journal of Preventive Medicine 34.4 (2008): 306-12.
Web. 31 Jan. 2013.
15. Wendel-Vos W, Droomers M, Kremers S, Brug J, and Van Lenthe F. "Potential
Environmental Determinants of Physical Activity in Adults: A Systematic Review."
Obesity Reviews 8.5 (2007): 425-40. Web. 31 Jan. 2013.
16. Yang W, Spears K, Zhang F, Lee W, and Himler H. "Evaluation of Personal and
Environment Attributes to Physical Activity: A Multilevel Analysis on Multiple
Population-Based Data Sources." Journal of Obesity 2012 (2012): n. pag. Web. 31 Jan.
2013.
17. Humpel N, Owen N, and Leslie E. "Environmental Factors Associated with Adults'
Participation in Physical Activity: A Review." American Journal of Preventive Medicine
(2002), Web. 31 Jan. 2013.
18. Wang G, Macera C, Scudder-Soucie B, and Schmid T. "A Cost-Benefit Analysis of
Physical Activity Using Bike/Pedestrian Trails." Health Promotion Practice 6.2 (2005):
174-79. Web. 31 Jan. 2013.
19. Starnes HA, Troped PJ, Klenosky DB, and Doehring AM. "Trails and Physical Activity:
A Review." Journal of Physical Activity and Health 8 (2011): 1160-174. Web. 31 Jan.
2013.
20. Pierce RJ, Denison AV, Arif AA, and Rohrer JE. "Living near a Trail Is Associated with
Increased Odds of Walking among Patients Using Community Clinics." Journal of
Community Health 31.4 (2006): 289-302. Web. 31 Jan. 2013.
21. Troped PJ, Saunders RP, Pate RR, Reininger B, and Addy C. "Correlates of Recreational
and Transportation Physical Activity among Adults in a New England Community."
Preventive Medicine 37.4 (2003): 304-10. Web. 31 Jan. 2013.
22. Furuseth OJ, and Altman RE. "Who's on the Greenway: Socioeconomic, Demographic,
and Locational Characteristics of Greenway Users." Environmental Management 15
(1991): 329-36. Web. 31 Jan. 2013.
23. Troped PJ, Saunders R, Pate RR, Reininger B, Ureda JR, and Thompson SJ.
"Associations between Self-Reported and Objective Physical Environmental Factors and
Taylor MPH Thesis Paper
52
Use of a Community Rail-Trail." Preventive Medicine 32.2 (2001): 191-200. Web. 31
Jan. 2013.
24. Maslow AL, Reed JA, Price AE, Hooker SP. Associations between sociodemographic
characteristics and perceptions of the built environment with the frequency, type, and
duration of physical activity among trail users. Prev Chronic Dis 2012;9:110114. DOI:
http://dx.doi.org/10.5888/pcd9.110114
25. Librett, J, Yore M, and Schmid T. "Characteristics of Physical Activity Levels Among
Trail Users in a U.S. National Sample." American Journal of Preventive Medicine 31.5
(2006): 399-405. Web. 31 Jan. 2013.
26. Brownson RC, Housemann RA, Brown DR, Jackson-Thompson J, King AC, Malone BR,
and Sallis JF. "Promoting Physical Activity in Rural Communities Walking Trail Access,
Use, and Effects." American Journal of Preventive Medicine 18.3 (2000): 235-41. Web.
31 Jan. 2013.
27. Abildso CG, Zizzi S, Abildso L, Steele JC, and Gordon P. "Built Environment and
Psychosocial Factors Associated with Trail Proximity and Use." American Journal of
Health Behavior (2007), Web. 31 Jan. 2013.
28. Reynolds KD, Wolch J, Byrne J, Chou CP, Feng G, Weaver S, and Jerrett M. "Trail
Characteristics as Correlates of Urban Trail Use." American Journal of Health Promotion
21.4s (2007): 335-45. Web. 31 Jan. 2013.
29. Gordon P, Zizzi S, Pauline J. “Use of a Community Trail Among New and Habitual
Exercisers: A Preliminary Assessment.” Prev Chronic Dis 2004. Web 22 Feb. 2013.
30. Troped PJ, Saunders RP, and Pate RR. "Comparisons Between Rail-Trail Users and
Nonusers and Men and Women’s Patterns of Use in a Suburban Community." Journal of
Physical Activity and Health 2 (2005): 169-80. Web. 31 Jan. 2013.
31. Brownson R, Hoehner C, Day K, Forsyth A, Sallis JF. “Measuring the Built
Environment for Physical Activity.” American Journal of Preventive Medicine 36
(2009). Web 15 Jan. 2013.
32. Pierce R, Denison A, Ahmed A, Rohrer J. “Living Near a Trail is Associated with
Increased Odds of Walking Among Patients Using Community Clinics.” Journal of
Community Health 2006: 289-302. Web 22 Feb. 2013.
33. McCormack G, Giles-Corti B, Bulsara M. “The relationship between destination
proximity, destination mix and physical activity behaviors.” Preventive Medicine
2007: 33-40. Web 22, Feb. 2013.
Taylor MPH Thesis Paper
53
34. Frank L, Schmid T, Sallise J, Chapman J, Saelens B. “Linking objectively measured
physical activity with objectively measured urban form.” American Journal of
Preventive Medicine 2005: 117-125. Web 22, Feb. 2013.
35. Fitzhugh E, Bassett D, Evans M. “Urban Trails and Physical Activity: A Natural
Experiment.” American Journal of Preventive Medicine 2010: 259-252. Web 22, Feb.
2013.
36. Heesch K, Shannon S, Garrard J. “Gender Differences in Recreational and
Transportation Cycling: A Cross-Sectional Mixed-Methods.” International Journal of
Behavioral Nutrition and Physical Activity 2012. Feb 22, 2013.
37. Foster S, Giles-Corti B. “The built environment, neighborhood crime and constrained
physical activity: Exploration of inconsistent findings.” Preventive Medicine 2008.
Web 22, Feb. 2013.
38. Centers for Disease Control and Prevention. Neighborhood safety and the
prevalence of physical inactivity—selected states, 1996. MMWR Morb Mortal Wkly
Rep 1999;48:143– 6.
39. Hoehner C, Ramirez L, Elliott M, Handy S, Brownson R. “Perceived and Objective
Environmental Measures and Physical Activity Among Urban Adults.” American
Journal of Preventive Medicine 2005. Web 22, Feb. 2013.
40. Lindsey G, Han Y, Wilson J, Yang J. “Neighborhood Correlates of Urban Trail Use.”
Journal of Physical Activity and Health 3 (2006): S139-S157. Web. 22 Feb. 2013.
41. Rochester, NY Metro Area data are from the U.S. Census Bureau 2006-2010 American
Community Survey 5-Year Estimates, accessed at
http://factfinder2.census.gov/faces/nav/jsf/pages/index.xhtml. Web. 31 Jan. 2013.
42. Kahn EB, Ramsey LT, Brownson RC, et al. “The effectiveness of interventions to
increase physical activity: a systematic review.” American Journal of Preventive
Medicine 2005; 28: 149-55. Web Feb. 22, 2013.

Taylor MPH Thesis Paper
54
Appendix A: User Trail Survey
Location: _______________________ Date: _________________ Time: ______________ Survey conducted by: _____________ Weather: ______________ SURVEY ID #_________
We are interested in learning about how you use Rochester’s waterfront trails. In this survey, “the trail” refers to any location along the Genesee Riverway Trail within the City of Rochester. For questions relating to trail condition and improvements, please refer to the area you are in now and how you are using the trail today.
1. Today I am: 1 Walking/Running 2 Biking 3 Other (please specify): ___________________
2. What best describes the purpose of this trip (check all that apply)?
1 Exercise 2 Work commute 3 School 4 Recreation 5 Shopping/doing errands 6 Personal (medical, visiting friends, etc.)
3. If you were not using the trail for this trip, how would you be traveling? 1 Car 2 Carpool 3 Transit (Bus) 4 I would not make this trip 5 Don’t Know
4. In the past month, about how often have you used this trail (check only one)? 1 It’s my first time ever on this trail 2 0 – 5 times 3 6 – 10 times 4 11 – 20 times 5 21 – 29 times 6 Daily 7 Don’t Know
5. Please check the seasons in which you use this trail:
1 All year 2 Summer 3 Fall 4 Winter 5 Spring 6 Don’t Know
6. How did you get to this trail today (check all that apply)?
1 Drove 2 Walked 3 Biked 4 Took the bus 5 Other: ____________________ 7. How far did you travel to get to this trail today? _____________ miles 8. Home address (NOTE: If you prefer not to give your address, please give an address near
your house): Number: _______ Street: ___________________ City/State: ______________________ Zip: ________
9. How long will you be [walking/biking/other] (same activity as now) on this trip? ______ minutes
10. How far will your trip on the trail be today (just the part of your trip that is actually on this trail)?
1 < ¼ mile 2 ¼ mile to ½ mile 3 ½ mile to 1 mile 4 1 mile to 2 miles 5 2 miles to 5 miles 6 >5 miles 7 Don’t Know
11. Will any part of this trip be taken on public transit (such as the bus)? 1 Yes 2 No
3 Don’t Know 12. Why are you using this trail instead of [walking/biking/other] (same activity as now)
somewhere else (check all that apply)? 1 Accessible/no stairs 2 Scenic qualities 3 It is less crowded here

Taylor MPH Thesis Paper
55
4 Personal safety 5 Level/flat 6 Convenient route (direct, close) 7 Wider lanes/path 8 Bike lanes 9 Heard about it (from friends, media, etc) 10 Connection to transit (bus) 11 No cars 12 Other: ____________________
13. What would you like to see improved along this trail (check all that apply)?
1 Wider path 2 Better surface 3 Better street crossings 4 More shade trees 5 Benches 6 Access to shops, etc. 7 Better maintenance 8 Signs 9 Better lighting
10 Plowing in winter 11 Nothing 12 Other: ________________ 14. In your opinion, the safety and security along this trail is:
1 Excellent 2 Good 3 Fair 4 Poor 5 Don’t Know 15. I would use the trail more often if (check all that apply):
1 I had more time 2 I did not have to travel with small children 3 It was easier to cross major streets 4 Places weren’t too far away 5 It was better connected to other places 6 I felt safer/more secure
7 I didn’t have things to carry 8 The trail was in better condition 9 I normally take a different trail 10 Other: _________________ 11 I already use the trail as often as I want (I would not use it more often)
16. FOR BIKERS ONLY: Are you wearing a helmet today? 1 YES 2 NO IF “YES”: Why are you wearing a helmet today (check all that apply)? 1 To protect myself in case of a crash 2 It’s the law 3 To set a good example for children 4 Other: _______________________ IF “NO”: Why are you not wearing a helmet today (check all that apply)?
1 I don’t own one 2 I have one but I forgot to wear it 3 I have one but it doesn’t fit 4 They’re too expensive 5 It’s too hot to wear one 6 I don’t like how it looks 7 I don’t like what it does to my hair 8 I don’t need it right now (short trip)
9 Helmets don’t protect you 10 Other: _______________________ 17. Do you or your family regularly fish in waters around Rochester? 1
YES 2 NO IF YES, do you ever fish in the Genesee River above (south of) Lower Falls? 1 YES 2 NO Does your family regularly eat fish caught around Rochester? 1 YES 2 NO IF YES, about how often did you eat locally caught fish during the last fishing season? _____ meals per month
ABOUT YOU: Race: 1 White 2 Black 3 Asian 4 Other: _________ Ethnicity: 1 Non-Hispanic 2 Hispanic or Latino Age: ____________ Gender: _____________

Taylor MPH Thesis Paper
56
How many people currently live in your household? _______adults _______children (under 18. What is your approximate household income? 1 Less than $10,000 2 $20,000 - $24,999 3 $35,000 - $39,999 4 $10,000 - $14,999 5 $25,000 - $29,999 6 $40,000 - $74,999
7 $15,000 - $19,999 8 $30,000 - $34,999 9 $75,000 or more
Do you have any additional comments? _________________________________________________________________________________________________________________________________________________________________________________________________________________________________________________________________________________
THANK YOU FOR YOUR TIME!

Taylor MPH Thesis Paper
57
Appendix B: Non-User Public Market Survey
Location: ______________ Date: __________ Time: ______________ Survey conducted by: ________ Weather: ________ SURVEY ID #_________
We are interested in how people use Rochester’s waterfront for recreation and physical activity. You must be over 18, have lived in Monroe County or the surrounding region for at least the past year, and must not have taken this survey before to participate. You may skip any questions you wish.
1. How often did you visit Durand Beach this year?
1 Never 2 1 – 4 times 3 5 – 10 times 4 11 – 20 times 5 21 or more times If never, why not? ___________________________________________________(SKIP TO #3)
2. What activities did you engage in at Durand Beach? (check all that apply)?
1 Swimming 2 Picnicking 3 Walking 4 Sunbathing 5 Playing sports 6 Other:______________
3. How often did you visit Ontario Beach this year?
1 Never 2 1 – 4 times 3 5 – 10 times 4 11 – 20 times 5 21 or more times If never, why not? ___________________________________________________(SKIP TO #5)
4. What activities did you engage in at Ontario Beach? (check all that apply)?
1 Swimming 2 Picnicking 3 Walking 4 Sunbathing 5 Playing sports 6 Other:______________
5. Would you ever consider using the beach(es) in Rochester more often?
1 Yes 2 No 6. Use the following scale to rate your answers to the following statements:
1= Strongly Disagree (SD) 2 = Disagree (D) 3= Neutral (N) 4 = Agree (A) 5 = Strongly Agree (SA) I would visit the beach(es) MORE if … SD D N A SA
... it were better-maintained 1 2 3 4 5 … it were safer (less crime) 1 2 3 4 5 … it were open (lifeguarded) more often/longer hours 1 2 3 4 5 …it had better facilities (bathrooms/changing area) 1 2 3 4 5 …it had better water quality 1 2 3 4 5 …there were more shops/restaurants/vendors nearby 1 2 3 4 5 …there were a spray park or swimming pool 1 2 3 4 5 …there were better bus service 1 2 3 4 5 …I lived closer to it 1 2 3 4 5

Taylor MPH Thesis Paper
58
…I knew more about it 1 2 3 4 5 Other: _________________________________ 1 2 3 4 5
7. Following are some examples of how pollution affects our local waterways. In the past year, have you been personally affected by:
Impact Yes no maybe don’t know/ no answer
Beach closings
Odor near waterways
Too much algae in water
Getting sick after swimming in Lake Ontario
NOTE: In this survey, “waterfront trails” refers to trails along the Erie Canal and Genesee River (see map).
8. In a typical warm weather month, about how often do you use waterfront trails in Rochester (check only one)?
1 Never 2 1 – 5 times 3 6 – 10 times 4 11 – 20 times 5 21 – 29 times
6 Daily 7 Don’t Know 9. What best describes your trail use (check all that apply)?
1 Exercise 2 Work commute 3 School commute
4 Recreation 5 Shopping/doing errands 6 Personal (medical, visiting friends, etc.)
10. In your opinion, can you get to the trail system easily? 1 Yes 2 No 11. Would you ever consider using the waterfront trails in the City of Rochester more often?
1 Yes 2 No 12. I would use the waterfront trails in the City of Rochester more often if (check all that apply):
1 I had more time 2 I did not have to travel with small children
3 It was easier to cross major streets 4 Places weren’t too far away
5 It was better connected to other places 6 I felt safer/more secure
7 I didn’t have things to carry 8 The trail was in better condition
9 I normally take a different trail 10 I knew more about them
11 Other: _________________ 13. In your opinion, the safety and security along this trail is:
1 Excellent 2 Good 3 Fair 4 Poor 5 Don’t Know
14. How often does crime prevent you from using the waterfront trails?
1 Often 2 Sometimes 3 Rarely 4 Never 5 Don’t Know
Is there a particular area of concern to you?_______________________________________
15. How often does crime prevent you from walking in your neighborhood?
1 Often 2 Sometimes 3 Rarely 4 Never 5 Don’t Know
16. How many times in the past week were you physically active (walking, biking, swimming, etc.)? ____ times How many of these times were outdoors? ______ times

Taylor MPH Thesis Paper
59
When you were physically active, for how many minutes or hours did you usually keep at it? _____ minutes
17. Do you or your family regularly eat fish caught in Lake Ontario or connected waters?
1 YES 2 NO If YES, about how often do you eat locally caught fish? _____ meals per month
18. ABOUT YOU: Address or intersection near your house Street: _________________________ Number or cross street: ________________________ City: __________________________________ Zip: ________ Race (check only one): 1 White 2 Black 3 Asian 4 Other: _________
Ethnicity (check only one): 1 Non-Hispanic 2 Hispanic or Latino
Gender (check only one): 1 Male 2 Female
ABOUT YOU (Continued from previous page):
Age: ____________ Height: ____________ Weight: _____________ Which of the following is your highest level of education (completed)?
1 Some or no high school 2 High school graduate or GED 3 Vocational/technical school 4 Some college 5 College graduate or higher How many years have you lived in Monroe County or the surrounding region? _______years How many people currently live in your household? _______adults _______children (under 18) Smoking History (Check only one): 1 Never Smoked 2 Currently Smoke 3 Formerly Smoked What is your approximate household income?
1 Less than $10,000 4 $20,000 - $24,999 7 $35,000 - $39,999
2 $10,000 - $14,999 5 $25,000 - $29,999 8 $40,000 - $74,999
3 $15,000 - $19,999 6 $30,000 - $34,999 9 $75,000 or more
Do you have any additional
comments?_________________________________________________________________
___________________________________________________________________________
___________________________________________________________________________
___________________________________________________________________________
___________________________________________________________________________
___________________________________________________________________________
_______________________________________________________________________

Taylor MPH Thesis Paper
60
THANK YOU FOR YOUR TIME