self-rated health among university students in relation to...
TRANSCRIPT

LUND UNIVERSITY
PO Box 117221 00 Lund+46 46-222 00 00
Self-rated health among university students in relation to sense of coherence andother personality traits.
von Bothmer, Margareta I K; Fridlund, Bengt
Published in:Scandinavian Journal of Caring Sciences
DOI:10.1046/j.0283-9318.2003.00234.x
Published: 2003-01-01
Link to publication
Citation for published version (APA):von Bothmer, M. I. K., & Fridlund, B. (2003). Self-rated health among university students in relation to sense ofcoherence and other personality traits. Scandinavian Journal of Caring Sciences, 17(4), 347-357. DOI:10.1046/j.0283-9318.2003.00234.x
General rightsCopyright and moral rights for the publications made accessible in the public portal are retained by the authorsand/or other copyright owners and it is a condition of accessing publications that users recognise and abide by thelegal requirements associated with these rights.
• Users may download and print one copy of any publication from the public portal for the purpose of privatestudy or research. • You may not further distribute the material or use it for any profit-making activity or commercial gain • You may freely distribute the URL identifying the publication in the public portal

Take down policyIf you believe that this document breaches copyright please contact us providing details, and we will removeaccess to the work immediately and investigate your claim.
Download date: 26. Jun. 2018

OR IG INAL ART ICLE
Self-rated health among university students in relationto sense of coherence and other personality traits
Margareta I.K. von Bothmer1,2MScN, RNT and Bengt Fridlund1,2,3
PhD, RNT1School of Social and Health Sciences, Halmstad University, Halmstad, Sweden, 2Department of Primary Health Care, Goteborg University,
Goteborg, Sweden, and 3Department of Nursing Science, Lund University, Lund, Sweden
Scand J Caring Sci; 2003; 17; 347–357
Self-rated health among university students in relation
to sense of coherence and other personality traits
The aim of the study was to determine students’ self-rated
health in relation to sense of coherence and other per-
sonality traits. A cross-sectional descriptive design was
used with questionnaires as the means of data collection.
The study population comprised a randomized stratified
sample of students from a small university in southern
Sweden. Ethical approval was obtained from the vice
chancellor, and the issues of informed consent, confiden-
tiality, privacy and self-determination were respected. Two
instruments were used for data collection; the 29-item
Sense of Coherence (SOC) scale, and an instrument
created for this study, named Personality and Health
Instrument, containing 52 questions. Self-rated health was
estimated by inverse number of health complaints. A factor
analysis identified seven factors related to personality
traits; the three most important were hardiness, positive
affect/optimism and Type A personality. The personality
trait variables were tested for correlation with each other
as well as with self-rated health. The mean score for SOC
was similar for female and male students, but a positive
association between SOC and self-rated health was found
only among women. Optimism was associated with less
health complaints among female students. Type A per-
sonality was associated with poorer health both among
women and men. The personality traits SOC, positive
affect/optimism, hardiness and alienation showed high
internal correlations. The SOC scale is discussed in relation
to gender specificity and in relation to methodological and
conceptual confounding. Further research is needed to
explore the relation between SOC, optimism, hardiness,
hostility and health. The significance of the study is that it
raises questions about the validity and specificity of the
SOC instrument and provides ideas for future research to
develop the sense of coherence concept and instrument.
Keywords: hardiness, hostility, optimism, positive affect,
personality trait, self-reported health, sense of coherence,
student, type A personality.
Submitted 7 September 2002, Accepted 6 May 2003
Introduction
Health-related behaviour in early life influences later risks
for lifestyle-related disorders. It is, therefore, important to
investigate the health behaviour among young people.
University students represent a major segment of the
young adult population (1). It makes sense to focus on
them in a study of associations between health, motivation
for a healthy lifestyle and different personality traits. The
way people assess their own health has been shown to be a
good predictor of mortality in many population studies.
The predictive power of self-rated health is strong, irres-
pective of measurement method; some of the most
important ones are self-rated symptoms, functional ability
and global self-rated health (2).
Health is influenced by a range of factors, and the cur-
rently popular bio-psychosocial model claims that what
influences a person’s health is the interplay between bio-
logical, psychological and social aspects (3). As the causes of
ill health have shifted in Western societies from infectious
diseases to those caused by our lifestyles, more attention is
given to the role of behaviour. Behaviour is influenced by
attributes at individual level but also by social and societal
conditions (4). Some of the theories and models trying to
explain the intrapersonal determinants of health-related
behaviours focus on different personality traits such as
sense of coherence, hardiness, negative affectivity, positive
affect/optimism, hostility and Type-A personality. The aim
of the study was to determine students’ self-rated health in
Correspondence to:
Margareta I.K. von Bothmer, School of Social and Health Sciences,
Halmstad University, PO Box 823, S-301 18 Halmstad, Sweden.
E-mail: [email protected]
� 2003 Nordic College of Caring Sciences, Scand J Caring Sci; 2003; 17, 347–357 347

relation to sense of coherence and other personality traits
built on the following research questions:
• What are the relationships between self-rated health and
Sense of Coherence (SOC), and between self-rated
health and other personality traits such as hostility,
hardiness and optimism?
• What are the relationships between SOC and other
personality traits?
• Are there any gender differences in the relationships
between self-rated health, SOC and other personality
traits?
Theoretical aspects
Aaron Antonovsky presented the concept of SOC in 1979
and further elaborated it in 1987, and its point of departure
was an opposition to the pathogenic orientation in medi-
cine and social science (5, 6). Antonovsky focused instead
on salutary factors, i.e. factors that promote health. He
stated that a person uses generalized resistance resources
when confronting a stressor and that a person with high
SOC will be motivated to cope, will understand what is
needed and will believe that resources to cope are available.
This combination of cognitive, behavioural and motiva-
tional aspects form the concept of SOC and the three
components are called meaningfulness, comprehensibility
and manageability (7). Antonovsky declared that SOC is not
a personality trait but instead a global orientation, expres-
sing confidence in life and that a strong SOC is associated
with good health (5). He claimed that the SOC construct
contrasted other similar concepts such as hardiness, locus of
control, and resilience and credited the SOC construct as
follows: ‘found to be consistently feasible, reliable and valid.
This is true across cultures, social classes and ethnic groups,
and for men and women of all ages’ (6, p. 16).
Kobasa declared that persons who experience high
degrees of stress without falling ill have a personality
structure called hardiness. The hardy persons are charac-
terized by the belief that they can control the situation, by
being committed to the activities of their lives and by
seeing change as an exciting challenge to further devel-
opment (8). Antonovsky discussed one important differ-
ence between the SOC concept and the hardiness construct
in that SOC is based on the assumption that people search
for stability while Kobasa stressed that changes in life are
regarded as challenges for development (5). Both
Antonovskys’s SOC construct and Kobasa’s Hardiness
construct have been criticized for being unitary constructs,
as validating the scales by factor analysis have shown
inconsistencies in the subscales (7, 9).
The associations between health and personality traits
have been used also to claim that there is a ‘disease-prone’
personality that includes anger, hostility, aggression,
anxiety and depression (10). Anger and hostility has been
described as part of a Type A personality which is further
characterized by competitive achievement orientation and
time urgency (3). Several studies have shown that the
component in Type A personality with the most power is
the hostility component (11). Other personality traits that
are said to influence health are optimism and pessimism,
with a positive outlook associated with health and a pes-
simistic explanatory style with illness (12, 13). Scheier and
Carver (14) discussed whether a sense of optimism might
in fact underlie some of the health-related outcomes of
hardiness; i.e. the concepts of hardiness, optimism and
well-being are related to each other.
It has been discussed what SOC really measures (15), if it
is anxiety and depression (16, 17), negative affectivity
(18), or hardiness (7). A possible connection between SOC
and hostility is discussed where a low SOC may be partially
underlying the adverse effects of hostility on health (19).
Methods
Design and setting
A cross-sectional descriptive design was used, with ques-
tionnaires as the means of data collection. The study was
carried out in the Southwest of Sweden at a small uni-
versity with 5000 students.
Sample and selection
The sample of students comprised a random stratified
sample from each department at the university. Eligible
students were those studying on a full-term basis. Selecting
every tenth person on each class list, starting with a ran-
domly chosen number made the randomization. The
response rate varied between 61% and 79% and was 69%
for the total sample.
Instrumentation
The questionnaire consisted of two instruments; the SOC-
scale (5) and a questionnaire created for this study based
on published work.
The SOC scale used in this study was the full 29-item
version, revised for good Swedish language style and tested
for validity and reliability in Swedish samples (20, 21). The
respondents were asked to select a response on a seven-
point semantic differential scale with two anchoring
phrases. The items were scored to one unitary scale ran-
ging between 29 and 203 points. A high score on the total
scale indicated a strong sense of coherence. The SOC
questionnaire has shown acceptable results concerning
reliability (7), stability (22–24), discriminating validity (17,
21) and predicting validity (19, 25).
The SOC scale was tested with factor analysis, and in
order to find Antonovsky’s original SOC components –
meaningfulness, manageability and comprehensibility – a
� 2003 Nordic College of Caring Sciences, Scand J Caring Sci; 2003; 17, 347–357
348 M.I.K. von Bothmer, B. Fridlund

three-factor solution was attempted. This resulted in only
45% of variance explained, and the factors did not cor-
respond with the SOC components. The reliability was
tested with Cronbach’s alpha reliability coefficient and was
0.89, 0.84 and 0.49 for the three scales, respectively.
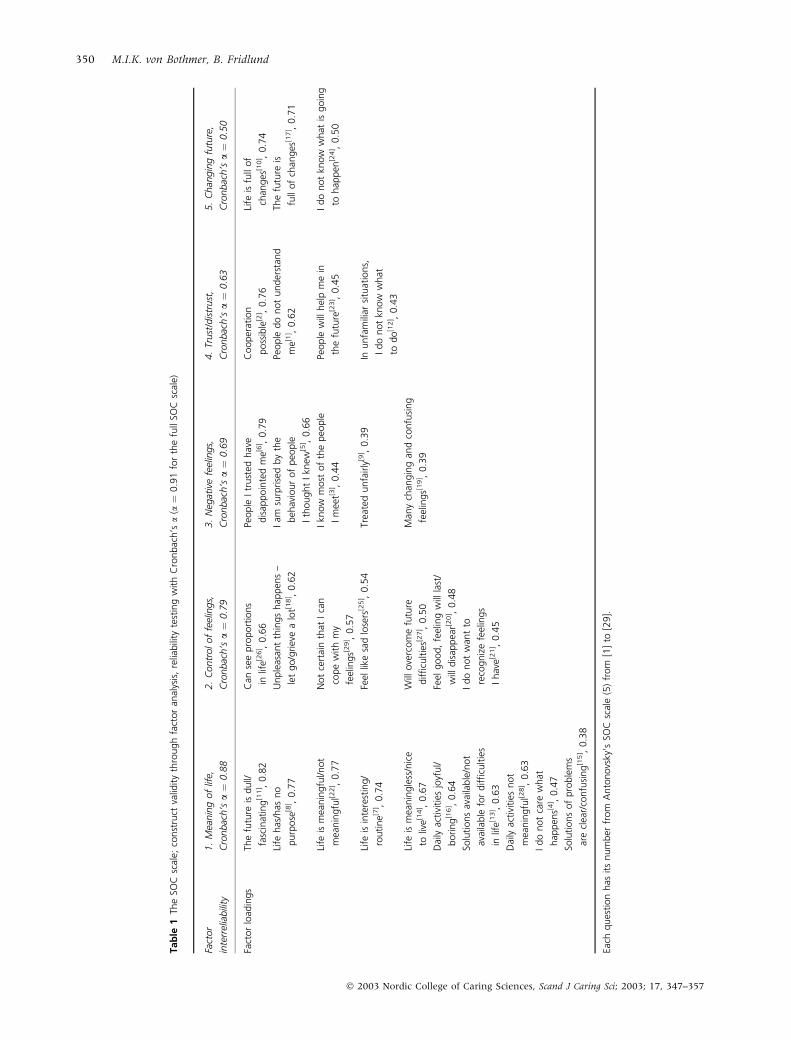
The next factor analysis performed on the SOC items,
was not restrained to a fixed number of factors and
resulted in five factors (see Table 1), which accounted for
53% of the variance. Several items loaded on more than
one factor, but were referred to the factor where it had the
highest loading. The loadings ranged from 0.38 to 0.82.
The factors were named ‘1: Meaning of life’, ‘2: Control of
feelings’, ‘3: Negative feelings’, ‘4: Trust/distrust’ and ‘5:
Changing future’. The items belonging to the ‘meaning-
fulness’ scale according to Antonovsky (7) were all found
in the ‘Meaning of life’ factor. The comprehensibility items
of SOC loaded on all five factors, while the manageability
items were found on factors 1–4. Cronbach’s alpha reli-
ability coefficients for the different factors ranged from
0.50 to 0.88 (see Table 1), and was 0.91 for the full SOC
scale. The correlations between the five factors and SOC
were for ‘Meaning of life’ and ‘Control of feelings’ 0.71, for
‘Negative feelings’ 0.66, for ‘Trust/distrust’ 0.60 and for
‘Changing future’ 0.39, all with p ¼ 0.001.
An instrument was created for this study in order to
cover areas that are deemed important for studying health
and personality factors. Face and content validity of the
questionnaire was established through building the ques-
tionnaire on literature reviews of health influencing fac-
tors such as optimism (13, 14), sense of control (26), and
hardiness (8, 9). The instrument comprised questions on
socio-demographics, health complaints, health beliefs,
motivation for a healthy lifestyle, and on different per-
sonality traits and perceptions of self. The latter part of the
instrument, opinion and attitude questions were tested for
construct validity with factor analysis. Twelve questions
did not fit well in a first factor analysis and were, therefore,
excluded. The instrument then comprised the following
areas and number of items:
• Socio-demographics: gender, age, height, weight, family
situation (living alone or with partner or parent, having
children or no children), father’s education, mother’s
education, department at university, term; nine
questions.
• Health complaints (headache, stomach ache, cold, flu,
symptoms from muscles, back-pain, anxiety, coughing,
fatigue, sleeplessness, stress, constipation, diarrhoea,
allergy or others); the question was: ‘Have you during
the last month been bothered by any of the following
symptoms?’ (listed as above); 16 questions. Response
alternatives were ‘Yes’ and ‘No’. The ‘Yes’ answers were
computed together for each individual and formed the
composite variable ‘Health complaints’, which in this
study corresponds to self-rated health. As self-rated
health, the health complaint scale is reversed.
• Questions related to outlook on life, moods, perceptions
of self, sense of control; 20 questions on a seven-point
semantic differential scale with endpoints: ‘strongly
disagree’ and ‘strongly agree’.
• Beliefs related to health: three questions about the
respondents’ views on the influence from own thoughts,
feelings and actions on health; the format as described
above.
• Motivation for a healthy lifestyle: four questions with
the format as described above.
The questionnaire was tested with a pilot study on 50
nurse students and some revision was made, i.e. the
exclusion of 37 superfluous questions. The questionnaire
was sufficiently tested for construct validity through a
second factor analysis using the SPSS computer program,
and the Varimax was used as rotation model (27, 28). The
factor analysis gave seven factors, called ’Hardiness’, ’Pos-
itive affect/optimism’, ’Type A personality’, ’Health influ-
ence’, ’Motivation for a healthy lifestyle’, ’Sense of control’
and ’Alienation’, which accounted for 61% of the variance
(see Table 2). The internal consistency was tested with
Cronbach’s alpha reliability coefficient and was acceptable
at 0.76 (29), with reliability coefficients for the different
factors ranging from 0.52 to 0.84. This 52-item instrument
is hereafter called the Personality and Health Instrument
(PHI).
Data collection
As the university concerned did not have a separate ethical
committee, permission was obtained from the vice chan-
cellor, who first requested information about the research
aims, procedures and reporting of results, and then gave
permission on condition that the students did not have any
objections. All respondents were informed about confi-
dentiality, freedom to participate and the right to withdraw
from the study at any point. The information sheet also
gave information about the purpose of the study, the use of
code numbers and the researchers.
The address list was obtained from the student union,
but eight envelopes were returned due to unknown
addresses or the students not being registered after all. The
questionnaires were successfully sent to 479 students and
332 responded. The questionnaires were distributed by
post with a stamped envelope attached. In order to
encourage quick and full answers, the students who
returned the first 100 completed questionnaires were
offered a small incentive (lottery ticket). All questionnaires
were sent back to the researchers with anonymity
preserved. Code numbers were used in order to facilitate
reminders. Reminders were sent to 225 students after
2 weeks and resulted in 60 additional responses. No
further reminder was sent as it was at the end of the term,
and it was considered unlikely that the students would
respond later.
� 2003 Nordic College of Caring Sciences, Scand J Caring Sci; 2003; 17, 347–357
Students’ self-rated health, sense of coherence and personality traits 349
Tab
le1
The
SOC
scal
e;co
nst
ruct
valid
ity
thro
ugh
fact
or
anal
ysis
,re
liabili
tyte
stin
gw
ith
Cro
nbac
h’s
a(a
¼0.9
1fo
rth
efu
llSO
Csc
ale)
Fact
or
inte
rrel
iabili
ty
1.
Mea
nin
gof
life,
Cro
nbac
h’s
a¼
0.8
8
2.
Contr
olof
feel
ings,
Cro
nbac
h’s
a¼
0.7
9
3.
Neg
ativ
efe
elin
gs,
Cro
nbac
h’s
a¼
0.6
9
4.
Trust
/dis
trust
,
Cro
nbac
h’s
a¼
0.6
3
5.
Chan
gin
gfu
ture
,
Cro
nbac
h’s
a¼
0.5
0
Fact
or
load
ings
The
futu
reis
dull/
fasc
inat
ing
[11] ,
0.8
2
Can
see
pro
port
ions
inlif
e[2
6] ,
0.6
6
People
Itr
ust
edhav
e
dis
appoin
ted
me[6
] ,0.7
9
Cooper
atio
n
poss
ible
[2] ,
0.7
6
Life
isfu
llof
chan
ges
[10] ,
0.7
4
Life
has
/has
no
purp
ose
[8] ,
0.7
7
Unple
asan
tth
ings
hap
pen
s–
let
go/g
riev
ea
lot[1
8] ,
0.6
2
Iam
surp
rise
dby
the
beh
avio
ur
of
peo
ple
Ith
ought
Ikn
ew[5
] ,0.6
6
People
do
not
under
stan
d
me[1
] ,0.6
2
The
futu
reis
full
of
chan
ges
[17] ,
0.7
1
Life
ism
eanin
gfu
l/not
mea
nin
gfu
l[22] ,
0.7
7
Not
cert
ain
that
Ica
n
cope
with
my
feel
ings[2
9] ,
0.5
7
Ikn
ow
most
of
the
peo
ple
Im
eet[3
] ,0.4
4
People
will
hel
pm
ein
the
futu
re[2
3] ,
0.4
5
Ido
not
know
what
isgoin
g
tohap
pen
[24] ,
0.5
0
Life
isin
tere
stin
g/
routine[7
] ,0.7
4
Feel
like
sad
lose
rs[2
5] ,
0.5
4Tr
eate
dunfa
irly
[9] ,
0.3
9In
unfa
mili
arsi
tuat
ions,
Ido
not
know
what
todo
[12] ,
0.4
3
Life
ism
eanin
gle
ss/n
ice
toliv
e[1
4] ,
0.6
7
Will
ove
rcom
efu
ture
difficu
ltie
s[27] ,
0.5
0
Man
ych
angin
gan
dco
nfu
sing
feel
ings[1
9] ,
0.3
9
Dai
lyac
tivi
ties
joyf
ul/
boring
[16] ,
0.6
4
Feel
good,
feel
ing
will
last
/
will
dis
appea
r[20] ,
0.4
8
Solu
tions
avai
lable
/not
avai
lable
for
difficu
ltie
s
inlif
e[13] ,
0.6
3
Ido
not
wan
tto
reco
gniz
efe
elin
gs
Ihav
e[21] ,
0.4
5
Dai
lyac
tivi
ties
not
mea
nin
gfu
l[28] ,
0.6
3
Ido
not
care
what
hap
pen
s[4] ,
0.4
7
Solu
tions
of
pro
ble
ms
are
clea
r/co
nfu
sing
[15] ,
0.3
8
Each
ques
tion
has
its
num
ber
from
Anto
novs
ky’s
SOC
scal
e(5
)fr
om
[1]
to[2
9].
� 2003 Nordic College of Caring Sciences, Scand J Caring Sci; 2003; 17, 347–357
350 M.I.K. von Bothmer, B. Fridlund

Statistical procedure and analysis
In order to analyse the data; the SPSS programme (SPSS
for Windows, version 10.0) was used (28). Descriptive
statistics (frequency distributions, cross-tabulations with
two-dimensional tables) were used to illustrate the pre-
liminary information. Chi-square statistic was used as a
test of independence between groups, and Cramer’s V was
used as a measure of association in order to quantify the
strengths of the relationships (28). The items loading on
each factor in the PHI were computed together to create
composite variables, and then each composite variable was
scaled in three degrees: ‘low degree’, ‘medium degree’, and
‘high degree’. The computed variables were then tested for
correlation with each other. Correlations were measured
by Spearman’s Rho, as data were rank-ordered. To explore
the association between SOC and other personality traits a
multiple regression analysis was undertaken with SOC as
dependent variable (28, 30). Statistical significance was
denoted by p < 0.05.
Results
Description of the sample
The sample comprised 49% women and 51% men. Sev-
enty-one per cent were younger than 30 years of age, 23%
were in their thirties and 6% in their forties. A majority
(59%) lived by themselves. Seventy-six per cent did not
have children. More women than men had a partner and
had children (see Table 3). The most common reported
symptoms among the students were stress (60%), tiredness
(57%), headache (52%), pain in back and neck (51%) and
common cold (43%). Stomach pain was reported by 34%,
allergy by 28%, anxiety by 26%, sleeping disorders by
22% and depression by 11%. Women reported headache,
stomach pain and stress more often than men (p ¼ 0.001,
Cramer’s V ¼ 0.22) and single women reported depression
to a higher degree (p ¼ 0.01, Cramer’s V ¼ 0.24). No sig-
nificant differences were found between younger and
older students. There was no association between SOC and
fathers’ and mothers’ level of education.
Self-rated health, sense of coherence and other
personality traits
A number of associations between self-rated health and
different personality traits were found (Table 4). The mean
score for SOC among women and men was similar, irres-
pective of study department or study term. Women with
children and women living with a spouse had higher SOC-
means (see Table 5). A negative association between
Type A personality and self-rated health were found both
for men and women and it was stronger for students older
than 30 years (p ¼ 0.001, Cramer’s V ¼ 0.31). Among
Tab
le2
The
‘Per
sonal
ity
and
Hea
lth
Inst
rum
ent’
;co
nst
ruct
valid
ity
thro
ugh
fact
or
anal
ysis
,re
liabili
tyw
ith
Cro
nbac
h’s
a(a
¼0.7
6fo
rth
efu
llin
stru
men
t)
Fact
or
inte
rrel
iabili
ty
Har
din
ess,
Cro
nbac
h’s
a¼
0.8
4
Posi
tive
affe
ct/o
ptim
ism
,
Cro
nbac
h’s
a¼
0.7
8
Type
Aper
sonal
ity,
Cro
nbac
h’s
a¼
0.7
4
Hea
lth
influen
ce,
Cro
nbac
h’s
a¼
0.8
0
Motiva
tion
for
ahea
lthy
lifes
tyle
,C
ronbac
h’s
a¼
0.5
8
Sense
of
contr
ol,
Cro
nbac
h’s
a¼
0.6
4
Alie
nat
ion,
Cro
nbac
h’s
a¼
0.5
2
Fact
or
load
ings
Like
chal
lenges
,0.8
2H
appy,
0.8
2Im
pat
ient
ifIhav
e
tow
ait,
0.8
0
My
feel
ings
influen
ce
my
hea
lth,
0.9
0
Motiva
ted
toch
ange
lifes
tyle
,0.7
0
Ica
nin
fluen
cem
y
hea
lth,
0.7
6
Difficu
ltie
sto
under
stan
d
ever
yday
life,
0.7
9
Easi
lyfind
solu
tions,
0.7
4M
uch
love
d,
0.7
4W
ant
thin
gs
done
ina
has
te,
0.7
2
My
thoughts
influen
ce
my
hea
lth,
0.8
8
Poss
ibili
ties
toch
ange
beh
avio
ur,
0.7
0
Ica
nin
fluen
ce
my
life,
0.7
1
Oft
entr
eate
dunfa
irly
,0.6
3
Endure
har
dsh
ip,
0.6
9Sa
tisfi
edw
ith
rela
tions,
0.6
8
People
tell
me
to
calm
dow
n,
0.6
9
My
actions
influen
ce
my
hea
lth,
0.6
8
Seek
info
rmat
ion
to
impro
vehea
lth,
0.5
8
Like
tow
ork
har
d,
0.6
8O
ptim
istic,
0.5
8H
urr
ying
when
unnec
essa
ry,
0.6
6
Val
uin
glif
esty
le
chan
ge,
0.
58
Can
see
solu
tions
when
oth
ers
cannot,
0.6
8
Easi
lyan
gry
,0.5
6
Adap
tea
sily
,0.6
4
Self-c
onfiden
t,0.6
3
� 2003 Nordic College of Caring Sciences, Scand J Caring Sci; 2003; 17, 347–357
Students’ self-rated health, sense of coherence and personality traits 351

women there was a positive association between self-rated
health and positive/optimistic personality (p ¼ 0.01,
Cramer’s V¼ 0.23) in that, high levels of optimism related
to fewer symptoms and vice versa. Among women, a low
degree on the SOC scale was associated with more health
complaints and a high SOC with fewer health complaints;
it was stronger for older than younger students (p ¼ 0.001,
Cramer’s V ¼ 0.51) and stronger for women with children
(p ¼ 0.001, Cramer’s V ¼ 0.43) than without children
(p ¼ 0.01, Cramer’s V ¼ 0.28). The number of health
complaints was not related to having children or not, per se.
A low SOC was significantly associated with the com-
plaints ‘high anxiety’ (p ¼ 0.001, Cramer’s V ¼ 0.35 both
for men and women) and ‘depression’ (p ¼ 0.01, Cramer’s
V ¼ 0.26 for women, p ¼ 0.001, Cramer’s V ¼ 0.36 for
men). The association between SOC and anxiety was 0.36
and between SOC and depression 0.29 (p ¼ 0.001 for both
associations). A high degree of positive affect/optimism
was associated with a low degree of anxiety (p ¼ 0.01,
Cramer’s V ¼ 0.29 for women and p ¼ 0.001, Cramer’s
V ¼ 0.35 for men).
Sense of coherence and other personality traits
The association between SOC and ‘Positive Affect/Opti-
mism’ was strong (for women p ¼ 0.001, Cramer’s
V ¼ 0.42; for men p ¼ 0.001, Cramer’s V ¼ 0.53) as well
as the association between SOC and ‘Hardiness’ (for wo-
men p ¼ 0.001, Cramer’s V ¼ 0.25, for men p ¼ 0.001,
Cramer’s V ¼ 0.45). The scores on the scales for ’Positive
Affect/Optimism’ and ’Hardiness’ were related, here too
stronger for men (p ¼ 0.001, Cramer’s V for women 0.27
and for men 0.36). ‘Alienation’ was also found to be
associated with SOC (p ¼ 0.001, Cramer’s V ¼ 0.31,
almost the same for women and men) and furthermore
‘Sense of control’ (p ¼ 0.001, Cramer’s V ¼ 0.28, only for
men). To investigate further the relationships between
SOC and the personality variables, multiple stepwise
regression analyses were performed with SOC as depend-
ent variable and the grouping variables ‘Positive affect/
optimism’, ‘Alienation’, ‘Hardiness’, ‘Type A personality’,
and ‘Sense of Control’ as independent variables. For the
total sample and for the subgroups of women and men,
‘Positive Affect/Optimism’, ‘Alienation’ and ‘Hardiness’
entered into the regression analysis and together accoun-
ted for 58.4% (total sample), 51.6% (women) and 66.5%
(men) of the variance in SOC (see Table 6). The partial
correlation coefficients indicated that ’Positive Affect/
Optimism’ had the highest relative importance of the
independent variables on SOC. The partial correlation
between ’Positive Affect/Optimism’ and SOC was 0.49 for
women and 0.64 for men.
Discussion
Methodological issues
The technique of sampling and data collection is deemed to
be applicable to the aim of the study. The design is weak, as
it is a cross-sectional study and hence no causal conclu-
sions can be drawn. The sample is not population repre-
sentative as it comprised university students, and therefore
caution in generalization of the results is necessary. The
sample was of a large enough size, and was equal in size
between genders. The attrition rate was an acceptable
31%. The response rate indicates that the students did not
Table 3 Description of the sample of university students; socio-demographic variables and self-rated health
Women (n ¼ 160) p-value (CV) Men (n ¼ 168) p-value (CV)
Age <30 years ‡30 years Total <30 years ‡30 years Total
n (%) n (%) n (%) n (%) n (%) n (%)
106 (66) 54 (34) 160 (49/100) 127 (76) 41 (24) 168 (51/100)
Civil status
Living alone 65 (62) 12 (22) 77 (48) * 97 (76) 18 (44) 115 (69) *
Couple 40 (38) 42 (78) 82 (52) (0.38) 30 (24) 23 (56) 53 (31) (0.30)
Children
Without children 99 (94) 11 (20) 110 (69) * 120 (95) 20 (49) 140 (83) *
With children 6 (6) 43 (80) 49 (31) (0.76) 7 (5) 21 (51) 28 (17) (0.53)
Self-rated health
Good health 37 (35) 21 (39) 58 (36) ns 61 (48) 18 (44) 79 (47) ns
Medium 49 (46) 27 (50) 76 (48) 50 (39) 18 (44) 68 (41)
Poor health 20 (19) 6 (11) 26 (16) 16 (13) 5 (12) 21 (12)
ns ¼ non-significant; p-values: * ¼ 0.001; CV ¼ Cramer’s V-index as a measure of association based on chi-square values, estimating the magnitude
of the differences between the groups of younger and older women and men respectively. One woman did not answer the question if she lived with
or without children.
�
�
�
� �
�
� 2003 Nordic College of Caring Sciences, Scand J Caring Sci; 2003; 17, 347–357
352 M.I.K. von Bothmer, B. Fridlund

object to participating in the study, which was an ethical
demand from the vice chancellor.
A weakness in the present study is that health was
measured only by self reports. On the other hand, it has
been convincingly shown that self-rated health predicts
mortality (2, 31) and thus functions as a valid measure of
health, and that symptoms reporting is a valid method in
assessing self-rated health (2, p. 72).
Cronbach’s alpha coefficient for the SOC scale was 0.91
in this study and underlines Antonovsky’s argument that
the instrument is reliable as it consistently shows high
internal consistency in a variety of studies (7). The validity
of the SOC scale has been disputed (7, 22, 32). Langius
et al. (20) stated that SOC is a valid and reliable tool,
although their samples were small (between 13 and 22
subjects) and SOC was measured both in VAS and Likert
format showing moderately high correlations between
SOC and two other psychometric scales. Tishelman (15)
doubted if we really know what the SOC scale measures,
and argued further that there is no evidence for validity in
congruence in results between SOC and other instruments.
She questioned the construct validity of SOC and also its
specificity and sensitivity.
Many researchers have tried to validate the SOC con-
struct by exploratory and confirmatory factor analysis,
and have reached contrasting results. Sandell et al. (32)
found that SOC neither measures one single factor, nor
the three original components. Feldt et al. (22) arrived at
similar results but their conclusion was that SOC meas-
ures one general factor (sense of coherence) whose
Table 4 Correlation matrix for all composite variables for the total sample of university students and for women and men
1 2 3 4 5 6 7 8 9
1 Self-rated health
T 1.0
w
m
2 Perceived health influence
T ns 1.0
w ns
m ns
3 Motivation for a healthy lifestyle
T ns 0.27*** 1.0
w ns 0.30***
m ns ns
4 SOC
T 0.21*** ns ns 1.0
w 0.34*** ns ns
m ns ns ns
5 Positive affect/optimism
T ns ns ns 0.54*** 1.0
w 0.21** ns ns 0.48***
m ns ns ns 0.60**
6 Hardiness
T ns ns 0.25*** 0.41*** 0.39*** 1.0
w ns 0.21** 0.33*** 0.30*** 0.34***
m ns ns 0.20** 0.51*** 0.44***
7 Sense of control
T ns 0.29*** ns 0.23*** 0.28*** 0.29*** 1.0
w ns 0.33*** ns ns 0.27** ns
m ns 0.26*** 0.21** 0.35*** 0.28*** 0.39***
8 Alienation
T ns ns ns )0.38*** )0.29*** )0.21*** )0.20*** 1.0
w )0.24** ns ns )0.40*** )0.26** )0.24** ns
m ns ns ns )0.36*** )0.30*** ns )0.30***
9 Type A personality
T )0.27*** ns ns ns ns ns ns 0.22*** 1.0
w )0.27*** ns 0.21** ns ns ns ns ns
m )0.23** ns ns ns ns ns ns 0.34***
ns ¼ non significant; p-values: ***0.001, **0.01, *0.05. T ¼ total sample, w ¼ women, m ¼ men.
� 2003 Nordic College of Caring Sciences, Scand J Caring Sci; 2003; 17, 347–357
Students’ self-rated health, sense of coherence and personality traits 353

influence is shared with the highly interrelated first-order
factors (meaningfulness, comprehensibility, manageabil-
ity). The factor analysis made in the present study on
SOC showed results similar to the study of Sandell et al.
(32) (Table 1). The first factor comprised almost the same
items as the first factor in the study of Sandell et al.
(items 7, 8, 11, 13, 14, 16, 22) and identified the
meaningfulness component. Their conclusion that the
components meaningfulness and comprehensibility are
validated is, however, refuted in the present study, as the
factor analysis showed inconsistencies between the the-
oretical concepts and the identified factors.
Another problem is how the items on future change
correspond to the SOC scale. In this study, the factor
analysis gave a five-factor solution, with a low Cronbach’s
alpha coefficient for the factor called ‘changing future’.
Antonovsky reported already in 1993 (7) that colleagues
were troubled with the two items 10 and 17, and Sandell
et al. (32) could not fit them in a three-factor solution.
Feldt et al. (24) found that item five and item six did not fit
the three-factor solution and then simply discarded them
in the following analysis. It would be interesting to test the
SOC scale by omitting ‘future changing’ items and run an
exploratory factor analysis and also compare this new scale
with self-rated health and with the concepts positive
affect/optimism and hardiness.
The personality traits measured by the PHI are defined as
they are operationally defined by factor analysis, and may,
therefore, lack in validity and reliability. Hardiness
research has been ‘plagued by measurement problems’
(33, p. 73) and many different hardiness instruments have
been tested (9, 33) to find a valid and reliable instrument.
One of them, the Cognitive Hardiness Scale (CHS) (34)
comprises questions about personal beliefs about life rela-
ted to commitment to family and self, and to challenges
and control. All these areas were covered in the PHI but
only six items loaded on the ‘hardiness’ factor and the rest
loaded on ‘Health Influence’, ‘Motivation for a healthy
lifestyle’ and ‘Sense of control’ (Table 2). The PHI factor
‘Hardiness’ could be looked upon as bearing the meaning
of the concept hardiness and with an acceptable reliability
coefficient of 0.84 it is strong enough to be measured
Table 5 SOC, means, standard deviations and ranges, for the sample of university students, women and men, in relation to socio-demographic
variables
Women Men
n Mean SD Range p-value (CV) n Mean SD Range p-value (CV)
Total 157 142.5 21.4 47–187 162 142.6 21 82–187
<30 years 104 140.3 21.5 47–187 * (0.21) 121 143 21.8 82–187 ns
‡30 years 53 146.9 20.9 97–180 41 141.6 20.5 88–171
Without children 107 139.7 22 47–187 * (0.23) 135 142.8 21 82–186 ns
With children 49 149 19 85–180 27 141.9 21.2 88–187
Single 76 137.9 20.3 83–180 ** (0.28) 109 140.8 21.8 82–184 ns
Couple 80 147.2 21.7 47–187 53 146.3 19 88–187
No significant difference between women and men. ns ¼ no significant differences between groups; p-values: **0.01, *0.05. CV ¼ Cramer’s
V-index as a measure of association based on chi-square values, estimating the magnitude of the differences between the groups younger/older,
without/with children and single/couple.
Table 6 Multiple regression analysis: SOC and other personality traits among the total sample of university students and among women and men
Sample Step Grouping variables Adjusted R2 R2 change F change F (final model) Beta (final model) Partial correlation (final model) Tolerance
Total 1 PAO 0.50 0.502 295.24** 0.52** 0.55 0.68
2 Alienation 0.55 0.046 29.55** )0.21** )0.29 0.85
3 Hardiness 0.58 0.036 25.52** 0.23** 0.30 0.74
4 Type A 0.59 0.010 7.29* 106.22** )0.10* )0.16 0.96
Women 1 PAO 0.45 0.450 121.06** 0.49** 0.49 0.66
2 Hardiness 0.48 0.033 9.26* 0.21* 0.25 0.78
3 Alienation 0.51 0.033 9.84* 51.72** )0.20* )0.25 0.82
Men 1 PAO 0.58 0.555 197.78** 0.58** 0.64 0.66
2 Alienation 0.65 0.082 28.16** )0.27** )0.42 0.93
3 Hardiness 0.69 0.028 11.09** 97.78** 0.19** 0.27 0.69
PAO ¼ positive affect/optimism; p-values: **0.001, *0.01.
� 2003 Nordic College of Caring Sciences, Scand J Caring Sci; 2003; 17, 347–357
354 M.I.K. von Bothmer, B. Fridlund

against SOC and other personality trait variables in this
study.
The ‘Positive Affect/Optimism’ factor with a reliability
coefficient of 0.78 corresponds to one factor in the Positive
and Negative Expectancy Questionnaire (PANEQ) devel-
oped by Olason and Roger, which measures happiness,
contentment and optimism (35). The PANEQ scale was
constructed for refinement of the measurements of opti-
mism and pessimism, as studies have challenged the uni-
dimensional construct of optimism–pessimism by Scheier
and Carver (35).
The items loading on the factor ‘Type A personality’ in
the PHI corresponded to characteristics for a Type A per-
sonality e.g. impatient, sense of time urgency, restlessness
and anger (3, 36), and with an alpha coefficient of 0.74 this
factor is considered to be valid for measuring the Type A
personality trait in this study.
Reliability coefficients for ‘Motivation for a healthy
lifestyle’, ‘Sense of control’ and ‘Alienation’ were not
acceptable and hence minor attention is given to these
constructs in the present study. The PHI showed a mod-
erately good but not perfect accuracy (27), as Cronbach’s
alpha was 0.76 for the full instrument and the factors
together explained 61% of the variance. However, a
reliability of 0.70 is considered acceptable for a newly
developed instrument (30).
To denote the importance of statistically significant
results, they are reported together with Cramer’s V as a
measure of association although chi-square-based meas-
ures are difficult to interpret. As the sample is rather large,
it is easy to get statistical significances, and in order to
obtain some estimation of magnitude, Cramer’s V-index
was used (28, p. 354). It was also used because it is not
dependent on the number of cells or on equally large
sample sizes, and because it is suitable for data on both
nominal and ordinal level measurement (37), which
makes chi square values from different tables comparable
(28). According to Kerlinger (27, p. 189), a correlation
between 0.20 and 0.30 could be of interest, if it is statis-
tically significant, when n is larger than 100. As the sample
was more than 300, statistically significant correlations
>0.20 are reported. The correlations were measured with
Spearman’s Rho coefficient, as data were on nominal and
ordinal levels, respectively. In order to compare the results
from this study with other similar studies, a multiple
regression analysis was used as the assumptions for doing
such an analysis were met (28).
Result issues
The most interesting result from this study is not the
results per se, but what the results say about personality
trait measures. This study showed that SOC was highly
correlated with positive affect/optimism (see regression
analysis, Table 6), which had the highest relative
importance of the independent variables on SOC. The
higher female students scored on the SOC scale and on
positive affect/optimism, the fewer symptoms they had.
That positive emotions seem to be linked to health is
shown in other studies (12, 38), and this may be one of the
explanations for high scores on SOC being associated with
good health, as SOC and optimism show strong internal
correlations (38). Is high SOC then the same as a positive
outlook on life, or is it something else underlying SOC,
that is the acting, health enhancing factor? The Pallant &
Lae (38) study showed a negative correlation between SOC
and symptoms for both genders, and a correlation between
SOC and optimism that was greater for females than for
males, which is in contrast to this study. It could be dis-
cussed whether optimism and a strong sense of coherence
are health enhancing only for women, or if it is the
instrument that is gender biased (15, 16). Is low SOC then
acting against health or is it like Kivimaki et al. (23, p. 594)
suggested, that SOC and pathogenic psychological traits
(depression and anxiety) refer to the same phenomenon.
In contrast to Kivimaki et al. (23) we found that both
ends of the SOC scale were related to ill-health among
women, but similar to that study we found a gender dif-
ference in that SOC was not correlated to health among
male students. However, this differs from other studies
where no gender differences in the relation between SOC
and health were detected or reported (25, 38). It has been
argued that a gender difference in the SOC scale implies
that the SOC theory suffers from a true limitation (23, 39).
Antonovsky stated that the SOC scale was a construct
not bound to culture, social class, gender or age (6), which
has been challenged by Tishelman (15) and Geyer (16).
The present study showed a gender difference but further
research is needed to fully explore gender differences.
An age difference in SOC means were found only for
female students and this contrasts the findings of Feldt et al.
(24), who argued that their findings underscore the need
of a revision of Antonovsky’s theory. However, as men
comprise 91–93% of their studied populations and the
‘older group’ was between 35 and 40 years, this issue
needs to be further investigated. The age of the studied
group may have influenced the SOC scores in this study,
although the age range was greater than in the study by
Feldt et al. (24), who found that age did not play a role in
the SOC levels.
There has been argument about whether the relation
between SOC and health could be related to methodolo-
gical or conceptual confounding (23, 39). Conceptual
confounding has been discussed in relation to negative
affectivity (18, 38), anxiety, depression (16, 17), psycho-
logical well-being (39), hostility (19), self-esteem, per-
ceived control and optimism (38). Possible methodological
confounding is presented in the discussion of methods.
The relation between health and hostility is explained by
Vahtera et al. (40) as hostility hampers the individual to
� 2003 Nordic College of Caring Sciences, Scand J Caring Sci; 2003; 17, 347–357
Students’ self-rated health, sense of coherence and personality traits 355

benefit from psychosocial resources and this could lead to
greater health risks. Riska (36) discussed the origin of the
hostility concept and its relation to health by following the
development of the concept ‘Type A man’ to ‘Type A
personality’. Later on the link between Type A and illness
was said to be due to the hostility component (11, 19).
Langius et al. (20, p. 170) found that ‘those with lower
scores on the SOC scale seem to be more anxious and
hostile’, the evidence for this is a Pearson r-value of )0.619
(p ¼ 0.05) for the relation between SOC and anxiety
proneness in the Karolinska Scales of Personality (KSP)
and )0.763 (p ¼ 0.01) between SOC and hostility on the
same scale for 12 individuals. This is referred to as evidence
by Kivimaki et al. (19) who wanted to verify their hypo-
thesis that SOC has a mediating role between hostility and
health. The present study did not measure hostility, but
one item in the ‘Type A personality’-factor of our instru-
ment is one part of Kivimaki et al.’s (19) definition of
hostility, and this correlated significantly with self-rated
health, and was also found to have partial correlation with
SOC in the regression analysis, but explained no more
than 1% of the variance of SOC. This needs further
investigation as the results are not unequivocal.
Conclusions
The present study showed a positive association between
self-rated health, positive affect/optimism and SOC only
for female university students. As the correlations were
strong between sense of coherence, positive affect/opti-
mism, and hardiness, it is difficult to draw any conclusions
about what actually influences health among personality
variables in this population group. The impact of optimism
and anger/hostility on health needs to be further explored.
The results indicate a need to further validate and develop
the SOC scale in relation to possible confounders and
especially to the concepts positive affect/optimism and
hardiness; and to assess what the global orientation of
sense of coherence actually is. There is a need to investi-
gate if the SOC scale is gender biased and if so, in what
respects, and also to test the construct validity with respect
to conflicting findings of the scale as unidimensional or
comprising three different components. The significance of
the present study is that it raises questions related to the
validity and specificity of the SOC instrument and points at
possible directions for future research in the field.
Implications
Future research needs to consider the gender differences in
the relationships between measures of health and the SOC
scale, as well as with other scales. One way to test the
validity and sensitivity of the SOC concept would be to use
method triangulation: for example, test the original SOC
scale together with interviews. Ideally, the research should
use big community-based samples rather than university
students, and have prospective and longitudinal designs in
order to make causal conclusions possible. Universities, in
general, and student health organizations could support
students in different ways so that feelings of alienation are
minimized and self confidence and a sense of optimism is
nourished, as this probably is health promoting.
Acknowledgements
Financial support is gratefully acknowledged from the
Faculty of Medicine, Lund University, Lund, the Associ-
ation Nurses’ Home of Southern Sweden, Lund; Halmstad
University, School of Social and Health Sciences, Halmstad,
and Goteborg University, Department of Primary Health
Care, Goteborg.
References
1 Leslie E, Owen N, Salmon J, Bauman A, Sallis JF, Kai Lo S.
Insufficiently active Australian college students: perceived
personal, social, and environmental influences. Prev Med
1999; 28: 20–27.
2 Bue Bjorner J, Sondergaard Kristensen T, Orth-Gomer K,
Tibblin G, Sullivan M, Westerholm P. Self-Rated Health: A
Useful Concept in Research, Prevention and Clinical Medicine.
1996, The Swedish Council for Planning and Coordination of
research (FRN), Stockholm.
3 Sarafino EP. Health Psychology – Biopsychosocial Interactions, 3rd
edn. 1998, Wiley & Sons, New York.
4 Cohen DA, Scribner RA, Farley TA. A structural model of
health behaviour: a pragmatic approach to explain and
influence health behaviours at the population level. Prev Med
2000; 30: 146–54.
5 Antonovsky A. Unraveling the Mystery of Health – How People
Manage Stress and Stay Well. 1987, Jossey-Bass, San Francisco,
CA.
6 Antonovsky A. The salutogenic model as a theory to guide
health promotion. Health Promot Int 1996; 11: 11–18.
7 Antonovsky A. The structure and properties of the sense of
coherence scale. Soc Sci Med 1993; 36: 725–33.
8 Kobasa SC. Stressful life events, personality and health: an
inquiry into hardiness. J Pers Soc Psychol 1979; 37: 1–11.
9 Jennings BM, Staggers N. A critical analysis of hardiness.
Nurs Res 1994; 43: 274–81.
10 Friedman HS, Booth-Kewley S. The ‘disease-prone person-
ality’: a meta-analytic view of the construct. Am Psychol 1987;
42: 539–55.
11 Conduit EH. If A-B does not predict heart disease, why
bother with it. A clinician’s view. Br J Med Psychol 1992; 65:
289–96.
12 Pettit JW, Kline JP, Gencoz T, Gencoz F, Joiner TE. Are
happy people healthier? The specific role of positive affect in
predicting self-reported health symptoms. J Res Pers 2001; 35:
521–36.
13 Peterson C, Seligman MEP. Explanatory style and illness.
J Pers 1987; 55: 237–65.
� 2003 Nordic College of Caring Sciences, Scand J Caring Sci; 2003; 17, 347–357
356 M.I.K. von Bothmer, B. Fridlund

14 Scheier MF, Carver CS. Dispositional optimism and physical
well-being: the influence of generalized outcome expectan-
cies on health. J Pers 1987; 55: 169–210.
15 Tishelman C. Nagra kritiska reflektioner over vart okritiska
bruk av matinstrument: exemplet Kansla av sammanhang
frageformular (Critical reflections on the uncritical use of
measuring instruments: example Sense of Coherence Ques-
tionnaire). Vard Nord Utveckl Forsk 1996; 16: 33–37.
16 Geyer S. Some conceptual considerations on the sense of
coherence. Soc Sci Med 1997; 44: 1771–9.
17 Hart KE, Hittner JB, Paras KC. Sense of coherence, trait
anxiety, and the perceived availability of social support. J Res
Pers 1991; 25: 137–45.
18 Strumpfer DJW, Viviers MR, Gouws JF. Item-phrasing in
Antonovsky’s sense of coherence scale related to negative
and positive affectivity. Person Individ Dif 1998; 24: 669–75.
19 Kivimaki M, Elovainio M, Vahtera J, Nurmi JE, Feldt T,
Keltikangas-Jarvinen L, Pentti J. Sense of coherence as a
mediator between hostility and health. Seven-year pros-
pective study on female employees. J Psychosom Res 2002; 52:
239–47.
20 Langius A, Bjorvell H, Antonovsky A. The Sense of Coher-
ence concept and its relation to personality traits in Swedish
samples. Scand J Caring Sci 1992; 6: 165–71.
21 Langius A, Bjorvell H. Coping ability and functional status in
a Swedish population sample. Scand J Car Sci 1993; 7: 3–10.
22 Feldt T, Leskinen E, Kinnunen U, Mauno S. Longitudinal
factor analysis models in the assessment of the stability of
sense of coherence. Pers Individ Dif 2000; 28: 239–57.
23 Kivimaki M, Feldt T, Vahtera J, Nurmi JE. Sense of coher-
ence and health: evidence from two cross-lagged longitud-
inal samples. Soc Sci Med 2000; 50: 583–97.
24 Feldt T, Leskinen E, Kinnunen U, Ruoppila I. The stability of
sense of coherence: comparing two age groups in a 5-year
follow-up study. Pers Individ Dif 2003 in press.
25 Suominen S, Helenius H, Blomberg H, Uutela A, Koskenvuo
M. Sense of coherence as a predictor of subjective state of
health. Results of 4 years of follow-up of adults. J Psychosom
Res 2001; 50: 77–86.
26 Peterson C, Stunkard AJ. Personal control and health pro-
motion. Soc Sci Med 1989; 28: 819–28.
27 Kerlinger FN. Foundations of Behavioral Research, 3rd edn.
1986, Harcourt Brace Jovanovich, Forth Worth, TX.
28 Norusis MJ. SPSS 8.0 Guide to Data Analysis. 1998, Prentice
Hall, Upper Saddle River, NJ.
29 Nunnally JC. Psychometric Theory, 2nd edn. 1978, McGraw-
Hill, New York.
30 Burns N, Grove SK. The Practice of Nursing Research: Conduct,
Critique, & Utilization, 3rd edn. 1997, WB Saunders Company,
Philadelphia, PA.
31 Carlson P. Self-perceived health in East and West Europe:
anotherEuropeanhealthdivide. Soc Sci Med1998;46: 1355–66.
32 Sandell R, Blomberg J, Lazar A. The factor structure of
Antonovsky’s Sense of Coherence scale in Swedish clinical
and nonclinical samples. Pers Individ Dif 1998; 24: 701–11.
33 Maddi SR, Khoshaba DM, Persico M, Lu J, Harvey R,
Bleecker F. Brief report: the personality construct of hardi-
ness. II. Relationships with comprehensive tests of person-
ality and psychopathology. J Res Pers 2002; 36: 72–85.
34 Beasley M, Thompson T, Davidson J. Resilience in response
to life stress: the effects of coping style and cognitive hardi-
ness. Pers Individ Dif 2003; 34: 77–95.
35 Olason DT, Roger D. Optimism, pessimism and ‘fighting
spirit’: a new approach to assessing expectancy and adapta-
tion. Pers Individ Dif 2001; 31: 755–68.
36 Riska E. The rise and fall of Type A man. Soc Sci Med 2000; 51:
1665–74.
37 Siegel S, Castellan NJ. Nonparametric Statistics for the Behavioral
Sciences, 2nd edn. 1988, McGraw Hill, New York.
38 Pallant JF, Lae L. Sense of coherence, well-being, coping and
personality factors: further evaluation of the sense of
coherence scale. Pers Individ Dif 2002; 33: 39–48.
39 Larsson G, Kallenberg KO. Sense of coherence, socioeco-
nomic conditions and health. Interrelationships in a nation-
wide Swedish sample. Eur J Public Health 1996; 6: 175–80.
40 Vahtera J, Kivimaki M, Uutela A, Pentti J. Hostility and ill
health: role of psychosocial resources in two contexts of
working life. J Psychosom Res 2000; 48: 89–98.
� 2003 Nordic College of Caring Sciences, Scand J Caring Sci; 2003; 17, 347–357
Students’ self-rated health, sense of coherence and personality traits 357