self-concept thesis - digital library/67531/metadc663808/m2/1/high... · combs and snygg define the...
TRANSCRIPT

377A/Il
SELF-CONCEPT AND SOCIOMETRIC
CHOOSING AND STATUS
THESIS
Presented to the Graduate Council of the
North Texas State University in Partial
Fulfillment of the Requirements
For the Degree of
MASTER OF SCIENCE
By
D. Jack Nicholas, B. S. E., B. D.
Denton, Texas
May, 1963
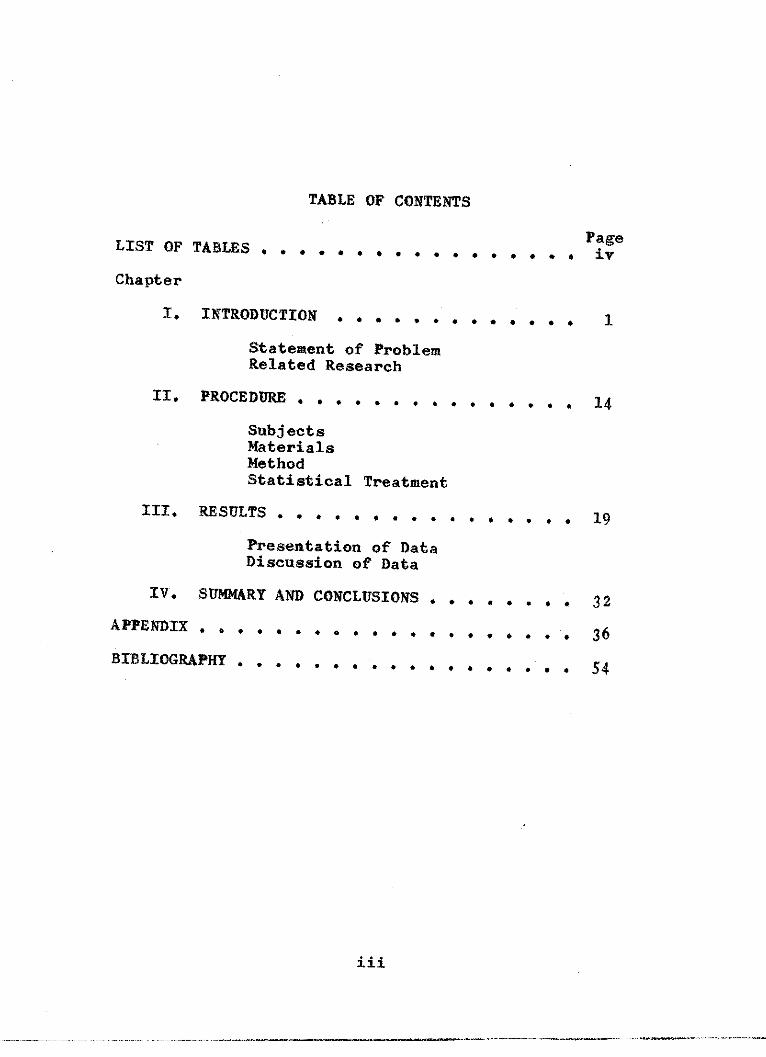
TABLE OF CONTENTS
LIST OF TABLES , .Page
Chapter
I. INTRODUCTTIIOO,., , ,,, , I
Statement of ProblemRelated Research
II. PROCEDURE . . . . . . . . . . . 14
SubjectsMaterialsMethodStatistical Treatment
III. RESULTS * . . . . , . , . , , , * * 19
Presentation of DataDiscussion of Data
IV. SUMMARY AND CONCLUSIONS . . . . .. . . 32
APPENDIX * . . . * . . * . . * . . * . . . . . 36BIBLIOGRAPHY - .9...... .9... .. 54
iii

LIST OF TABLES
Table
I.
II.
III,
IV.
t-Ratios for Choices Received, Population
bo-Ratios for Choices Received, Population
t-Ratios for Mutual Choices, Population I
t-Ratios for Mutual Choices, Population II
V. t-Ratios for Choices Given, Population I
VI. t-Ratios for Choices Given, Population II
VII. t-Ratios for Intelligence Quotients,
. Population I . . . . . . . . .. ..
VIII. t-Ratios for Intelligence Quotients,PopulationlI . . . . . . . . ..
IX. t-Ratios for Intelligence Quotients,Population I . . . . . . . . .
X. t-Ratios for Intelligence Quotients,Populationll . ..... ..
XI. An Intercorrelation of Variables,Population I * . . . . . . ..
XII. An Intercorrelation of Variables,PopulationIl . *. . .. .*. * .
XIII. Raw Data, Population 1 . * , . * . . .
XIV. Raw Data, Population II . . . . . . . * .
Page
I . . 20
II . 21
. . . 22
. . 23
. . . 24
. . . 25
. . . 26
. . . 27
. . . 28
. * . 29
. . . 37
. * . 38
. . . 39
. * . 40
iv

CHAPTER 1
INTRODUCTION
One of the oddest events in the history of modern
psychology is the manner in which the ego (or self) became
sidetracked and lost to view. (2, p. 451).
The concept of self was introduced as early as 1890
when William James devoted a chapter to the self in his
Principles off spcholry (15). Sigmund Freud, in his
later writings (12), developed his concept of the ego.
Despite the possibilities pointed up by these men, the
implications of their theories were not followed up until
the past two decades. The behaviorists and the func-
tionalists who reigned in American psychology from the
1920's until the 1940''s carefully ignored the concept of
self. There has been, within the past two decades, a
renewed interest in the self. A survey of psychological
literature of the past twenty years reveals a barrage of
writing and empirical investigation in this area.
The research dealing with the self falls generally
into one of two categories: the phenomenal (or conscious)
self and the nonphenomenal (unconscious or agent) self.
The present study is restricted to the consideration of the
conscious self.
1
2
The phenomenal theorists are in general agreement
concerning the definition of the self. Raimy first defined
self-concept as follows: "The self-concept is the more or
less organized perceptual object resulting from present and
past self observation . . . Lit isJ what a person believes
about himself." (20).
Rogers defines self-concept as:
an organized configuration of perceptionsof the self which are admissible to awareness.It is composed of such elements as the per-ceptions of one's characteristics and abilities;the percepts and concepts of the self in relationto others and to the environment; the valuequalities which are perceived as associated withexperience and objects; and goals and idealswhich are perceived as having positive ornegative valence. (21, p. 136).
Combs and Snygg define the phenomenal self as "the
individual's own unique organization of ways of regarding
self; it is the Gestalt of his concepts of self." (7, p.126)
Statement of Problem
Rogers states: "The person who accepts himself will,
because of this self-acceptance, have better interpersonal
relations with others." (21, p. 520).
According to Roger's hypothesis, those who are genuine
self-accepting should fare better socioetrically than those
who have negative self-feelings. Those who possess positive
self-concepts will so behave that others will react towards
them positively. Those who possess negative self-concepts

3
will so behave that others will react to them negatively.
In an investigation attempting to confirm Rogers' hypothesis,
Fey suggests: 4 . . . it is quite possible that the genuinely
self-accepting person truly accepts others, that he does not
threaten them, and is rewarded in turn by their acceptance."
(10, p. 276). Jervis maintains "There is general agreement
that a negative self-concept indicates stress and tension."
(16, p. 3355). Bills states, "From the point of view of
phenomenological psychology, maladjustment may be defined
as any discrepancy between the concept of self and the
concept of the ideal self." (4, p. 258).
It would appear, on the basis of the above theoretical
constructs, that self-accepting individuals enjoy better
sociometric status than those individuals who foster
negative self-feelings. The purpose of this study is to
investigate the relation between two of the most important
indices of adjustment: self-concept and sociometric status.
Hypothesis It Those with low self-ideal-self discrepancy
will receive more sociometric choices than those with high
self-ideal-self discrepancy.
fypothesis IT: Those with a low self-ideal-self
discrepancy will make more realistic sociometric choices
than those with high self-ideal-self discrepancy.

4
Hyothesis II: Those who are self accepting (low
self-ideal self discrepancy) will be more accepting of
others (more expansive in sociometric choosing).
Hpotheis iV Those with low self-ideal self
discrepancy scores will have higher IQts than those with
high self-ideal self discrepancy scores.
Hypothesis t Those with high choice-status will
have higher IQ's than those with low choice-status.
Related Research
It has been noted that investigation in the area
of the self-concept has been restricted, for the most
part, to the past two decades. It will be observed that
the studies referred to in this chapter are, with one
exception, subsequent to 1950.
Self-Concept and Sociometric Status
Most of the studies which have been made relative to
self-concept and sociometric status reflect a positive
relationship between the two. In Coopersmith's study
(8, p. 94) of 102 fifth and sixth-grade children, "signifi-
cant correlations were obtained between self-esteem and
sociometric choice" (r = .37 : p. 01). Self-concept was
measured by a 50-item inventory and sociometric choice
was determined by the subject's choice of those desired as
friends.

5
Schiff (22, p. 216), in a study of 141 high school
students, found that those who underestimate their socio-
metric status perceive themselves as being below the group
average in their acceptance by others.
Zelen (28, p. 316), after administering the Bonney
Sociometric and the Who-Are-You test to 145 sixth-grade
children, found positive correlation between self-acceptance
and peer-acceptance (r = .39).
In a study of 62 college men, Brownfain (6, p. 605)
concluded that those with more stable self-concepts not
only are better liked and considered more popular by the
group but also know more people in the group and are better
known by the group, indicating more active social partici-
pation.
Katz, in a study dealing with the relationship between
the stability of the self-concept and sociometric status
and sociometric perception, obtained significant positive
correlations between stability of self-concept and socio-
metric status (17, p. 877).
In their study of college students, Turner and Vander-
lippe found that those with high self-ideal self congruence
ranked higher on all eleven sociometric items than those
with low self-ideal self congruence, eight of the eleven
items yielding an acceptable level of significance. (27,
p. 205).

6
While the preponderance of research indicates a sig-
nificant positive relationship between positive self-concept
and sociometric status, several studies fail to reflect this
relationship.
The efforts of McIntyre and Fey (10) to confirm the
Rogerian hypothesis mentioned in the statement of the
problem met with negative results. McIntyre found, no sig-
nificant positive correlation between self acceptance and
sociometric status. Fey's study showed that those with
high self-acceptance scores tend to accept others, to feel
accepted by others, but actually to be neither more nor
less accepted by others.
Silvers study (24, p. 167), involving 56 male
adolescents, produced results similar to those obtained
by Fey (10). His results indicate that level and stability
of self-concept ratings is significantly associated with
perceived measures of peer acceptance but not with actual
measures of peer acceptance or with accuracy of social
perception.
Fiedler et al. (11, p. 350) also failed to find
significant correlation between self-esteem and sociometric
status. Their study involved four nonclinical groups of
males in which they investigated the relationship between
self-esteem and sociometric status and self-esteem and

7
mean esteem by others. Only one r between self-esteem and
mean esteem by others was significant at the 5 per cent
level.
Larson's investigation of the association between
accuracy and stability of self-concept and sociometric
failed to show significant correlation. (18, p. 1847).
Of the five studies mentioned which failed to produce
significant positive correlation between self-concept and
sociometric status, two conclude that their hypotheses were
untested or untestable (Fey and Larson). The majority of
the studies investigating the relationship between self-
concept and sociometric status indicate significant positive
correlations.
Self-Concept and Sociometric ChoosingResearch relative to acceptance of self and acceptance
of other has been stimulated by Adler (1), who suggested
that depreciation of others is characteristic of those who
themselves felt inferior and by Horney (14), who insists
that the individual who does not love himself is incapable
of loving others.
Stock (25, p. 180), in a study of case histories of
ten clients, noted a definite relationship between the way
an individual feels about himself and the way he feels about

8
other persons. "An individual who holds negative feelings
toward himself tends to hold negative feelings towards other
people in general."
Sheerer (23, p. 175), also studying therapy interviews,
reported that as acceptance for self increased during inter-
views acceptance for others also increased. She found "a
definite and substantial correlation between attitudes of
acceptance of and respect for self and attitudes of acceptance
of and respect for self and attitudes of acceptance of and
respect for others."
The findings of Omwake's study (19, p. 445) support
the hypothesis that there is a positive relation between
the acceptance of self and the acceptance of others in
that there is a marked relation between the way an
individual sees himself and the way he sees others. Those
who reject themselves tend to reject others.
Berger's study (3, p. 781), which involved 315 subjects,
including adults, college students, prisoners, speech problem
cases, and counselees, confirmed the generalization that
expressed acceptance of self is positively correlated with
expressed acceptance of others.
In a study already quoted, Schiff (22, p. 134) reported
that those who consistently underestimated their own socio-
metric status were below the group average in their acceptance
of others.

9
Studies which failed to show a positive relationship
between self-concept and acceptance of others were made by
Zelen (28, P. 316), who hypothesized that such a relation-
ship did exist, and by Jervis (16, p. 3356), who hypothe-
sized that such a relationship did not exist.
Intelligence and oigmetric Status
Bonney (5, p. 106) asserts that when intellectually
gifted children (as a group) are contrasted with those of
only average intelligence there are marked and consistent
personality advantages in favor of those in the highly
intelligent grouping; he quotes the studies of Terman,
Feinberg, and Grossman and Wrighter as substantiation.
(5, p. 106).
Terman (26, p. 223) found, in his study of 1,500
children of IQ 140 or higher, that they are appreciably
superior to unselected children in social adjustment as
rated by teachers.
Grossman and Wrighter (13, P. 349) report the usual
low positive correlation between intelligence and socio-
metric status on the assumption of a rectilinear relationship.
However, when the sample was broken down into three cate-
gories--below normal, normal and superior, very superior and
near genius--a significant difference was found in the
average sociometric score between those in the below normal

10
group and the normal--superior group. Thus, intelligence
makes a difference up to a certain point--normal intelli-
gence--but thereafter it does not materially affect the
sociometric score.
Feinbergts findings (9, p. 211) indicate that those
who were accepted had marks in the top 25 per cent of their
class and had received prizes because of excellence in
school grades. Those rejected, on the other hand, fell
academically in the third 25 per cent of their class.

CHAPTER BIBLIOGRAPHY
1. Adler, Alfred, The Neurotic Ceaitution, New York,Dodd, Mead, 1926.
2. Allport, G. W., "The Ego in Contemporary Psychology,"Psychological jefey, L (1943, 451-478.
3. Berger, Emanuel M., "The Relation Between ExpressedAcceptance of Self and Expressed Acceptance ofOthers," Jurnal of Abnormal and Socialflyholog7, ILVICI19,i778Zf2.
4. Bills, R. B., Vance, E. L., and McLean, 0. S.,"An Index of Adjustment and Values " Journal
Consultia Percholory, XV (19515, 257-261.
5. Bonney, Merl E., Mental Health iEn nationn, Boston,Allyn and Bacon, Inc., 1960.
6. Brownfain, John J., "Stability of the Self-Conceptas a Dimension of Personality," Journal ofAbnormal and Social Psycholon, 2III 1952),597-606.
7. Combs, Arthur W., and Snygg, Donald, InjdualBehavior A fPercetual 4pProach t kkha ,New York, Harper and Brothers, 1959.
8. Cooperemith, Stanley, "A Method for Determining Typesof Self-Esteem," Journal of Abnormal and SocialPsychology, LII (1959), 87-94.
9. Feinberg, M. R., "Relation of Background Experience toSocial Acceptance," Journal of Abnormal andSocial P ehlo , XLVIII (1953), 206-214.
10. Fey, William F., "Acceptance by Others and ItsRelation to Acceptance of Self and Others:A Revaluation," Journal of Abnormal andSocial yrcholog , L (1955), 274-276.
11

12
11. Fiedler, F. B., Dodge, Joan S., Jones, R. B., andHubhins, B. B., "Interrelations Among Measuresof Personality Adjustment in NonclinicalPopulations," Journal of Abnormal and SocialPsychology, LVI (1958), 345-351.
12. Freud, Sigmund, TheEgg and jdtId, London, HogarthPress, 1927.
13. Grossman, B. and Wrighter, J., "The RelationshipBetween Selection-Rejection and Intelligence,Social Status, and Personality Amongst SixthGrade Children," Sociometry, XI (1948), 346-355.
14. Horney, Karen, ewWays in Psychoanalysis, New York,V. W. Norton, 1939.
15. James, William, Principles of Pycho , Vol. I,New York, Henry Holt and Company, 1 90.
16. Jervis, F. M., "The Meaning of a Positive Self-Concept," Dissertation Abstracts, XIX (1958),3355-3356.
17. Katz, I. S., "A Study of the Stability of the Self-Concept and its Relationship to SociometricStatus and Sociometric Perception," DissertationAbstracts, III (1958), 877.
18. Larson, J. R., "An Analysis of the RelationshipBetween Accuracy of and Stability of Self-Concept and Sociometric Status," DissertationAbstracts, XIX (1958), 1846-1847,
19. Omwake, Katharine T., "The Relation Between Acceptanceof Self and Acceptance of Others Shown by ThreePersonality Inventories," Journal of ConsultingPrsholo , XVIII (1954), 443-446.
20. Raimy, V. C., "The Self-Concept as a Factor in Counselingand Personality Organization," unpublished doctoraldissertation, Ohio State University, 1943.
21. Rogers, Carl R., Client-Centered Thera r, Boston,Houghton Mifflin Company, 1951.

13
22. Schiff, Herbert, "Judgmental Response Sets in thePerception of. Sociometric Status," Sociometry,XVII (1954), 207-227.
23. Sheerer, E. T., "An Analysis of the RelationshipBetween Acceptance of and Respect for Self andAcceptance of and Respect of Others in TenCounseling Cases," Journal of ConsultingPs gjggy, Xiii (134WJ7169-175.
24. Silver, Albert W., "The Self-Concept: Its Relationshipto Parental and Peer Acceptance," jqijjrtationAbstracts, XIX (1958), 166-167.
25. Stock, Dorothy, "An Investigation into the Inter-relation Between the Self-Concept and PeelingsDirected Toward Other Persons and Groups,"Journal Consultfgsin Pshology, XIII (1949),
26. Terman, Lewis M., "The Discovery and Encouragementof Exceptional Talent," jThe American Psychologist,XIX (1954), 221-230.
27. Turner, Ralph H., and Vanderlippe, Richard H.,"Self-Ideal Congruence as an Index of Adjustment,"Journal of Abnormal and Social Psychology, LVIIj1958), 202-206.
28. Zelen, Semour L., "Acceptance and Acceptability: AnExamination of .Social Reciprocity," Journal ofConsulting Psh loy, XVIII (1954),T36j

CHAPTER II
PROCEDURE
Subjects
The members of two sixth-grade classes of the public
schools of two small North Texas towns constituted the
subjects of this research. The two populations were
tested separately and the data were treated separately.
Population I consisted of sixteen girls and twelve boys
from the lower middle social class. Population II
consisted of eleven girls and eight boys from the upper
lower social class.
Materials
Measure of Self-Concept
Thinking bout Yourself (1, p. 103) was selected to
measure self-concept. This self-concept inventory was
developed by Carl A. Larson and Eli M. Bower of the
California Department of Education. It is published in
two forms--Form A for boys and Form B for girls. The
test consists of fifty-three items each of which in some
way describes a boy (or girl) and asks: (1) Are you like
him (or her)? (2) Do you want to be like him (or her)?
Each question is checked "always," "frequently," "seldom,"
or "never."
14

15
The test yields a self-ideal self discrepancy score
which represents the difference between perceived self and
wanted self.
Sociometric Measure
In order to determine sociometric status, choosing,
and reciprocity, the following instruction was given to
each class: "List in order of preference those with whom
you would most like to go on a picnic."
Measure of Intelligence
Intelligence was measured by the California Test of
Mental Maturity, Short Form 5. This test, developed by
B. T. Sullivan, W. W. Clark, and E. . Tiegs, is published
by the California Test Bureau. It offers separate
"Language" and "Non-language" IQs and a profile made up of
subscores for memory, logical reasoning, and other
intellectual indices.
Method
The subjects were first presented with the form of
Tinkig About Yourself appropriate to their sex and
instructed to fill in the information requested on the
cover page. The directions were read to them, and they
were led through the examples. The examinees were assured
that this inventory would not affect their class grades,
16
that their responses would be kept in strictest confidence,
and were urged to answer each item as honestly as possible.
After completion of the Thinking About Yourself
inventory, the subjects were given two blank sheets of
paper: one to write on and the other to cover the former.
They were then presented the sociometric question: *Listin order of preference those with whom you would most like
to go on a picnic." They were urged to reflect their
preferences frankly and again assured that their responses
would be kept in confidence.
The IQs of the subjects were taken from the permanent
records of the students on file in the school offices.
Statistical Treatment
Pearson coefficients of correlation between the various
variables were computed from scattergrams for both popu-
lations. These were checked against correlation coeffi-
cients of the same variables obtained from an IBM computer.
Where discrepancies occurred, the results of the IBM
computer were accepted as most accurate and are used in
the tables.
The subjects of each population were divided into
three groups--high, middle, and low--on the basis of
(1) self-ideal self discrepancy and (2) choice-status.
17
A t-ratio test was utilized to test the significance of the
difference between the means of the high and low groups
with reference to choices received, mutual choices, choices
given, and intelligence quotient. As a double check,
k--ratios for small populations were also obtained from an
IBM computer. No serious discrepancies were noted between
the two.

CHAPTER BIBLIOGRAPHY
I . Bower, Eli M., Earty Identification f EmotionalHandieapd Ci dren i School, Springfield,Charles C. Thomas, 19I.
18

CHAPTER III
RESULTS
Presentation of Data
The results obtained from the procedure described in
Chapter II were statistically examined as described.
Coefficients of correlation, which demonstrate the
relationship between the variables, are summarized in
Tables XI and XII in the Appendix. They are also stated
when needed at various points in thit discussion. Tables
containing the t-ratios are presented within the body
of the discussion.
Self-Concep and Choices Received
The first hypothesis stated that those with low self-
ideal self discrepancy scores will receive more sociometric
choices than those with high self-ideal self discrepancy
scores. A test of correlation between the self-ideal self
discrepancy scores and choices received in Population I
revealed a significant positive correlation (r .44,
significant at the 5 per cent level). A similar test,
however, between self-ideal self discrepancy scores and
choices received in Population II shows an insignificant
negative correlation.
19
20
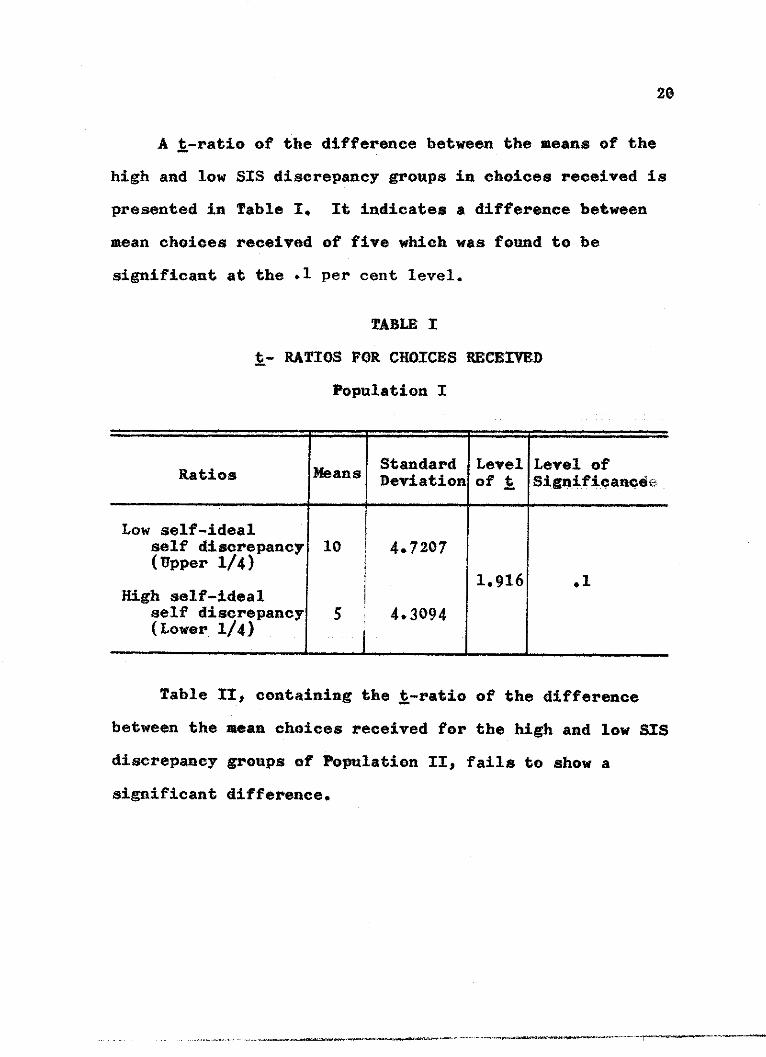
A t-ratio of the difference between the means of the
high and low SIS discrepancy groups in choices received is
presented in Table 1. It indicates a difference between
mean choices received of five which was found to be
significant at the .1 per cent level.
TABLE I
t- RATIOS FOR CHOICES RECEIVED
Population I
Standard Level Level ofRatios Means Deviation of t Significance
Low self-idealself discrepancy 10 4.7207(Upper 1/4)
1.916 .1High self-ideal
self discrepancy 5 4.3094(Lower 1/4)
Table II, containing the i-ratio of the difference
between the mean choices received for the high and low $15
discrepancy groups of Population II, fails to show a
significant difference.

21
TABLE II
t-RATIOS FOR CHOICES RECEIVED
Population II
Standard Level Level ofRatios Means Deviation of t Significance
Low self-idealself discrepancy 3.666 .7453(Upper 1/3)
-1.603 -
High self-idealself discrepancy 5.666 2.6874(Lower 1/3)
The t-ratio is, in fact, in the negative direction though
not at a significant level.
The coefficient of correlation and the t-ratio of the
results of Population I appear to confirm the first hypothe-
sis while those of Population II fail to do so.
ejf-Concept p4d M l Choices
The second hypothesis stated that those with low self-
ideal self discrepancy scores will make more realistic
(reciprocal) sociometric choices than those with high self-
ideal self discrepancy scores. A test of correlation
between the self-ideal self discrepancy scores and mutual
choices in Population I indicated a positive r of .413
which is significant at the 5 per cent level. The same test

22
between 5IS discrepancy scores and mutual choices in
Population II disclosed a positive relationship, but it
was too low to be significant.
TABLE III
t-RATIOS FOR MUTUAL CHOICES
Population I
Standard Level Level ofRatios Means Deviation of tSignificance
Low self-idealself discrepancy 4.285 2.3123(Upper 1/4)
1.788 .1High self-ideal
self discrepancy 2.142 1.8070(Lower 1/4)
Table III contains the t-ratio between the mean mutual
choices of the high and low $ discrepancy groups of
Population I. It shows a difference of the means signi-
ficant at the .1 per cent level. It will be observed that
the mean mutual choices of the low SIS discrepancy group
is approximately twice that of the high 31 discrepancy group.
The I-ratio between the mean mutual choices of the high
and low SIS discrepancy groups of Population II is presented
in Table IV.

23
TABLE IV
t-RATIOS FOR MUTUAL CHOICES
Population II
Ratios Means Standard Level Level ofRatiosMeansDev:iation of t Signifcance
Low self-idealself discrepancy 2.500 1.5000(Upper 1/3) .7726 -
High self-idealself discrepancy 1.833 1.2133(Lower 1/3)
A t level of .7726, which is too low to be significant,
is indicated.
The coefficient of correlation and the t-ratio of the
results of Population I appear to confirm the second
hypothesis while those of Population II fail to do so.
Self-Congp nd Sociometric Choosin
The third hypothesis stated that those with low self-
ideal self discrepancy scores will be more accepting of
others (more expansive in sociometric choosing) than those
with high self-ideal self discrepancy scores. A correlation
coefficient of -.23 was obtained between SIS discrepancy and
choices given for Population I, while the same variables

24
in Population II yielded a correlation of .12. Neither
correlation reached a level of significance.
Table V discloses a substantial, though insignificant,
negative t-ratio between the mean choices given by low and
high SIS discrepancy groups in Population I.
TABLE V
t- RATIOS FOR CHOICES GIVEN
Population I
Standard Level Level ofRatios Means Deviation of t Significance
Low self-idealself discrepancy 5.714 1.2777(Upper 1/4)
-1.44High self-ideal
self discrepancy 7.000 1.7728(Lower 1/3)
The appreciable difference between the means of the
two groups is in the opposite direction to that hypothe-
sized.
Table VI reveals a slight positive but insignificant
difference between the mean choices given by low and high
SIS discrepancy groups in Population II.

25
TABLE VI
t-RATIOS FOR CHOICES GIVEN
Population II
Standard Level Level ofRatios Means Deviation of i Significance
Low self-idealself discrepancy 5.000 1.4142(Upper 1/4)
High self-idealself discrepancy 4.333 1.2472(Lower 1/4)
Both Tables V and VI fail to reflect significant
differences between mean choices given by low and high SIS
discrepancy groups in the two populations. Thus, the third
hypothesis is confirmed by neither correlation coefficients
nor t-ratios from either of the two populations.
Selff-Cnep and Itlli2enwe
The fourth hypothesis stated that those with low self-
ideal self discrepancy scores will have higher IQs than
those with high self-ideal self discrepancy scores. A
test between these two variables in Population I indicates
a positive correlation significant at the 5 per cent level,
However, no relationship was found between SIS discrepancy
and intelligence in Population II.

26
Table VII reveals a significant difference between the
mean IQs of low and high $I5 discrepancy groups in Population
I. A t-ratio of 2.644 is indicated which is significant at
the 5 per cent level.
TABLE VII
t-RATIOS FOR INTELLIGENCE QUOTIENTS
Population I
Standard Level Level ofRatios Means Deviation of t Significance
Low self-idealself discrepancy 109.1 4.6424(Upper 1/4)
2.644 .05High self-ideal
self discrepancy 9444 12.8158(Lower 1/4)
It will be noted that there is a difference of fifteen
points between the mean IQs of the low and high $I discrep-
ancy groups.
The significant difference indicated in Table VII for
Population I is not found in Table VIII with Population II.
A slight difference between the means is shown, but it is
far too small to reach a level of significance. The
unusually large standard deviations (13.6 in each group)
militate against a significant t-ratio even if a substantial
difference between the means existed.

27
TABLE VIII
t-RATIOS FOR INTELLIGENCE QUOTIENTS
Population II
Standard Level Level ofRatios Means Deviation of t Significance
Low self-idealself discrepancy 96.16 13.6188(Upper 1/3)
.1934-High self-ideal
self discrepancy 94.50 13.6228(Lower 1/3)
Both the coefficient of correlation and t-ratio
obtained on Population I tend to confirm the fourth
hypothesis while those obtained on Population II fall
short of significance.
Sociometric Status and Intelligence.
The fifth hypothesis stated that those with high
choice-status will have higher IQ's than those with low
choice-status. A test of correlation between choice-
status and intelligence in Population I revealed a sig-
nificant positive relationship (r = .46, significant at
the I per cent level). The same test between choice-status
and intelligence in Population II yielded a substantial
but insignificant correlation.
28
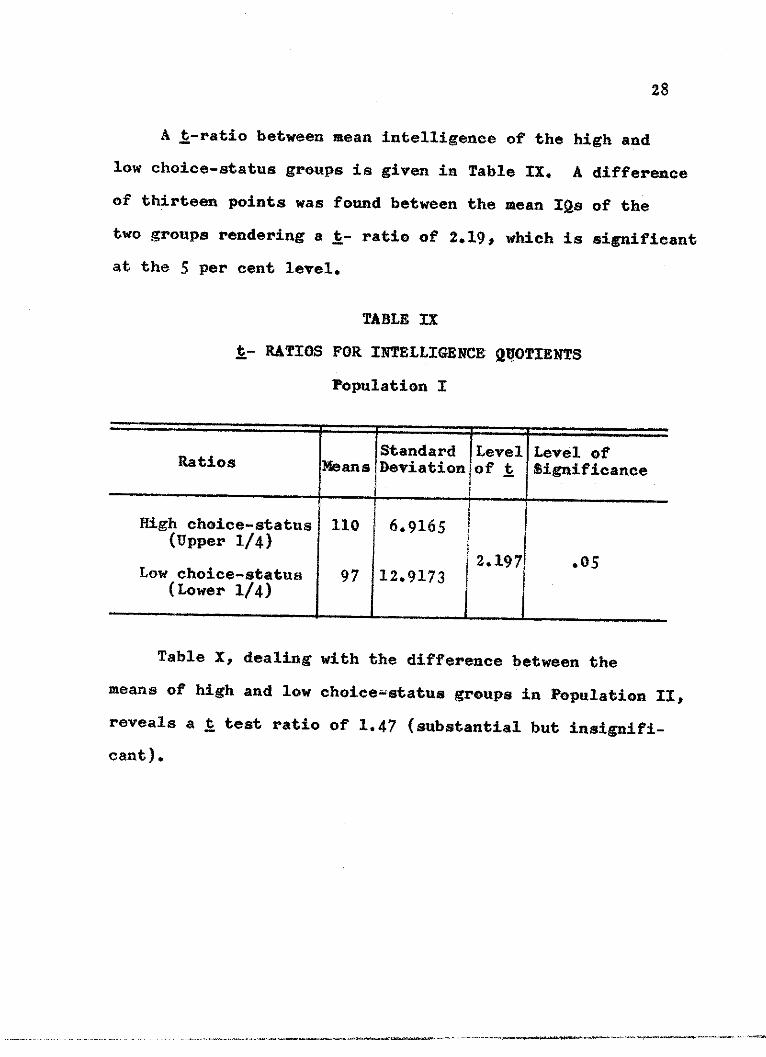
A t-ratio between mean intelligence of the high and
low choice-status groups is given in Table IX. A difference
of thirteen points was found between the mean IQs of the
two groups rendering a _- ratio of 2.19, which is significant
at the 5 per cent level.
TABLE IX
t- RATIOS FOR INTELLIGENCE QUOTIENTS
Population I
Standard Level Level ofRatios Means Deviation of t Significance
High choice-status 110 6.9165(Upper 1/4)
2.197 .05Low choice-status 97 12.9173
(Lower 1/4)
Table X, dealing with the difference between the
means of high and low choice-status groups in Population II,
reveals a t test ratio of 1.47 (substantial but insignifi-
cant).

29
TABLE X
t-RATIOS FOR INTELLIGENCE QUOTIENTS
Population II
Standard Level Level ofMeans Deviation of Significance
High choice-status IOZ&1 8.8585(Upper 1/3)
1.,471Low choice-status 93.5 9.7425
(Lower 1/3)
The data from Population I confirm the fifth hypothe-
sis while those from Population II fail to do so. This
held true for the first, second, and fourth hypotheses
as well, and will be further discussed in the next section.
Discussion of Data
The results presented in the foregoing section are, like
much of the research quoted in Chapter II, somewhat inconclu-
sive. None of the five hypotheses stated in Chapter I are
confirmed by the results of both populations. The results
of Population I confirm the first, second, fourth, and fifth
hypotheses by both correlation coefficients and i-tests.
The results of Population II, on the other hand, fail to
confirm any of the hypotheses either by correlation
coefficients or t-tests. The inconsistency of the results

30
between the two populations may possibly be explained as
follows: (1) Population II is considerably smaller in
number than Population I; and (2) the prevailing atmos-
phere affecting Population II is rather 'authoritarian"
while that affecting Population I is somewhat more
influenced by the philosophy of "progressive education."
Although no hypothesis was confirmed by the results
of both populations, it is worth noting that the first,
second, fourth, and fifth hypotheses were confirmed by
the results of Population I both by correlation coef-
ficients and i-tests.
The failure of the third hypothesis--those with low
self-ideal self discrepancy scores will be more accepting
of others (more expansive in sociometric choosing) than
those with high self-ideal self discrepancy scores--to be
confirmed by the results of either population demands
further consideration. The majority of the related
studies dealing with this hypothesis conclude that those
individuals who are self-accepting are more accepting of
others than those individuals who are not self-accepting.
The failure of this study to confirm this hypothesis may
be due in part to a fallacious assumption within the
hypothesis itself--that is, that expansiveness of socio-
metric choosing accurately represents acceptance of others.

31
An individual may be generally highly accepting of his
peers and yet desire only a certain few individuals as
close friends.
CHAPTER IV
SUMMARY AND CONCLUSIONS
The purpose of this study was to investigate the
relation between two of the most important indices of
adjustment--selfaconcept and sociometric status. The
following hypotheses were tested:
Hypothesis It Those with low self-ideal self
discrepancy will receive more sociometric choices than
those with high self-ideal self discrepancy.
Hypothesis Ii Those with a low self-ideal self
discrepancy will make more realistic sociometric choices
than those with high self-ideal self discrepancy.
Hypothesis III: Those who are self accepting (low
self-ideal self discrepancy) will be more accepting of
others (more expansive in sociometric choosing) than
those with high self-ideal self discrepancy.
Hfypthjs IV Those with low self-ideal self
discrepancy will have higher IQt s than those with high
self-ideal self discrepancy.
Hypth is Vt Those with high choice-status will
have higher IQ's than those with low choice-status.
32

33
The members of two sixth...grade classes of the public
schools of two small towns were used as subjects. The
two populations were tested separately and the data were
treated separately.
Thing About Yourself,, a self-concept inventory, was
administered to the subjects to measure self-ideal self
discrepancy. In order to determine sociometric choosing,
status, and reciprocity, the subjects were instructed:
"List in order of preference those with whom you would
most like to go on a picnic." Intelligence was measured
by the California Test of Mental Maturity, Short Form 5.
Coefficients of correlation between the variables of
each hypothesis were computed for each population. In
order to test between the high and low ends of the con-
tinuums, the subjects of each population were divided
into three groups--high, middle, and low--on the basis of
(1) self-ideal self discrepancy and (2) choice-status.
A t-ratio test was utilized to test the significance of
the difference between the means of the high and low
groups with reference to choices received, mutual choices,
choices given, and intelligence quotient.
The results of this study, like much of the related
research in this area, are somewhat inconclusive. Although
no hypothesis was confirmed by the results of both popu-
lations, the first, second, fourth, and fifth were confirmed
34
by the results from Population I both by correlation coef-
ficients and t-ratios. No data from Population II yielded
an acceptable level of significance.
The conflicting nature of the results of this study
precludes the statement of any dogmatic conclusions. While
the Rogerian hypothesis which prompted this study has not
been indisputedly confirmed, neither has it been decidedly
disproved. In the words of Fey (1, p. 276), "It is quite
possible that the genuinely self-accepting person truly
accepts other, that he does not threaten them, and is
rewarded in turn by their acceptance.a
Since the bulk of the data of this study as well as
those of related research indicates strongly a positive
relationship between self-concept and sociometric status,
it is recommended that further investigations along the
lines of this present study be conducted. By varying
subjects and instruments, it may be possible in time to
determine those conditions under which a positive relationship
might be reliably predicted to hold.

CHAPTER BIBLIOGRAPHY
I. Fey, William F., "Acceptance by Others and ItsRelation to Acceptance of Self and Others:A Revaluation," Journal of Abnormal andSocial Lsyho , L (1955), 274-276.
35

APPENDIX
36

37
TABLE XI
AN INTERCORRELATION OF VARIABLES
Population I
Choices Mutual Choices IntelligenceVariables Received Choices Given Quotient
Self-idealDiscrepancy .440* .413* -.23 .369*
Choice-Status - .463**
signirican ai 5 per cent
**Significant at 1 per cent
ieve
level

38
TABLE XII
AN INTERCORRELATION OF VARIABLES
Population II
Variables Choices Mutual Choices IntelligenceReceived Choices Given Quotient
Self-idealDiscrepancy -.428 .092 .120 .008
Choice-Status - - .328
39
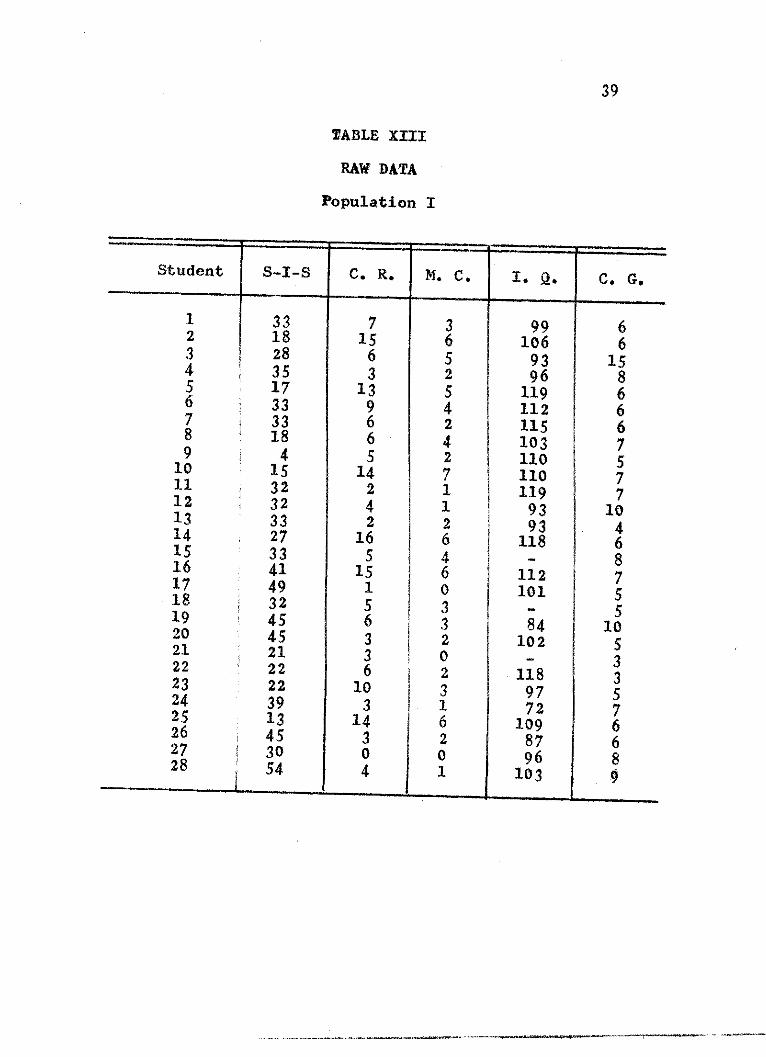
TABLE XIII
RAW DATA
Population I
Student S-I-S C. R. 1. C.
1 33 7 32 18 15 63 28 6 54 35 3 25 17 13 56 33 9 417 33 6 28 18 6 49 4 5 2
10 15 14 711 32 2 112 32 4 113 33 2 214 27 1615 33 5416 41 15 617 49 1 018 32 5 31 45 6 32
45 3 221 21 3 022 22 6 223 22 10 324 39 3 125 13 14 626 45 3 227 30 0 028 54 4 1
I. Q.
99106
9396
119112115103110110119
9393
118
112101
84102
1189772
1098796
103
.iC.pC.
66
15
86667577
1046875
10533576689
C. G.

40
TABLE XIV
RAW DATA
Population II
Student S-.I-S C. R. M. C. I. Q. C. G.
1 38 11 4 108 52 20 3 2 124 43 34 1 0 93 54 29 0 0 98 75 33 1 1 74 56 28 3 3 97 77 29 2 1 93 68 46 8 4 106 49 31 12 8 93 4
10 18 4 0 98 311 20 5 5 84 6
1 457 2 87 413 42 9 2 110 314 39 6 2 109 315 47 4 2 73 416 49 5 1 85 717 24 3 3 90 618 48 10 106 419 15 4 2 84 4

41Form AFor Boys
THINKING ABOUT YOURSELF
Prepared by Carl A. Larson and Eli M. BowerCalifornia State Department of Education, Sacramento
The questions in this booklet will make you think aboutyourself. Because all of you like different things, eachof you will probably answer the questions differently. Whatyou say will help us to find out what boys like you arethinking and wishing. Do your best to make your answer toeach question tell what you really think and really wish.
Name
Age School District
School
Grade in School Date
HOW TO ANSWER THE QUESTIONS IN THIS BOOKLETAlways Freuently Se dom Never
This is an EIAMPLE of thequestions you will be adkedto answer?
This boy is usually pickedfirst to play on a team. -
1. Are you like him?2. Do you want to be like
him?
In answering the first question, "Are you like him?"--you can place an "I" in any one of the four boxes. If youfeel you are like this boy always, place the "V' in Box 1.,If you feel you are like this boy frequently, place an "I"in Box 2. If on the other hand you feel you are like thisboy seldom, place the "" in Box 3. If you feel you arenever picked first to play on a team, place the "I" inBox 4.
In answering the second question, you have to thinkabout what you want to be and put an "I" in the box whichwould be mst true for you. If you would like tobe some-one who is picked first always, place the "I" in Box 5. If
you would like to be picked first frequently, place the "I"
in Box 6. .If on the other hand you would like to be thigboy seldom, place the "X" in Box 7. If you don't care at
all and would never like to be chosen first, place an "I"in Box 8.
42
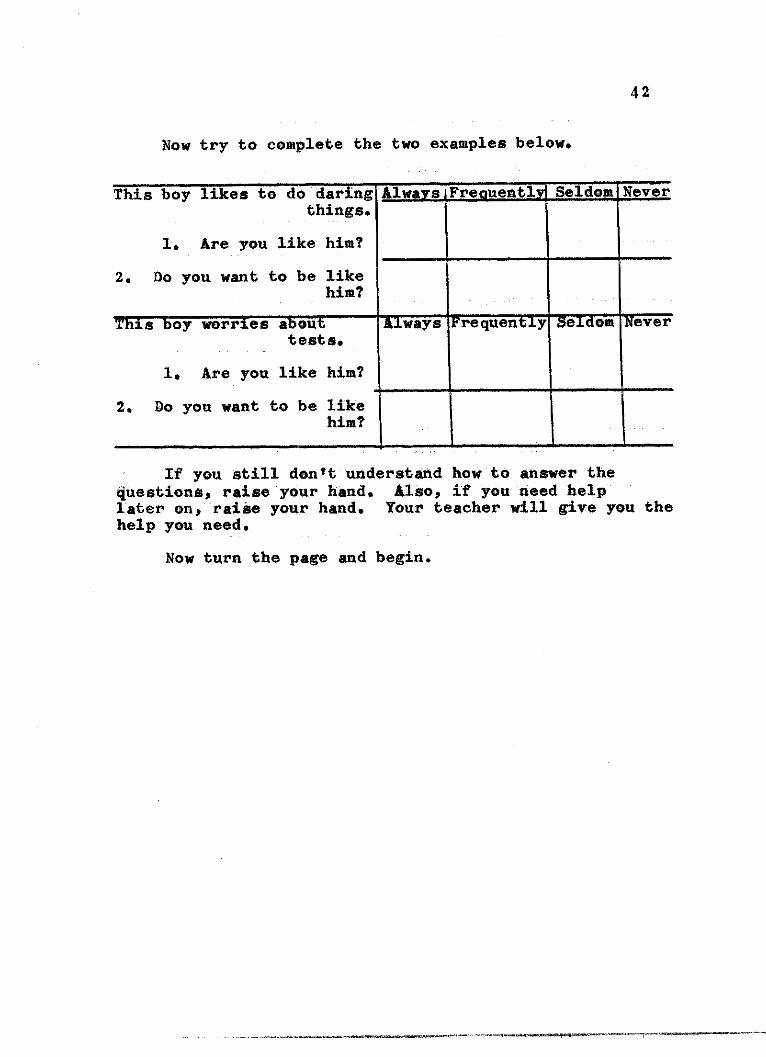
Now try to complete the two examples below.
Thsis boy Tlides to d daring Al sFremuenlySedom Nevrthings.
1. Are you like him?
2. Do you want to be likehim?
This boy worries about Always Frequently Seldom Nevertests.
1. Are you like him?
2. Do you want to be likehim?
If you still dontt understand how to answer thequestions, raise your hand. Also, if you need helplater on, rai se your hand. Your teacher will give you thehelp you need.
Now turn the page and begin.

43
AlwaysFrequentl Seldom Never
1. This boy has baddreams.
Are you like him?
Do you want to belike him?
2. This boy likes totease girls.
Are you like him?
Do you want to belike him?
3. This boy hates school
Are you like him?
Do you want to belike him?
4. This boy thinks hismother doesn't like
him.
Are you like him?
Do you want to belike him?
5. This boy has lots ofspending money.
Are you like him?
Do you want to belike him?

44
ways Frequently eTi ever6. This boy gets in
trouble in school.
Are you like him?
Do you want to belike him?
7. This boy can goto the movies anytime he likes.
Are you like him?
Do you want to belike him?
8. This boy is happy.
Are you like him?
Do you want to belike him?
9. This boy wouldlike to be agirl.
Are you like him?
Do you want to belike him?
LO. This boy is afraidof teachers.
Are you like him?
Do you want to belike him?

45
AlwayaFre uentl Seldom Never
11. This boy plays withis dad.
Are you like him?
Do you want to belike him?
12. This boy gets toclass late.
Are you like him?
Do you want to belike him?
13. This boy wouldrather play withgirls than withboys.
Are you like him?
Do you want to belike him?
14. This boy is askedby the teacher to b.in charge when theteacher leavesthe room.
Are you like him?Do you want to be
like him?
15. This boy tells hisparents when helorries.
Are you like him?
Do you want to belike him?

46
lways Fre uentl Seldom Never
16. This boy wishes he weregrown up right now.
Are you like him?
Do you want to be likehim?
17. This boy likes to playwith younger children.
Are you like him?
Do you want to be likehim?
18. This boy gets goodmarks in his schoolwork.
Are you like him?
Do you want to be likehim?
19. This boy cries easily.
Are you like him?
Do you want to be likehim?
20. This boy picks onsmaller children.
Are you like him.
Do you want to be likehim

47
Always Frequently Seldom Never
21. This boy would quitschool if he could.
Are you like him?
Do you want to belike him?
22. This boy gets upset.
Are you like him?
Do you want to belike him?
23. This boy likes to playby himself.
Are you like him?
Do you want to belike him?
24. This boy wants histeacher to like him.
Are you like him?
Do you want to belike him?
25. This boy likes to stayin bed late in themorning.
Are you like him?
Do you want to belike him?

48
AwaYs Freouently Seldom 1 Never
26. This boy hates dogs.
Are you like him?
Do you want to belike him?
27. This boy plays gamesbetter than other boyshis age.
Are you like him?
Do you want to belike him?
28. This boy feels thatteachers treat otherchildren better thanthey do him.
Are you like him?
Do you want to belike him?
29. This boy would liketo run away from home.
Are you like him?
Do you want to belike him?
30. This boy gets angryeasily.
Are you like him?
Do you want to belike him?

49
Always FreuentlyfSeldom Never
31. This boy gets invitedto many parties.
Are you like him?
Do you want to be likehim?
32. This boy is the best-liked boy in this room.
Are you like him?
Do you want to be likehim?
33. This boy is made tostudy at home.
Are you like him?
Do you want to be likehim?
34. This boy gets tiredeasily.
Are you like him?
Do you want to be likehim?
35. This boy is a sissy.
Are you like him?
Do you want to be likehim?

50
Always Frequently| Seldom Fever
36. This boy is the leaderof the class.
Are you like him?
Do you want to be likehim?
37. This boy is afraid ofhis father.
Are you like him?
Do you want to be likehim?
38. This boy has troublegoing to sleep.
Are you like him?
Do you want to be likehim?
39. This boy thinks thatmost of the childrenlike him.
Are you like him?
Do you want to be likehim?
40. This boy can stay up anight as long as hewants to.
Are you like him?
Do you want to be likehim?

51
AlwaYs Fregmentl Seldom Never
41. This boy likes todaydream.
Are you like him?
Do you want to belike him?
42. This boy would liketo be famous.
Are you like him?
Do you want to belike him?
43. This boy thinks hismother picks on him.
Are you like him?
Do you want to belike him?
44. This boy is afraidof the dark.
Are you like him?
Do you want to belike him?
45, This boy worries abouschool.
Are you like him?
Do you want to belike him?

52
Always Frequentl Seldom Never
46. This boy feels likehurting otherchildren.
Are you like him?
Do you want to belike him?
47. This boy likes to bea bad boy in school.
Are you like him?
Do you want to belike him?
48. This boy likes to playwith older children.
Are you like him?
DO you want to belike him?
49. This boys mothertreats him like ababy.
Are you like him?
Do you want to belike him?
50. This boy's fatherspanks him.
Are you like him?
Do you want to belike him?

53
Always Freqcent l Seldom 'even
51. This boy feels thathis teacher likeshim.
Are you like him?
Do you want to belike him?
52. This boy likes to playwith dolls.
Are you like him?
Do you want to belike him?
53. This boy wants to bea stunt flyer.
Are you like him?
Do you want to belike him?

BIBLIOGRAPHY
Books
Adler, Alfred, The Neurotic Constitution, New York, Dodd,Mead, 1926.
Bonney, Merl E., Mental Health in education Boston,Allyn and Bacon, Inc., 1960.
Bower, Eli M., Early Identification of Emotionally Handi-ca d Children in School Springfield, Charles C.Thomas, 1960.
Combs, Arthur W., and Snygg, Donald, I ndvidual Behavior:A Perceptual Aproach to Behavior, New York, Harperand Brothers, 1959.
Freud, Sigmund, The _d d the I, London, Hogarth Press,1927.
Honey, Karen, New ays in Psychoanalysis, New York,W. W. Norton, 1939.
James, William, Principles f Psychology, Vol. I, New York,Henry Holt and Company, 1890.
Rogers, Carl R., Client--Centered Therapy, Boston, HoughtonMifflin Company, 1951.
Articles
Allport, G. W., "The Ego in Contemporary Psychology,"Pch oical Review, L (1943), 451-478.
Berger, Emanuel M., "The Relation Between ExpressedAcceptance of Self and Expressed Acceptance ofOthers," Journal of Abnormal and Social Psychology,XLVII (1952), 778-782.
Bills, R. E., Vance, E. L., and McLean, 0. S., "An Indexof Adjustment and Values," "Journal of. Consltig
ycholo , XV (1951), 257-261.
54

55
Brownfain, John J., "Stability of the Self-Concept as aDimension of Personality," Journal of Abnormal andSocial Psycholojy, XLVII (1952),597-606.
Coopersmith, Stanley, "A Method for Determining Types ofSelf-Esteem," Journal of Abnormal and SocialPsychology, LIX (1959),~87-94.
Feinberg, M. R., "Relation of Background Experience toSocial Acceptance," Journal of Abnormal and SocialP ycholy, XLVIII (1953),206-214.
Fey, William F., "Acceptance by Others and Its Relationto Acceptance of Self and Others: A Revaluation,"Journal of Abnormal and Social Psychology, L (1955),274-2766'..
Fiedler, F. E., Dodge, Joan S., Jones, R. E., andHuchins, E. B., "Interrelations Among Measures ofPersonality Adjustment in Nonclinical Populations,Journal of Abnormal and Social Psychology, LVI195 , 345-351
Grossman, B. and Wrighter, J., "The Relationship BetweenSelection-Rejection and Intelligence, Social Status,and Personality Amongst Sixth-Grade Children,"Sociometry, XI (1948), 346-355.
Jervis, F. M., "The Meaning of a Positive Self-Concept,"Dissertation Abstracts, XIX (1958), 3355-3356.
Katz, I. S., "A Study of the Stability of the Self-Concept and Its Relationship to Sociometric Statusand Sociometric Perception," Dissertation Abstracts,XIX (1958), 877.
Larson, J. R., "An Analysis of the Relationship BetweenAccuracy of and Stability of Self-Concept andSociometric Status," Dissertation Abstracts, XIX(1958), 1846-1847.
Omwake, Katharine T., "The Relation Between Acceptance ofSelf and Acceptance of Others Shown by Three Person-ality Inventories," Journal of Consulting Psychology,XVIII (1954), 443-446.

56
Schiff, Herber, "Judgmental Response Sets in the Perceptionof Sociometric Status," Sociometry, XVII (1954), 207-227.
Sheerer, E. T., "An Analysis of the Relationship BetweenAcceptance of and Respect for Self and Acceptance ofand Respect of Others in Ten Counseling Cases,"Journal of Consulting Pfycholojo, XIII (1949),169-175.
Silver, Albert W., "The Self-Concept: Its Relationshipto Parental and Peer Acceptance," DissertationAbstracts, XIX (1958), 166-167.
Stock, Dorothy, "An Investigation into the InterrelationBetween the Self-Concept and Feelings DirectedToward Other Persons and Groups," Journal ofConsulting tacholocy, XIII (1949), 176-180,
Terman, Lewis M., "The Discovery and Encouragement ofExceptional Talent," The.AericAn Psycholocist,XIX (1954), 221-230.
Turner, Ralph H., and Vanderlippe, Richard H., "Self-Ideal Congruence as an Index of Adjustment,"Journal of Abnormal and Social Psychology,LVII (1958), 20 2-206.
Zelen, Semour L., "Acceptance and Acceptability: AnExamination of Social Reciprocity," Journal ofConsulting yjchog, XVIII (1954), 361.
Unpublished Materials
Raimy, V. C., "The Self-Concept as a Factor in Counselingand Personality Organization," unpublished doctoraldissertation, Ohio State University, 1943.