selection of a durable, sustainable and cost-effective
TRANSCRIPT

SELECTION OF A DURABLE, SUSTAINABLE AND COST-EFFECTIVE ASPHALT MIXTURE FOR PAVEMENTS
IN OREGON
FEBRUARY 2020
Technical Proposal
SCHOOL OF CIVIL & CONSTRUCTION ENGINEERING
OREGON STATE UNIVERSITY


3
SELECTION OF A DURABLE, SUSTAINABLE
AND COST-EFFECTIVE ASPHALT MIXTURE
FOR PAVEMENTS IN OREGON
TECHNICAL PROPOSAL
By
Vikas Kumar (Ph.D. student)
Ihsan Obaid (Ph.D. student)
Alex Sutherland (U.G. student)
Sponsor: Erdem Coleri, PhD (Assistant Professor)
School of Civil and Construction Engineering
Oregon State University
101 Kearney Hall
Corvallis, OR, 97331
Phone: (541) 737-4934
February 2020
4
TABLE OF CONTENTS
TECHNICAL PROPOSAL ......................................................................................................... 1
1.0 INTRODUCTION............................................................................................................. 7
2.0 PROBLEM STATEMENT AND KEY OBJECTIVES ................................................ 9
3.0 BALANCED MIX DESIGN APPROACH ................................................................... 10
3.1 BALANCED MIX DESIGN PROCESS IN OREGON – DESIGN APPROACH ............... 11
4.0 ASPHALT MIX PROPETIES AND BALANCED MIX DESIGN ............................ 13
4.1 MATERIALS AND SAMPLE FABRICATION .......................................................... 13 Preparation of LMLC Specimens ......................................................................................................... 15
4.2 TEST METHODS ......................................................................................................... 16 Semi-Circular Bend (SCB) Test ........................................................................................................... 16 Hamburg Wheel-Tracking Test (HWTT).............................................................................................. 17
4.3 EXPERIMENTAL DESIGN ........................................................................................ 18 4.4 RESULTS AND ANALYSES ...................................................................................... 18
SCB Test Results .................................................................................................................................. 18 HWTT Test Results .............................................................................................................................. 20 Balanced Mix Design ........................................................................................................................... 21 Cost Calculation Tool .......................................................................................................................... 24 Life-Cycle Cost Analysis (LCCA) ........................................................................................................ 28 Environmental Impact.......................................................................................................................... 31
5.0 FINAL CONCLUSIONS AND RECOMMENDATIONS .......................................... 34
6.0 REFERENCES ................................................................................................................ 36
APPENDIX A: GRADATION AND BINDER CONTENT OF RAP ...................................... 40 APPENDIX B: TEMPERATURE CURVES AND PROPERTIES OF VIRGIN BINDER ..... 42 APPENDIX C: AN EXAMPLE FOR BATCHING SHEETS .................................................. 43

5
LIST OF FIGURES
Figure 3-1: Volumetric mix design vs balanced mix design example. (West et al. 2018) ........................................... 10 Figure 3-2: Approach 1 - Volumetric design with performance verification. (West et al. 2018) ................................ 11 Figure 4-1: Gradation curves for asphalt mixtures from all 3 mixes on a 0.45 power chart. ...................................... 15 Figure 4-2: FI test results for all mixtures (length of the error bar is equal to one standard deviation). ...................... 19 Figure 4-3: HWTT test results for all mixtures (length of the error bar is equal to one standard deviation). .............. 20 Figure 4-4: Balanced mix design for (a) Mix1_AV5 (b) Mix1_AV7 (c) Mix2 and (d) Mix3. .................................... 23 Figure 4-5: Cost calculation tool input tab .................................................................................................................. 26 Figure 4-6: Cost comparison for all the mixes based on materials and burner fuel cost ............................................. 27 Figure 4-7: Diagrams used for LCCA (a) Mix1_AV5 (b) Mix1_AV7 (c) Mix2 and (d) Mix3. .................................. 30 Figure 4-8: Global Warming Potential (GWP) by mix type ........................................................................................ 32 Figure 4-9: Acidification Potential by Mix Type ........................................................................................................ 33 Figure 4-10: Eutrophication Potential by Mix Type .................................................................................................... 34 Figure A-1: RAP aggregate gradation ......................................................................................................................... 40 Figure A-2: Binder content and theoretical maximum specific gravity (Gmm) of RAP ............................................. 41 Figure B-1: Temperature curve of PG 70-22ER binder ............................................................................................... 42

6
LIST OF TABLES
Table 4-1: Mix design and volumetric properties for the three trial mixes .................................................................. 14 Table 4-2: Experimental plan for balanced mix design. .............................................................................................. 18 Table 4-3: Volumetric properties for the three mixes based on BMD design binder content...................................... 24 Table 4-4: Amount of burner fuel savings for WMA (Sullivan and Moss, 2014) ....................................................... 25 Table 4-5: NPVs for all the mixes – Without burner fuel consumption cost ............................................................... 31 Table 4-6: NPVs for all the mixes – With burner fuel consumption cost .................................................................... 31 Table B-1. Mixing and compaction temperatures of PG 70-22ER binder ................................................................... 42 Table C-1 Quantity of coarse, medium, and fine aggregates and RAP materials for the mixture with 45% RAP, 5.3%
binder content and binder grade of PG 70-22ER ............................................................................................... 43 Table C-2 Quantity of binder, RAP materials, lime and total aggregates for the the mixture with 45% RAP, 5.3%
binder content and binder grade of PG 70-22ER ............................................................................................... 44

7
1.0 INTRODUCTION
Cracking is a common failure mechanism in asphalt concrete pavement structures. It is one of the
main reasons for large road maintenance and rehabilitation expenditures, as well as reduced user
comfort and increased fuel consumption due to high road roughness. The resistance of the
pavement to this distress mechanism is dependent upon the ductility of the asphalt pavement
mixture. The increased use of recycled asphalt materials with high binder replacement rates results
in a significant reduction in ductility of the asphalt mixtures used in construction, which causes a
significant reduction in the fatigue life of the pavement in many cases. In Oregon, asphalt cracking
is the major distress mode, necessitating costly rehabilitation and maintenance at intervals of less
than half of the intended design lives in some cases. For this reason, it is necessary to accurately
quantify the impact of increasing the recycled asphalt content on the structural cracking and rutting
resistance of the pavement through use of low-cost and efficient testing and design procedures that
can easily be implemented.
Asphalt mixtures are designed to be used in pavements to withstand vehicular loads under different
climatic conditions. The goal of asphalt mix design is to determine an economic blend of
aggregates and binder such that the resultant mix provides sufficient stability to resist deformation
under traffic loading, and flexibility to withstand cracking. The current asphalt mix design practice
(Level 1-Volumetric only) involves proportioning of the aggregates and the asphalt binder based
on empirical properties of aggregates and volumetric properties such as densities, air voids, voids
in the mineral aggregate (VMA) and voids filled with asphalt (VFA). However, most state DOTs
and asphalt contractors do not think that commonly used asphalt mixture properties are directly
reflecting the long-term performance of asphalt mixtures. For instance, although there are
requirements for VMA set by almost all state DOTs, measurement of VMA relies on the accurate
measurement of aggregate bulk specific gravity, while considerable issues were observed in terms
of accuracy and variability during the measurement of this parameter (West et al. 2018). In
addition, there are several new additives, polymers, rubbers, and high-quality binder types
incorporated into asphalt mixtures today. Volumetric mixture design methods are not capable of
capturing the benefits of using all these new technologies on asphalt mixture performance.
Furthermore, the interaction of virgin binders with reclaimed asphalt pavement (RAP) mixtures
with high binder replacement contents and the level of RAP binder blending into the asphalt
mixture are still not well understood. Due to all these complications related to the more complex
structure of asphalt mixtures, simple volumetric evaluations to determine the optimum binder
content may not result in reliable asphalt mixture designs. Two volumetrically identical mixtures
may provide completely different rutting and cracking performance according to laboratory tests
(Coleri et al. 2017b).
For all these reasons, performance tests for rutting and cracking need to be incorporated into
current asphalt mixture design methods to be able to validate or revise the optimum binder content
determined by the volumetric mix design method. Numerous research studies were recently carried
out and are currently being conducted to develop new mix design processes with performance

8
verification (Epps et al. 2002; Zhou et al. 2006; Harvey et al. 2014; Cooper III et al. 2014; Williams
et al. 2004; Bennert et al. 2014; Hughes and Maupin 2000; Dave and Koktan 2011; Kim et al.
2011; Zhou et al. 2014). However, this approach is not entirely new and draws upon the existing
methods and procedures while the existing methods need to be revised and improved by
incorporating findings from recent research studies.
Oregon Department of Transportation (ODOT) Research Projects SPR785, SPR797 (Coleri et al.
2017b; Coleri et al. 2017a; Sreedhar et al. 2018; Haddadi et al. 2019) constructed the beginnings
of a performance-based balanced mix design method for Oregon. It was suggested that semi-
circular bend (SCB) test is the most effective and practical cracking test that can effectively be
used for balanced mix design. It was determined that the typical flexibility index (FI), an energy
parameter calculated using SCB test results, values for production mixtures (plant-produced) with
polymer-modified binder range from 9 to 14. However, more experiments need to be conducted
to determine an exact threshold for FI that will provide acceptable long-term pavement cracking
performance. In these two research projects, flow number (FN) test was used as the experiment
for rutting performance evaluation. For highways with high traffic levels (ESALs > 30 million),
an FN of 740 was suggested by AASHTO TP79-13 (2013) and used in SPR785 and SPR797 as
the threshold value for rutting performance acceptance. However, FI and FN threshold numbers
used in these two research projects were not validated using test results from actual asphalt
production mixtures sampled from different construction projects. The effectiveness of the FN test
and other potential laboratory test options, such as the Hamburg Wheel Tracking Test (HWTT),
in predicting in-situ rutting performance was also not evaluated in those two ODOT research
projects. In addition, the most effective asphalt mixture long-term aging protocols to achieve
reliable semi-circular bend (SCB) test parameters that are correlated with in-situ cracking
performance are needed to be developed. The developed aging protocol also needs to be integrated
into the balanced mix design procedures that are developed for Oregon in this study.
A recently completed ODOT research project (SPR 801) suggested the adaptation of Hamburg
Wheel Tracking Test (HWTT) and Semi-Circular Bend (SCB) tests for rutting and cracking
performance quantification. This Balanced Mix Design (BMD) implementation study also
developed rutting and cracking performance thresholds for high (Level 4) and medium (Level 3)
Equivalent Single Axle Load (ESAL) roads. Based on the results of all analyses for cracking
performance, a flexibility index (FI) threshold of 6 was recommended for Level 3 mixes while the
threshold for Level 4 was selected as 8. For rutting performance, a HWTT rut depth threshold of
3mm was recommended for Level 3 mixes while the threshold for Level 4 was selected as 2.5mm.
In this study, three asphalt mixtures with different recycled asphalt contents (RAP) and additives
were evaluated in terms of cracking and rutting performance by using the thresholds for Level 4
asphalt mixtures. A balanced mix design process was followed to determine the required binder
content for the three mixtures. Based on the life cycle cost and environmental impact analyses, the
mixture with warm mix additive was selected as the most economically and environmentally viable
asphalt mixture to be used for construction in Oregon.

9
2.0 PROBLEM STATEMENT AND KEY OBJECTIVES
In Oregon, fatigue cracking is the major distress mode for asphalt concrete pavement structures. It
is one of the main reasons for large road maintenance and rehabilitation expenditures, as well as
reduced user comfort and increased fuel consumption due to high road roughness. The resistance
of the pavement to this distress mechanism is dependent upon the ductility of the asphalt pavement
mixture. According to the literature, aging of asphalt binder associated with the oxidation of the
binder is a major factor affecting the fatigue performance of asphalt mixtures. Increasing asphalt
binder content, using elastomer-modified binders, and/or using softer binder grades were proved
to improve fatigue cracking resistance (Coleri et al. 2017a, Coleri et al. 2017b). Coleri et al.
(2017b) showed that binder content of the asphalt mixtures produced with the current volumetric
design method can be increased without having rutting failures. The low binder content suggested
by the current volumetric design methods results in early fatigue cracking and moisture damage.
Increasing density (compactibility) and flexibility by using higher binder contents and/or different
types of additives were also recommended to be viable options to improve longevity of Oregon
roadway network. To address these issues, Coleri et al. (2020) developed a robust performance
based asphalt mix design method to be able to recommend these strategies for performance
improvement. In this study, balanced mix design procedures developed by Coleri et al. (2020) in
the SPR801 ODOT research project were followed to design three asphalt mixtures for Oregon
roads with high traffic levels (Level 4 mixtures).
The main objectives of this study are to:
• Design three trial asphalt mixtures for application on a four-lane divided highway (arterial
collector) with a total 20 year design equivalent single axle load (ESAL) of 7,500,000. This
ESAL level requires a Level 4 mixture design in Oregon;
• Evaluate the trial mixes for cracking and rutting performances;
• Determine design binder content range for each mix using the balanced asphalt mix design
method developed for Oregon by incorporating performance tests for rutting and cracking
into the current volumetric design process (Coleri et al. 2020);
• Determine the cost and environmental impact of all three mixtures by performing life cycle
cost and environmental impact analysis; and
• Recommend the “best” asphalt mixture for the given conditions by considering the cost-
effectiveness, sustainability and the long-term performance of the mixes.

10
3.0 BALANCED MIX DESIGN APPROACH
The Federal Highway Administration (FHWA) formed an Expert Task Group to develop a
Balanced Mix Design (BMD) process (West et al. 2018). The group defines BMD as “asphalt mix
design using performance tests on appropriately conditioned specimens that address multiple
modes of distress taking into consideration mix aging, traffic, climate and location within the
pavement structure”. Figure 3-1 illustrates the difference between conventional volumetric mix
design and proposed balanced mix design process. In volumetric mix design, an optimum binder
content required to achieve 4% air-void content by applying a predetermined compactive effort
(number of gyrations in a Superpave Gyratory Compactor) is determined. However, performance
properties of asphalt mixtures are not accounted for in the design process. On the other hand, in a
balanced mix design process, performance properties of asphalt mixtures are evaluated in addition
to volumetric properties. In the example presented in Figure 3-1, the binder content determined by
the volumetric process is 5.7%. This binder percentage satisfies the rutting criteria for asphalt
mixtures. However, this binder content does not satisfy the cracking performance requirements
(flexibility index of 8 from the IFIT test). On the other hand, the balanced mix design approach
yields a binder content ranging between 6.2% and 6.7%. Within this range, both cracking and
rutting criteria are met.
Figure 3-1: Volumetric mix design vs balanced mix design example. (West et al. 2018)
The FHWA group also determined three potential approaches to implement BMD (West et al.
2018), which are briefly described as follows:
Approach 1: Volumetric Design with Performance Verification: This is the most commonly
used approach researched and employed by different agencies. In this approach, the mixture is
designed based on Superpave specifications. Then, performance tests are conducted to validate
whether the mix meets the performance requirements. The mixture should satisfy both volumetric
and performance testing criteria. If the mixture does not meet the requirements, the entire mix
design process is repeated. The adjustments to the mixture can be made through aggregate source,
aggregate gradation, binder source, binder grade, and or additives. This approach is currently being

11
implemented by state department of transportations (DOTs) in Illinois, Texas, Louisiana, New
Jersey, and Wisconsin. The process is illustrated in Figure 3-2.
Figure 3-2: Approach 1 - Volumetric design with performance verification. (West et al.
2018)
3.1 BALANCED MIX DESIGN PROCESS IN OREGON – DESIGN
APPROACH
The BMD approach proposed by Oregon State University (OSU) in the SPR 801 research project
(Coleri et al. 2020) is using volumetric design plus performance testing. The motivation behind
implementing this approach was to: i) address the performance issues related to the use of higher
contents of RAP, ii) increasing binder contents to improve long-term cracking performance; and
iii) quantifying the impact of using recently developed additive technologies (warm-mix, fibers,
polymer modified binders, etc.) on long-term pavement performance. In the proposed process,
binder content is determined using the Superpave volumetric mixture design process after selecting
a suitable aggregate gradation and binder grade.
SCB tests were conducted at 25oC with a displacement rate of 0.5 mm/min (AASHTO TP 105-13;
Coleri et al. 2017b). The Flexibility Index (FI) (Ozer et al. 2016) is used to evaluate the cracking
performance after long-term conditioning (24 hours of loose mixture aging at 95 ± 2°C, based on
the aging protocol that was also developed in the SPR 801 research project), while HWTT is used
to evaluate the rutting resistance after only short-term conditioning (two hours of loose mix aging
at 132 ± 3°C). HWTT was conducted at 50oC and the total rut depth (RD) accumulated after 20,000
repetitions was used for rutting performance evaluation. For balanced mix design in Oregon, Coleri
et al. (2020) recommended an FI threshold of 6 for Level 3 (for medium ESAL roadway sections)
mixes, while the threshold for Level 4 (for high ESAL roadway sections) mixes was selected as 8.

12
A HWTT RD threshold of 3mm was recommended for Level 3 mixes while the threshold for Level
4 was selected as 2.5mm. Since the designs in this proposal are for a roadway section with high
ESAL levels (7.5 million), designed asphalt mixtures are required to be Level 4 mixes in Oregon
(See ODOT 2019-Table 23). For this reason, an FI threshold of 8 and an RD threshold of 2.5mm
were used for balanced mix design (Coleri et al. 2020). In the BMD approach suggested for Oregon
in SPR 801, different requirements for binder content adjustments, change in binder source, or
reduction in quantities of recycled materials are generally made to achieve the desired mixture
performance.

13
4.0 ASPHALT MIX PROPETIES AND BALANCED MIX
DESIGN
4.1 MATERIALS AND SAMPLE FABRICATION
This section provides information about the materials used in this study (including virgin binders,
virgin aggregates and RAP materials). The materials were sampled from an asphalt plant located
near Tigard, Oregon. In this study, laboratory mixed-laboratory compacted (LMLC) samples were
used for testing and evaluation. LMLC is defined as follows:
• Laboratory Mixed-Laboratory Compacted (LMLC) samples: Aggregates, virgin binders
and RAP material used to produce asphalt mixtures for field construction were sampled
from asphalt plant. These materials were used to produce LMLC samples at the Asphalt
Materials Performance Laboratory at Oregon State University.
Three different asphalt mixtures were used in this study: Mix1, Mix2, and Mix3. These trial mixes
varied in gradation, amount of RAP content, and presence of additives. Mix1 was further divided
into two mixes Mix1_AV5 and Mix1_AV7, differing by the compacted air void contents of the
test samples (5% and 7%, respectively) to quantify the impact of density on performance. Mix 2
had 45% RAP content and Mix 3 was identical to Mix 1 except that in Mix3, Evotherm® was used
as a warm-mix additive. Both Mix2 and Mix3 were compacted to 93 percent theoretical maximum
density (±0.5%) in a gyratory compactor to produce test samples with conventional 7% air-void
content. In this study, BMD samples were produced with 7% air-void content since 93% density
during construction is the expected average density for contractors in Oregon. Figure 4-1 shows
the gradation curves used for the production of the three mixtures. Once the target gradation was
finalized, three trial binder contents were selected for mix design. For each binder content, Gmm
samples were mixed in triplicate according to AASHTO T 312-12 and their respective Gmm values
were determined as per AASHTO T 209-12 procedures. Subsequently, three replicate mix design
samples were prepared for each binder content and compacted in the gyratory compactor by fixing
the number of gyrations to 65 as required by the competition guideline. The air-void content for
each sample was determined. The binder content corresponding to the target design air void was
selected as the optimum binder content (OBC) for each mix. Moreover, mix design verification
(MDV) was performed on the mixes with the OBC and the results were matched against the ODOT
specifications and found to be within the tolerance limits (ODOT, 2018). The volumetrics and the
other mix design variables of the three trial mixes considered in this study are summarized in Table
4-1.
14
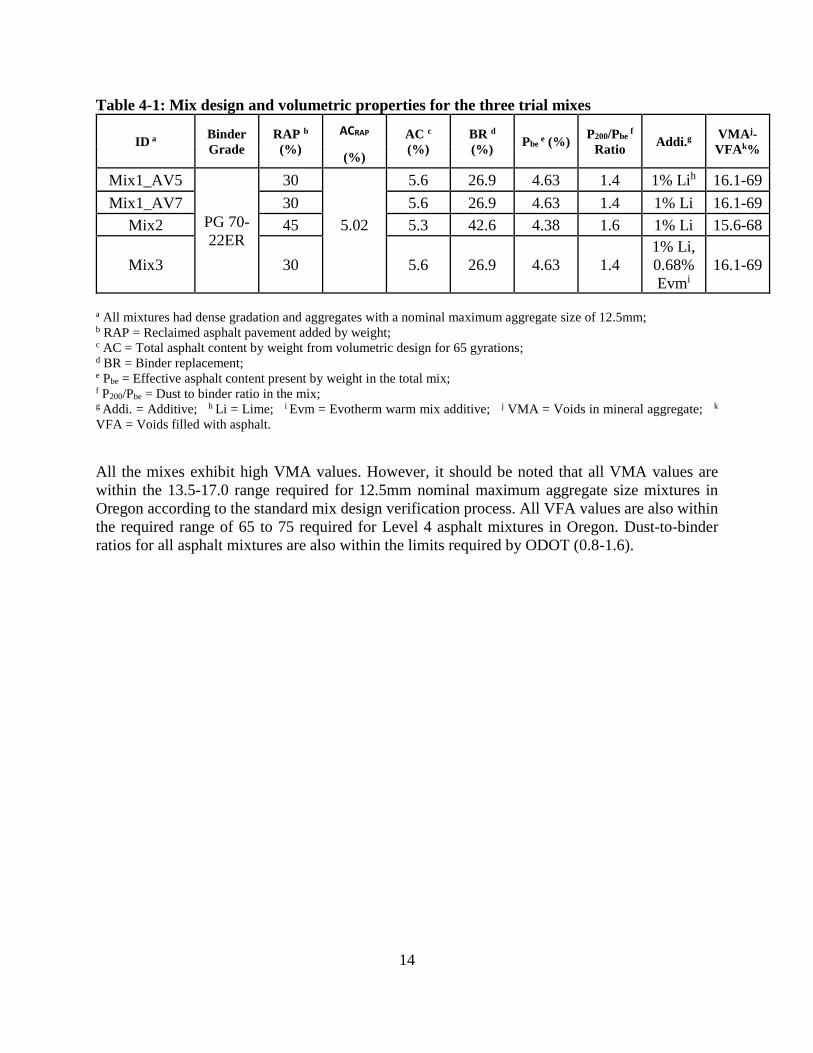
Table 4-1: Mix design and volumetric properties for the three trial mixes
ID a Binder
Grade
RAP b
(%)
ACRAP AC c
(%)
BR d
(%) Pbe
e (%) P200/Pbe
f
Ratio Addi.g
VMAj-
VFAk% (%)
Mix1_AV5
PG 70-
22ER
30 5.6 26.9 4.63 1.4 1% Lih 16.1-69
Mix1_AV7 30 5.6 26.9 4.63 1.4 1% Li 16.1-69
Mix2 45 5.02 5.3 42.6 4.38 1.6 1% Li 15.6-68
Mix3 30 5.6 26.9 4.63 1.4
1% Li,
0.68%
Evmi
16.1-69
a All mixtures had dense gradation and aggregates with a nominal maximum aggregate size of 12.5mm; b RAP = Reclaimed asphalt pavement added by weight; c AC = Total asphalt content by weight from volumetric design for 65 gyrations; d BR = Binder replacement; e Pbe = Effective asphalt content present by weight in the total mix; f P200/Pbe = Dust to binder ratio in the mix; g Addi. = Additive; h Li = Lime; i Evm = Evotherm warm mix additive; j VMA = Voids in mineral aggregate; k
VFA = Voids filled with asphalt.
All the mixes exhibit high VMA values. However, it should be noted that all VMA values are
within the 13.5-17.0 range required for 12.5mm nominal maximum aggregate size mixtures in
Oregon according to the standard mix design verification process. All VFA values are also within
the required range of 65 to 75 required for Level 4 asphalt mixtures in Oregon. Dust-to-binder
ratios for all asphalt mixtures are also within the limits required by ODOT (0.8-1.6).

15
Figure 4-1: Gradation curves for asphalt mixtures from all 3 mixes on a 0.45 power chart.
Preparation of LMLC Specimens
For sample preparation, aggregates and RAP were batched to meet the final gradation and the 7%
± 1% air content for all the mixes (except Mix1_AV5 for which the target air content was 5%±
1% to determine the impact of density on performance). Then, batched samples were mixed and
compacted by following the AASHTO T 312-12 (2012) specification. Before mixing, aggregates
were kept in the oven at 10°C higher than the mixing temperature, RAP materials were kept at
110°C, and binder was kept at the mixing temperature for 2 hours. After mixing, the AASHTO R
30 (2010) recommends conditioning the prepared loose mixtures for 4 hours at 135°C to simulate
short-term aging (STA). The goal of short-term aging is to simulate the aging and binder absorption
that occurs during the production and silo storage phases. However, based on the suggestions from
the NCHRP 815 (Newcomb et al. 2015), a short-term conditioning period of 2 hours at 135°C was
adopted (which is also the short-term aging protocol suggested by Coleri et al (2020) for Oregon).
The long-term aging protocol developed for Oregon in SPR 801 research project was followed for
conditioning asphalt mixtures for the SCB cracking tests. Based on the results and
recommendations from SPR 801, short-term aged loose mixtures were further aged at 95°C for 24
hours to simulate long-term aging. The conditioning was carried out in a forced draft oven and
mixtures were stirred at regular intervals to ensure uniform aging. After LTA conditioning,
mixtures were further kept in the oven at compaction temperature for 2 more hours prior to
16
compaction. The mixing and compaction temperatures were obtained from viscosity versus
temperature plots for the binder provided by the plant. Cylindrical samples were compacted using
a Superpave Gyratory Compactor (SGC) in accordance with the AASHTO T312-12 specification.
Asphalt mixtures used for HWTT sample production were only short-term aged (no long-term
aging) since rutting generally occurs early in the design life. Asphalt mixtures for only SCB
samples were long-term aged to simulate the impact of aging (oxidation and volatilization of
different components in the asphalt binder) on long-term cracking resistance.
For warm mix asphalt sample preparation, aggregates and RAP were batched following the same
guidelines as the hot mix asphalt. Before mixing, binder and the warm mix additive Evotherm P25
were mixed using a counter top stationary mixer. Calculated Evotherm P25 dosages were 0.66%,
0.68%, and 0.71% by weight of total binder for asphalt mixtures with 6.1%, 5.6%, and 5.1% total
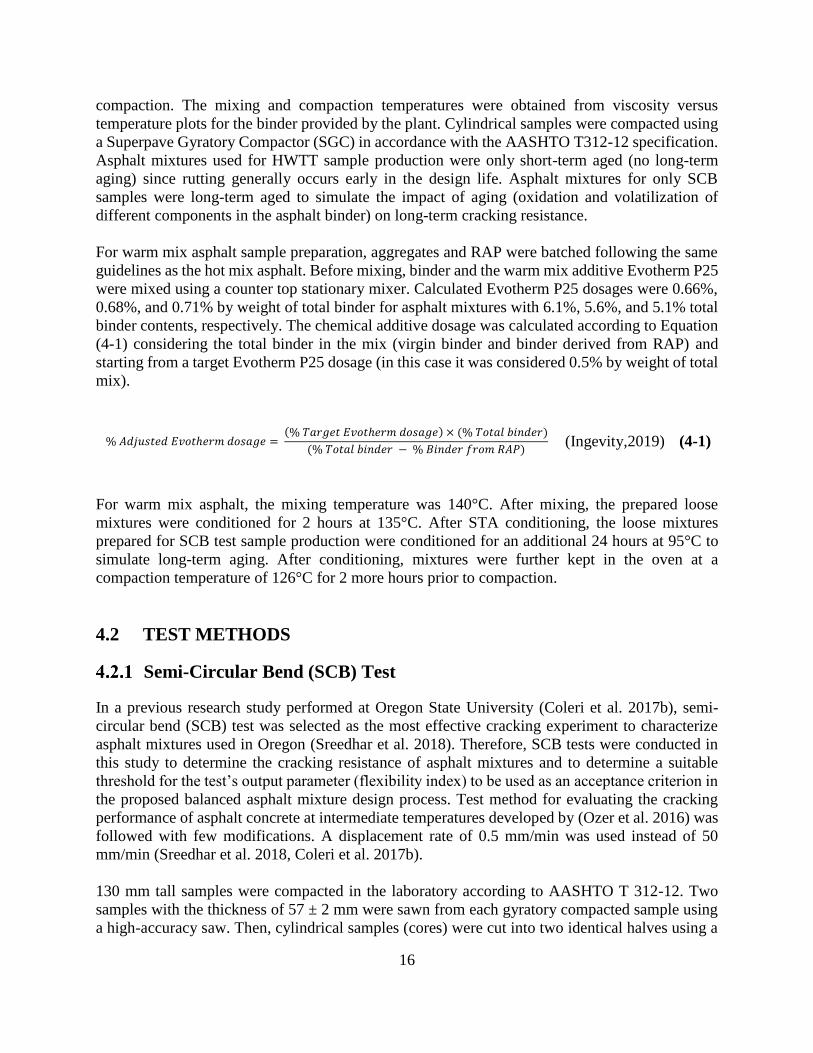
binder contents, respectively. The chemical additive dosage was calculated according to Equation
(4-1) considering the total binder in the mix (virgin binder and binder derived from RAP) and
starting from a target Evotherm P25 dosage (in this case it was considered 0.5% by weight of total
mix).
% 𝐴𝑑𝑗𝑢𝑠𝑡𝑒𝑑 𝐸𝑣𝑜𝑡ℎ𝑒𝑟𝑚 𝑑𝑜𝑠𝑎𝑔𝑒 = (% 𝑇𝑎𝑟𝑔𝑒𝑡 𝐸𝑣𝑜𝑡ℎ𝑒𝑟𝑚 𝑑𝑜𝑠𝑎𝑔𝑒) × (% 𝑇𝑜𝑡𝑎𝑙 𝑏𝑖𝑛𝑑𝑒𝑟)
(% 𝑇𝑜𝑡𝑎𝑙 𝑏𝑖𝑛𝑑𝑒𝑟 − % 𝐵𝑖𝑛𝑑𝑒𝑟 𝑓𝑟𝑜𝑚 𝑅𝐴𝑃) (Ingevity,2019) (4-1)
For warm mix asphalt, the mixing temperature was 140°C. After mixing, the prepared loose
mixtures were conditioned for 2 hours at 135°C. After STA conditioning, the loose mixtures
prepared for SCB test sample production were conditioned for an additional 24 hours at 95°C to
simulate long-term aging. After conditioning, mixtures were further kept in the oven at a
compaction temperature of 126°C for 2 more hours prior to compaction.
4.2 TEST METHODS
Semi-Circular Bend (SCB) Test
In a previous research study performed at Oregon State University (Coleri et al. 2017b), semi-
circular bend (SCB) test was selected as the most effective cracking experiment to characterize
asphalt mixtures used in Oregon (Sreedhar et al. 2018). Therefore, SCB tests were conducted in
this study to determine the cracking resistance of asphalt mixtures and to determine a suitable
threshold for the test’s output parameter (flexibility index) to be used as an acceptance criterion in
the proposed balanced asphalt mixture design process. Test method for evaluating the cracking
performance of asphalt concrete at intermediate temperatures developed by (Ozer et al. 2016) was
followed with few modifications. A displacement rate of 0.5 mm/min was used instead of 50
mm/min (Sreedhar et al. 2018, Coleri et al. 2017b).
130 mm tall samples were compacted in the laboratory according to AASHTO T 312-12. Two
samples with the thickness of 57 ± 2 mm were sawn from each gyratory compacted sample using
a high-accuracy saw. Then, cylindrical samples (cores) were cut into two identical halves using a
17
special jig. Tests were conducted at 25oC with a displacement rate of 0.5 mm/min. Samples were
kept in the chamber at the testing temperature for conditioning the day before being tested. Flat
side of the semi-circular samples was placed on two rollers. As a vertical load with constant
displacement rate is applied to the samples, applied load is measured via a load cell. Test stops
when the load drops below 0.5 kN. Flexibility index (FI) is the testing parameter obtained from
this test and used for cracking resistance evaluation.
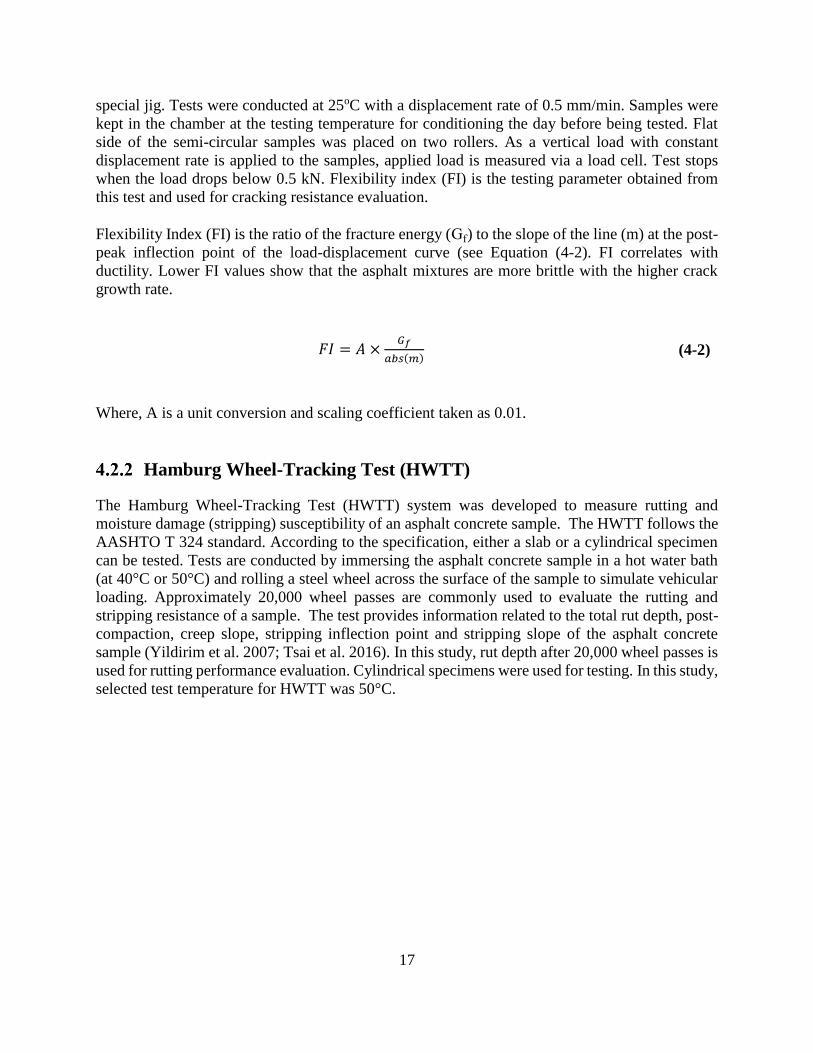
Flexibility Index (FI) is the ratio of the fracture energy (Gf) to the slope of the line (m) at the post-
peak inflection point of the load-displacement curve (see Equation (4-2). FI correlates with
ductility. Lower FI values show that the asphalt mixtures are more brittle with the higher crack
growth rate.
𝐹𝐼 = 𝐴 ×𝐺𝑓
𝑎𝑏𝑠(𝑚) (4-2)
Where, A is a unit conversion and scaling coefficient taken as 0.01.
Hamburg Wheel-Tracking Test (HWTT)
The Hamburg Wheel-Tracking Test (HWTT) system was developed to measure rutting and
moisture damage (stripping) susceptibility of an asphalt concrete sample. The HWTT follows the
AASHTO T 324 standard. According to the specification, either a slab or a cylindrical specimen
can be tested. Tests are conducted by immersing the asphalt concrete sample in a hot water bath
(at 40°C or 50°C) and rolling a steel wheel across the surface of the sample to simulate vehicular
loading. Approximately 20,000 wheel passes are commonly used to evaluate the rutting and
stripping resistance of a sample. The test provides information related to the total rut depth, post-
compaction, creep slope, stripping inflection point and stripping slope of the asphalt concrete
sample (Yildirim et al. 2007; Tsai et al. 2016). In this study, rut depth after 20,000 wheel passes is
used for rutting performance evaluation. Cylindrical specimens were used for testing. In this study,
selected test temperature for HWTT was 50°C.
18
4.3 EXPERIMENTAL DESIGN
This study was performed to evaluate three different mixes for their cracking and rutting
performance and volumetrics. Hamburg Wheel-Tracking Tests (HWTT) was selected as the
performance test for rutting. SCB test was used to quantify the cracking performance of the asphalt
mixtures. General experimental plan followed in this study is given in Table 4-2. A total of 96
laboratory experiments were conducted for the balanced mix design portion of this study. Several
additional samples were also prepared for the Gmm measurement and volumetric design stages.
Table 4-2: Experimental plan for balanced mix design.
Specimen
Type a
Mix ID b Test Temperature
(°C)
Asphalt
Content (%)
Replicates Total
LMLC
Mix1_AV5,
Mix1_AV7,
Mix3
SCB 25.0 OBC c,
- 0.5%,
+ 0.5%
4 36
HWTT 50.0 4 36
Mix2
SCB 25.0 OBC c,
+ 0.5%,
+ 1%
4 12
HWTT 50.0 4 12
a LMLC = Laboratory mixed, and laboratory compacted;
b Mix1_AV5 – Mix3/ = LMLC samples from three trial mixes as described in Table 4-1.
c OBC = Optimum binder content obtained from volumetric mix design.
4.4 RESULTS AND ANALYSES
The three selected mixes (see Table 4-1) were mixed, and compacted to produce test specimens.
Target test specimen air-void content was 7%. Binder contents from volumetric design are given
in Table 4-1. For Mix1 and Mix3, three different asphalt contents (AC) were used for balanced
mix design: ACdesign from volumetric mix design, ACdesign-0.5%, ACdesign+0.5%. For Mix2,
ACdesign-0.5% was too low and could result in a very dry mix (due to high RAP content) and hence
the three asphalt contents considered were: ACdesign from volumetric mix design, ACdesign+0.5%,
and ACdesign+1%. Hamburg Wheel-Tracking Tests (HWTT) were used to determine rutting
performance of asphalt mixtures. SCB test was used to quantify the cracking performance of the
asphalt mixtures. Four replicate tests were conducted for SCB tests while four replicate tests (four
core samples with two rut depth measurements) were conducted for HWTT.
SCB Test Results
Figure 4-2 presents the results of tests for cracking (SCB) performance. FI was calculated and used
to evaluate the cracking performance of all asphalt mixtures. The horizontal black line in Figure
4-2 is the FI thresholds selected in this study for Level 4 (FIthreshold=8) mixtures (determined by
Coleri et al. (2020)).

19
Figure 4-2: FI test results for all mixtures (length of the error bar is equal to one standard
deviation).
It can be observed from Figure 4-2 that increasing binder content increases Flexibility Index (FI)
for all cases, as expected. FI is able to capture the impact of increased binder content on cracking
resistance. It should be noted that all the three mixes were Level 4 mixtures (designed with 65
gyrations).
From the figure it can be observed that the average FI values of Mix 3 were higher than that of the
other mixes. In Figure 4-2, the first bar for Mix2 and the second bar of the other mixes show the
FI value for the LMLC samples prepared at the volumetric design binder content. It can be
observed that Mix3 has cracking resistances significantly higher than all other mixtures. Higher
cracking resistance for the Mix3 is likely to be a result of the use of a warm mix additive. It is
important to mention that the mixtures with warm mix additive are showing better cracking
resistance than other corresponding mixes with same or higher binder contents. The FI value for
Mix1 with 5% air-void was slightly higher than the same mix with 7% air void. Thus, density of
the mix appears to have an effect on the cracking resistance. High RAP mix (Mix2) has better
cracking resistance than the low RAP mix (Mix1) but this can be explained by the higher binder
content of Mix2 specimens. BMD suggested optimum binder contents (calculated and presented
in Section 4.4.3) for 30% and 45% RAP cases should be checked to determine the impact of
increased RAP percentage on performance and design binder content.
0
5
10
15
20Fl
exib
ility
Ind
ex

20
HWTT Test Results
Figure 4-3 presents the results of HWTT tests conducted to determine the rutting performance of
asphalt mixtures. Average surface rut depth after 20,000 wheel passes was used to evaluate the
rutting performance of all asphalt mixtures. A mixture with higher rut depth is expected to show
lower rutting resistance. The horizontal black line in Figure 4-3Error! Reference source not
found. is the HWTT rut depth threshold used in this study for BMD (RDthreshold=2.5mm for Level
4 mixes determined by Coleri et al. (2020)).
Figure 4-3: HWTT test results for all mixtures (length of the error bar is equal to one
standard deviation).
It can be observed from Figure 4-3 that increasing binder content increases rut depth for all the
cases, which is expected. In addition, it can be observed that Mix1_AV5 has the best rutting
resistance among all the mixes. Samples for only this mixture were compacted at 5% air-void.
Higher density (2% higher than 7% air-void samples) resulted in an improved rutting resistance.
It is important to note that 2% increase in density resulted in significant improvements in rutting
and cracking performance. Although not simulated in this study, increased density is also expected
to reduce long-term aging and moisture susceptibility of the asphalt mixtures due to reduced
permeability. It is possible that Mix3 with warm-mix additives can have better “compactibility”
due to lower viscosity of the modified asphalt binder. Improved compactibility will result in higher
density values with associated long-term performance benefits.
0
0.5
1
1.5
2
2.5
3
3.5
4
4.5
Ave
rage
Ru
t D
ep
th (
mm
)
21
In this study, four replicate asphalt cores were produced for HWTT testing. Since two cores were
attached edge-to-edge to run the experiment, a total of two rut depth values were collected from
the test system for each case. Increasing replicate test results from two to three is recommended in
this study to minimize the impact of high-test results’ variability on average measured rut depth.
In addition, since HWTT experiments were conducted under water, test results are also affected
by the moisture susceptibility of the asphalt mixture in addition to rut resistance. Combined effect
of moisture and rut resistance reflected in the test results might be increasing the variability of the
test.
Mix3 is showing the highest rut-depth among all three mixes as the warm mix additive is making
the mix softer. High RAP mix is showing higher rut depth than the low RAP mix (Mix1) but it
should be noted that the high RAP mix also has higher binder content (0.2% more binder for every
case).
Balanced Mix Design
Balanced mix design approach helps in determining the binder content range that satisfies both
cracking and rutting performance criteria. Minimum binder content is the lowest asphalt binder
percentage allowed in the mix to satisfy the FI threshold of 8 for Level 4 mixtures and FI of 6 for
Level 3 mixtures in Oregon. Maximum asphalt content is the highest percentage that satisfies the
rutting criteria, rut depth of 2.5mm for Level 4 mixtures and 3mm for Level 3 mixtures in Oregon
(Coleri et al. 2020). Figure 4-4(a)-(d) depict balanced mix design charts for all the mixes used in
this study. Based on the volumetric mix design, Mix1 and Mix3 have an asphalt content of 5.6%
and Mix2 has an asphalt content of 5.3%.
From Figure 4-4(a), it can be observed that Mix1 does not meet the cracking and rutting criteria at
the design asphalt content. However, with the balanced mix design approach, the minimum asphalt
binder content required is about 6% (see Figure 4-4(a)). This increased binder content is expected
to significantly increase the cost of the Mix1_AV5 asphalt mixture while still keeping it in the
acceptable region for rutting and cracking performance. However, to ensure a high long-term
cracking performance, 6.3% asphalt binder content can also be used for production. However, it
should be noted that using 6.3% design asphalt content creates a high risk for rutting since plant
produced mixtures are allowed to have ±0.5% variability in production binder content in Oregon.
ODOT is currently in the process of changing the binder content variability tolerance from ±0.5%
to ±0.35%. This change is expected to reduce the risk of rutting or cracking failures due to
production binder content variability. However, for practicality purposes and considering the mix
costs, this study recommends to use the lower limit obtained from the balanced mix design
approach. Similarly, based on the balanced mix design plots for other three mixes, the required
asphalt content for Mix1_AV7, Mix2 and Mix3 are 6.05%, 6.10% and 5.30%, respectively.
Although there is no binder content range for Mix 1_AV7 (See Figure 4-4b) that satisfies both the
rutting and cracking requirements, the upper limit number that satisfies the rutting requirement is
selected as the design binder content for balanced mix design.

22
(a)
(b)

23
(c)
(d)
Figure 4-4: Balanced mix design for (a) Mix1_AV5 (b) Mix1_AV7 (c) Mix2 and (d) Mix3.

24
The asphalt content derived from the above balanced mix design plots and the results of the
previously conducted Gmm measurements were used to back calculate the volumetric properties of
the mixes. Results are shown in Table 4-3. The mix design verification (MDV) performed with
the mixes with balanced mix design binder contents revealed that the volumetric properties of the
mixes were still meeting the ODOT specifications as discussed in Section 4.1.
Table 4-3: Volumetric properties for the three mixes based on BMD design binder content
ID a Binder
Grade
RAP b
(%)
ACRAP AC c
(%)
BR d
(%)
Pbe e
(%)
P200/Pbe f
Ratio Addi.g
VMAj-
VFAk% (%)
Mix1_AV5
PG 70-
22ER
30 6.00 25.1 4.96 1.30 1% Lih 16.2-69
Mix1_AV7 30 6.05 24.9 4.99 1.28 1% Li 16.2-69
Mix2 45 5.02 6.10 37.0 5.04 1.27 1% Li 15.4-68
Mix3 30 5.30 28.4 4.37 1.46
1% Li,
0.68%
Evmi
16.4-70
a All mixtures had dense gradation and aggregates with a nominal maximum aggregate size of 12.5mm; b RAP = Reclaimed asphalt pavement added by weight; c AC = Design BMD asphalt content added by weight; d BR = Binder replacement; e Pbe = Effective asphalt content present by weight in the total mix; f P200/Pbe = Dust to binder ratio in the mix; g Addi. = Additive; h Li = Lime; i Evm = Evotherm warm mix additive; j VMA = Voids in mineral aggregate; k
VFA = Voids filled with asphalt.
Cost Calculation Tool
The use of RAP in Hot Mix Asphalt (HMA) paving is often considered a cost-saving measure.
Although it can make the pavement more susceptible to cracking failure, it is considered a
sustainable alternative to asphalt mixtures with all-virgin materials, both in terms of cost and
environmental impacts. However, contractors and agencies who are not able to accurately quantify
savings brought on by using RAP in HMA mix may be discouraged from using these materials
due to their reduction in HMA cracking resistance. The culmination of these factors yields a
necessity for a simple way to analyze different mix design options.
The use of Warm Mix Asphalt (WMA) is also seen as a method of decreasing costs. It is considered
to be a sustainable alternative to HMA considering the cost (burner fuel reductions), environment
(less CO2 emissions) and safety (improving the labor conditions for workers). The use of high
RAP in WMA can be one of the best solutions for asphalt mixtures.
In this study, we used a tool created by Coleri et al. (2017a) that allows the users to compare mix
design strategies against one another in order to calculate the potential savings they can realize by
choosing mix designs with different RAP and RAS contents, as well as different binder types and

25
binder contents. This tool is meant to increase incentive for users to use recycled materials in their
HMA mixes, thereby increasing the sustainability and cost-effectiveness of asphalt pavement
construction. Given the geometry of a pavement section and pertinent material cost data, the
contractor and/or agency can evaluate the total estimated cost of implementing a particular mix
design strategy for their project.
A screenshot of the tool’s input tab is given in Figure 4-5 and Figure 4-6 presents the comparisons
of all the mixes based on materials and plant burner fuel costs. In order to use the tool, the user
must input data about their HMA and WMA mix design, such as target density, binder content and
recycled materials content. Input data about the geometry of the pavement section, such as length,
lane width, number of lanes and compacted layer thickness, should also be entered. The tool will
automatically calculate the volume and weight of HMA material that is anticipated for the target
density and pavement section geometry. The user must also input cost data for the materials. The
user can input their unit costs for binder, aggregate and recycled materials (RAP). Input fields are
shown in orange with blue text and calculated fields are shown in gray with orange text. The total
mix cost for the pavement section is shown at the bottom of each mix design spreadsheet in dark
gray text. It should be noted that calculated asphalt mixture costs are based on the cost calculations
in the spreadsheet by using the raw material costs and do not include any plant operation costs or
added profit for the plant. Since 45% RAP is not allowed in Oregon and warm-mix is not
commonly used, it was not possible to get direct mixture costs for those alternatives.
The last step is calculating the production burner cost which was not included in the previous
calculations. The burner fuel cost can be the key factor in determining whether the HMA or the
WMA is the most cost-efficient asphalt mixture. In order to assess the contribution of the
production costs, a fuel consumption of 2 gallons of diesel fuel per ton for HMA and 1 gallon of
diesel fuel per ton for WMA with chemical additive Evotherm P25 (Sullivan and Moss, 2014)
were considered, which means a reduction of 50% burner fuel. Also, a price of $3/gallon diesel
fuel for Oregon was used (Statista, 2020). Table 4-4 shows the amount of burner fuel savings for
WMA dependent on the additives used.
Table 4-4: Amount of burner fuel savings for WMA (Sullivan and Moss, 2014)
Method Example Product Burner Fuel Savings
Chemical Additives Advera® 1.0 gal/ton (50%)
Organic Additives Sasobit® 0.7 gal/ton (35%)
Water-Based Foaming Double-Barrel Green® 0.4 gal/ton (20%)

26
Figure 4-5: Cost calculation tool input tab

27
Figure 4-6: Cost comparison for all the mixes based on materials and burner fuel cost
The tool can compare up to four different mix strategies. This means the user can evaluate
differences in total cost for up to four different binder types and/or RAP contents. A summary
spreadsheet compares the various mix design options. This sheet shows the cost differences
between each individual mix design, as well as maximum and minimum cost options. The lowest
and highest cost options are indicated. Considering the production costs (burner fuel usage) the
mixes total cost was also calculated (materials + production burner cost). A bar chart shows a side-
by-side comparison of each mix design strategy in order to visualize the costs of each option and
also it shows a comparison of total cost for all mixes.
In this study, the following costs were used to calculate the total material cost of asphalt mixtures.
These are typical costs taking from previous years production:
• RAP: $20/ton
• Aggregate: $13/ton
• PG70-22ER binder: $490/ton
• Evotherm P25: $70/ton
$-
$5,000.00
$10,000.00
$15,000.00
$20,000.00
$25,000.00
$30,000.00
$35,000.00
Plant Burner Cost
Materials Cost

28
Life-Cycle Cost Analysis (LCCA)
In this study, analyses were first performed by only considering material costs to be able to
compare the impact of RAP content, binder content, and additives on life cycle costs. Then, a
second set of LCCA was performed after including the plant burner costs to be able to determine
the cost impact of using warm-mix.
In this study, each section was assumed to be a single-lane having a width of 12 ft (3.7 m) and a
length of 1 mile and material costs were calculated for all mixes based on a 2inch (50.8mm) layer
thickness. The cost calculation tool described in Section Error! Reference source not found..4
was used to calculate the material costs.
Net present value (NPV) of agency costs were determined using a 4 percent interest rate for a 60
year analysis period by using Equation (4-3). Since all mix designs had a 20 year design period, it
was assumed that same mixtures will be used every 20 years for the next 60 years. It should be
noted that the purpose of LCCA is to be able to compare the cost effectiveness of all mixtures.
Calculated NPV values can only be used for comparison and cannot be used for bidding or long-
term cost predictions.
NPV = ∑Ct
(1+r)t
T
t=0
(4-3)
Where:
Ct = estimated agency costs at year t,
r = interest rate, and
T = number of time periods.
In this study, the NPV was calculated for all the mixes and the equation below describe how the
NPV for Mix1_AV5 was calculated.
NPV6%BCMix1_AV5 = $27,823
(1 + 0.04)0+
$27,823
(1 + 0.04)20+
$27,823
(1 + 0.04)40= $46,316

29
(a)
(b)
27,823 27,823 27,823
$0
$5,000
$10,000
$15,000
$20,000
$25,000
$30,000
0 10 20 30 40 50 60
Co
sts
($)
Pavement life(years)
28,005 28,005 28,005
$0
$5,000
$10,000
$15,000
$20,000
$25,000
$30,000
0 10 20 30 40 50 60
Co
sts
($)
Pavement life(years)

30
(c)
(d)
Figure 4-7: Diagrams used for LCCA (a) Mix1_AV5 (b) Mix1_AV7 (c) Mix2 and (d) Mix3.
26,167 26,16726,167
$0
$5,000
$10,000
$15,000
$20,000
$25,000
$30,000
0 10 20 30 40 50 60
Co
sts
($)
Pavement life(years)
27,299 27,299 27,299
$0
$5,000
$10,000
$15,000
$20,000
$25,000
$30,000
0 10 20 30 40 50 60
Co
sts
($)
Pavement life(years)

31
In Table 4-5, the NPVs without the burner fuel consumption costs (by just considering raw material
costs) were summarized for all asphalt mixtures of this study.
Table 4-5: NPVs for all the mixes – Without burner fuel consumption cost
S. No. Mix ID Initial cost ($) NPV-1 ($) NPV-2 ($) NPV ($)
1. Mix1_AV5 27,823 12,698 5,795 46,316
2. Mix1_AV7 28,005 12,781 5,833 46,619
3. Mix2 26,167 11,942 5,450 43,560
4. Mix3 27,299 12,459 5,686 45,444
It can be observed from Table 4-5 that the mix with 45% RAP content (Mix 2) has the lowest NPV
over the course of 60 years analysis period followed by the warm mix asphalt (Mix 3) and the mix
with 30% RAP (Mix 1) when only the raw material costs are considered. However, this ranking
altered when the plant burner fuel consumption was incorporated into the life cycle cost analysis
as can be seen in Table 4-6. When the burner costs are included in the LCCA, the most cost-
effective mix is the warm mix asphalt (Mix 3) considering the reduced production (burner)
temperature and consequently less fuel consumption during production.
Table 4-6: NPVs for all the mixes – With burner fuel consumption cost
S. No. Mix ID Initial cost ($) NPV-1 ($) NPV-2 ($) NPV ($)
1. Mix1_AV5 32,416 14,794 6,752 53,962
2. Mix1_AV7 32,599 14,878 6,790 54,267
3. Mix2 30,761 14,039 6,407 51,207
4. Mix3 29,597 13,508 6,165 49,269
Environmental Impact
Athena Pavement LCA software was used to calculate the environmental impact of each pavement
mixture. For a base case, a mixture of 6% binder content and 20% RAP content was selected (Mix
F in the plots). This represents the most common pavement design in Oregon. The roadway
geometry for all cases was defined to have three lifts of pavement with thicknesses of 2.5 inches,
5.5 inches, and 5.5 inches. The length of roadway was set to 0.62 mile (1 km), with three lanes of
12 feet each, a typical width for roadways in America.
In order to determine the differences in environmental performance, the primary characteristics
for each pavement design were entered into the Pavement LCA software. Materials by percentage
of total mixture weight were input (binder content, additives, RAP content, etc.) along with the
asphalt type (HMA or WMA). All factors for which no data was available, or those factors which
were not considered (such as hauling distance) were set to be default and equal between mixes so
as not to affect the results. Pavement vehicle interaction (PVI), being a separate option in the
32
software, was excluded entirely since all mixes were designed for 20 years and PVI related vehicle
operating costs should be theoretically equal for all analyzed mixtures.
In order to accurately compare different pavement designs, each mixture was assumed to conform
to a 60-year lifespan with rehabilitation occurring at every 20th year. For rehabilitation 2 inches
of asphalt is milled and removed and then replaced (mill and fill process which is commonly used
in Oregon for rehabilitation).
Results were exported from the software and plotted using excel. Results are given in Global
Warming Potential (GWP), Acidification Potential (AP), and Eutrophication Potential (EP) for all
three mixtures of this study. Mix 1 with 5% air void case was not evaluated since density does not
directly change the environmental impact. Units do not represent the chemical composition of the
pollution itself, but instead represent the amount of a standard normalizing factor representative of
each pollution type (Myhre et al. 2013).
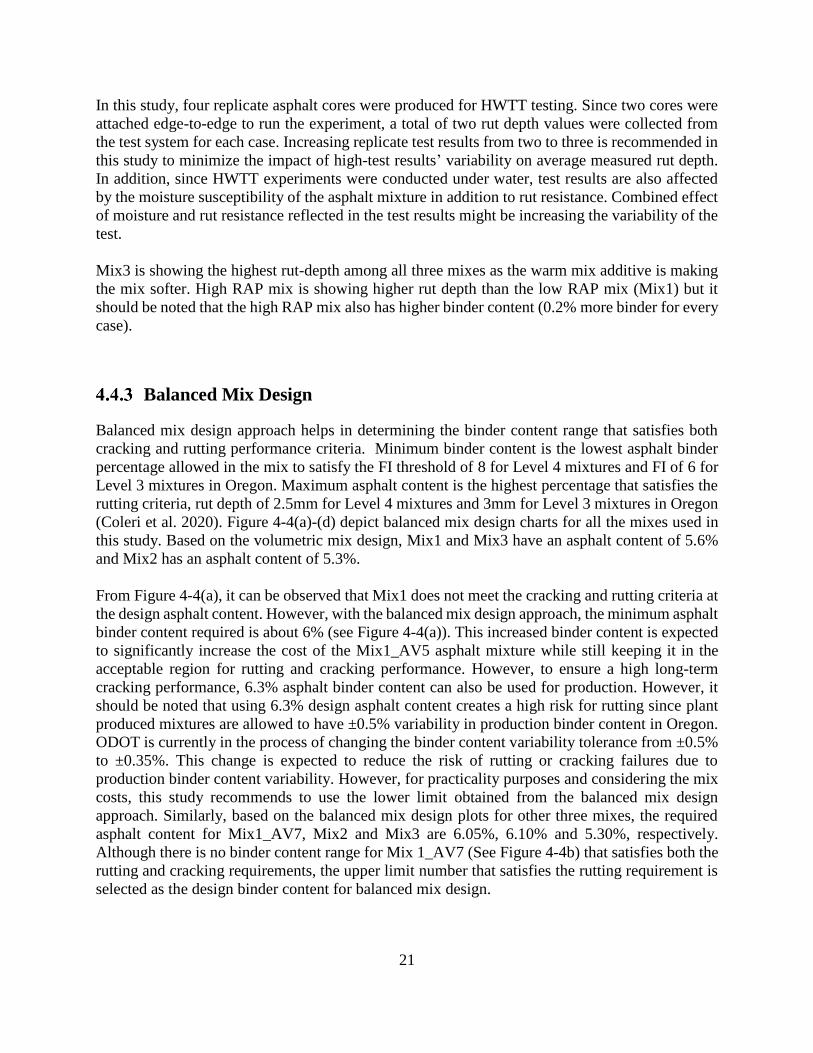
Figure 4-8 displays the results for global warming potential by mix type, in units of kilograms of
carbon dioxide. Global warming potential acts as a useful parameter to assess the future impact of
an emission on the atmosphere (Myhre et al. 2013).
Figure 4-8: Global Warming Potential (GWP) by mix type
Mixtures 1, 2, and 3 each performed nearly equivalently, with mixture 1 exhibiting slightly worse
performance and mixture 3 (warm-mix) being the best. All mixtures had significantly lower
impact when compared to the typical Oregon asphalt mixture with lower RAP content. This is
likely caused by the difference in the production process between HMA and WMA and increased
RAP content in the designed mixtures.
500,000
550,000
600,000
650,000
700,000
750,000
800,000
850,000
900,000
950,000
Mix F Mix 1 Mix 2 Mix 3
Glo
bal
War
min
g P
ote
nti
al (
kg C
O2
eq
)
Mix Type
Global Warming Potential

33
Figure 4-9 displays the acidification potential of each pavement mix. Acidification results from
carbon dioxide released into the atmosphere dissolving into ocean waters which increases the
concentration of carbonate ions and lowers ocean water pH (Feely et al. 2009).
Figure 4-9: Acidification Potential by Mix Type
The results for acidification potential are similar to that of global warming potential. Mix F again
performed poorly while mixes 1, 2, and 3 performed similarly. Mix 3 (warm-mix) again
outperformed both Mixes 1 and 2. This is most likely a result of the WMA production process
being significantly less energy intensive as well as the design allowing for a lower binder content
and higher RAP.
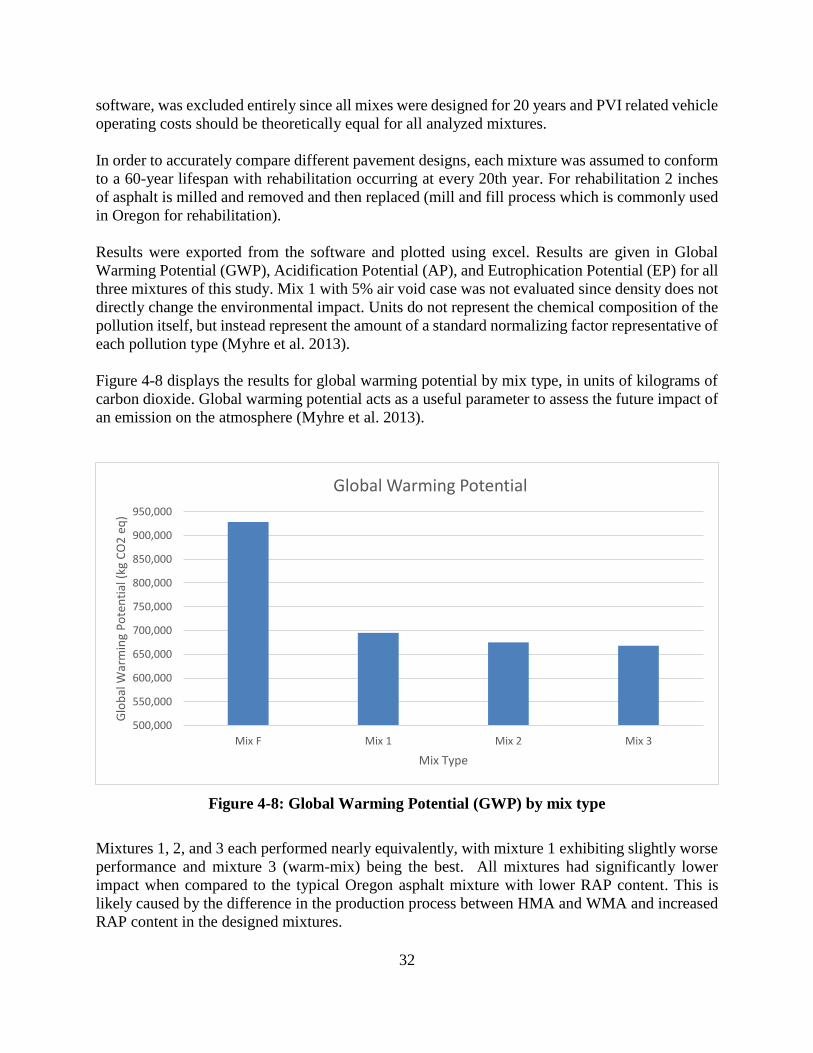
Figure 4-10 displays the eutrophication potential generated by each mixture measured in kilograms
of nitrogen. Eutrophication is a measure of the increased availability of normally population
limiting factors for aquatic based photosynthetic organisms (Carpenter et al. 2015). Increased
eutrophication can lead to the destabilization of ocean ecosystems.
The results indicate that mixtures 1, 2, and 3 again outperformed the typical pavement design.
Mixture 3 (warm-mix) performed the highest of the three design mixtures. The differences
between the three design mixtures and the typical mixture is likely explained by the increased RAP
content in the three designs as well as the lower energy cost of WMA. Differences between the
three designs is likely to be caused by the slight difference in binder content as well as RAP
content.
4,000
4,500
5,000
5,500
6,000
6,500
7,000
7,500
8,000
8,500
9,000
Mix F Mix 1 Mix 2 Mix 3
Aci
dif
icat
ion
Po
ten
tial
(kg
SO
2 e
q)
Mix Type
Acidification Potential
34
Figure 4-10: Eutrophication Potential by Mix Type
5.0 FINAL CONCLUSIONS AND RECOMMENDATIONS
In this study, volumetric and balanced mix designs were conducted to determine the optimum
asphalt binder content for four different asphalt mixtures. Cost effectiveness and the environmental
impact of those asphalt mixtures were also quantified and compared. Based on the quantified cost,
performance, and environmental impact values, the mixture with warm-mix additives (Mix 3) is
selected as the best asphalt mixture with lowest cost and lowest environmental impact. Other
conclusions derived from this study are as follows:
1. According to volumetric mix design, all VMA values are within the 13.5-17.0 range required
for 12.5mm nominal maximum aggregate size mixtures in Oregon according to the standard
mix design verification process. All VFA values are also within the required range of 65 to
75 required for Level 4 asphalt mixtures in Oregon. Dust-to-binder ratios for all asphalt
mixtures are also within the limits required by ODOT (0.8-1.6).
2. Mix3 has cracking resistances significantly higher than all other mixtures. Higher cracking
resistance for the Mix3 is likely to be a result of the use of a warm mix additive. It is important
to mention that the mixtures with warm mix additive are showing better cracking resistance
than other corresponding mixes with same or higher binder contents.
3. The FI value for Mix1 with 5% air-void was slightly higher than the same mix with 7% air
void. Thus, density of the mix appears to have an effect on the cracking resistance.
0
50
100
150
200
250
300
350
400
450
Mix F Mix 1 Mix 2 Mix 3
Eutr
op
hic
atio
n P
ote
nti
al (
kg N
eq
)
Mix Type
Eutrophication Potential

35
4. High RAP mix (Mix2) has better cracking resistance than the low RAP mix (Mix1) according
to SCB test results but this is expected to be a result of the higher binder content of Mix2
specimens. The higher BMD binder content of Mix 2 (when compared to lower RAP mix-
Mix 1) suggested that performance of high RAP mixture can be improved by slight
increasing the binder content.
5. Although Mix 2 (45% RAP) had a higher BMD binder content than Mix 1 (30% RAP), it
was still more cost effective due to the increased use of recycled asphalt material in the mix.
6. Mix1_AV5 has the best rutting resistance among all the mixes. Samples for only this mixture
were compacted at 5% air-void. Higher density (2% higher than 7% air-void samples)
resulted in an improved rutting resistance. It is important to note that 2% increase in density
resulted in significant improvements in rutting and cracking performance. Although not
simulated in this study, increased density is also expected to reduce long-term aging and
moisture susceptibility of the asphalt mixtures due to reduced permeability.
7. It is possible that Mix 3 with warm-mix additives can have better “compactibility” due to
lower viscosity of the modified asphalt binder. Improved compactibility will result in higher
density values with associated long-term performance benefits.
8. Based on the balanced mix design plots for other three mixes, the required asphalt content
for Mix1_AV7, Mix2 and Mix3 are 6.05%, 6.10% and 5.30%, respectively. The mix design
verification (MDV) performed with the mixes with balanced mix design binder contents
revealed that the volumetric properties of the mixes were still meeting the ODOT
specifications.
9. The mix with 45% RAP content (Mix 2) has the lowest NPV over the course of 60 years
analysis period followed by the warm mix asphalt (Mix 3) and the mix with 30% RAP (Mix
1) when only the raw material costs are considered. However, this ranking altered when the
plant burner fuel consumption was incorporated into the life cycle cost analysis. When the
burner costs are included in the LCCA, the most cost-effective mix is the warm mix asphalt
(Mix 3) considering the reduced production (burner) temperature and consequently less fuel
consumption during production.
10. Mix 3 (warm-mix) is also the most environmentally friendly mix with lower expected GWP,
EP, and AP values for a 60 year analysis period.

36
6.0 REFERENCES
AASHTO R 30-10. 2010. Standard Practice for Mixture Conditioning of Hot Mix Asphalt (HMA).
Washington, DC: American Association of State and Highway Transportation Officials.
AASHTO T 209-12. 2012. Theoretical Maximum Specific Gravity (Gmm) and Density of Hot
Mix Asphalt. Washington, DC: American Association of State and Highway Transportation
Officials, 2012
AASHTO T 312-12. 2012. Preparing and determining the density of hot mix asphalt (HMA)
Specimens by Means of the Superpave Gyratory Compactor. Washington, DC: American
Association of State Highway and Transportation Officials, 2012.
AASHTO T 324-19. 2019. Standard Method of Test for Hamburg Wheel-Track Testing of
Compacted Asphalt Mixtures. Washington, DC: American Association of State Highway and
Transportation Officials, 2019.
AASHTO TP 79-13. 2013. Standard method for determining the dynamic modulus and flow
number for hot mix asphalt (HMA) using the asphalt mixture performance tester (AMPT).
Washington, DC: American Association of State and Highway Transportation Officials, 2013.
AASHTO TP 105-13. 2013. Standard Method for Determining the Fracture Energy of Asphalt
Mixtures Using the Semi Circular Bend Geometry (SCB). Washington, DC: American Association
of State Highway and Transportation Officials, 2013,
Bennert, T., Sheehy, E., Hanson, D., Gresavage, S., and Fee, F. (2014). Implementation of
performance-based specifications for asphalt mix design and production quality control for New
Jersey. Application of Asphalt Mix Performance-Based Specifications, 13.
Carpenter, S. R. et al. 1995. Biological control of eutrophication in lakes. Environmental Science
& Technology 29, 784-786.
Coleri, E., S. Haddadi, S. Sreedhar, S. Lewis, Y. Zhang, and B. Wruck. 2017a. Binder-grade
bumping and high binder content to improve performance of RAP-RAS mixtures. Final Rep. No.
SPR 797. Salem, OR: Oregon Dept. of Transportation.
Coleri, E., S. Sreedhar, S. Haddadi, B. Wruck, and M. Haynes. 2017b. Adjusting asphalt mixes for
increased durability and implementation of a performance tester to evaluate fatigue cracking of
asphalt concrete. Final Rep. No. SPR 785. Salem, OR: Oregon Dept. of Transportation.
Coleri, E., S. Sreedhar, and I. Obaid. 2020. Development of a balanced mix design method in
Oregon. Final Rep. No. SPR 801. Salem, OR: Oregon Dept. of Transportation.

37
Cooper, S., L. Mohammad, S. Kabir, and W. King. Balanced Asphalt Mixture Design Through
Specification Modification: Louisiana’s Experience. Circular Number E-C189, Transportation
Research Board of the National Academies, Washington, DC. 2014.
Dave, E. V., and Koktan, P. 2011. Synthesis of performance testing of asphalt concrete. Report
MnDOT 2011-22.
Epps, J. A., Hand, A., Seeds, S., Schulz, T., Alavi, S., Ashmore, C., Monismith, C., Decon, A.,
Harvey, J. T., and Leahy, R. 2002. Recommended performance-related specification for hot-mix
asphalt construction: results of the Wes Track project, NCHRP Report 455. Washington, DC:
Transportation Research Board.
Feely, R. A., S. Doney, and S. Cooley. 2009. Ocean Acidification: Present Conditions and Future
Changes in a High-CO2 World. Oceanography, Vol. 22, no. 4, pp. 36-47.
FHWA, Office of Pavement Technology. A review of aggregate and asphalt mixture specific
gravity measurements and their impacts on asphalt mix design properties and mix acceptance.
2010. https://www.fhwa.dot.gov/pavement/materials/pubs/hif11033/hif11033.pdf. Accessed on
February 13, 2020.
Harvey, J., Wu, R., Signore, J., Basheer, I., Holikatti, S., Vacura, P., and Holland, T. J. 2014.
Performance-based specifications: California experience to date. Transportation Research
Circular, (E-C189).
Haddadi, S. S., Coleri, E., and Sreedhar, S. 2019. Strategies to improve performance of reclaimed
asphalt pavement-recycled asphalt shingle mixtures. International Journal of Pavement
Engineering, 1-12.
Hughes, C. S., and Maupin, G. W. 2000. The journey toward end result specifications for asphalt
concrete. No. VTRC 01-TAR7. Virginia Transportation Research Council.
Ingevity Corporation. 2019. Getting started with Evotherm.
https://www.ingevity.com/uploads/market-pdfs/Getting-started-with-Evotherm.pdf. Accessed on
February 12, 2020.
Kim, Y. R., Guddati, M., Underwood, B. S., Lacroix, A., Baek, C., Eslaminia, M., and Bartucca,
J. 2011. Hot mix asphalt performance-related specifications based on viscoelastoplastic continuum
damage (VEPCD) Models. Quarterly Research Progress Report: October–December.
Krugler, P., Tahmoressi, M. and Rand, D. 1992. Improving the precision of test methods used in
VMA determination. Proceedings of the Association of Asphalt Paving Technologists. Vol. 61,
pp. 272-303.
Myhre, G., D. Shindell, F.-M. Bréon, W. Collins, J. Fuglestvedt, J. Huang, D. Koch, J.-F.
Lamarque, D. Lee, B. Mendoza, T. Nakajima, A. Robock, G. Stephens, T. Takemura and H.
38
Zhang. 2013. Climate Change 2013: The Physical Science Basis. Contribution of Working Group
I to the Fifth Assessment Report of the Intergovernmental Panel on Climate Change.
Newcomb, D., Martin, A.E., Yin, F., Arambula, E., Park, E.S., Chowdhury, A., Brown, R.,
Rodezno, C., Tran, N., Coleri, E. and Jones, D. 2015. Short-term laboratory conditioning of asphalt
mixtures (No. Project 09-52). 2015.
ODOT. 2018. Oregon Standard Specifications for Construction. Oregon Department of
Transportation
ODOT. 2019. ODOT Pavement Design Guide. Oregon Department of Transportation.
Ozer, H., Al-Qadi, I. L., Lambros, J., El-Khatib, A., Singhvi, P., & Doll, B. 2016. Development of
the Fracture-Based Flexibility Index for Asphalt Concrete Cracking Potential Using Modified
Semi-Circle Bending Test Parameters. Construction and Building Materials, 115, 390–401.
Sreedhar, S., Coleri, E., & Haddadi, S. S. 2018. Selection of a performance test to assess the
cracking resistance of asphalt concrete materials. Construction and Building Materials, 179, 285-
293.
Statista. Monthly retail prices of diesel fuel in the United States from January 2019 to January
2020 (in U.S. dollars per gallon). 2020. https://www.statista.com/statistics/204169/retail-prices-
of-diesel-fuel-in-the-united-states-since-2009/. Accessed on February 12, 2020.
Sullivan, E.J. and Moss, A. 2014. Paving Cost Comparisons: Warm-Mix Asphalt Versus Concrete.
https://www.cement.org/docs/default-source/market-economics-pdfs/issues-
trends/paving_cost_comparisons_flash.pdf?sfvrsn=4&sfvrsn=4. Accessed on February 12, 2020.
Tsai, B. W., E. Coleri, J.T. Harvey, C.L. Monismith. 2016. Evaluation of AASHTO T 324
Hamburg-Wheel Track Device test Constr. Build. Mater., 114, pp. 248-260.
West, R., C. Rodezno, F. Leiva, F. Yin. 2018. Development of a Framework for Balanced Mix
Design. Project NCHRP 20-07/Task 406.
Williams, R. C., Hill, D. L., Hofmann, K., Zelenock, M., and Bausano, J. 2004. Development of
laboratory performance test procedures and trial specifications for hot mix asphalt. No. RC-1410.
Michigan. Dept. of Transportation.
Yildirim, Y., Jayawickrama, P. W., Hossain, M. S., Alhabshi, A., Yildirim, C., Smit, A. D. F., &
Little, D. 2007. Hamburg wheel-tracking database analysis. Texas Department of Transportation
and Federal Highway Administration, FHWA/TX-05/0-1707-7. 2007.
Zhou, F., Hu, S., and Scullion, T. 2006. Integrated asphalt (overlay) mixture design, balancing
rutting and cracking requirements (No. FHWA/TX-06/0-5123-1). Texas Transportation Institute,
Texas A and M University System.

39
Zhou, F., Scullion, T., Walubita, L., and Wilson, B. 2014. Implementation of a performance-based
mix design system in Texas. Application of Asphalt Mix Performance-Based Specifications, 32.

40
APPENDIX A: GRADATION AND BINDER CONTENT OF RAP
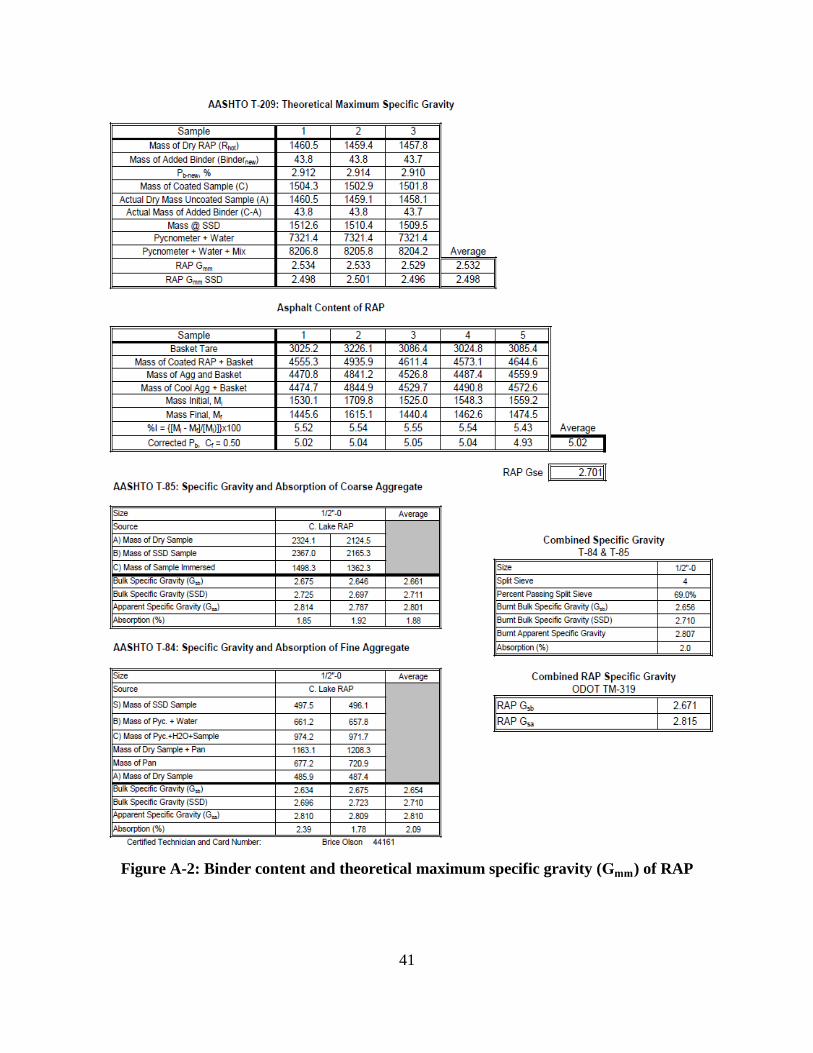
This section represents the gradation, binder content and theoretical maximum specific gravity
(Gmm
) of RAP materials provided by Knife River.
Figure A-1: RAP aggregate gradation
41
Figure A-2: Binder content and theoretical maximum specific gravity (Gmm) of RAP
42
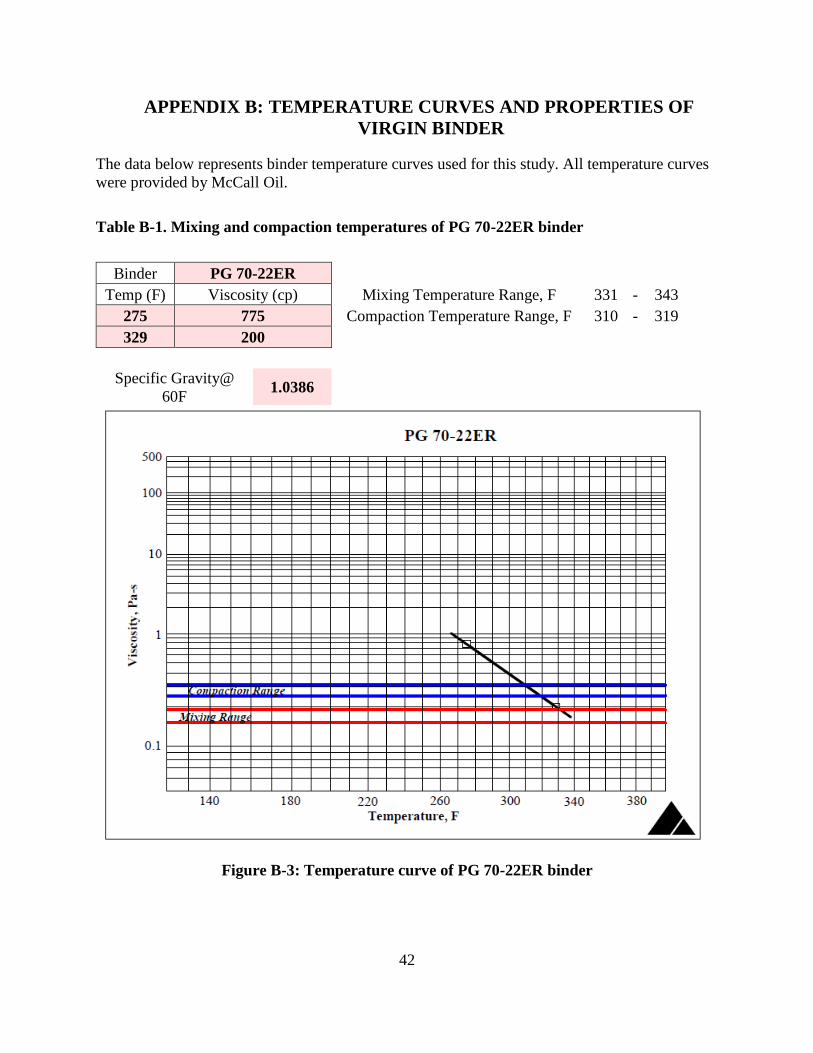
APPENDIX B: TEMPERATURE CURVES AND PROPERTIES OF
VIRGIN BINDER
The data below represents binder temperature curves used for this study. All temperature curves
were provided by McCall Oil.
Table B-1. Mixing and compaction temperatures of PG 70-22ER binder
Binder PG 70-22ER
Temp (F) Viscosity (cp) Mixing Temperature Range, F 331 - 343
275 775 Compaction Temperature Range, F 310 - 319
329 200
Specific Gravity@
60F 1.0386
Figure B-3: Temperature curve of PG 70-22ER binder

43
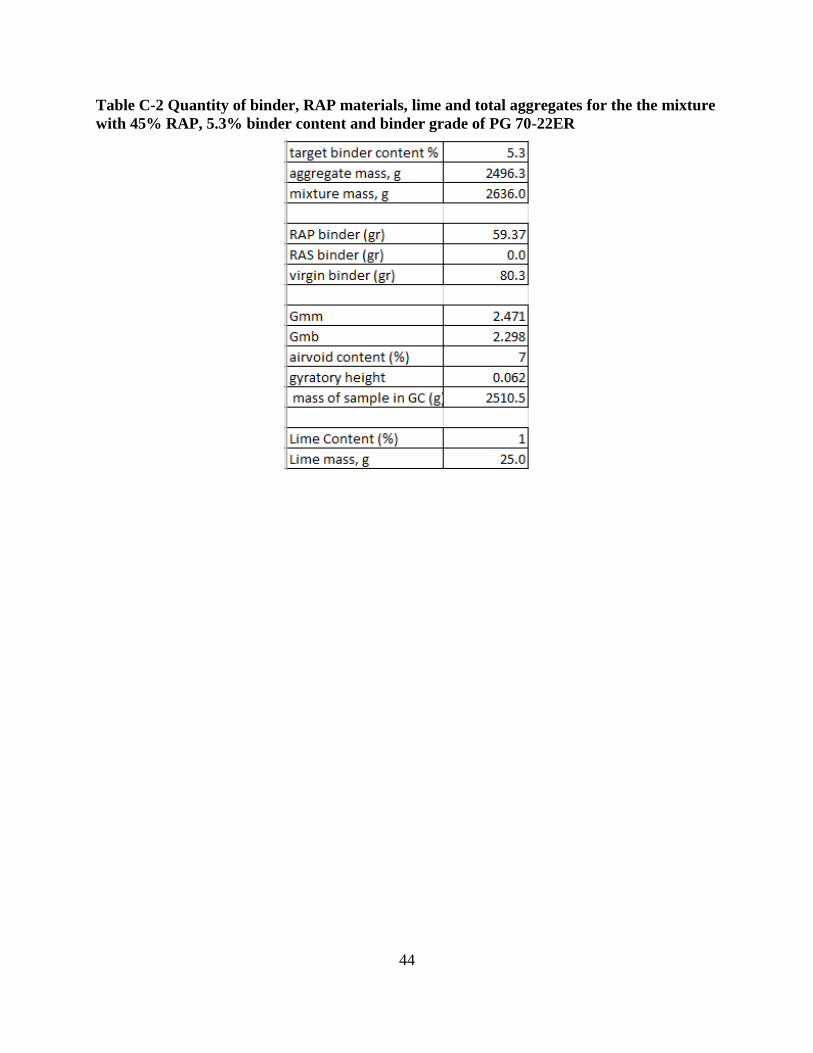
APPENDIX C: AN EXAMPLE FOR BATCHING SHEETS
The following example shows the procedure of calculating the quantity of materials for the
mixture with 45% RAP, 5.3% binder content and binder grade of PG 70-22ER.
Table C-1 Quantity of coarse, medium, and fine aggregates and RAP materials for the
mixture with 45% RAP, 5.3% binder content and binder grade of PG 70-22ER
44
Table C-2 Quantity of binder, RAP materials, lime and total aggregates for the the mixture
with 45% RAP, 5.3% binder content and binder grade of PG 70-22ER