selected special statistics stillbirths and infant deaths ... · during 2012-2016, most kansas...
TRANSCRIPT
Selected Special Statistics
Stillbirths and Infant Deaths
Kansas, 2016
Kansas Department of Health and Environment Division of Public Health
Bureau of Epidemiology & Public Health Informatics Curtis State Office Building – 1000 SW Jackson, Topeka, KS, 66612-1354
http://www.kdheks.gov/bephi/ December 2017
This Research Summary Was Prepared By:
Kansas Department of Health and Environment
Susan Mosier, MD, Secretary
Bureau of Epidemiology and Public Health Informatics Farah Ahmed, PhD, MPH, Interim State Epidemiologist and Interim Director
Elizabeth W. Saadi, PhD, State Registrar and Deputy Director
Prepared by: Julia Soap, MPH Greg Crawford, BA
Reviewed by: Cathryn Savage, PhD Jamie Kim, MPH
Desktop Publishing by: Jeanne Jones, BA
Data for this report were collected by:
Office of Vital Statistics Kay Haug, Director
Our Vision – Healthy Kansans Living in Safe and Sustainable Environments Our Mission – To Protect and Improve the Health and Environment of All Kansans

Table of Contents
Page Number
Executive Summary ............................................................................. iii Introduction .......................................................................................... 1 Methodology ........................................................................................ 1 Results ................................................................................................. 4 Trend Analyses ............................................................................... 4 Five Year Characteristic Analysis ................................................... 6 Death Certificate Statistics ................................................... 6 Linked Birth/Infant Death Statistics ...................................... 8 Discussion ........................................................................................... 11 Limitations ............................................................................................ 13 References .......................................................................................... 14 Tables and Figures .............................................................................. 15 Technical Notes ................................................................................... 36 Appendix…………………………………………………………………… . 38 Certificates ........................................................................................... 40
i

List of Tables Table Page Number Number A Linked Birth/Infant Deaths, Percent Linked, Kansas, 2012-2016 ................................................................ 4 B Stillbirth, Perinatal Period lll, and Infant Mortality Rates by Selected Population Groups, Kansas, 2016 ........................... 5 C Infant Deaths by Selected Population Groups And Leading Causes of Death, Kansas, 2012-2016 ............... 7 1 Births, Stillbirths, and Infant Deaths by Year by Period of Death, Kansas, 1997-2016 ................................................................ 15 2 Perinatal/Infant Mortality Rates by Period of Death, Kansas, 1997-2016 ................................................................ 16 3 Infant Deaths and Mortality Rates by Selected Population Group of Mother, Kansas, 1997-2016 ............................................... 21 4 Infant Deaths and Mortality Rates by County of Residence and Peer Group, Kansas, 2012-2016 ............................................ 22 5 Infant Deaths by Cause of Death by Period of Death, Kansas, 2012-2016 ................................................................ 25 6 Infant Deaths by County of Residence by Period of Death, Kansas, 2012-2016.................................................................. 26 7 Stillbirths by Cause of Death by Weeks Gestation, Kansas, 2012-2016 .............................................................................. 29 8 Linked Infant Deaths by Cause of Death by Gestational Age, Kansas, 2012-2016 ........................................................ 31 9 Linked Infant Deaths by Birth Characteristics by Selected Population Groups of the Mother Kansas, 2012-2016 ................................................................ 32 10 Live Births by Birth Characteristics by Selected Population Groups of the Mother, Kansas, 2012-2016 ............................. 34
List of Figures Figure Page Number Number A Leading Causes of Infant Deaths, Kansas, 2012-2016 ................... 6
1 Infant Mortality Rates, Kansas, 1912-2016 ..................................... 17 2 Stillbirth Mortality Rates, Kansas, 1912-2016 .................................. 18 3 Trend in Infant Mortality Rates, Kansas, 1997-2016........................ 19 4 Five Year Average Infant Mortality Rates
by Population Group of Mother, Kansas, 1997-2016 .............. 20 5 Infant Deaths and Mortality (IM) Rates with 95% Confidence Intervals by Public Health Regions, Kansas, 2012-2016 ................................................................ 24
6 Five Year Average Infant Mortality Rates by Period of Death, Kansas, 1997-2016 ................................. 28
7 Five Year Average Perinatal Period III Mortality Rates by Period of Death, Kansas, 1997-2016 ................................. 30
ii
Executive Summary
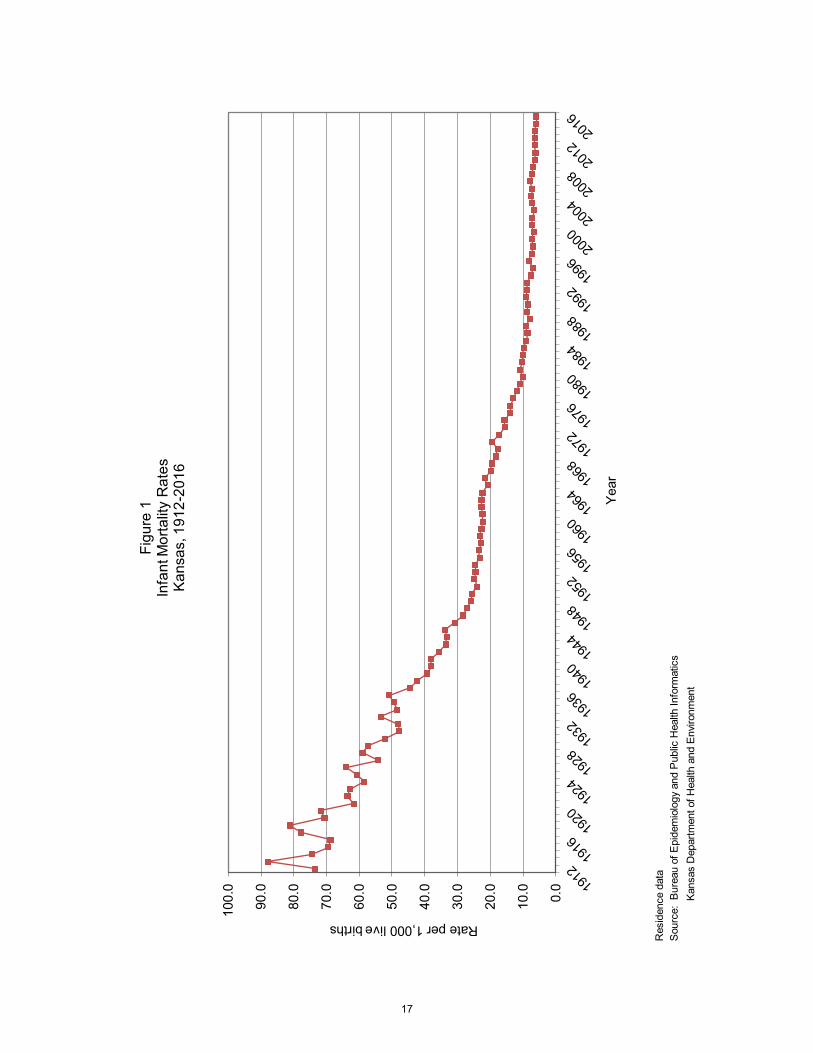
Infant mortality is an important indicator of community health. It is associated with a variety of factors such as economic development, general living conditions, social wellbeing where basic needs are met, rates of illness such as diabetes and hyper-tension, and quality of the environment. This report builds on information in the An-nual Summary of Vital Statistics, 2016 providing a long-term assessment of progress on infant mortality. The report uses five-year rolling average infant mortality to evalu-ate trends. In the last century, the Kansas infant mortality rate (IMR) has decreased dramati-cally, from 73.5 deaths per 1,000 live births in 1912 (2,795 infant deaths) to 5.9 in 2016 (223).
The Kansas IMR remained the same from 2015 (5.9 deaths per 1,000 live births) to 2016. The Kansas rate met the Healthy People 2020 (HP2020) ob-jective of 6.0 deaths per 1,000 live births. The White non-Hispanic population IMR (5.2) and the Hispanic IMR (5.1) met the HP2020 target while the Black non-Hispanic (15.2) rate did not.
The Black non-Hispanic infant mortality rate has remained more than twice that of the White non-Hispanic rate for most of the last 20 years.
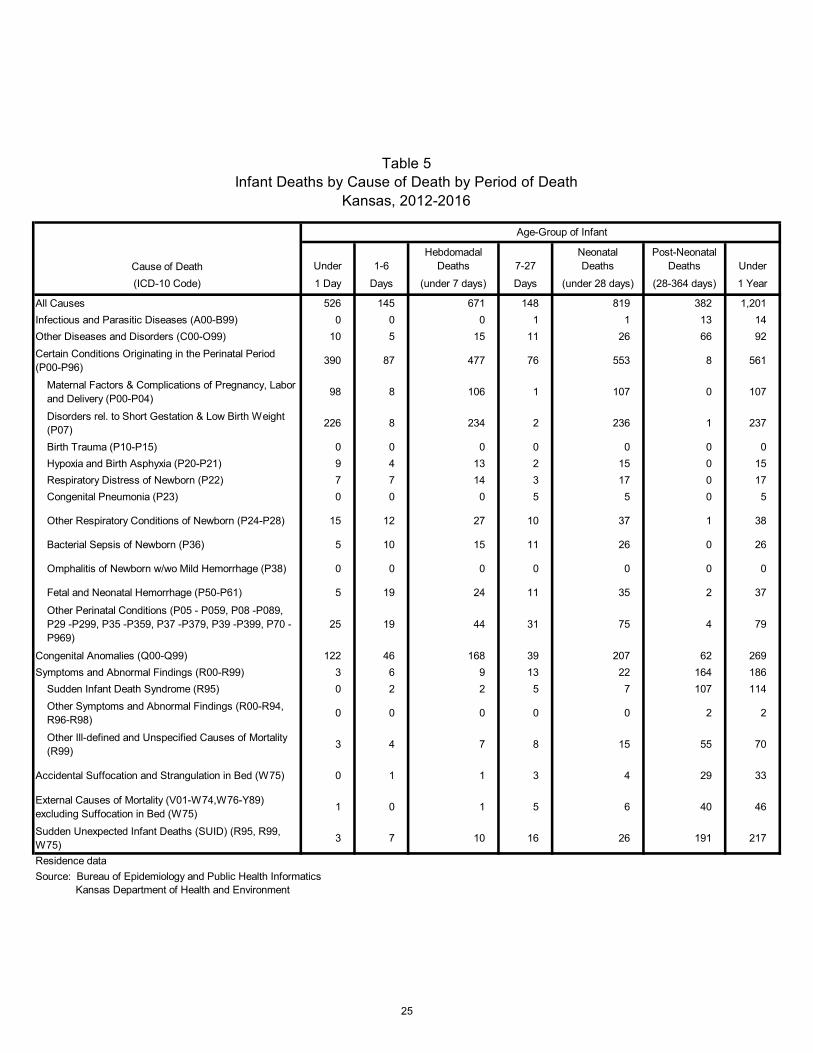
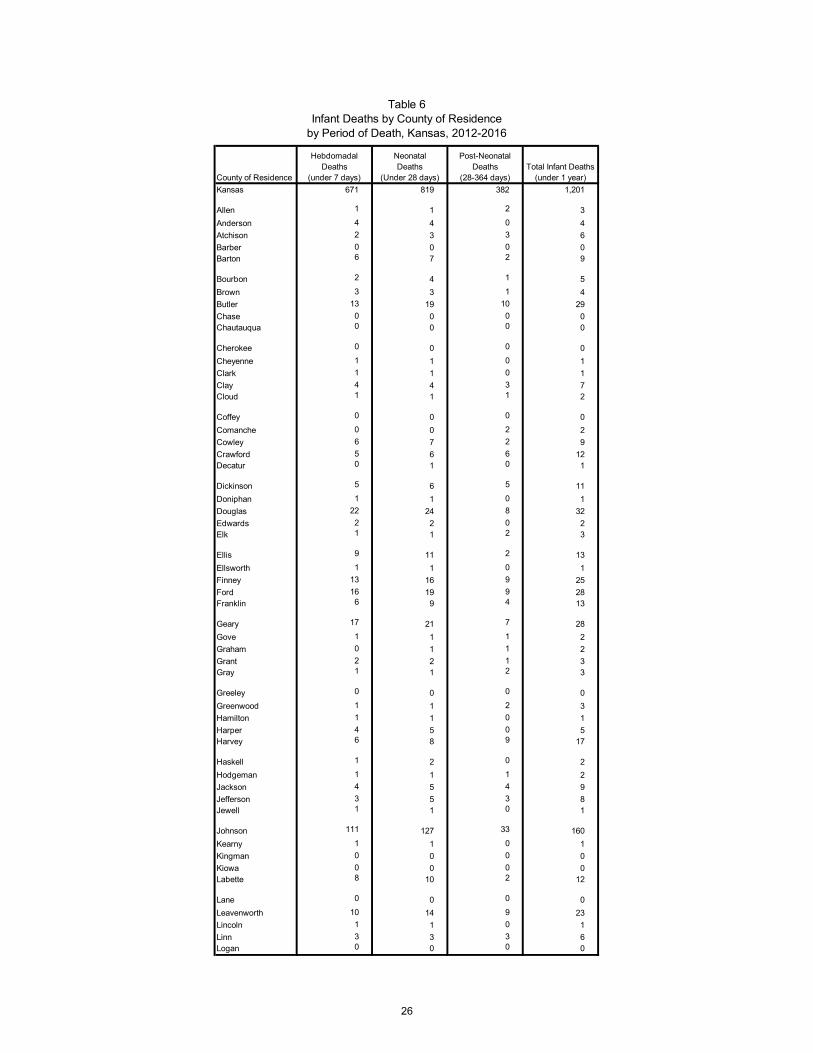
During 2012-2016, most Kansas resident infant deaths occurred soon after birth. Over two-thirds (68.2% or 819 deaths) happened in the neonatal time period (less than 28 days).
During 2012-2016, the leading cause of infant mortality was congenital anom-
alies (22.4%), followed by prematurity or low birth weight (19.7%), sudden un-expected infant death (SUID) causes (18.1%), and maternal factors and com-plications (8.9%).
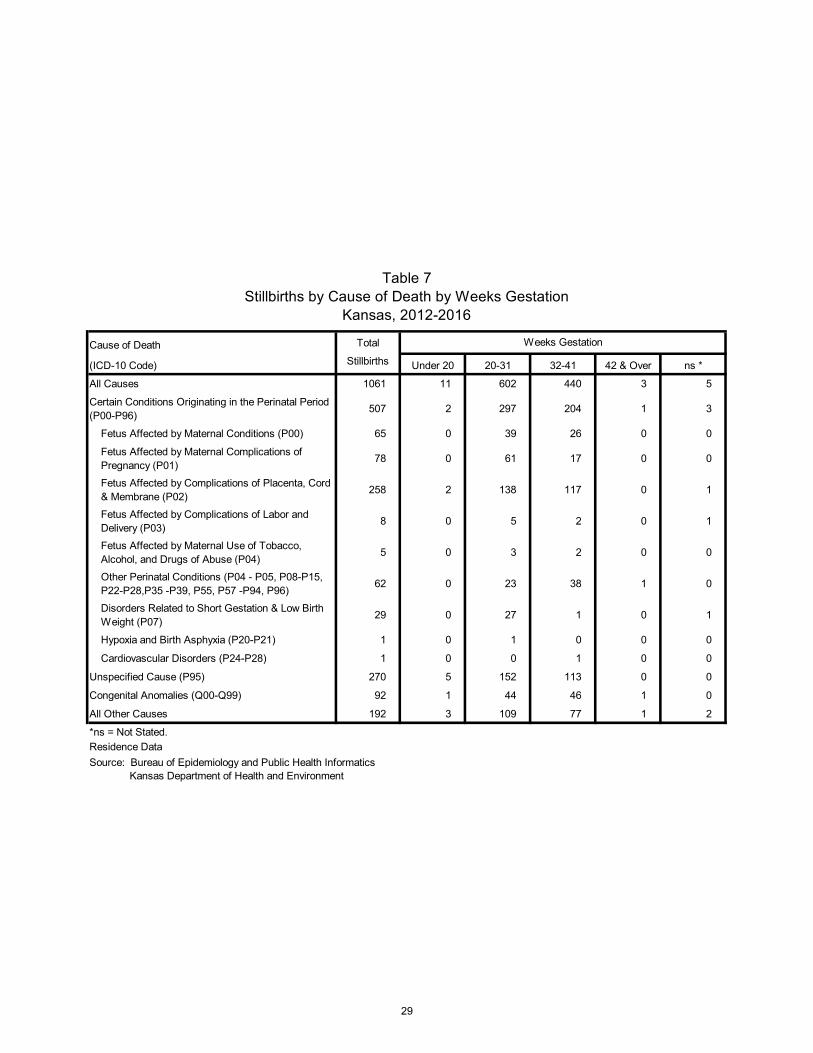
Perinatal deaths include stillbirths and hebdomadal deaths (less than seven days). Complications of placenta, umbilical cord, and membrane was the leading cause of stillbirths; Prematurity or low birthweight was the leading cause for hebdomadal deaths.
The 2012-2016 premature infant mortality rate of 43.0 per 1,000 live births
was over 17 times higher than the rate for infants born at term (2.5). The IMR for very premature infants was 198.9 deaths per 1,000 live births, 80 times higher than infants born at term.
The Selected Special Statistics, Stillbirths and Infant Deaths, Kansas, 2016 summa-rizes vital records data on stillbirths and infant deaths. This report can be found at http://www.kdheks.gov/phi/index.htm. Persons inquiring about additional data needs can call (785) 296-8627.
iii
Introduction One of the basic indicators of the health of a community or state is infant mortality, the death of an infant before one year of age. The calculated infant mortality rate (IMR), serves as one proxy indicator of population health. It reflects the apparent association between the causes of infant mortality and other factors that are likely to influence the health status of the whole population such as economic development, general living con-ditions, social wellbeing where basic needs are met, rates of illness such as diabetes and hypertension, and quality of the environment [1].
Nationally, for 2015 the most recent year with final death data, statistics showed the in-fant mortality rate was 5.9 per 1,000 live births. The leading causes of infant death were congenital malformations; prematurity or low birthweight; sudden infant death syndrome (SIDS); and maternal factors and complications of pregnancy, labor and delivery [2]. The most recent national linked birth/infant death data set (2011-2013 data) included statistics on characteristics collected with the birth certificate in addition to the death cer-tificate. Risk factors for infant death included Black non-Hispanic mothers, prematurity or low birthweight, multiple deliveries, unmarried mothers, mother’s age (both younger and older mothers), and no prenatal care [3]. Healthy People 2020 (HP2020), which provides science-based, 10-year national objec-tives for improving the health of all Americans, includes infant mortality as a leading health indicator. The HP2020 target is 6.0 infant deaths per 1,000 live births [4]. The Kansas Department of Health and Environment’s (KDHE) Bureau of Epidemiology and Public Health Informatics (BEPHI) monitors infant mortality and supports programs that promote access to health services for mothers and infants. The Bureau’s Division of Public Health Informatics calculates the official state infant mortality rate as part of its on-going mission to provide data and information to program managers, policy makers, health providers, and the public. This report augments information in the KDHE Annual Summary of Vital Statistics, 2016 [5] and moves beyond single-year statistics in order to provide more long-term estimates of the true underlying rates.
Methodology Statistics Due to small numbers of events, preselected intervals of years are combined to increase data reliability. Five years (2012-2016) are combined for characteristic analysis, and in-tervals of 20 years and approximately 100 years are used for trend analysis. The long-term (~100 years) infant mortality numbers and rates may be under-reported due to in-complete data collection in the early 1900s. Additionally, the relative standard error (RSE) is used in this report to evaluate reliability of rates. Values with a relative standard error of 30 percent or less are considered relia-ble. Values with a relative standard error greater than 30 percent but 50 percent or less
1

are considered unreliable, and rates with RSE greater than 50 percent have been sup-pressed in this document. This is consistent with standard National Center for Health Statistics (NCHS) practice [3, 6]. The following statistical tests have been applied where statistically significant differences have been noted in the document. When counts were ≥100, a normal distribution was assumed and the z-test was used to compare two infant mortality rates [3]. When counts were <100, a Poisson probability distribution was assumed and confidence intervals were calculated at the 95% confidence level to compare two infant mortality rates. If the confidence intervals of two values do not overlap it is considered a conservative esti-mate of a significant difference [10]. Caution should be used in interpreting these differ-ences due to the relatively small number of occurrences and yearly fluctuations. Poisson Joinpoint regression models were used for trend analysis, and the annual percent change (APC) was used to characterize the trend over time [7, 8, 9]. Statistical signifi-cance is considered at the 0.05 level. Five year rolling averages were used to smooth data trends over 20 years since year-to-year variation in infant mortality rates can result in a saw-tooth pattern that obscures un-derlying trends. Stillbirths are also included in this report. Stillbirth statistics represent the first full year of events reported under new requirements. In Kansas, a stillbirth is defined as complete expulsion or extraction from its mother of a human child the gestational age of which is not less than 20 completed weeks, resulting in other than a live birth, and which is not an induced termination of pregnancy. [11]. The new definition has resulted in more events being reported. These events may have risk factors similar to those for infant deaths. Rates for 2014, 2015, and 2016 are not comparable to prior years. All data reported are based on Kansas residence, unless otherwise noted.
Age Period of Death The first year of life can be categorized by two major periods, the neonatal period (first 27 days of life) and the post-neonatal period (28 to 364 days of life). The infant deaths occurring in the neonatal period are also further sub-divided into the hebdomadal deaths (0-6 days) and post-hebdomadal deaths (7-27 days). Perinatal period III includes still-births and hebdomadal deaths. Cause of Death Data The cause of death referred to in this report is the primary or underlying cause of death. It is defined as the disease or injury which initiated the chain of events leading directly to death, or the circumstances of the accident or violence which produced the fatal injury. The underlying causes of death are established through a system known as the Interna-tional Statistical Classification of Diseases and Related Health Problems,10th Revision (ICD-10) [12]. This system promotes uniformity and comparability in the collection and presentation of mortality data. In this document, Sudden Infant Death Syndrome (SIDS) deaths (ICD-10 code R95) are combined with accidental suffocation and strangulation in bed (ICD-10 code W75) and unknown cause (ICD-10 code R99) in some of the figures/tables. This combination is categorized as Sudden Unexpected Infant Death (SUID).
2
Analyzing SUID is important since the national campaign to reduce the risk of SIDS has entered a new phase and will now include all sleep-related SUIDs. SIDS, a major com-ponent of SUID, decreased by about 50 percent in the 1990s with the greatest decline occurring after the “Safe to Sleep” campaign was initiated in 1994 [13]. Since then, the decline in the SIDS rate has been less dramatic. The decline in SIDS is likely explained by increasing rates of infant deaths classified as “accidental suffocation and strangula-tion in bed” and “unknown cause“[3].
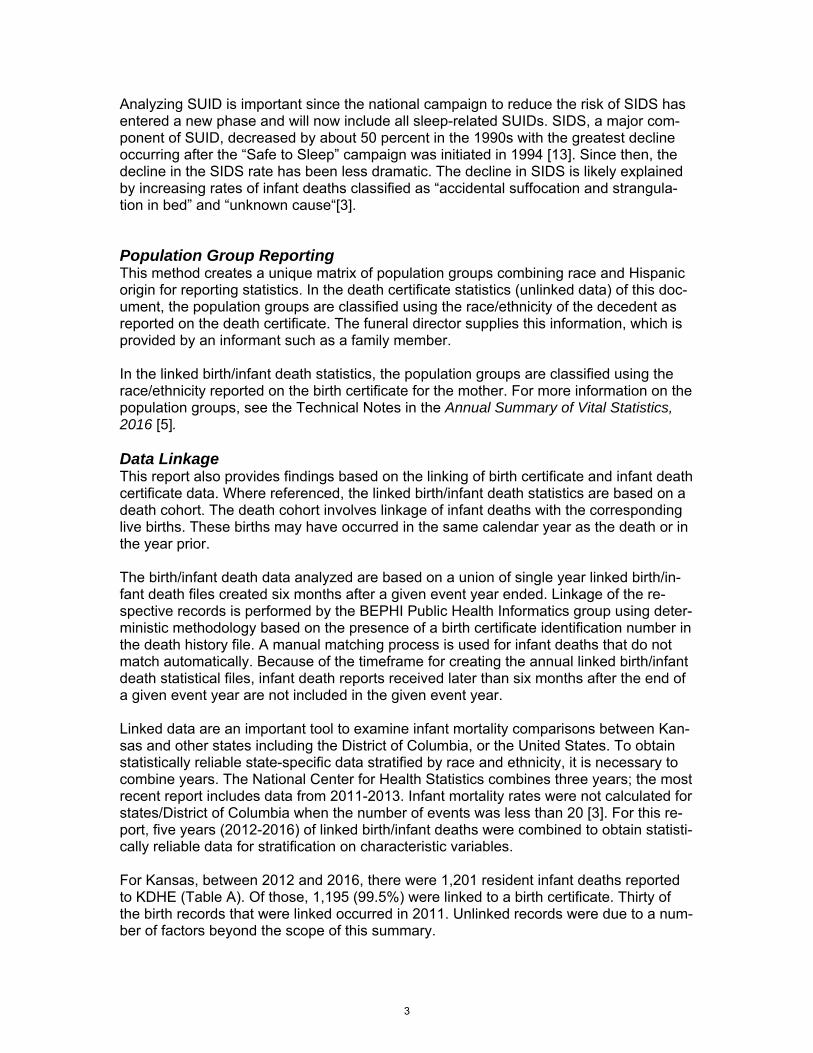
Population Group Reporting This method creates a unique matrix of population groups combining race and Hispanic origin for reporting statistics. In the death certificate statistics (unlinked data) of this doc-ument, the population groups are classified using the race/ethnicity of the decedent as reported on the death certificate. The funeral director supplies this information, which is provided by an informant such as a family member. In the linked birth/infant death statistics, the population groups are classified using the race/ethnicity reported on the birth certificate for the mother. For more information on the population groups, see the Technical Notes in the Annual Summary of Vital Statistics, 2016 [5]. Data Linkage This report also provides findings based on the linking of birth certificate and infant death certificate data. Where referenced, the linked birth/infant death statistics are based on a death cohort. The death cohort involves linkage of infant deaths with the corresponding live births. These births may have occurred in the same calendar year as the death or in the year prior. The birth/infant death data analyzed are based on a union of single year linked birth/in-fant death files created six months after a given event year ended. Linkage of the re-spective records is performed by the BEPHI Public Health Informatics group using deter-ministic methodology based on the presence of a birth certificate identification number in the death history file. A manual matching process is used for infant deaths that do not match automatically. Because of the timeframe for creating the annual linked birth/infant death statistical files, infant death reports received later than six months after the end of a given event year are not included in the given event year. Linked data are an important tool to examine infant mortality comparisons between Kan-sas and other states including the District of Columbia, or the United States. To obtain statistically reliable state-specific data stratified by race and ethnicity, it is necessary to combine years. The National Center for Health Statistics combines three years; the most recent report includes data from 2011-2013. Infant mortality rates were not calculated for states/District of Columbia when the number of events was less than 20 [3]. For this re-port, five years (2012-2016) of linked birth/infant deaths were combined to obtain statisti-cally reliable data for stratification on characteristic variables. For Kansas, between 2012 and 2016, there were 1,201 resident infant deaths reported to KDHE (Table A). Of those, 1,195 (99.5%) were linked to a birth certificate. Thirty of the birth records that were linked occurred in 2011. Unlinked records were due to a num-ber of factors beyond the scope of this summary.
3
This method of linking the infant death and their birth records is valuable for exploring the various relationships of the infant deaths with factors surrounding birth and with mother’s risk factors
The death file contains age at death and underlying cause. The birth file contains birthweight, gestational age, and information on the
mother such as age, marital status, educational level, and maternal risk factors such as tobacco use.
Results
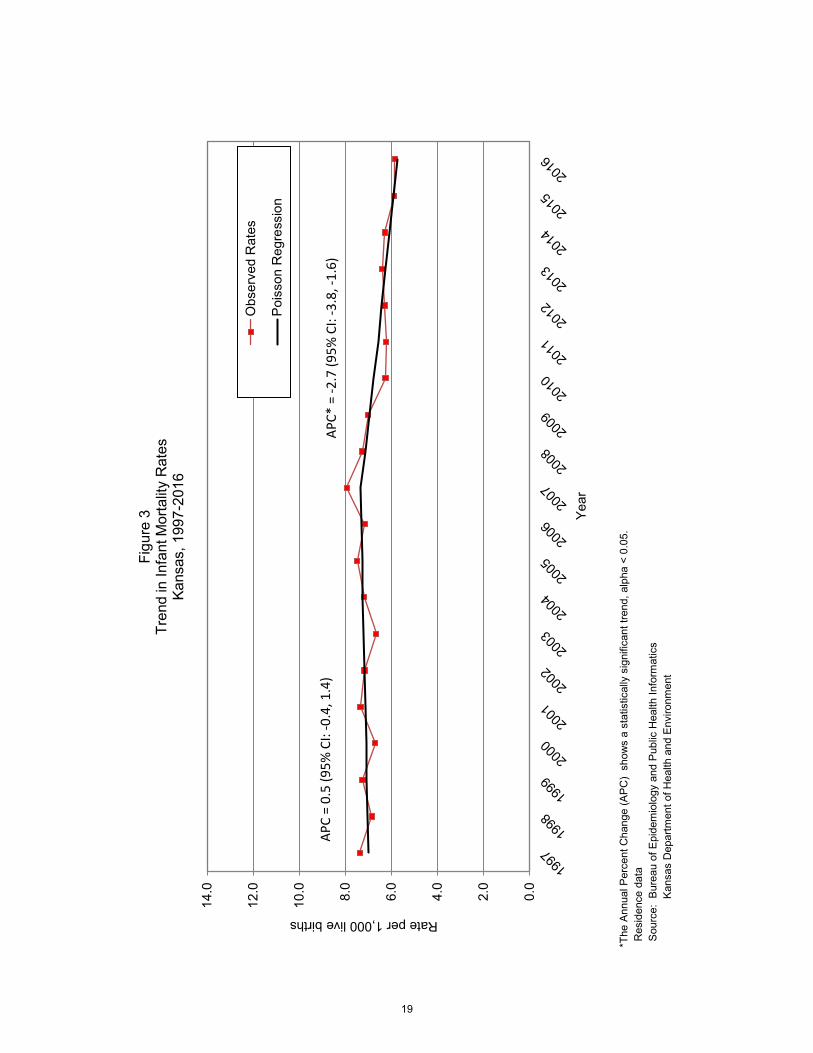
Trend Analyses In 2016, the Kansas infant mortality rate was 5.9 per 1,000 live births (223 infant deaths). This rate remained unchanged from 5.9 per 1,000 live births (230 infant deaths) in 2015 (Tables 1, 2). In the last century, the IMR has decreased dramatically (92.0%) from 73.5 deaths per 1,000 live births in 1912 (2,795 infant deaths) (Figure 1). Stillbirths decreased 77.6 per-cent from 26.8 stillbirths per 1,000 (live births + stillbirths) in 1912 (1,047 stillbirths) to 6.0 (237 stillbirths) in 2015 (Figure 2). Incomplete reporting of live births, infant deaths, and stillbirths in the early 1900s may have resulted in slightly higher or lower estimated mor-tality rates for those years. In the last twenty years, there has been some fluctuation in the IMR from a first low of 6.7 in 2003, then reaching a high of 7.9 in 2007, and an overall low of 5.9 in 2015 and 2016. According to the results of a Joinpoint Poisson regression model, the IMR re-mained stable at 0.5% per year [95% CI: -0.4, 1.4] during the period 1997-2007. How-ever, the IMR has continued to significantly decrease by 2.7% per year [95% CI: -3.8, -1.6%] since 2007 (Figure 3). Neonatal/Post-Neonatal Period Deaths Neonatal death rates showed a decreasing trend during the period from 1997 to 2016 with some fluctuation. Post-neonatal death rates showed a similar trend to the overall IMR trend. Post-neonatal death rates from 1997 to 2007 fluctuated greatly with no signif-icant trend; however, a significant decreasing trend was present from 2007-2016 (Table 2). For neonatal death rates, rolling five year averages showed a slight decrease in most years from 4.6 in 1997-2001 to 4.2 in 2012-2016. For post-neonatal death rates, rolling
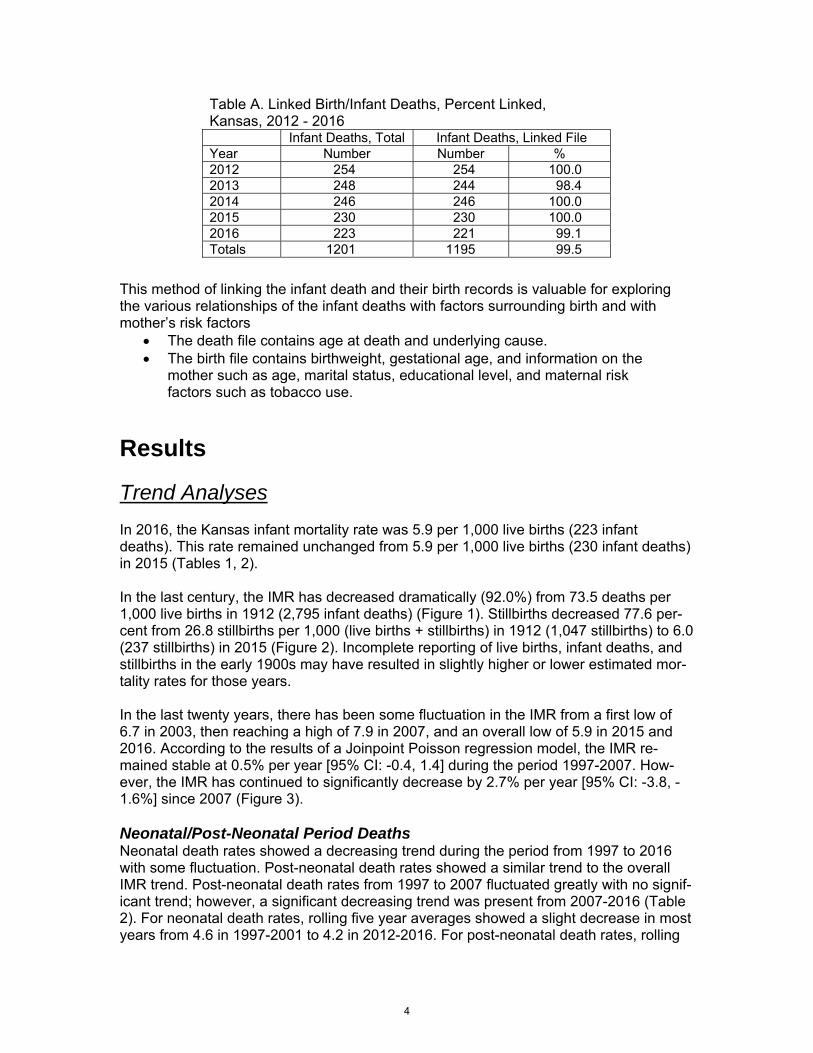
Table A. Linked Birth/Infant Deaths, Percent Linked, Kansas, 2012 - 2016 Infant Deaths, Total Infant Deaths, Linked File Year Number Number % 2012 254 254 100.0 2013 248 244 98.4 2014 246 246 100.0 2015 230 230 100.0 2016 223 221 99.1 Totals 1201 1195 99.5
4

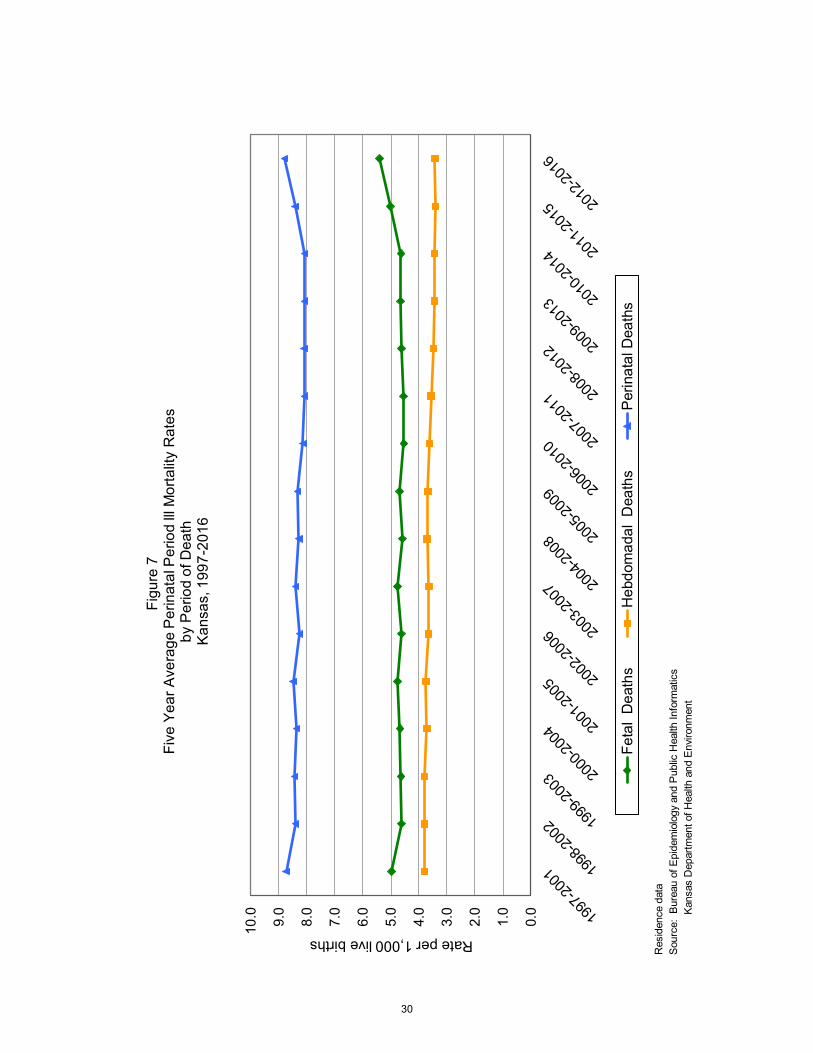
five year averages showed an overall decrease from 2.5 in 1997-2001 to a low of 2.0 in 2012-2016, with some fluctuation in the years between (Figure 6). Perinatal Period III Deaths In Kansas from 1997-2016, rolling five year averages showed a gradual increase in peri-natal death rates, with some fluctuation, increasing from 8.7 deaths per 1,000 live births in 1997-2001 to 8.8 in 2012-2016. The increase in perinatal death rates are largely due to an increase in stillbirth rates since 2014 (Figure 7). Population Groups For Kansas in 2016, the White non-Hispanic population group had the highest number of infant deaths (139 infant deaths), while the Black non-Hispanic group had the highest rate (15.2 per 1,000 live births) (Table 3). The disparity in rates between White and Black non-Hispanic infant deaths was evident in all periods of death (Table B).
A population group comparison over 20 years based on five year moving averages (Fig-ure 4) revealed that the Black non-Hispanic population has consistently had the highest infant mortality rates. The rate has fluctuated, reaching a high of 17.1 in 2003-2007 and a low of 12.8 in 2011-2015. In the same 20 years, the White non-Hispanic population showed a slight decreasing trend from 6.6 in 1997-2001 to 5.0 in 2012-2016. The IMR in the Hispanic population has fluctuated from 6.5 in 1997-2001 to 7.0 in 2012-2016. The Black non-Hispanic IMR has remained over twice that of the White non-Hispanic popula-tion, with an average ratio of 2.5.
Table B. Stillbirth, Perinatal Period lll* and Infant Mortality Rates by Selected Population Groups, Kansas, 2016
Total White non-Hispanic
Black non-Hispanic
Hispanic any race
Infant deaths † 5.9 5.2 15.2 5.1 Neonatal deaths † 3.8 3.3 9.6 3.8 Post neonatal deaths † 2.1 1.9 5.6 1.3 Stillbirths ‡ 6.7 5.3 15.4 8.3 Perinatal period lll ‡ 9.8 8.0 22.9 12.0 * Perinatal period lll includes stillbirths and hebdomadal deaths (deaths that occur prior to the 7th day of life) †Rate per 1,000 live births ‡Rate per 1,000 (live births + stillbirths)
5
Five Year Characteristic Analysis (2012-2016)
Death Certificate Statistics
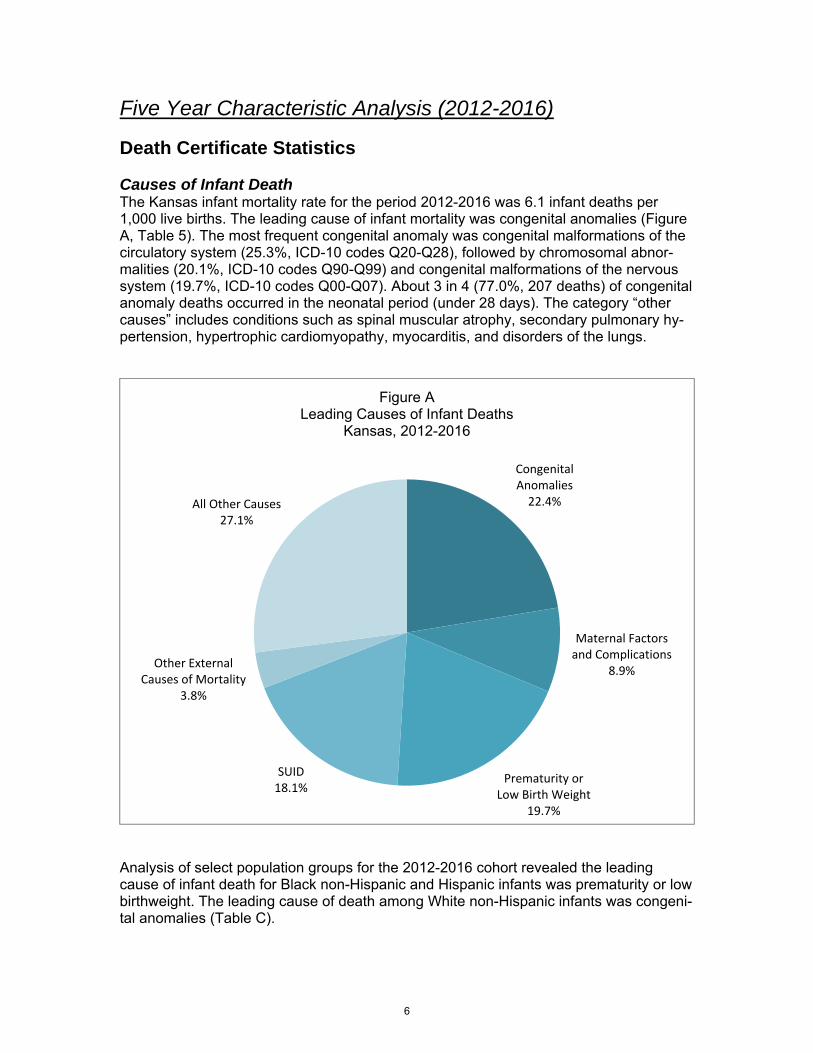
Causes of Infant Death The Kansas infant mortality rate for the period 2012-2016 was 6.1 infant deaths per 1,000 live births. The leading cause of infant mortality was congenital anomalies (Figure A, Table 5). The most frequent congenital anomaly was congenital malformations of the circulatory system (25.3%, ICD-10 codes Q20-Q28), followed by chromosomal abnor-malities (20.1%, ICD-10 codes Q90-Q99) and congenital malformations of the nervous system (19.7%, ICD-10 codes Q00-Q07). About 3 in 4 (77.0%, 207 deaths) of congenital anomaly deaths occurred in the neonatal period (under 28 days). The category “other causes” includes conditions such as spinal muscular atrophy, secondary pulmonary hy-pertension, hypertrophic cardiomyopathy, myocarditis, and disorders of the lungs.
Analysis of select population groups for the 2012-2016 cohort revealed the leading cause of infant death for Black non-Hispanic and Hispanic infants was prematurity or low birthweight. The leading cause of death among White non-Hispanic infants was congeni-tal anomalies (Table C).
CongenitalAnomalies22.4%
Maternal Factorsand Complications
8.9%
Prematurity orLow Birth Weight
19.7%
SUID18.1%
Other ExternalCauses of Mortality
3.8%
All Other Causes27.1%
Figure ALeading Causes of Infant Deaths
Kansas, 2012-2016
6
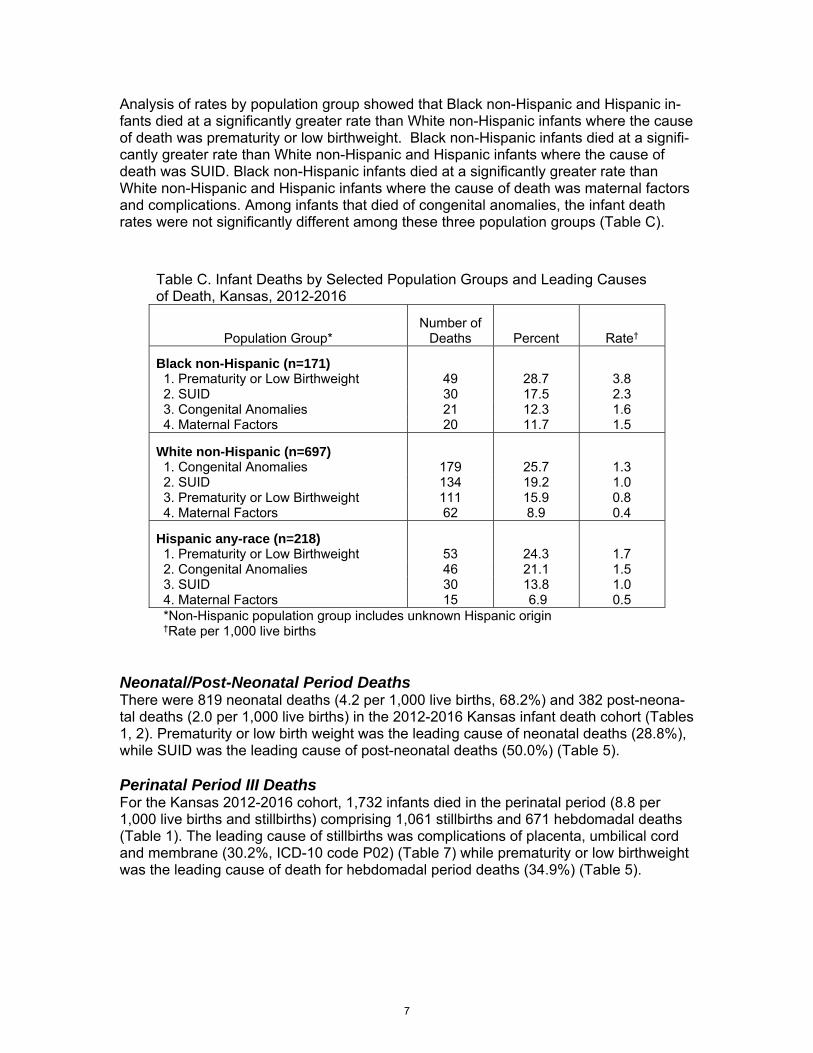
Analysis of rates by population group showed that Black non-Hispanic and Hispanic in-fants died at a significantly greater rate than White non-Hispanic infants where the cause of death was prematurity or low birthweight. Black non-Hispanic infants died at a signifi-cantly greater rate than White non-Hispanic and Hispanic infants where the cause of death was SUID. Black non-Hispanic infants died at a significantly greater rate than White non-Hispanic and Hispanic infants where the cause of death was maternal factors and complications. Among infants that died of congenital anomalies, the infant death rates were not significantly different among these three population groups (Table C).
Table C. Infant Deaths by Selected Population Groups and Leading Causes of Death, Kansas, 2012-2016
Population Group* Number of
Deaths Percent Rate†
Black non-Hispanic (n=171)
1. Prematurity or Low Birthweight 49 28.7 3.8 2. SUID 30 17.5 2.3 3. Congenital Anomalies 21 12.3 1.6 4. Maternal Factors 20 11.7 1.5
White non-Hispanic (n=697)
1. Congenital Anomalies 179 25.7 1.3 2. SUID 134 19.2 1.0 3. Prematurity or Low Birthweight 111 15.9 0.8 4. Maternal Factors 62 8.9 0.4
Hispanic any-race (n=218)
1. Prematurity or Low Birthweight 53 24.3 1.7 2. Congenital Anomalies 46 21.1 1.5 3. SUID 30 13.8 1.0 4. Maternal Factors 15 6.9 0.5 *Non-Hispanic population group includes unknown Hispanic origin †Rate per 1,000 live births
Neonatal/Post-Neonatal Period Deaths There were 819 neonatal deaths (4.2 per 1,000 live births, 68.2%) and 382 post-neona-tal deaths (2.0 per 1,000 live births) in the 2012-2016 Kansas infant death cohort (Tables 1, 2). Prematurity or low birth weight was the leading cause of neonatal deaths (28.8%), while SUID was the leading cause of post-neonatal deaths (50.0%) (Table 5). Perinatal Period III Deaths For the Kansas 2012-2016 cohort, 1,732 infants died in the perinatal period (8.8 per 1,000 live births and stillbirths) comprising 1,061 stillbirths and 671 hebdomadal deaths (Table 1). The leading cause of stillbirths was complications of placenta, umbilical cord and membrane (30.2%, ICD-10 code P02) (Table 7) while prematurity or low birthweight was the leading cause of death for hebdomadal period deaths (34.9%) (Table 5).
7
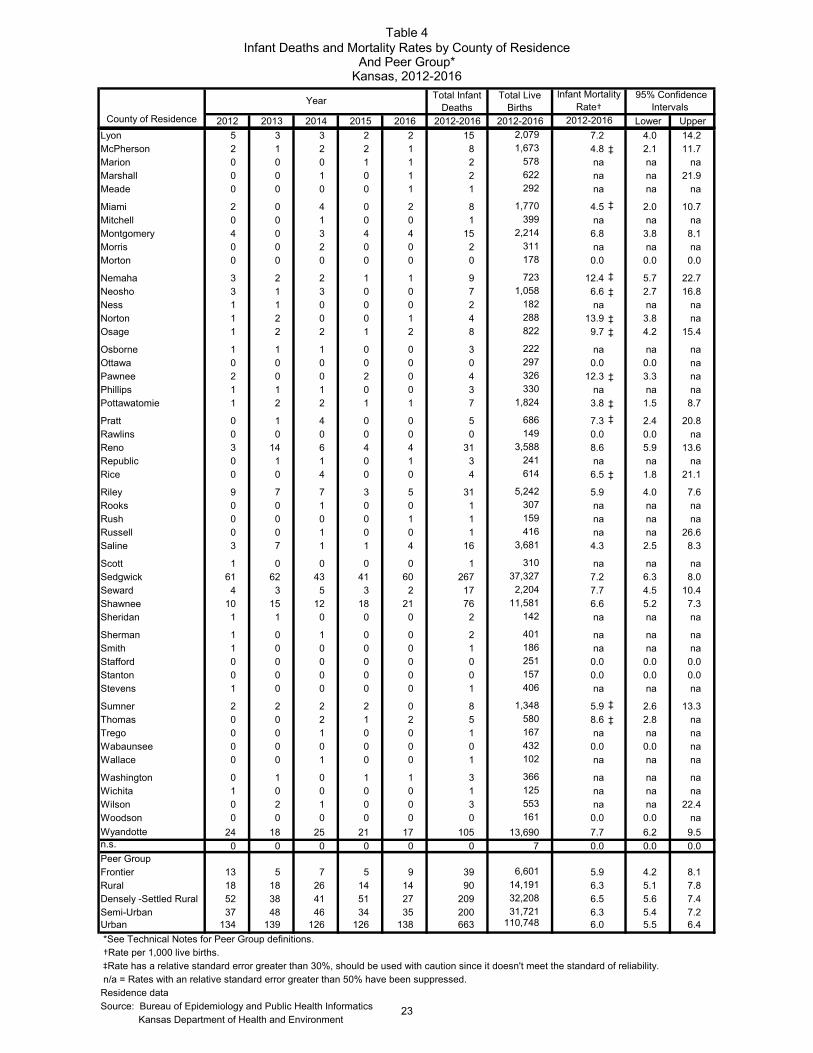
County Rates The counties with the highest number of infant deaths in the 2012-2016 cohort included Sedgwick (267 or 22.2%), Johnson (160 or 13.3%), Wyandotte (105 or 8.7%), and Shawnee (76 or 6.3%). These four counties accounted for half (50.6 percent) of all infant deaths (Table 4). The counties with the highest reliable (RSE ≤ 30%) infant mortality rates, included Labette (8.7 infant deaths per 1,000 live births), Reno (8.6), Ford (8.5), Franklin (8.2), and Harvey (8.0); while the counties with the lowest (reliable) non-zero rates were John-son (4.3), Saline (4.3), Leavenworth (4.7), Crawford (4.8), and Douglas (5.2). Among peer groups, the infant death rates were not significantly different among Frontier, Rural, Densely-Settled Rural, Semi-Urban, or Urban populations (Table 4). Since the number of deaths was too small for analysis in many counties, counties were combined into Public Health Regions (Figure 5). The region with the highest reliable (RSE ≤ 30%) infant mortality rate was the Southwest Surveillance Region at 8.1 per 1,000 live births. The region with the lowest infant mortality rate was the Central Kansas Region at 4.9 per 1,000 live births (Figure 5). Zip Code Rates Several zip codes had enough deaths to allow analysis on the 2012-2016 cohort. The zip codes with the highest reliable (RSE ≤ 30%) mortality rates included three zip codes located in Sedgwick County: 67218 (13.7 deaths per 1,000 live births), zip code 67042 (Butler County, 11.7), 67211 (11.7), 67207 (11.4), and zip code 66067 (Franklin County, 11.4). The zip-codes with the lowest reliable (RSE ≤ 30%) rates were 66062 (Johnson County, 3.0), 67401 (Saline County, 4.6), 66441 (Geary County, 4.6), 67203 (Sedgwick, 5.1), 66061 (Johnson County, 5.2).
Linked Birth/Infant Death Statistics
Kansas Statistics In this section, a variety of maternal and infant characteristics are presented on the linked birth and infant death data file (linked file) from 2012 to 2016. The linked file dif-fers slightly from the mortality file (infant deaths from death certificates in 2012 to 2016), with 6 infant deaths not linked to a birth record. The Kansas linked file for 2012-2016 contains 1,195 (99.5%) of the 1,201 infant deaths contained in the mortality file. Population group of the infant’s mother was known for 1,185 (99.2%) of the 1,195 linked records. The mother’s race was reported as White non-Hispanic in 693 live births (58.5%), Black non-Hispanic in 171 live births (14.4%), Native American non-Hispanic in 7 live births (0.6%), Asian or Pacific Islander non-Hispanic in 23 live births (1.9%), Multi-racial non-Hispanic in 62 live births (5.2%), other race non-Hispanic in 10 live births (0.8%), and Hispanic (all races) in 217 live births (18.3%). Cause of Death The leading cause of death among the 1,195 infants in the 2012-2016 linked file was congenital anomalies (269 deaths, 22.5%). This was followed by prematurity or low birth-weight (237 deaths, 19.8%), SUID (ICD-10 codes R95, R99, and W75, with combined 213 deaths, 17.8%), and maternal factors (107 deaths, 9.0%) (Table 8).
8

Prematurity is an important factor in infant death, even though short gestation and low birthweight may not be the primary cause. Among the infant deaths with primary cause of death as congenital anomalies, slightly over half (52.8%) were born preterm – primar-ily late preterm (24.7%). Ninety-one percent of the infant deaths due to maternal factors were born prematurely, with 84.9 percent born very premature (Table 8). The cause of death categorized as maternal factors and complications of pregnancy, labor and deliv-ery include complications such as premature rupture of the membrane, placental separa-tion, chorioamnionitis, and incompetent cervix. Among infants where the cause of death was classified as SUID, 74.5 percent were born early term or later (Table 8). Birthweight Of the 1,195 linked records, birthweight of the infant was known for 1,189 (99.5%). Two hundred seventy (22.7%) of the deaths occurred to infants with birthweights of less than 500 grams; 302 (25.4%) of the deaths occurred to infants with birthweights of 500 to 1,499 grams; 194 (16.3%) of deaths occurred to infants with birthweights of 1,500 to 2,499 grams; and 423 (35.6%) of deaths occurred to infants with birthweights of 2,500 grams or more (Table 9). Among the infant deaths where birthweight was known, 766 infants (64.4%) were low birthweight (less than 2500 grams). In the same time period (2012-2016), only 7.2 per-cent of all live births had low birthweight (Table 9,10). Analysis of birthweight by mother’s population group reveals 67 (39.2%) of the deaths occurred to Black Non-Hispanic infants with birthweights of less than 500 grams. Two hundred sixty-seven (38.8%) deaths occurred to White Non-Hispanic and 72 (33.2%) Hispanic infants with birthweights 2,500 grams or more (Table 9). Gestational Age Gestational age was known for 1,187 (99.3%) of the 1,195 linked records. Five hundred sixty-nine of the infants (47.9%) were very premature (less than 32 weeks), 57 (4.8%) were moderately premature (32 to 33 weeks), 122 (10.3%) were late premature (34 to 36 weeks), 190 (16.0%) were early term (37 and 38 weeks), and 249 (21.0%) were born at term (Table 9). Among the infant deaths where gestational age was known, 766 (64.4%) of the infant deaths were premature (less than 37 weeks gestation) (Table 9). In the same time pe-riod (2012-2016), 8.6% of all live births were premature (Table 10). Analysis of gestational age by mother’s population group reveals that among the Black non-Hispanic population in 2012 through 2016, 71.9 percent of the infant deaths were premature; 60.4 percent of the infant deaths to White non-Hispanic mothers were prem-ature, and among the Hispanic population, 65.7 percent were premature (Table 9). In the same period (2012-2016), 12.8 percent of all live births among Black Non-Hispanic mothers were premature, 8.6 percent of all live births among White Non-Hispanic moth-ers were premature, and among the Hispanic population, 8.2 percent of all live births were premature (Table 10).
9

Plurality Birth plurality (the total number of births resulting from a single pregnancy) was known for 1,193 of the linked deaths. Eighty-six percent (86.3%) of the infants were singletons at birth (1,029), 12.7 percent (152) were part of twin deliveries, and 1.0 percent (12) were triplet or above deliveries. Thirteen percent (13.7%, 164 deaths) of infant deaths in the linked file occurred among multiple births, whereas for all live births in the same time period (2012-2016) only 3.4 percent were part of a multiple birth delivery (Table 9, 10). Mother’s Age Group Age-group of the mother was known for 1,192 (99.8%) of the infant deaths. The highest percentage of deaths occurred to infants born to women aged 25-29 (31.1%), followed by women aged 20-24 (28.7%), women aged 30-34 (19.7%), and women aged 35-39 (9.6%) (Table 9). The highest percent of all live births in the same time period was to mothers 25-29 years of age (32.9%), followed by 30-34 years of age (27.6%) and 20-24 years of age (22.2%) (Table 10). Mother’s Education For mothers 25 years of age and older, the education level was known for 730 (61.1%) of the linked deaths. Mothers whose education level was high school or GED had the highest percentage of infant deaths (24.4%), followed by those with some college but no degree (21.9%), and those with a Bachelor’s Degree (19.9%). Mothers who have a doc-torate degree had the lowest percent (1.4%) of infant deaths (Table 9). When comparing to the distribution of deaths by mothers’ education level for the live births in the same time period (2012-2016), there was a higher percentage of mothers with a Bachelor’s Degree (29.9%) and a lower percentage of mothers with a high school degree or GED (16.0%) (Table 10). Marital Status Marital status at the time of pregnancy was known for 1,187 (99.3%) of the linked deaths (2012-2016). In almost half (49.9%) of the infant deaths, the mother was not married at the time of her pregnancy or delivery (Table 9). This is compared with 36.3 percent of live births (2012-2016) where the mother reported she was not married (Table 10). Prenatal Care The month prenatal care began was known for 1,143 (95.6%) of the linked infant deaths. Seventy-two percent (72.8%) of these linked infant deaths started prenatal care in the first trimester. Eighty percent (80.1%) of all live births in the same time period (2012-2016) started prenatal care in the first trimester. Five percent (5.7%) of linked infant deaths had no prenatal care (65 infant deaths); however, only 0.8 percent of births had no prenatal care, resulting in a mortality rate among infants with no prenatal care at 39.7 deaths per 1,000 live births. Infants starting prenatal care in the second trimester also had a statistically significantly higher IMR (6.9) than infants starting prenatal care in the first trimester (5.3) (Tables 9, 10).
10

Adequacy of Prenatal Care Utilization (APNCU) Index The APNCU index was known for 1,123 (94.0%) linked records. Of these where APNCU index was known, almost half (59.7%) had Adequate Plus prenatal care, 26.7% had Ad-equate, 5.7% had Intermediate and 17.9% had Inadequate prenatal care. Inadequate prenatal care was more common for infants in the linked birth/infant death dataset (17.9%) than for live births generally (11.1%). Adequate or better prenatal care was less common for infants in the linked birth/infant death dataset (76.4%) than for live births generally (82.7%), but Adequate Plus prenatal care was much more common for infants in the linked birth/infant death dataset (49.7%) than for live births generally (30.4%) (Ta-bles 9, 10). Smoking Smoking status was reported in all 1,195 of the linked infant deaths. Mothers reported smoking at some time during pregnancy in 21.1 percent of the infant deaths compared with 11.9 percent of all live births from 2012 to 2016 (Tables 9, 10). Pay Source Delivery payer was known for 1,173 of linked infant deaths. The highest percent of these births were paid for by Medicaid (44.5%), followed by private insurance (42.7%), and self-pay (7.8%) (Table 9). For all live births in the 2012-2016 cohort with payer indicated, only 32.4 percent were paid for by Medicaid, and 54.0 percent were paid for by private insurance (Table 10). The infant mortality rate was 8.3 per 1,000 live births paid by Medi-caid and 6.7 per 1,000 live births self-paid, significantly higher than 4.8 per 1,000 live births paid by private insurance.
National Statistics Nationally, final birth and death data allows for the creation of the linked birth/infant death data set for the United States. From the most recently published report on linked infant death/birth statistics (2013 period), the infant mortality rate for the United States was 6.0 per 1,000 live births, which compares to 6.3 for Kansas residents for the same year [3]. This report combines the years 2011-2013 for analysis of birth characteristics such as race and ethnicity. The national infant mortality rate was 6.0 per 1,000 live births for this three year period; White non-Hispanic infant mortality was 5.1, Black non-His-panic infant mortality was 11.3, and Hispanic infant mortality was 5.1 [3].The same meth-odology used for these national statistics was used for Kansas 2011-2013 and the re-sults can be found in Selected Special Statistics, Stillbirths and Infant Deaths, Kansas, 2013 [14].
Discussion
Kansas Statistics In a little over a century, the Kansas IMR has decreased dramatically, from 73.5 deaths per 1,000 live births in 1912 to 5.9 in 2016. In the last twenty years, the overall decreas-ing trend of the IMR was statistically significant even with the fluctuations in this time pe-riod.
11
The IMR in Kansas in 2016 is at a historic low of 5.9, and meets the Healthy People 2020 objective of 6.0 deaths per 1,000 live births. Data analysis by population groups showed the White non-Hispanic population (5.2 per 1,000 live births) and the Hispanic population (7.6) met the HP2020 target, but the Black non-Hispanic population (15.2) did not [4]. Overall, in Kansas 2012-2016, 22.4 percent of infant deaths were attributed to congenital anomalies, 19.7 percent were attributed to prematurity or low birthweight, and 18.1 per-cent were attributed to SUID (Figure A). Black non-Hispanics and Hispanics were at an increased risk of infant death from prematurity. Black non-Hispanics were at an in-creased risk of infant death from SUID and maternal factors compared to White non-His-panics and Hispanics (Table C). Most infant deaths in Kansas in 2012 to 2016 occurred soon after birth. Two-thirds hap-pened in the neonatal time period (less than 28 days of age), and over half occurred in the first week (Table 5). Risk Factors Analysis of the linked file revealed that low birthweight or prematurity were primary risk factors for infant death even when the underlying or primary cause of death was not prematurity or low birthweight. Gestational age-specific analysis (linked file) showed an infant mortality rate of 43.0 per 1,000 live births for infants born prematurely, over 17 times that for infants born at term (2.5 deaths per 1,000 live births). Similarly, the infant mortality rate for very premature infants (less than 32 weeks, 198.9 per 1,000 live births) was 80 times higher than the rate for infants born at term. Additional notable risk factors for infant deaths (linked file) included no prenatal care (5.7% of linked deaths) or second trimester prenatal care (18.7%), multiple births (13.7%), mothers who smoked during pregnancy (20.6% of infant deaths), and out-of-wedlock births (49.5%).
National Statistics Comparing Kansas, other states, and national statistics on infant mortality is complicated by the fact that national statistics are published much later than state statistics. The most recent available final national birth and death data are for 2015 [2, 15]. Final results indi-cate a national infant mortality rate of 5.9 per 1,000 live births, compared to 5.9 for Kan-sas residents in 2015. The difference between these two rates is not statistically signifi-cant. The most recently published national report that analyzed linked infant mortality used 2011-2013 data. Nationally, the infant mortality rate was 6.0 per 1,000 live births for this period [3]. This report also presents the national and state infant mortality rates by race and Hispanic origin. The Kansas rates remain higher than the national rates for Black Non-Hispanic and Hispanic population subgroups [3].
12
Limitations This report’s findings are subject to several limitations. An important concern is the issue of receiving vital events from other states within the KDHE reporting deadline. Vital sta-tistics are gathered on an occurrence basis but are traditionally reported on a residence basis. For complete residence statistics, reports must be received from other states for events occurring to Kansas residents. Because of delays or other late reporting, some out-of-state vital event reports have not been received by KDHE by the cutoff date of June 30 of the year following the event year. Past evaluations indicate that over 99 per-cent of all vital events to Kansas residents are received before the cutoff date. Evaluation of the linked birth/infant death cohort is subject to limitations due to the inabil-ity to link all deaths to a corresponding birth report. This inability may be due to a num-ber of reasons related to receipt of the corresponding record from another state, name differences between the two reports, both events not occurring in Kansas, or residency changes. Additionally, comparison of Kansas linked data to other state or national data has limita-tions due to the timeliness of the national reports as well as differences in methodology. As mentioned earlier, out-of-state births may not be available to match infant deaths at the state level, but are available for matching at the national level. The ICD-10 death classification system limits the bias of human coding of mortality infor-mation. The system also attempts to reduce the effect of spelling errors or placement of literal information in the cause of death fields. One limitation is the system's inability to take into account differences in knowledge and attitudes among physicians who com-plete the cause of death information. Individual biases, unfamiliarity with the patient, or inability to perform an autopsy may affect the information available to the physician when certifying the cause of death. While many death certificates contain four full lines of de-tailed information on the events or illnesses leading up to the death, some death certifi-cates contain only limited information. The causes of stillbirths are not as well documented as those of infant deaths. The American Congress of Obstetricians and Gynecologists recommends an increase in the percentage of stillbirths for which placental evaluation is performed and autopsy is of-fered [16]. Additionally, since KSA 65-2401 [11] was revised in mid-2014 to change the stillbirth reporting requirements from weight of the fetus (>350 grams) to length of gesta-tion (≥ 20 weeks), vital records data for this year may not represent a consistent picture of all fetal deaths. Smoking status and other potential risk factors may be under-reported on birth certifi-cates.
13
References 1. Reidpath D, Allotey P. Infant mortality rate as an indicator of population health. J. Epidemiol
Community Health. 2003; 57:344-346. 2. Murphy SL, Xu J, Kochanek, KD, Curtin SC, Arias E. Deaths: Final data for 2015 [Internet].
Hyattsville (MD): National Center for Health Statistics. 2017 Nov [cited 12 Dec 2017]; 66(6). Available from https://www.cdc.gov/nchs/data/nvsr/nvsr66/nvsr66_06.pdf
3. Mathews TJ, MacDorman MF, Thoma ME. Infant mortality statistics from the 2013 period linked birth/infant death data set [Internet]. Hyattsville (MD): National Center for Health Sta-tistics. 2015 Aug 06 [cited 22 Dec 2016]; 64(9). Available from: https://www.cdc.gov/nchs/data/nvsr/nvsr64/nvsr64_09.pdf
4. U.S. Department of Health & Human Services [Internet]. Washington (DC): [cited 2016 Dec 22]. HealthyPeople.Gov: Maternal, Infant, and Child Health. Available from http://www.healthypeople.gov/2020/topicsobjectives2020/overview.aspx?topicid=26
5. Oakley D, Crawford G, Savage C. Kansas Annual Summary of Vital Statistics, 2015. Kansas Department of Health and Environment. 2016 [cited 2016 Dec 22].
6. Cohen RA, Martinez ME. Consumer-directed health care for persons under 65 years of age with private health insurance: United States, 2007 [Internet]. Hyattsville (MD): National Cen-ter for Health Statistics. 2009 March [cited 2012 Oct 22]; NCHS data brief (15). Available from http://www.cdc.gov/nchs/data/databriefs/db15.pdf
7. National Cancer Institute. Joinpoint regression program [Internet]. Bethesda (MD): [updated 2016 Apr, 8; cited 2016 Dec 22]. Available from http://surveillance.cancer.gov/joinpoint/
8. National Cancer Institute [Internet]. Bethesda (MD): Average annual percent change (AAPC). 2010 [cited 2014 Nov 14]. Available from https://surveillance.cancer.gov/help/join-point/setting-parameters/advanced-tab/average-annual-percent-change-aapc
9. Trend Analysis for MCH Outcomes. Atlanta (GA): Association of Maternal & Child Health Programs Data Training Workshop. 2008 [cited 2014 Oct 27]. Available from http://www.amchp.org/programsandtopics/data-assessment/Project%20Areas/MCH-EPI-TRAININGS/atlanta-2008/Documents/Forms/AllItems.aspx
10. Washington State Health Department [Internet]. Olympia (WA): Guidelines for using confi-dence intervals for public health assessment. 2012 [cited 2012 Oct 22]. Available from http://www.doh.wa.gov/Portals/1/Documents/5500/ConfIntGuide.pdf
11. Kansas Statutes. Chapter 65: Public Health. Article 24: Uniform Vital Statistics Act. Chapter 65 (July 1, 1995). Available from http://www.kslegislature.org/li_2012/b2011_12/statute/065_000_0000_chap-ter/065_024_0000_article/
12. International Statistical Classification of Diseases and Related Health Problems. Tenth Revi-sion. World Health Organization, Geneva 1992. [citedcited 2014 Oct 27].
13. Safe to Sleep [Internet]. Rockville (MD): National Institute of Child Health and Human Devel-opment 2014 [cited 2014 Nov 14]. Available from http://www.nichd.nih.gov/sts/Pages/de-fault.aspx
14. Oakley, D, Crawford G. Selected Special Statistics, Stillbirths and Infant Deaths, Kansas, 2014. Kansas Department of Health and Environment. 2015 [cited 2016 Dec 22].
15. Hamilton BE, Martin JA, Osterman MJK, et al. Births: Final data for 2015 [Internet]. Hyatts-ville (MD): National Center for Health Statistics. Jan 2017 2015 Dec [cited 2017 Dec 12]; 66(11). Available from https://www.cdc.gov/nchs/data/nvsr/nvsr66/nvsr66_01.pdf
16. ACOG issues new guidelines on managing stillbirths [Internet]. Washington (DC): The Amer-ican Congress of Obstetricians and Gynecologists. 2009 Feb 20 [cited 2014 Nov 18]. Availa-ble from http://www.acog.org/About-ACOG/News-Room/News-Releases/2009/ACOG-Is-sues-New-Guidelines-on-Managing-Stillbirths
14

Tota
l *Li
veH
ebdo
mad
al †
Per
inat
al ‡
Neo
nata
l §P
ostn
eona
tal ¶
Infa
nt #
Yea
rD
eliv
erie
sB
irths
Stil
lbirt
hD
eath
sD
eath
sD
eath
sD
eath
s D
eath
s
1997
37,3
9337
,191
202
147
349
173
101
274
1998
38,5
7138
,372
199
132
331
172
9126
319
9938
,923
38,7
4817
515
933
418
992
281
2000
39,8
3139
,654
177
146
323
174
9226
620
0139
,041
38,8
3220
914
835
717
810
728
520
0239
,484
39,3
3814
615
530
119
290
282
2003
39,5
5939
,353
206
138
344
177
8526
220
0439
,739
39,5
5318
614
433
017
610
828
420
0539
,895
39,7
0119
415
334
719
610
129
720
0641
,088
40,8
9619
213
732
917
611
729
320
0742
,137
41,9
5118
616
334
921
112
233
320
0841
,997
41,8
1518
216
034
219
311
030
320
0941
,601
41,3
8821
314
435
717
611
429
020
1040
,607
40,4
3916
814
331
117
083
253
2011
39,8
1639
,628
188
121
309
157
9024
720
1240
,499
40,3
0419
514
233
717
381
254
2013
38,9
7838
,805
173
140
313
166
8224
820
1439
,394
39,1
9320
113
833
917
571
246
2015
39,3
6339
,126
237
132
369
160
7023
020
1638
,303
38,0
4825
511
937
414
578
223
Res
iden
ce d
ata
Sou
rce:
Bur
eau
of E
pide
mio
logy
and
Pub
lic H
ealth
Info
rmat
ics
Kan
sas
Dep
artm
ent o
f Hea
lth a
nd E
nviro
nmen
t
Tabl
e 1
Birth
s, S
tillb
irths
, and
Infa
nt D
eath
s by
Yea
r by
Perio
d of
Dea
th
Kans
as, 1
997-
2016
¶P
ostn
eona
tal D
eath
s =
Dea
ths
betw
een
28 d
ays
and
1 ye
ar o
f age
.#I
nfan
t Dea
ths
= D
eath
s un
der 1
yea
r of a
ge.
*Tot
al D
eliv
erie
s =
Live
Birt
hs +
Stil
lbirt
hs.
†Heb
dom
adal
Dea
ths
= D
eath
s at
less
than
7 d
ays
of a
ge.
‡Per
inat
al D
eath
s =
Stil
lbirt
hs +
Heb
dom
adal
Dea
ths.
§Neo
nata
l Dea
ths
= D
eath
s at
less
than
28
days
of a
ge.
15

Hebdomadal Perinatal PostneonatalYear Stillbirth* Deaths† Deaths* KS US Deaths† KS US1997 5.4 4.0 9.3 4.7 4.8 2.7 7.4 7.21998 5.2 3.4 8.6 4.5 4.8 2.4 6.9 7.21999 4.5 4.1 8.6 4.9 4.7 2.4 7.3 7.12000 4.4 3.7 8.1 4.4 4.6 2.3 6.7 6.92001 5.4 3.8 9.1 4.6 4.5 2.8 7.3 6.92002 3.7 3.9 7.6 4.9 4.7 2.3 7.2 7.02003 5.2 3.5 8.7 4.5 4.6 2.2 6.7 6.92004 4.7 0.1 8.3 4.4 4.5 2.7 7.2 6.82005 4.9 3.9 8.7 4.9 4.5 2.5 7.5 6.92006 4.7 3.3 8.0 4.3 4.5 2.9 7.2 6.72007 4.4 3.9 8.3 5.0 4.4 2.9 7.9 6.82008 4.3 3.8 8.1 4.6 4.3 2.6 7.2 6.62009 5.1 3.5 8.6 4.3 4.2 2.8 7.0 6.42010 4.1 3.5 7.7 4.2 4.1 2.1 6.3 6.22011 4.7 3.1 7.8 4.0 4.1 2.3 6.2 6.12012 4.8 3.5 8.3 4.3 4.0 2.0 6.3 6.02013 4.4 3.6 8.0 4.3 4.0 2.1 6.4 6.02014 5.1 3.5 8.6 4.5 3.9 1.8 6.3 5.82015 6.0 3.4 9.4 4.1 3.9 1.8 5.9 5.92016 6.7 3.1 9.8 3.8 n.a. 2.1 5.9 n.a.
n.a. = US final death data for 2016 are not yet availableResidence data Source: Bureau of Epidemiology and Public Health Informatics Kansas Department of Health and Environment
†Per 1,000 live births.*Per 1,000 (live births + stillbirths).
Table 2Perinatal/Infant Mortality Rates by Period of Death
Kansas, 1997-2016
Neonatal Deaths † Infant Deaths†
16
IMR
19
12
- 2
01
6Y
ear
1912
1913
1914
1915
1916
1917
1918
1919
1920
1921
1922
1923
1924
1925
Res
iden
ce d
ata
Sou
rce:
Bur
eau
of E
pide
mio
logy
and
Pub
lic H
ealth
Info
rmat
ics
Kan
sas
Dep
artm
ent o
f Hea
lth a
nd E
nviro
nmen
t
0.0
10.0
20.0
30.0
40.0
50.0
60.0
70.0
80.0
90.0
100.
0
Rate per 1,000 live births
Yea
r
Figu
re 1
Infa
nt M
orta
lity
Rat
esK
ansa
s, 1
912-
2016
17

Ye
ar
1912
1913
1914
1915
1916
1917
1918
1919
1920
1921
1922
1923
1924
1925
1926
1927
1928
1929
1930
1931
1932
1933
1934
1935
1936
1937
1938
1939
1940
1941
Res
iden
ce d
ata
Sou
rce:
Bur
eau
of E
pide
mio
logy
and
Pub
lic H
ealth
Info
rmat
ics
Kan
sas
Dep
artm
ent o
f Hea
lth a
nd E
nviro
nmen
t
*
Stil
lbirt
h de
finiti
on c
hang
ed in
Jul
y 20
14. S
ee p
age
13.
0.0
5.0
10.0
15.0
20.0
25.0
30.0
35.0
40.0
Rate per 1,000 live Births and stillbirths
Year
Figu
re 2
Stillb
irth
Mor
talit
y R
ates
*Ka
nsas
, 191
2-20
16
18
*
The
Ann
ual P
erce
nt C
hang
e (A
PC
) sh
ows
a st
atis
tical
ly s
igni
fican
t tre
nd, a
lpha
< 0
.05.
Res
iden
ce d
ata
Sou
rce:
Bur
eau
of E
pide
mio
logy
and
Pub
lic H
ealth
Info
rmat
ics
Kan
sas
Dep
artm
ent o
f Hea
lth a
nd E
nviro
nmen
t
0.0
2.0
4.0
6.0
8.0
10.0
12.0
14.0
Rate per 1,000 live births
Year
Figu
re 3
Tren
d in
Infa
nt M
orta
lity
Rat
esKa
nsas
, 199
7-20
16
Obs
erve
d R
ates
Poi
sson
Reg
ress
ion
AP
C =
0.5
(9
5%
CI:
-0
.4, 1
.4)
AP
C*
= -
2.7
(9
5%
CI:
-3
.8, -
1.6
)
19

Res
iden
ce d
ata
Sou
rce:
Bur
eau
of E
pide
mio
logy
and
Pub
lic H
ealth
Info
rmat
ics
Kan
sas
Dep
artm
ent o
f Hea
lth a
nd E
nviro
nmen
t
0.0
2.5
5.0
7.5
10.0
12.5
15.0
17.5
20.0
Rate per 1,000 live birthsFi
gure
4Fi
ve Y
ear A
vera
ge In
fant
Mor
talit
y R
ates
by
Pop
ulat
ion
Gro
up o
f Mot
her
Kans
as, 1
997-
2016
Whi
te N
on-H
ispa
nic
Blac
k N
on-H
ispa
nic
His
pani
c (a
ny ra
ce)
20

Bla
ck N
H‡
toTo
tal I
nfan
tLi
ve I
nfan
t
Live
Infa
ntW
hite
NH
‡ Li
veIn
fant
Mor
talit
yY
ear
Birt
hsD
eath
sR
ate
Birt
hs D
eath
sR
ate
Rat
io o
f Rat
esB
irths
Dea
ths
Rat
e R
ate
1997
29,6
5918
96.
42,
766
4616
.62.
63,
525
298.
27.
419
9830
,389
209
6.9
2,74
627
9.8
1.4
3,87
325
6.5
6.9
1999
30,3
6221
57.
12,
815
4214
.92.
14,
204
153.
67.
320
0030
,538
192
6.3
2,82
233
11.7
1.9
4,74
232
6.7
6.7
2001
29,7
0319
06.
42,
745
5419
.73.
14,
875
367.
47.
320
0229
,811
187
6.3
2,84
544
15.5
2.5
5,00
640
8.0
7.2
2003
29,4
8217
25.
82,
730
4014
.72.
55,
417
458.
36.
720
0429
,624
200
6.8
2,78
246
16.5
2.4
5,45
828
5.1
7.2
2005
28,9
0318
16.
32,
670
4516
.92.
76,
073
528.
67.
520
0629
,392
181
6.2
2,80
149
17.5
2.8
6,56
841
6.2
7.2
2007
30,1
7020
56.
82,
856
5619
.62.
96,
676
568.
47.
920
0829
,863
184
6.2
2,93
639
13.3
2.2
6,78
157
8.4
7.2
2009
29,4
7117
86.
02,
830
4415
.52.
66,
790
405.
97.
020
1029
,000
142
4.9
2,78
033
11.9
2.4
6,40
750
7.8
6.3
2011
28,3
8215
05.
32,
708
3512
.92.
46,
293
426.
76.
220
1228
,995
145
5.0
2,68
238
14.2
2.8
6,28
654
8.6
6.3
2013
27,8
2113
74.
92,
549
3915
.33.
16,
139
447.
26.
420
1428
,009
146
5.2
2,62
929
11.0
2.1
6,12
940
6.5
6.3
2015
27,7
1713
04.
72,
585
2710
.42.
26,
290
487.
65.
920
1626
,786
139
5.2
2,49
438
15.2
2.9
6,30
032
5.1
5.9
Res
iden
ce d
ata
Sou
rce:
Bur
eau
of E
pide
mio
logy
and
Pub
lic H
ealth
Info
rmat
ics
Kan
sas
Dep
artm
ent o
f Hea
lth a
nd E
nviro
nmen
t
§ O
ther
non
-His
pani
c da
ta is
not
incl
uded
in th
is ta
ble
due
to s
mal
l num
bers
but
is a
vaila
ble
upon
requ
est.
Tabl
e 3
Infa
nt D
eath
s an
d M
orta
lity
Rat
es*
By S
elec
ted
Popu
latio
n G
roup
of M
othe
r§Ka
nsas
, 199
7-20
16W
hite
Non
-His
pani
c†B
lack
Non
-His
pani
c†
† D
ue to
cha
nges
in th
e co
llect
ion
of th
e ra
ce it
em o
n ce
rtific
ates
, use
cau
tion
w
hen
com
parin
g 20
05-2
015
data
to p
rior y
ears
. See
Tec
hnic
al N
otes
.
His
pani
c A
ny R
ace
* R
ate
per 1
,000
live
birt
hs.
‡ N
H =
non
-His
pani
c, p
opul
atio
n gr
oup
incl
udes
unk
now
n H
ispa
nic
orig
in.
21

Total Infant Deaths
Total Live Births
2012 2013 2014 2015 2016 2012-2016 2012-2016 Lower UpperKansas 254 248 246 230 223 1,201 195,476 6.1 5.8 6.5Allen 1 0 1 1 0 3 735 na na naAnderson 0 2 1 1 0 4 478 8.4 ‡ 2.3 21.4Atchison 2 1 0 2 1 6 1,011 5.9 ‡ 2.2 12.9Barber 0 0 0 0 0 0 304 0.0 0.0 0.0Barton 2 1 3 3 0 9 1,784 5.0 ‡ 2.3 9.6
Bourbon 2 0 0 2 1 5 1,054 4.7 ‡ 1.5 11.1Brown 1 1 1 0 1 4 639 6.3 ‡ 1.7 16.0Butler 3 6 9 8 3 29 3,802 7.6 5.1 11.0Chase 0 0 0 0 0 0 138 0.0 0.0 0.0Chautauqua 0 0 0 0 0 0 176 0.0 0.0 0.0
Cherokee 0 0 0 0 0 0 1,154 0.0 0.0 0.0Cheyenne 1 0 0 0 0 1 161 na ‡ na naClark 0 0 1 0 0 1 117 na ‡ na naClay 1 1 0 3 2 7 524 13.4 ‡ 5.4 27.5Cloud 1 0 0 0 1 2 558 na na na
Coffey 0 0 0 0 0 0 434 0.0 0.0 0.0Comanche 0 0 0 1 1 2 102 na na naCowley 1 4 2 2 0 9 2,213 4.1 ‡ 1.9 7.7Crawford 3 3 1 1 4 12 2,499 4.8 2.5 8.4Decatur 1 0 0 0 0 1 171 na na na
Dickinson 4 2 2 1 2 11 1,106 9.9 ‡ 5.0 17.8Doniphan 0 0 0 1 0 1 400 na na naDouglas 6 5 7 6 8 32 6,201 5.2 3.5 7.3Edwards 2 0 0 0 0 2 170 na na naElk 0 1 0 0 2 3 143 na na na
Ellis 2 1 3 4 3 13 1,823 7.1 3.8 12.2Ellsworth 1 0 0 0 0 1 302 na na naFinney 7 6 3 7 2 25 3,429 7.3 4.7 10.8Ford 7 5 4 9 3 28 3,312 8.5 5.6 12.2Franklin 3 1 5 2 2 13 1,587 8.2 4.4 14.0
Geary 4 6 7 8 3 28 5,226 5.4 3.6 7.7Gove 1 0 0 0 1 2 179 na na naGraham 1 0 1 0 0 2 118 na na naGrant 2 0 0 1 0 3 611 na na naGray 0 2 0 1 0 3 438 na na na
Greeley 0 0 0 0 0 0 94 0.0 0.0 0.0Greenwood 1 1 0 1 0 3 323 na na naHamilton 0 0 0 0 1 1 192 na na naHarper 0 2 3 0 0 5 380 13.2 ‡ 4.3 30.7Harvey 3 4 3 3 4 17 2,112 8.0 4.7 12.9
Haskell 1 0 0 0 1 2 270 na na naHodgeman 0 0 0 1 1 2 111 na na naJackson 2 0 1 3 3 9 844 10.7 ‡ 4.9 20.2Jefferson 2 2 1 3 0 8 954 8.4 ‡ 3.6 16.5Jewell 0 0 0 0 1 1 158 na na na
Johnson 31 34 34 35 26 160 37,029 4.3 3.6 5.0Kearny 0 0 0 1 0 1 304 na na naKingman 0 0 0 0 0 0 415 0.0 0.0 0.0Kiowa 0 0 0 0 0 0 173 0.0 0.0 0.0Labette 2 2 2 2 4 12 1,381 8.7 4.5 15.2
Lane 0 0 0 0 0 0 93 0.0 0.0 0.0Leavenworth 2 5 5 5 6 23 4,920 4.7 3.0 7.0Lincoln 0 0 0 1 0 1 157 na na naLinn 2 0 1 2 1 6 503 11.9 ‡ 4.4 26.0Logan 0 0 0 0 0 0 197 0.0 0.0 0.0
Table 4Infant Deaths and Mortality Rates by County of Residence
And Peer Group*Kansas, 2012-2016
YearInfant Mortality
Rate†
95% Confidence Intervals
County of Residence 2012-2016
22
Total Infant Deaths
Total Live Births
2012 2013 2014 2015 2016 2012-2016 2012-2016 Lower Upper
Table 4Infant Deaths and Mortality Rates by County of Residence
And Peer Group*Kansas, 2012-2016
YearInfant Mortality
Rate†
95% Confidence Intervals
County of Residence 2012-2016Lyon 5 3 3 2 2 15 2,079 7.2 4.0 14.2McPherson 2 1 2 2 1 8 1,673 4.8 ‡ 2.1 11.7Marion 0 0 0 1 1 2 578 na na naMarshall 0 0 1 0 1 2 622 na na 21.9Meade 0 0 0 0 1 1 292 na na na
Miami 2 0 4 0 2 8 1,770 4.5 ‡ 2.0 10.7Mitchell 0 0 1 0 0 1 399 na na naMontgomery 4 0 3 4 4 15 2,214 6.8 3.8 8.1Morris 0 0 2 0 0 2 311 na na naMorton 0 0 0 0 0 0 178 0.0 0.0 0.0
Nemaha 3 2 2 1 1 9 723 12.4 ‡ 5.7 22.7Neosho 3 1 3 0 0 7 1,058 6.6 ‡ 2.7 16.8Ness 1 1 0 0 0 2 182 na na naNorton 1 2 0 0 1 4 288 13.9 ‡ 3.8 naOsage 1 2 2 1 2 8 822 9.7 ‡ 4.2 15.4
Osborne 1 1 1 0 0 3 222 na na naOttawa 0 0 0 0 0 0 297 0.0 0.0 naPawnee 2 0 0 2 0 4 326 12.3 ‡ 3.3 naPhillips 1 1 1 0 0 3 330 na na naPottawatomie 1 2 2 1 1 7 1,824 3.8 ‡ 1.5 8.7
Pratt 0 1 4 0 0 5 686 7.3 ‡ 2.4 20.8Rawlins 0 0 0 0 0 0 149 0.0 0.0 naReno 3 14 6 4 4 31 3,588 8.6 5.9 13.6Republic 0 1 1 0 1 3 241 na na naRice 0 0 4 0 0 4 614 6.5 ‡ 1.8 21.1
Riley 9 7 7 3 5 31 5,242 5.9 4.0 7.6Rooks 0 0 1 0 0 1 307 na na naRush 0 0 0 0 1 1 159 na na naRussell 0 0 1 0 0 1 416 na na 26.6Saline 3 7 1 1 4 16 3,681 4.3 2.5 8.3
Scott 1 0 0 0 0 1 310 na na naSedgwick 61 62 43 41 60 267 37,327 7.2 6.3 8.0Seward 4 3 5 3 2 17 2,204 7.7 4.5 10.4Shawnee 10 15 12 18 21 76 11,581 6.6 5.2 7.3Sheridan 1 1 0 0 0 2 142 na na na
Sherman 1 0 1 0 0 2 401 na na naSmith 1 0 0 0 0 1 186 na na naStafford 0 0 0 0 0 0 251 0.0 0.0 0.0Stanton 0 0 0 0 0 0 157 0.0 0.0 0.0Stevens 1 0 0 0 0 1 406 na na na
Sumner 2 2 2 2 0 8 1,348 5.9 ‡ 2.6 13.3Thomas 0 0 2 1 2 5 580 8.6 ‡ 2.8 naTrego 0 0 1 0 0 1 167 na na naWabaunsee 0 0 0 0 0 0 432 0.0 0.0 naWallace 0 0 1 0 0 1 102 na na na
Washington 0 1 0 1 1 3 366 na na naWichita 1 0 0 0 0 1 125 na na naWilson 0 2 1 0 0 3 553 na na 22.4Woodson 0 0 0 0 0 0 161 0.0 0.0 naWyandotte 24 18 25 21 17 105 13,690 7.7 6.2 9.5n.s. 0 0 0 0 0 0 7 0.0 0.0 0.0Peer GroupFrontier 13 5 7 5 9 39 6,601 5.9 4.2 8.1Rural 18 18 26 14 14 90 14,191 6.3 5.1 7.8Densely -Settled Rural 52 38 41 51 27 209 32,208 6.5 5.6 7.4Semi-Urban 37 48 46 34 35 200 31,721 6.3 5.4 7.2Urban 134 139 126 126 138 663 110,748 6.0 5.5 6.4 *See Technical Notes for Peer Group definitions.
Source: Bureau of Epidemiology and Public Health Informatics Kansas Department of Health and Environment
Residence data n/a = Rates with an relative standard error greater than 50% have been suppressed. ‡Rate has a relative standard error greater than 30%, should be used with caution since it doesn't meet the standard of reliability. †Rate per 1,000 live births.
23

50
817
Dea
ths
8.1/
1,00
0 (4
.7 1
2.9)
50
735
Dea
ths
7.1/
1,00
0 (4
.9, 9
.9)
50
911
5 D
eath
s6.
9/1,
000
(5.6
, 8.1
)
50
652
Dea
ths
5.7
/1,0
00 (4
.2, 7
.4)
51
212
Dea
ths
4.9/
1,00
0 (2
.6, 8
.6)
50
536
3 D
eath
s7.
1/1,
000
(6.4
, 7.9
)
50
241
Dea
ths
6.7/
1,00
0 (4
.8, 9
.1)
50
433
4 D
eath
s5.
2/1,
000
(4.6
, 5.8
)
51
766
Dea
ths
5.4/
1,00
0 (4
.2, 6
.8)
50
141
Dea
ths
4.9/
1,00
0 (3
.5, 6
.7)
Ka
nsa
s P
ub
lic
He
alt
h R
eg
ion
s
501
-Cen
tral K
ansa
s 50
2 -E
C C
oalit
ion
504
-KC
Met
ro50
5 -
KS
SC
Met
ro50
6 -L
ower
8 o
f SE
KS
50
7 -N
C K
S P
ub H
ealth
Initi
ativ
e 50
8 -N
orth
wes
t BT
Reg
ion
509
-Nor
thea
st C
orne
r51
1 -S
C C
oalit
ion
512
–S
EK
513
-SW
KS
Hea
lth In
itiat
ive
514
-SW
Sur
veilla
nce
515
-W
C P
ub H
ealth
Initi
ativ
e51
6 -W
este
rn P
yram
id51
7 –
Wild
cat
Figu
re 5
Infa
nt D
eath
s an
d M
orta
lity
(IM) R
ates
* with
95%
Con
fiden
ce In
terv
als
by P
ublic
Hea
lth R
egio
ns, 2
012-
2016 Kan
sas
5 Yr
. IM
Rat
e, 6
.1/1
,000
(5.
8, 6
.5)
*Rat
e pe
r 1,0
00 li
ve b
irths
†Num
bers
too
smal
l to
cal
cula
te ra
tes
(Rel
ativ
e St
anda
rd E
rror
> 3
0), s
ee m
etho
dolo
gy s
ectio
nR
esid
ence
dat
a So
urce
: Bu
reau
of E
pide
mio
logy
and
Pub
lic H
ealth
Info
rmat
ics,
Kan
sas
Dep
artm
ent o
f Hea
lth a
nd E
nviro
nmen
t
24
Under 1-6Hebdomadal
Deaths 7-27Neonatal Deaths
Post-Neonatal Deaths Under
(ICD-10 Code) 1 Day Days (under 7 days) Days (under 28 days) (28-364 days) 1 Year
All Causes 526 145 671 148 819 382 1,201 Infectious and Parasitic Diseases (A00-B99) 0 0 0 1 1 13 14Other Diseases and Disorders (C00-O99) 10 5 15 11 26 66 92Certain Conditions Originating in the Perinatal Period (P00-P96)
390 87 477 76 553 8 561
Maternal Factors & Complications of Pregnancy, Labor and Delivery (P00-P04)
98 8 106 1 107 0 107
Disorders rel. to Short Gestation & Low Birth Weight (P07)
226 8 234 2 236 1 237
Birth Trauma (P10-P15) 0 0 0 0 0 0 0Hypoxia and Birth Asphyxia (P20-P21) 9 4 13 2 15 0 15Respiratory Distress of Newborn (P22) 7 7 14 3 17 0 17Congenital Pneumonia (P23) 0 0 0 5 5 0 5
Other Respiratory Conditions of Newborn (P24-P28) 15 12 27 10 37 1 38
Bacterial Sepsis of Newborn (P36) 5 10 15 11 26 0 26
Omphalitis of Newborn w/wo Mild Hemorrhage (P38) 0 0 0 0 0 0 0
Fetal and Neonatal Hemorrhage (P50-P61) 5 19 24 11 35 2 37
Other Perinatal Conditions (P05 - P059, P08 -P089, P29 -P299, P35 -P359, P37 -P379, P39 -P399, P70 -P969)
25 19 44 31 75 4 79
Congenital Anomalies (Q00-Q99) 122 46 168 39 207 62 269Symptoms and Abnormal Findings (R00-R99) 3 6 9 13 22 164 186
Sudden Infant Death Syndrome (R95) 0 2 2 5 7 107 114Other Symptoms and Abnormal Findings (R00-R94, R96-R98)
0 0 0 0 0 2 2
Other Ill-defined and Unspecified Causes of Mortality (R99)
3 4 7 8 15 55 70
Accidental Suffocation and Strangulation in Bed (W75) 0 1 1 3 4 29 33
External Causes of Mortality (V01-W74,W76-Y89) excluding Suffocation in Bed (W75)
1 0 1 5 6 40 46
Sudden Unexpected Infant Deaths (SUID) (R95, R99, W75)
3 7 10 16 26 191 217
Residence data Source: Bureau of Epidemiology and Public Health Informatics Kansas Department of Health and Environment
Table 5Infant Deaths by Cause of Death by Period of Death
Kansas, 2012-2016
Age-Group of Infant
Cause of Death
25
Kansas 671 819 382 1,201
Allen 1 1 2 3Anderson 4 4 0 4Atchison 2 3 3 6Barber 0 0 0 0Barton 6 7 2 9
Bourbon 2 4 1 5Brown 3 3 1 4Butler 13 19 10 29Chase 0 0 0 0Chautauqua 0 0 0 0
Cherokee 0 0 0 0Cheyenne 1 1 0 1Clark 1 1 0 1Clay 4 4 3 7Cloud 1 1 1 2
Coffey 0 0 0 0Comanche 0 0 2 2Cowley 6 7 2 9Crawford 5 6 6 12Decatur 0 1 0 1
Dickinson 5 6 5 11Doniphan 1 1 0 1Douglas 22 24 8 32Edwards 2 2 0 2Elk 1 1 2 3
Ellis 9 11 2 13Ellsworth 1 1 0 1Finney 13 16 9 25Ford 16 19 9 28Franklin 6 9 4 13
Geary 17 21 7 28Gove 1 1 1 2Graham 0 1 1 2Grant 2 2 1 3Gray 1 1 2 3
Greeley 0 0 0 0Greenwood 1 1 2 3Hamilton 1 1 0 1Harper 4 5 0 5Harvey 6 8 9 17
Haskell 1 2 0 2Hodgeman 1 1 1 2Jackson 4 5 4 9Jefferson 3 5 3 8Jewell 1 1 0 1
Johnson 111 127 33 160Kearny 1 1 0 1Kingman 0 0 0 0Kiowa 0 0 0 0Labette 8 10 2 12
Lane 0 0 0 0Leavenworth 10 14 9 23Lincoln 1 1 0 1Linn 3 3 3 6Logan 0 0 0 0
by Period of Death, Kansas, 2012-2016
Table 6Infant Deaths by County of Residence
Hebdomadal Deaths
(under 7 days)
Neonatal Deaths
(Under 28 days)
Post-Neonatal Deaths
(28-364 days)Total Infant Deaths
(under 1 year)County of Residence
26

by Period of Death, Kansas, 2012-2016
Table 6Infant Deaths by County of Residence
Hebdomadal Deaths
(under 7 days)
Neonatal Deaths
(Under 28 days)
Post-Neonatal Deaths
(28-364 days)Total Infant Deaths
(under 1 year)County of ResidenceLyon 9 10 5 15McPherson 5 7 1 8Marion 0 0 2 2Marshall 2 2 0 2Meade 1 1 0 1
Miami 4 6 2 8Mitchell 1 1 0 1Montgomery 8 10 5 15Morris 2 2 0 2Morton 0 0 0 0
Nemaha 8 9 0 9Neosho 1 3 4 7Ness 1 1 1 2Norton 3 3 1 4Osage 3 3 5 8
Osborne 2 3 0 3Ottawa 0 0 0 0Pawnee 2 2 2 4Phillips 2 3 0 3Pottawatomie 3 4 3 7
Pratt 2 4 1 5Rawlins 0 0 0 0Reno 15 19 12 31Republic 1 1 2 3Rice 1 2 2 4
Riley 16 20 11 31Rooks 0 0 1 1Rush 1 1 0 1Russell 0 0 1 1Saline 8 8 8 16
Scott 1 1 0 1Sedgwick 148 183 84 267Seward 12 14 3 17Shawnee 40 47 29 76Sheridan 2 2 0 2
Sherman 2 2 0 2Smith 1 1 0 1Stafford 0 0 0 0Stanton 0 0 0 0Stevens 0 0 1 1
Sumner 3 5 3 8Thomas 3 3 2 5Trego 0 0 1 1Wabaunsee 0 0 0 0Wallace 1 1 0 1
Washington 1 2 1 3Wichita 1 1 0 1Wilson 1 1 2 3Woodson. 0 0 0 0Wyandotte 52 68 37 105Residence data Source: Bureau of Epidemiology and Public Health Informatics Kansas Department of Health and Environment
27

Sou
rce:
Bur
eau
of E
pide
mio
logy
and
Pub
lic H
ealth
Info
rmat
ics
Kan
sas
Dep
artm
ent o
f Hea
lth a
nd E
nviro
nmen
t
Res
iden
ce d
ata
0.0
1.0
2.0
3.0
4.0
5.0
6.0
7.0
8.0
Rate per 1,000 live births
Figu
re 6
Five
Yea
r Ave
rage
Infa
nt M
orta
lity
Rat
esby
Per
iod
of D
eath
Kan
sas,
199
7-20
16
Neo
nata
l Dea
ths
Pos
t-Neo
nata
l Dea
ths
Infa
nt D
eath
s
28
Cause of Death Total
(ICD-10 Code) Stillbirths Under 20 20-31 32-41 42 & Over ns *
All Causes 1061 11 602 440 3 5
Certain Conditions Originating in the Perinatal Period (P00-P96)
507 2 297 204 1 3
Fetus Affected by Maternal Conditions (P00) 65 0 39 26 0 0
Fetus Affected by Maternal Complications of Pregnancy (P01)
78 0 61 17 0 0
Fetus Affected by Complications of Placenta, Cord & Membrane (P02)
258 2 138 117 0 1
Fetus Affected by Complications of Labor and Delivery (P03)
8 0 5 2 0 1
Fetus Affected by Maternal Use of Tobacco, Alcohol, and Drugs of Abuse (P04)
5 0 3 2 0 0
Other Perinatal Conditions (P04 - P05, P08-P15, P22-P28,P35 -P39, P55, P57 -P94, P96)
62 0 23 38 1 0
Disorders Related to Short Gestation & Low Birth Weight (P07)
29 0 27 1 0 1
Hypoxia and Birth Asphyxia (P20-P21) 1 0 1 0 0 0
Cardiovascular Disorders (P24-P28) 1 0 0 1 0 0
Unspecified Cause (P95) 270 5 152 113 0 0
Congenital Anomalies (Q00-Q99) 92 1 44 46 1 0
All Other Causes 192 3 109 77 1 2
*ns = Not Stated.Residence Data Source: Bureau of Epidemiology and Public Health Informatics
Table 7Stillbirths by Cause of Death by Weeks Gestation
Kansas, 2012-2016
Weeks Gestation
Kansas Department of Health and Environment
29
Sou
rce:
Bur
eau
of E
pide
mio
logy
and
Pub
lic H
ealth
Info
rmat
ics
Kan
sas
Dep
artm
ent o
f Hea
lth a
nd E
nviro
nmen
t
Res
iden
ce d
ata
0.0
1.0
2.0
3.0
4.0
5.0
6.0
7.0
8.0
9.0
10.0
Rate per 1,000 live births
Figu
re 7
Five
Yea
r Ave
rage
Per
inat
al P
erio
d lll
Mor
talit
y R
ates
by
Per
iod
of D
eath
Kan
sas,
199
7-20
16
Feta
l D
eath
sH
ebdo
mad
al D
eath
sP
erin
atal
Dea
ths
30

Tota
lC
ause
of D
eath
Dea
ths
N%
N%
N%
N%
N%
N%
ns*
Kan
sas
1,19
556
947
.957
4.8
122
10.3
748
63.0
190
16.0
249
21.0
8
Infe
ctio
us a
nd P
aras
itic
Dis
ease
s (A
00-B
99)
144
28.6
00.
03
21.4
750
.01
7.1
642
.90
Oth
er D
isea
ses
and
Dis
orde
rs (C
00-O
99)
9230
32.6
44.
37
7.6
4144
.621
22.8
3032
.60
Mat
erna
l Fac
tors
& C
ompl
of P
regn
ancy
, Lab
or
and
Del
iver
y (P
00-P
04)
107
9084
.91
0.9
43.
895
89.6
76.
64
3.8
1
Dis
orde
rs re
l. to
Sho
rt G
esta
tion
& L
ow B
irth
Wei
ght (
P07
)23
723
599
.60
0.0
00.
023
599
.61
0.4
00.
01
Hyp
oxia
and
Birt
h A
sphy
xia
(P20
-P21
)15
853
.32
13.3
213
.312
80.0
213
.31
6.7
0
Res
pira
tory
Dis
tress
of N
ewbo
rn (P
22)
1715
88.2
211
.80
0.0
1710
0.0
00.
00
0.0
0
Con
geni
tal P
neum
onia
(P23
)5
240
.01
20.0
120
.04
80.0
00.
01
20.0
0O
ther
Res
pira
tory
Con
ditio
ns o
f New
born
(P24
-P
28)
3728
75.7
12.
72
5.4
3183
.83
8.1
38.
10
Bac
teria
l Sep
sis
of N
ewbo
rn (P
36)
2619
73.1
13.
81
3.8
2180
.82
7.7
311
.50
Hem
orrh
agic
and
Hem
atol
og D
isor
ders
of F
etus
an
d N
ewbo
rn (P
50-P
61)
3726
72.2
25.
60
0.0
2877
.83
8.3
513
.91
Oth
er P
erin
atal
Con
ditio
ns (P
05, P
08, P
29, P
35,
P37
, P39
, P70
-P96
)79
5265
.85
6.3
45.
161
77.2
56.
313
16.5
0
Con
geni
tal A
nom
alie
s (Q
00-Q
99)
269
4516
.930
11.2
6624
.714
152
.863
23.6
6323
.62
Oth
er S
ympt
oms
and
Abn
orm
al F
indi
ngs
(R00
-R
94, R
96-R
98)
20
0.0
00.
00
0.0
00.
00
0.0
210
0.0
0
Sud
den
Infa
nt D
eath
Syn
drom
e (R
95)
112
54.
52
1.8
1715
.224
21.4
3430
.454
48.2
0O
ther
Ill-D
efin
ed a
nd U
nspe
cifie
d C
ause
s of
M
orta
lity
(R99
)68
69.
01
1.5
811
.915
22.4
2943
.323
34.3
1
Acc
iden
tal S
uffo
catio
n in
Bed
(W75
)33
00.
03
9.4
515
.68
25.0
825
.016
50.0
1E
xter
nal C
ause
s of
Mor
talit
y (V
01-Y
89),
excl
udin
g sl
eep
rela
ted
deat
hs (W
75)
454
9.1
24.
52
4.5
818
.211
25.0
2556
.81
*ns
= N
ot s
tate
d.
Tabl
e 8
Link
ed In
fant
Dea
ths
by C
ause
of D
eath
by
Ges
tatio
nal A
geKa
nsas
, 201
2-20
16
Ver
y P
rem
atur
eTe
rmE
arly
Ter
mTo
tal P
rete
rmLa
te P
rete
rmM
oder
ate
Pre
mat
ure
34-3
6 w
eeks
<37
wee
ks
Kan
sas
Dep
artm
ent o
f Hea
lth a
nd E
nviro
nmen
t
>=39
wee
ks<3
2 w
eeks
32-3
3 w
eeks
37-3
8 w
eeks
Res
iden
ce d
ata
Sou
rce:
Bur
eau
of E
pide
mio
logy
and
Pub
lic H
ealth
Info
rmat
ics
Unk
now
ns a
re e
xclu
ded
in c
alcu
latin
g pe
rcen
ts.
31
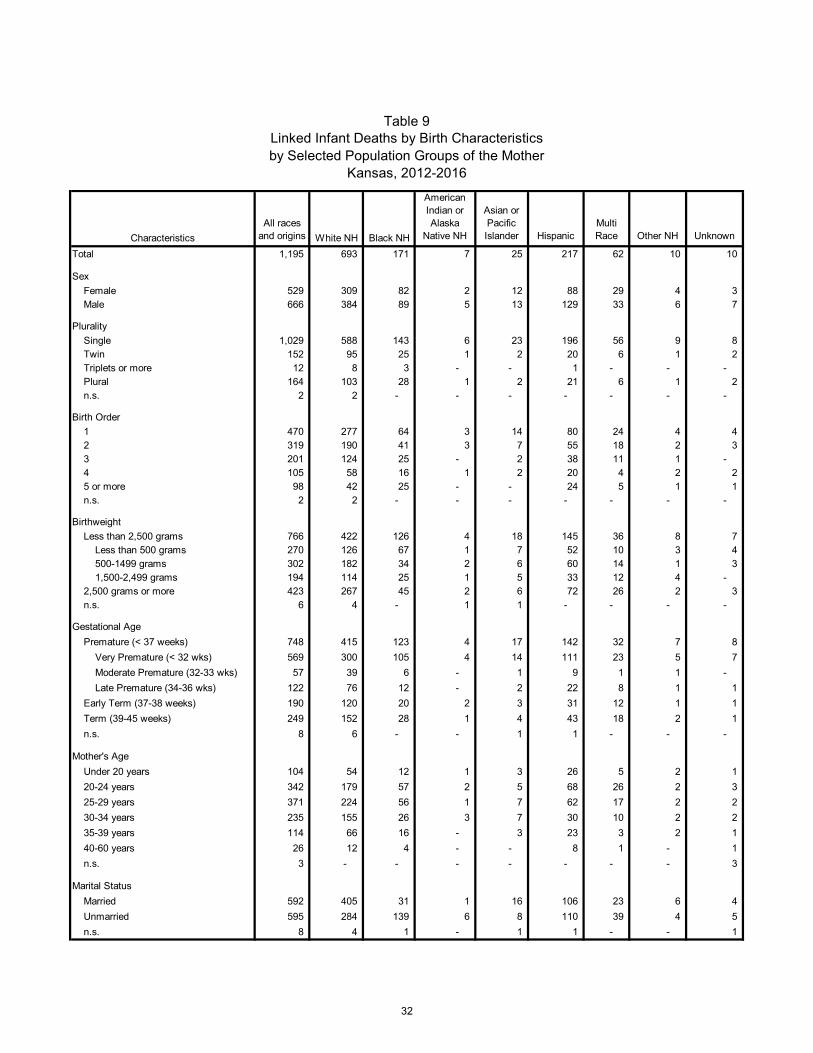
CharacteristicsAll races
and origins White NH Black NH
American Indian or Alaska
Native NH
Asian or Pacific Islander Hispanic
Multi Race Other NH Unknown
Total 1,195 693 171 7 25 217 62 10 10
SexFemale 529 309 82 2 12 88 29 4 3 Male 666 384 89 5 13 129 33 6 7
PluralitySingle 1,029 588 143 6 23 196 56 9 8 Twin 152 95 25 1 2 20 6 1 2 Triplets or more 12 8 3 - - 1 - - - Plural 164 103 28 1 2 21 6 1 2 n.s. 2 2 - - - - - - -
Birth Order1 470 277 64 3 14 80 24 4 4 2 319 190 41 3 7 55 18 2 3 3 201 124 25 - 2 38 11 1 - 4 105 58 16 1 2 20 4 2 2 5 or more 98 42 25 - - 24 5 1 1 n.s. 2 2 - - - - - - -
BirthweightLess than 2,500 grams 766 422 126 4 18 145 36 8 7 Less than 500 grams 270 126 67 1 7 52 10 3 4 500-1499 grams 302 182 34 2 6 60 14 1 3 1,500-2,499 grams 194 114 25 1 5 33 12 4 - 2,500 grams or more 423 267 45 2 6 72 26 2 3 n.s. 6 4 - 1 1 - - - -
Gestational AgePremature (< 37 weeks) 748 415 123 4 17 142 32 7 8
Very Premature (< 32 wks) 569 300 105 4 14 111 23 5 7 Moderate Premature (32-33 wks) 57 39 6 - 1 9 1 1 - Late Premature (34-36 wks) 122 76 12 - 2 22 8 1 1
Early Term (37-38 weeks) 190 120 20 2 3 31 12 1 1 Term (39-45 weeks) 249 152 28 1 4 43 18 2 1 n.s. 8 6 - - 1 1 - - -
Mother's AgeUnder 20 years 104 54 12 1 3 26 5 2 1 20-24 years 342 179 57 2 5 68 26 2 3 25-29 years 371 224 56 1 7 62 17 2 2 30-34 years 235 155 26 3 7 30 10 2 2 35-39 years 114 66 16 - 3 23 3 2 1 40-60 years 26 12 4 - - 8 1 - 1 n.s. 3 - - - - - - - 3
Marital StatusMarried 592 405 31 1 16 106 23 6 4 Unmarried 595 284 139 6 8 110 39 4 5 n.s. 8 4 1 - 1 1 - - 1
Table 9Linked Infant Deaths by Birth Characteristicsby Selected Population Groups of the Mother
Kansas, 2012-2016
32

CharacteristicsAll races
and origins White NH Black NH
American Indian or Alaska
Native NH
Asian or Pacific Islander Hispanic
Multi Race Other NH Unknown
Table 9Linked Infant Deaths by Birth Characteristicsby Selected Population Groups of the Mother
Kansas, 2012-2016
PayorMedicaid 522 275 107 2 6 89 31 5 7 Private Insurance 501 346 45 2 14 68 20 4 2 Self Pay 92 31 7 1 3 42 7 1 - Indian Health Service - - - - - - - - - Tricare 44 22 7 1 1 9 4 - - Other Government 7 4 1 - - 2 - - - Other 7 3 2 - - 2 - - - n.s. 22 12 2 1 1 5 - - 1
Mother's Education*8th Grade or Less 28 5 3 - - 17 1 1 1 9-12 Grade, No Diploma 71 23 11 1 3 31 1 1 - H.S. or GED 178 88 39 2 3 35 7 1 3 Some College, No Degree 160 107 25 1 1 14 11 1 - Associate Degree 79 53 14 - 1 8 3 - - Bachelor's Degree 145 118 6 - 4 14 - 2 1 Master's Degree 59 46 1 - 3 1 7 - 1 Doctorate 10 8 - - 2 - - - - n.s. 16 9 3 - - 3 1 - - *Mothers Over 24 years 730 448 99 4 17 120 30 6 6
Prenatal CareNone 65 30 14 1 2 13 4 - 1 Month 1 44 25 10 1 - 6 1 - 1 Month 2 413 247 60 2 8 70 23 1 2 Month 3 375 241 48 1 7 57 15 2 4 First Trimester 832 513 118 4 15 133 39 3 7 Month 4 115 53 21 - 3 27 8 3 - Month 5 72 35 7 - 4 18 5 1 2 Month 6 27 17 1 1 - 3 3 2 - Second Trimester 214 105 29 1 7 48 16 6 2 Month 7 18 8 2 - - 7 1 - - Month 8 9 4 2 - - 3 - - - Month 9 5 1 - - - 3 1 - - Third Trimester 32 13 4 - - 13 2 - - n.s. 52 32 6 1 1 10 1 1 -
Adequecy of Prenatal CareAdequate Plus 558 342 84 2 12 88 23 4 3 Adequate 300 170 38 2 6 58 20 2 4 Intermediate 64 40 12 - - 11 1 - - Inadequate 201 99 26 2 6 48 14 3 3 n.s. 72 42 11 1 1 12 4 1 -
Smoking During PregnancyEver Smoked During Pregnancy 252 178 33 2 - 18 19 1 1 Smoking Status Known 1,195 693 171 7 25 217 62 10 10
n.s. = not statedResidence data
Source: Bureau of Epidemiology and Public Health Informatics Kansas Department of Health and Environment
33
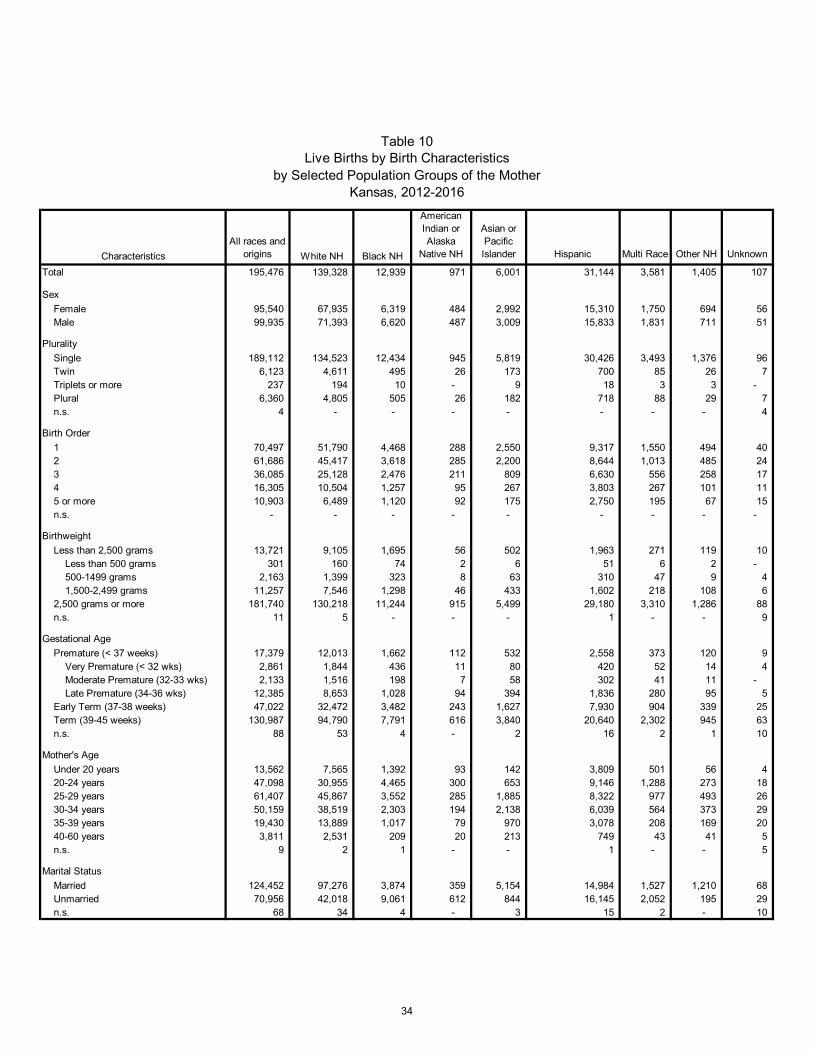
CharacteristicsAll races and
origins White NH Black NH
American Indian or Alaska
Native NH
Asian or Pacific Islander Hispanic Multi Race Other NH Unknown
Total 195,476 139,328 12,939 971 6,001 31,144 3,581 1,405 107
SexFemale 95,540 67,935 6,319 484 2,992 15,310 1,750 694 56 Male 99,935 71,393 6,620 487 3,009 15,833 1,831 711 51
PluralitySingle 189,112 134,523 12,434 945 5,819 30,426 3,493 1,376 96 Twin 6,123 4,611 495 26 173 700 85 26 7 Triplets or more 237 194 10 - 9 18 3 3 - Plural 6,360 4,805 505 26 182 718 88 29 7 n.s. 4 - - - - - - - 4
Birth Order1 70,497 51,790 4,468 288 2,550 9,317 1,550 494 40 2 61,686 45,417 3,618 285 2,200 8,644 1,013 485 24 3 36,085 25,128 2,476 211 809 6,630 556 258 17 4 16,305 10,504 1,257 95 267 3,803 267 101 11 5 or more 10,903 6,489 1,120 92 175 2,750 195 67 15 n.s. - - - - - - - - -
BirthweightLess than 2,500 grams 13,721 9,105 1,695 56 502 1,963 271 119 10 Less than 500 grams 301 160 74 2 6 51 6 2 - 500-1499 grams 2,163 1,399 323 8 63 310 47 9 4 1,500-2,499 grams 11,257 7,546 1,298 46 433 1,602 218 108 6 2,500 grams or more 181,740 130,218 11,244 915 5,499 29,180 3,310 1,286 88 n.s. 11 5 - - - 1 - - 9
Gestational AgePremature (< 37 weeks) 17,379 12,013 1,662 112 532 2,558 373 120 9
Very Premature (< 32 wks) 2,861 1,844 436 11 80 420 52 14 4 Moderate Premature (32-33 wks) 2,133 1,516 198 7 58 302 41 11 - Late Premature (34-36 wks) 12,385 8,653 1,028 94 394 1,836 280 95 5
Early Term (37-38 weeks) 47,022 32,472 3,482 243 1,627 7,930 904 339 25 Term (39-45 weeks) 130,987 94,790 7,791 616 3,840 20,640 2,302 945 63 n.s. 88 53 4 - 2 16 2 1 10
Mother's AgeUnder 20 years 13,562 7,565 1,392 93 142 3,809 501 56 4 20-24 years 47,098 30,955 4,465 300 653 9,146 1,288 273 18 25-29 years 61,407 45,867 3,552 285 1,885 8,322 977 493 26 30-34 years 50,159 38,519 2,303 194 2,138 6,039 564 373 29 35-39 years 19,430 13,889 1,017 79 970 3,078 208 169 20 40-60 years 3,811 2,531 209 20 213 749 43 41 5 n.s. 9 2 1 - - 1 - - 5
Marital StatusMarried 124,452 97,276 3,874 359 5,154 14,984 1,527 1,210 68 Unmarried 70,956 42,018 9,061 612 844 16,145 2,052 195 29 n.s. 68 34 4 - 3 15 2 - 10
Table 10Live Births by Birth Characteristics
by Selected Population Groups of the MotherKansas, 2012-2016
34
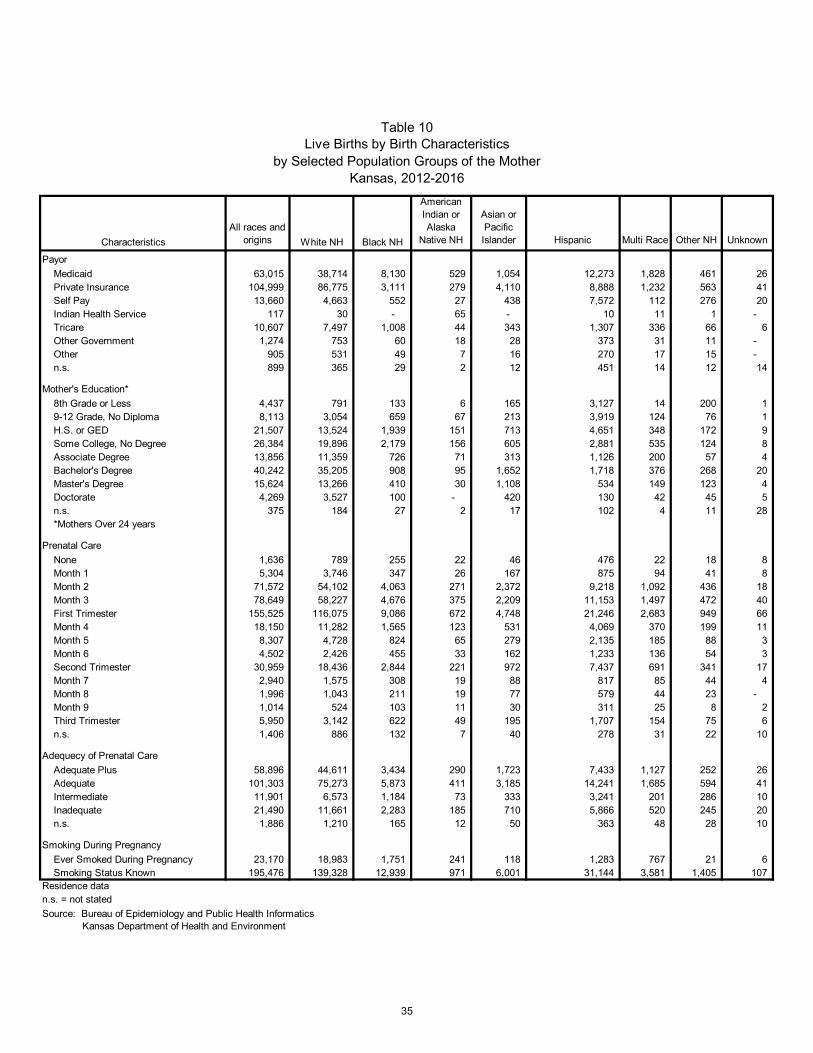
CharacteristicsAll races and
origins White NH Black NH
American Indian or Alaska
Native NH
Asian or Pacific Islander Hispanic Multi Race Other NH Unknown
Table 10Live Births by Birth Characteristics
by Selected Population Groups of the MotherKansas, 2012-2016
PayorMedicaid 63,015 38,714 8,130 529 1,054 12,273 1,828 461 26 Private Insurance 104,999 86,775 3,111 279 4,110 8,888 1,232 563 41 Self Pay 13,660 4,663 552 27 438 7,572 112 276 20 Indian Health Service 117 30 - 65 - 10 11 1 - Tricare 10,607 7,497 1,008 44 343 1,307 336 66 6 Other Government 1,274 753 60 18 28 373 31 11 - Other 905 531 49 7 16 270 17 15 - n.s. 899 365 29 2 12 451 14 12 14
Mother's Education*8th Grade or Less 4,437 791 133 6 165 3,127 14 200 1 9-12 Grade, No Diploma 8,113 3,054 659 67 213 3,919 124 76 1 H.S. or GED 21,507 13,524 1,939 151 713 4,651 348 172 9 Some College, No Degree 26,384 19,896 2,179 156 605 2,881 535 124 8 Associate Degree 13,856 11,359 726 71 313 1,126 200 57 4 Bachelor's Degree 40,242 35,205 908 95 1,652 1,718 376 268 20 Master's Degree 15,624 13,266 410 30 1,108 534 149 123 4 Doctorate 4,269 3,527 100 - 420 130 42 45 5 n.s. 375 184 27 2 17 102 4 11 28 *Mothers Over 24 years
Prenatal CareNone 1,636 789 255 22 46 476 22 18 8 Month 1 5,304 3,746 347 26 167 875 94 41 8 Month 2 71,572 54,102 4,063 271 2,372 9,218 1,092 436 18 Month 3 78,649 58,227 4,676 375 2,209 11,153 1,497 472 40 First Trimester 155,525 116,075 9,086 672 4,748 21,246 2,683 949 66 Month 4 18,150 11,282 1,565 123 531 4,069 370 199 11 Month 5 8,307 4,728 824 65 279 2,135 185 88 3 Month 6 4,502 2,426 455 33 162 1,233 136 54 3 Second Trimester 30,959 18,436 2,844 221 972 7,437 691 341 17 Month 7 2,940 1,575 308 19 88 817 85 44 4 Month 8 1,996 1,043 211 19 77 579 44 23 - Month 9 1,014 524 103 11 30 311 25 8 2 Third Trimester 5,950 3,142 622 49 195 1,707 154 75 6 n.s. 1,406 886 132 7 40 278 31 22 10
Adequecy of Prenatal CareAdequate Plus 58,896 44,611 3,434 290 1,723 7,433 1,127 252 26 Adequate 101,303 75,273 5,873 411 3,185 14,241 1,685 594 41 Intermediate 11,901 6,573 1,184 73 333 3,241 201 286 10 Inadequate 21,490 11,661 2,283 185 710 5,866 520 245 20 n.s. 1,886 1,210 165 12 50 363 48 28 10
Smoking During PregnancyEver Smoked During Pregnancy 23,170 18,983 1,751 241 118 1,283 767 21 6 Smoking Status Known 195,476 139,328 12,939 971 6,001 31,144 3,581 1,405 107
n.s. = not stated
Kansas Department of Health and EnvironmentSource: Bureau of Epidemiology and Public Health Informatics
Residence data
35
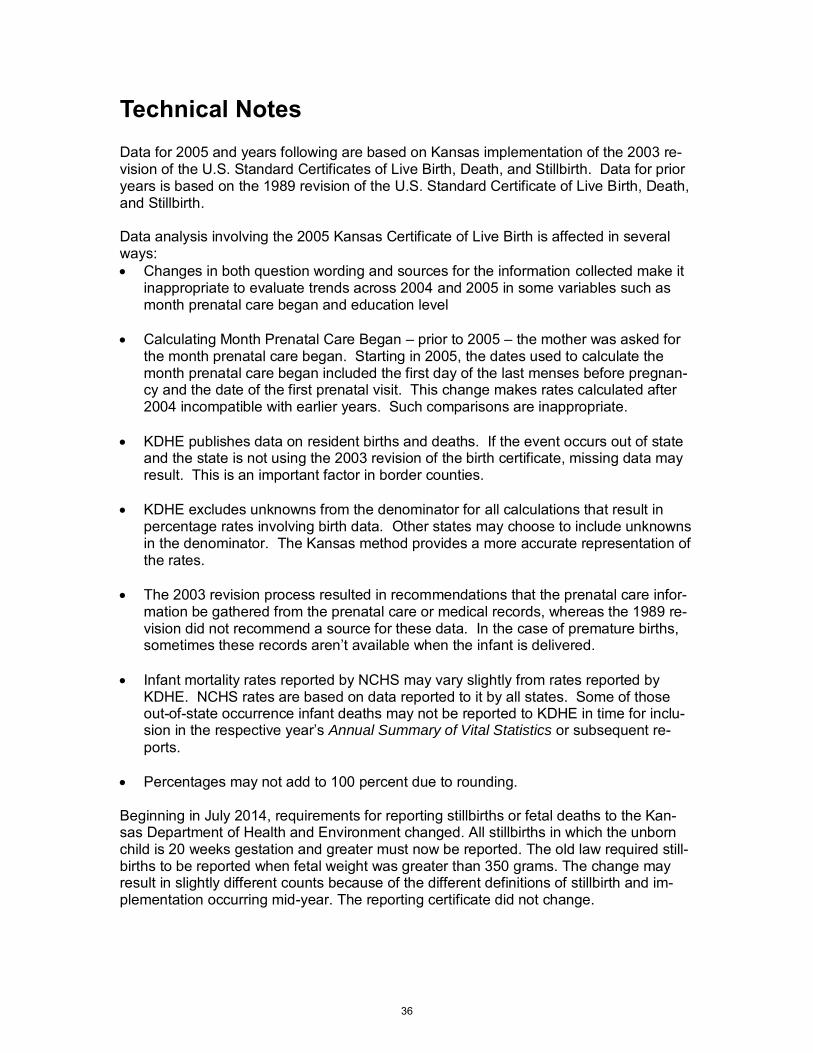
Technical Notes
Data for 2005 and years following are based on Kansas implementation of the 2003 re-vision of the U.S. Standard Certificates of Live Birth, Death, and Stillbirth. Data for prior years is based on the 1989 revision of the U.S. Standard Certificate of Live Birth, Death, and Stillbirth. Data analysis involving the 2005 Kansas Certificate of Live Birth is affected in several ways: Changes in both question wording and sources for the information collected make it
inappropriate to evaluate trends across 2004 and 2005 in some variables such as month prenatal care began and education level
Calculating Month Prenatal Care Began – prior to 2005 – the mother was asked for
the month prenatal care began. Starting in 2005, the dates used to calculate the month prenatal care began included the first day of the last menses before pregnan-cy and the date of the first prenatal visit. This change makes rates calculated after 2004 incompatible with earlier years. Such comparisons are inappropriate.
KDHE publishes data on resident births and deaths. If the event occurs out of state
and the state is not using the 2003 revision of the birth certificate, missing data may result. This is an important factor in border counties.
KDHE excludes unknowns from the denominator for all calculations that result in
percentage rates involving birth data. Other states may choose to include unknowns in the denominator. The Kansas method provides a more accurate representation of the rates.
The 2003 revision process resulted in recommendations that the prenatal care infor-
mation be gathered from the prenatal care or medical records, whereas the 1989 re-vision did not recommend a source for these data. In the case of premature births, sometimes these records aren’t available when the infant is delivered.
Infant mortality rates reported by NCHS may vary slightly from rates reported by KDHE. NCHS rates are based on data reported to it by all states. Some of those out-of-state occurrence infant deaths may not be reported to KDHE in time for inclu-sion in the respective year’s Annual Summary of Vital Statistics or subsequent re-ports.
Percentages may not add to 100 percent due to rounding.
Beginning in July 2014, requirements for reporting stillbirths or fetal deaths to the Kan-sas Department of Health and Environment changed. All stillbirths in which the unborn child is 20 weeks gestation and greater must now be reported. The old law required still-births to be reported when fetal weight was greater than 350 grams. The change may result in slightly different counts because of the different definitions of stillbirth and im-plementation occurring mid-year. The reporting certificate did not change.
36
Population Groups This report uses the concept of reporting race and Hispanic origin combined into distinct categories of population groups. This was done to preserve the self-reported infor-mation on race and origin reported in the expanded categories. The use of population groups assures a better uniformity of the numerators and denominators in rate calcula-tions. Because of different tabulation methods, totals for population groups may not equal those tabulated by either race or Hispanic origin individually. Rates calculated exclu-sively on Hispanic origin treat unknowns differently. The aggregation grid for population groups is listed on page 172 of the Annual Summary of Vital Statistics, 2014. Application of this grid assures that every combination of race and origin is assigned to a population group. In instances where the Hispanic origin of an individual is unknown, the person is assigned to a population group solely on the ba-sis of race and is considered non-Hispanic.
Peer Groups For various demographic studies, it is useful to consider groups of counties with similar characteristics. “Peer Groups” of counties, as used in this summary, are defined as those with similar population density based on a method derived by the KDHE Bureau of Community Health Systems. (See Appendix 1 for county tables indicating population density peer group membership before and after the 2010 U.S. Census.) Frontier counties are defined as those with less than 6.0 persons per square mile, Rural counties as those with 6.0 - 19.9 persons per square mile, Densely-Settled Rural coun-ties as those with 20.0 - 39.9 persons per square mile, Semi-Urban counties as those with 40.0 - 149.9 persons per square mile, and Urban counties as those with 150.0 or more persons per square mile. These designations should not be confused with the USCB definitions of urban and rural areas. The KDHE Bureau of Epidemiology and Public Health Informatics applies these defini-tions, updating the groups with every decennial census. Based on the 2010 U.S. Cen-sus, eight Kansas counties changed peer groups. In order to facilitate a time series comparison, Peer-Group statistics for prior years are based on the Peer-Group in effect during that decade [2]. Sources for calculation of population densities are population fig-ures from the 2010 U.S. Census and land areas from the 2010 U.S. Census.
37
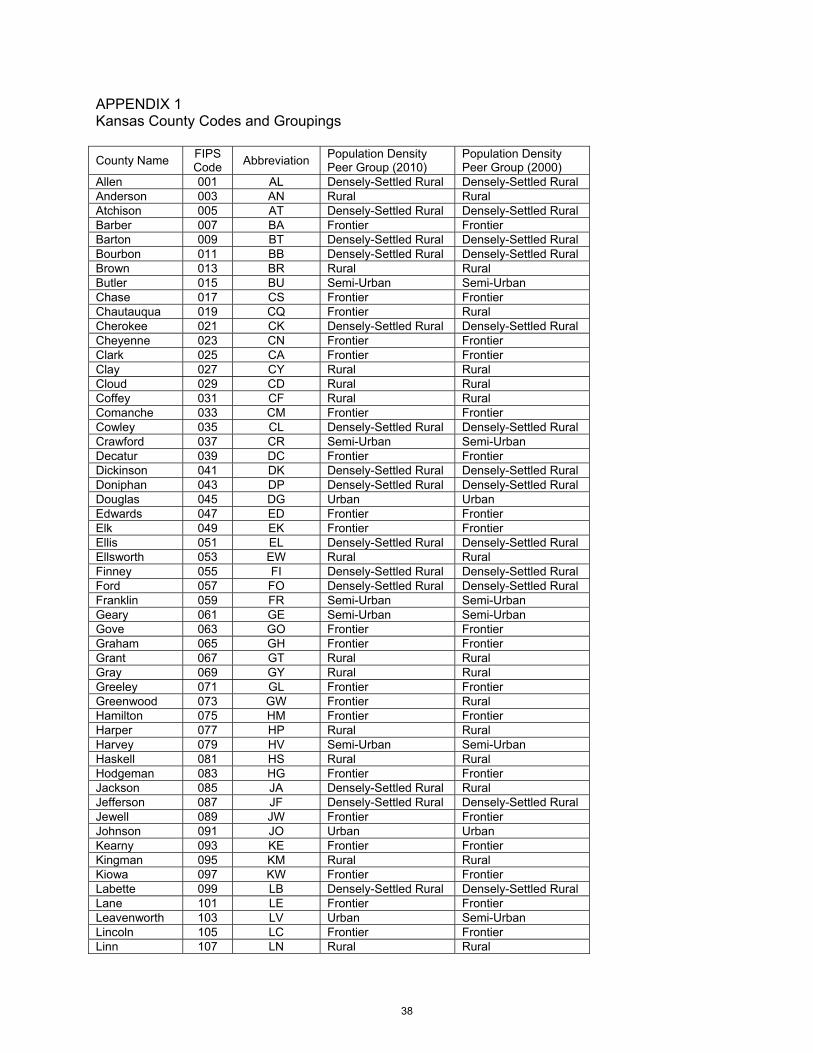
APPENDIX 1 Kansas County Codes and Groupings County Name FIPS
Code Abbreviation Population Density Peer Group (2010)
Population Density Peer Group (2000)
Allen 001 AL Densely-Settled Rural Densely-Settled Rural Anderson 003 AN Rural Rural Atchison 005 AT Densely-Settled Rural Densely-Settled Rural Barber 007 BA Frontier Frontier Barton 009 BT Densely-Settled Rural Densely-Settled Rural Bourbon 011 BB Densely-Settled Rural Densely-Settled Rural Brown 013 BR Rural Rural Butler 015 BU Semi-Urban Semi-Urban Chase 017 CS Frontier Frontier Chautauqua 019 CQ Frontier Rural Cherokee 021 CK Densely-Settled Rural Densely-Settled Rural Cheyenne 023 CN Frontier Frontier Clark 025 CA Frontier Frontier Clay 027 CY Rural Rural Cloud 029 CD Rural Rural Coffey 031 CF Rural Rural Comanche 033 CM Frontier Frontier Cowley 035 CL Densely-Settled Rural Densely-Settled Rural Crawford 037 CR Semi-Urban Semi-Urban Decatur 039 DC Frontier Frontier Dickinson 041 DK Densely-Settled Rural Densely-Settled Rural Doniphan 043 DP Densely-Settled Rural Densely-Settled Rural Douglas 045 DG Urban Urban Edwards 047 ED Frontier Frontier Elk 049 EK Frontier Frontier Ellis 051 EL Densely-Settled Rural Densely-Settled Rural Ellsworth 053 EW Rural Rural Finney 055 FI Densely-Settled Rural Densely-Settled Rural Ford 057 FO Densely-Settled Rural Densely-Settled Rural Franklin 059 FR Semi-Urban Semi-Urban Geary 061 GE Semi-Urban Semi-Urban Gove 063 GO Frontier Frontier Graham 065 GH Frontier Frontier Grant 067 GT Rural Rural Gray 069 GY Rural Rural Greeley 071 GL Frontier Frontier Greenwood 073 GW Frontier Rural Hamilton 075 HM Frontier Frontier Harper 077 HP Rural Rural Harvey 079 HV Semi-Urban Semi-Urban Haskell 081 HS Rural Rural Hodgeman 083 HG Frontier Frontier Jackson 085 JA Densely-Settled Rural Rural Jefferson 087 JF Densely-Settled Rural Densely-Settled Rural Jewell 089 JW Frontier Frontier Johnson 091 JO Urban Urban Kearny 093 KE Frontier Frontier Kingman 095 KM Rural Rural Kiowa 097 KW Frontier Frontier Labette 099 LB Densely-Settled Rural Densely-Settled Rural Lane 101 LE Frontier Frontier Leavenworth 103 LV Urban Semi-Urban Lincoln 105 LC Frontier Frontier Linn 107 LN Rural Rural
38

County Name FIPS Code Abbreviation Population Density
Peer Group (2010) Population Density Peer Group (2000)
Logan 109 LG Frontier Frontier Lyon 111 LY Densely-Settled Rural Semi-Urban McPherson 113 MP Densely-Settled Rural Densely-Settled Rural Marion 115 MN Rural Rural Marshall 117 MS Rural Rural Meade 119 ME Frontier Frontier Miami 121 MI Semi-Urban Semi-Urban Mitchell 123 MC Rural Rural Montgomery 125 MG Semi-Urban Semi-Urban Morris 127 MR Rural Rural Morton 129 MT Frontier Frontier Nemaha 131 NM Rural Rural Neosho 133 NO Densely-Settled Rural Densely-Settled Rural Ness 135 NS Frontier Frontier Norton 137 NT Rural Rural Osage 139 OS Densely-Settled Rural Densely-Settled Rural Osborne 141 OB Frontier Frontier Ottawa 143 OT Rural Rural Pawnee 145 PN Rural Rural Phillips 147 PL Rural Rural Pottawatomie 149 PT Densely-Settled Rural Densely-Settled Rural Pratt 151 PR Rural Rural Rawlins 153 RA Frontier Frontier Reno 155 RN Semi-Urban Semi-Urban Republic 157 RP Rural Rural Rice 159 RC Rural Rural Riley 161 RL Semi-Urban Semi-Urban Rooks 163 RO Frontier Rural Rush 165 RH Frontier Frontier Russell 167 RS Rural Rural Saline 169 SA Semi-Urban Semi-Urban Scott 171 SC Rural Rural Sedgwick 173 SG Urban Urban Seward 175 SW Densely-Settled Rural Densely-Settled Rural Shawnee 177 SN Urban Urban Sheridan 179 SD Frontier Frontier Sherman 181 SH Frontier Rural Smith 183 SM Frontier Frontier Stafford 185 SF Frontier Rural Stanton 187 ST Frontier Frontier Stevens 189 SV Rural Rural Sumner 191 SU Densely-Settled Rural Densely-Settled Rural Thomas 193 TH Rural Rural Trego 195 TR Frontier Frontier Wabaunsee 197 WB Rural Rural Wallace 199 WA Frontier Frontier Washington 201 WS Rural Rural Wichita 203 WH Frontier Frontier Wilson 205 WL Rural Rural Woodson 207 WO Rural Rural Wyandotte 209 WY Urban Urban
39
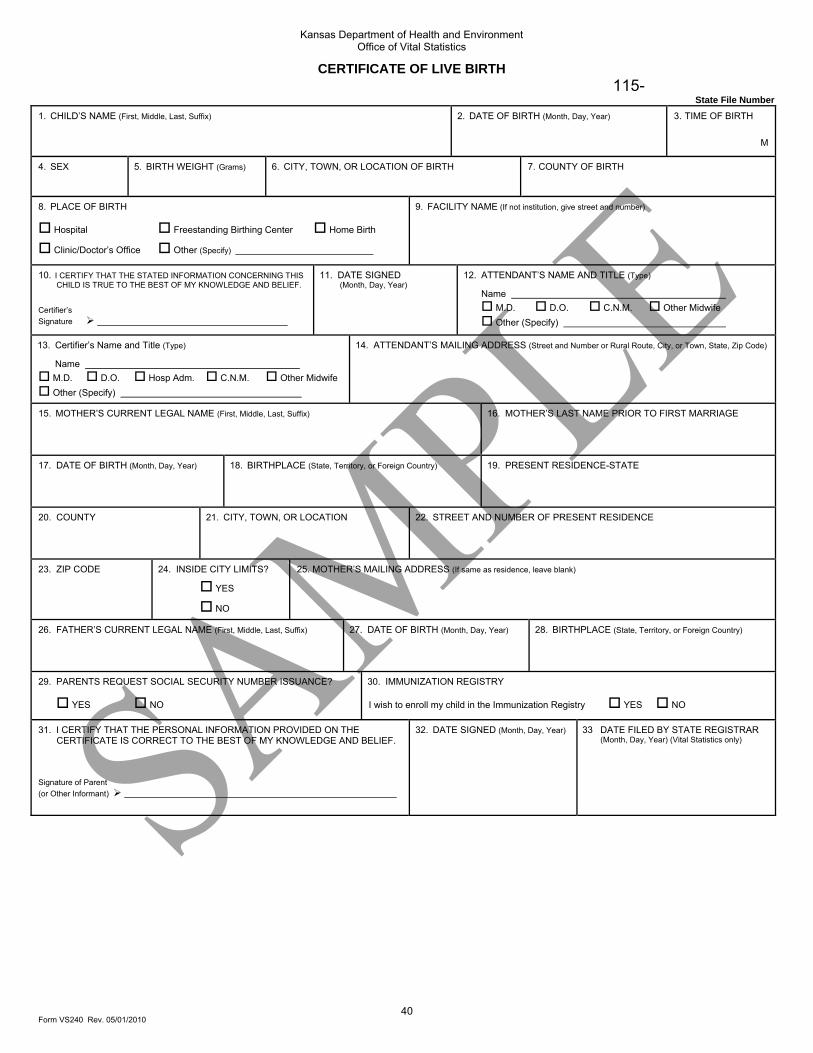
Form VS240 Rev. 05/01/2010
Kansas Department of Health and Environment Office of Vital Statistics
CERTIFICATE OF LIVE BIRTH
115- State File Number
1. CHILD’S NAME (First, Middle, Last, Suffix) 2. DATE OF BIRTH (Month, Day, Year) 3. TIME OF BIRTH
M
4. SEX 5. BIRTH WEIGHT (Grams) 6. CITY, TOWN, OR LOCATION OF BIRTH 7. COUNTY OF BIRTH
8. PLACE OF BIRTH
Hospital Freestanding Birthing Center Home Birth
Clinic/Doctor’s Office Other (Specify)
9. FACILITY NAME (If not institution, give street and number)
10. I CERTIFY THAT THE STATED INFORMATION CONCERNING THIS CHILD IS TRUE TO THE BEST OF MY KNOWLEDGE AND BELIEF.
Certifier’s Signature
11. DATE SIGNED (Month, Day, Year)
12. ATTENDANT’S NAME AND TITLE (Type)
Name M.D. D.O. C.N.M. Other Midwife Other (Specify)
13. Certifier’s Name and Title (Type)
Name M.D. D.O. Hosp Adm. C.N.M. Other Midwife Other (Specify)
14. ATTENDANT’S MAILING ADDRESS (Street and Number or Rural Route, City, or Town, State, Zip Code)
15. MOTHER’S CURRENT LEGAL NAME (First, Middle, Last, Suffix) 16. MOTHER’S LAST NAME PRIOR TO FIRST MARRIAGE
17. DATE OF BIRTH (Month, Day, Year) 18. BIRTHPLACE (State, Territory, or Foreign Country) 19. PRESENT RESIDENCE-STATE
20. COUNTY 21. CITY, TOWN, OR LOCATION 22. STREET AND NUMBER OF PRESENT RESIDENCE
23. ZIP CODE 24. INSIDE CITY LIMITS?
YES
NO
25. MOTHER’S MAILING ADDRESS (If same as residence, leave blank)
26. FATHER’S CURRENT LEGAL NAME (First, Middle, Last, Suffix) 27. DATE OF BIRTH (Month, Day, Year) 28. BIRTHPLACE (State, Territory, or Foreign Country)
29. PARENTS REQUEST SOCIAL SECURITY NUMBER ISSUANCE?
YES NO
30. IMMUNIZATION REGISTRY
I wish to enroll my child in the Immunization Registry YES NO
31. I CERTIFY THAT THE PERSONAL INFORMATION PROVIDED ON THE CERTIFICATE IS CORRECT TO THE BEST OF MY KNOWLEDGE AND BELIEF.
Signature of Parent (or Other Informant)
32. DATE SIGNED (Month, Day, Year) 33 DATE FILED BY STATE REGISTRAR (Month, Day, Year) (Vital Statistics only)
40
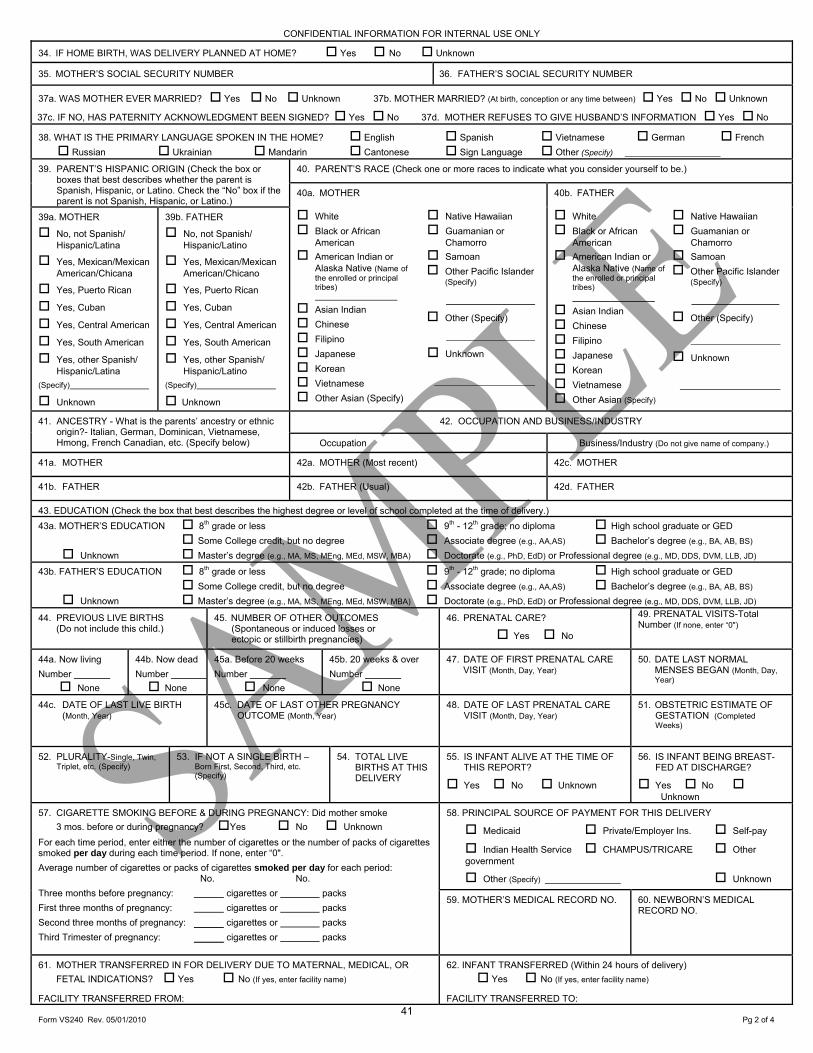
Form VS240 Rev. 05/01/2010 Pg 2 of 4
CONFIDENTIAL INFORMATION FOR INTERNAL USE ONLY
34. IF HOME BIRTH, WAS DELIVERY PLANNED AT HOME? Yes No Unknown
35. MOTHER’S SOCIAL SECURITY NUMBER 36. FATHER’S SOCIAL SECURITY NUMBER
37a. WAS MOTHER EVER MARRIED? Yes No Unknown 37b. MOTHER MARRIED? (At birth, conception or any time between) Yes No Unknown
37c. IF NO, HAS PATERNITY ACKNOWLEDGMENT BEEN SIGNED? Yes No 37d. MOTHER REFUSES TO GIVE HUSBAND’S INFORMATION Yes No
38. WHAT IS THE PRIMARY LANGUAGE SPOKEN IN THE HOME? English Spanish Vietnamese German French Russian Ukrainian Mandarin Cantonese Sign Language Other (Specify)
39. PARENT’S HISPANIC ORIGIN (Check the box or boxes that best describes whether the parent is Spanish, Hispanic, or Latino. Check the “No” box if the parent is not Spanish, Hispanic, or Latino.)
40. PARENT’S RACE (Check one or more races to indicate what you consider yourself to be.)
40a. MOTHER 40b. FATHER
39a. MOTHER
No, not Spanish/ Hispanic/Latina
Yes, Mexican/Mexican American/Chicana
Yes, Puerto Rican
Yes, Cuban
Yes, Central American
Yes, South American
Yes, other Spanish/ Hispanic/Latina
(Specify)
Unknown
39b. FATHER
No, not Spanish/ Hispanic/Latino
Yes, Mexican/Mexican American/Chicano
Yes, Puerto Rican Yes, Cuban Yes, Central American Yes, South American Yes, other Spanish/
Hispanic/Latino (Specify)
Unknown
White Black or African
American American Indian or
Alaska Native (Name of the enrolled or principal tribes)
Asian Indian Chinese Filipino Japanese Korean Vietnamese Other Asian (Specify)
Native Hawaiian Guamanian or
Chamorro Samoan Other Pacific Islander
(Specify)
Other (Specify)
Unknown
White Black or African
American American Indian or
Alaska Native (Name of the enrolled or principal tribes)
Asian Indian Chinese Filipino Japanese Korean Vietnamese Other Asian (Specify)
Native Hawaiian Guamanian or
Chamorro Samoan Other Pacific Islander
(Specify)
Other (Specify)
Unknown
41. ANCESTRY - What is the parents’ ancestry or ethnic origin?- Italian, German, Dominican, Vietnamese, Hmong, French Canadian, etc. (Specify below)
42. OCCUPATION AND BUSINESS/INDUSTRY
Occupation Business/Industry (Do not give name of company.)
41a. MOTHER 42a. MOTHER (Most recent) 42c. MOTHER
41b. FATHER 42b. FATHER (Usual) 42d. FATHER
43. EDUCATION (Check the box that best describes the highest degree or level of school completed at the time of delivery.) 43a. MOTHER’S EDUCATION 8th grade or less 9th - 12th grade; no diploma High school graduate or GED
Some College credit, but no degree Associate degree (e.g., AA,AS) Bachelor’s degree (e.g., BA, AB, BS)
Unknown Master’s degree (e.g., MA, MS, MEng, MEd, MSW, MBA) Doctorate (e.g., PhD, EdD) or Professional degree (e.g., MD, DDS, DVM, LLB, JD)
43b. FATHER’S EDUCATION 8th grade or less 9th - 12th grade; no diploma High school graduate or GED Some College credit, but no degree Associate degree (e.g., AA,AS) Bachelor’s degree (e.g., BA, AB, BS)
Unknown Master’s degree (e.g., MA, MS, MEng, MEd, MSW, MBA) Doctorate (e.g., PhD, EdD) or Professional degree (e.g., MD, DDS, DVM, LLB, JD)
44. PREVIOUS LIVE BIRTHS (Do not include this child.)
45. NUMBER OF OTHER OUTCOMES (Spontaneous or induced losses or ectopic or stillbirth pregnancies)
46. PRENATAL CARE?
Yes No
49. PRENATAL VISITS-Total Number (If none, enter “0")
44a. Now living Number None
44b. Now dead Number None
45a. Before 20 weeks Number
None
45b. 20 weeks & over Number
None
47. DATE OF FIRST PRENATAL CARE VISIT (Month, Day, Year)
50. DATE LAST NORMAL MENSES BEGAN (Month, Day, Year)
44c. DATE OF LAST LIVE BIRTH (Month, Year)
45c. DATE OF LAST OTHER PREGNANCY OUTCOME (Month, Year)
48. DATE OF LAST PRENATAL CARE VISIT (Month, Day, Year)
51. OBSTETRIC ESTIMATE OF GESTATION (Completed Weeks)
52. PLURALITY-Single, Twin, Triplet, etc. (Specify)
53. IF NOT A SINGLE BIRTH – Born First, Second, Third, etc. (Specify)
54. TOTAL LIVE BIRTHS AT THIS DELIVERY
55. IS INFANT ALIVE AT THE TIME OF THIS REPORT?
Yes No Unknown
56. IS INFANT BEING BREAST-FED AT DISCHARGE?
Yes No Unknown
57. CIGARETTE SMOKING BEFORE & DURING PREGNANCY: Did mother smoke 3 mos. before or during pregnancy? Yes No Unknown
For each time period, enter either the number of cigarettes or the number of packs of cigarettes smoked per day during each time period. If none, enter “0". Average number of cigarettes or packs of cigarettes smoked per day for each period:
No. No. Three months before pregnancy: cigarettes or packs First three months of pregnancy: cigarettes or packs Second three months of pregnancy: cigarettes or packs Third Trimester of pregnancy: cigarettes or packs
58. PRINCIPAL SOURCE OF PAYMENT FOR THIS DELIVERY
Medicaid Private/Employer Ins. Self-pay
Indian Health Service CHAMPUS/TRICARE Other government
Other (Specify) Unknown
59. MOTHER’S MEDICAL RECORD NO. 60. NEWBORN’S MEDICAL RECORD NO.
61. MOTHER TRANSFERRED IN FOR DELIVERY DUE TO MATERNAL, MEDICAL, OR FETAL INDICATIONS? Yes No (If yes, enter facility name)
FACILITY TRANSFERRED FROM:
62. INFANT TRANSFERRED (Within 24 hours of delivery) Yes No (If yes, enter facility name)
FACILITY TRANSFERRED TO: 41
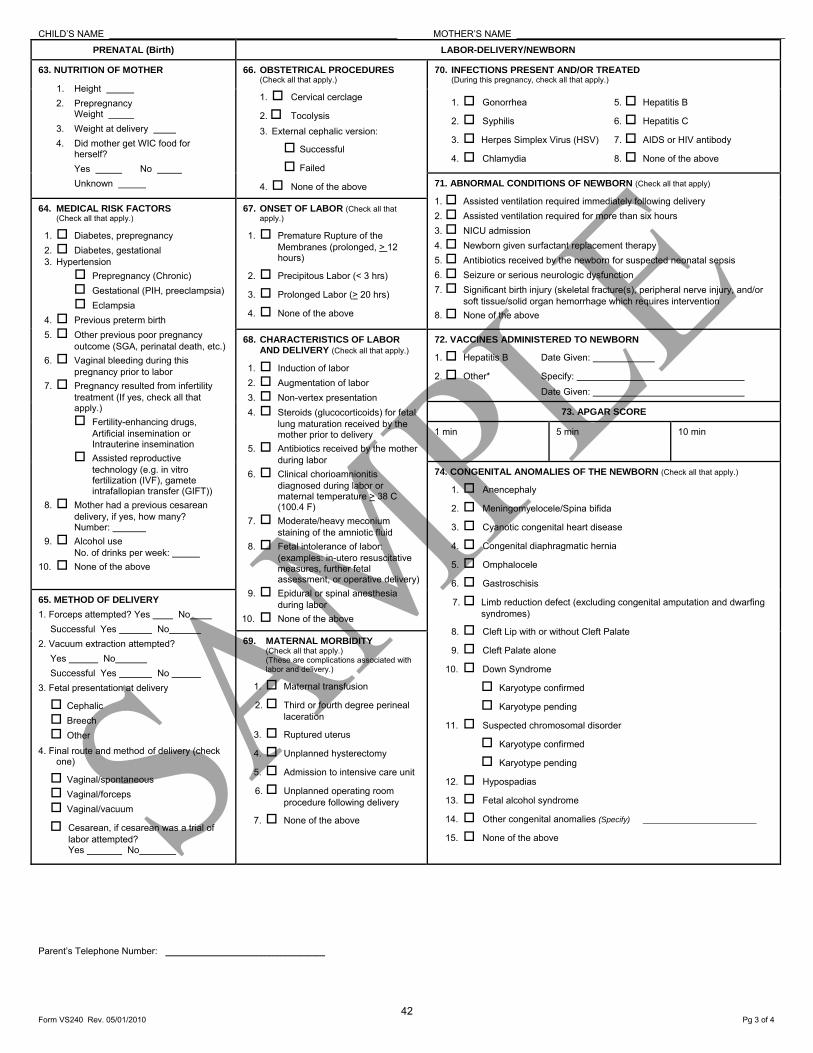
Form VS240 Rev. 05/01/2010 Pg 3 of 4
CHILD’S NAME MOTHER’S NAME
PRENATAL (Birth) LABOR-DELIVERY/NEWBORN
63. NUTRITION OF MOTHER
1. Height 2. Prepregnancy
Weight 3. Weight at delivery 4. Did mother get WIC food for
herself? Yes No Unknown
66. OBSTETRICAL PROCEDURES (Check all that apply.)
1. Cervical cerclage
2. Tocolysis 3. External cephalic version:
Successful
Failed
4. None of the above
70. INFECTIONS PRESENT AND/OR TREATED (During this pregnancy, check all that apply.)
1. Gonorrhea
2. Syphilis
3. Herpes Simplex Virus (HSV)
4. Chlamydia
5. Hepatitis B
6. Hepatitis C
7. AIDS or HIV antibody
8. None of the above
71. ABNORMAL CONDITIONS OF NEWBORN (Check all that apply)
1. Assisted ventilation required immediately following delivery 2. Assisted ventilation required for more than six hours 3. NICU admission 4. Newborn given surfactant replacement therapy 5. Antibiotics received by the newborn for suspected neonatal sepsis 6. Seizure or serious neurologic dysfunction 7. Significant birth injury (skeletal fracture(s), peripheral nerve injury, and/or
soft tissue/solid organ hemorrhage which requires intervention 8. None of the above
64. MEDICAL RISK FACTORS (Check all that apply.)
1. Diabetes, prepregnancy 2. Diabetes, gestational 3. Hypertension
Prepregnancy (Chronic) Gestational (PIH, preeclampsia) Eclampsia
4. Previous preterm birth 5. Other previous poor pregnancy
outcome (SGA, perinatal death, etc.) 6. Vaginal bleeding during this
pregnancy prior to labor 7. Pregnancy resulted from infertility
treatment (If yes, check all that apply.) Fertility-enhancing drugs,
Artificial insemination or Intrauterine insemination
Assisted reproductive technology (e.g. in vitro fertilization (IVF), gamete intrafallopian transfer (GIFT))
8. Mother had a previous cesarean delivery, if yes, how many? Number:
9. Alcohol use No. of drinks per week:
10. None of the above
67. ONSET OF LABOR (Check all that apply.)
1. Premature Rupture of the Membranes (prolonged, > 12 hours)
2. Precipitous Labor (< 3 hrs)
3. Prolonged Labor (> 20 hrs)
4. None of the above
68. CHARACTERISTICS OF LABOR AND DELIVERY (Check all that apply.)
1. Induction of labor 2. Augmentation of labor 3. Non-vertex presentation 4. Steroids (glucocorticoids) for fetal
lung maturation received by the mother prior to delivery
5. Antibiotics received by the mother during labor
6. Clinical chorioamnionitis diagnosed during labor or maternal temperature > 38 C (100.4 F)
7. Moderate/heavy meconium staining of the amniotic fluid
8. Fetal intolerance of labor: (examples: in-utero resuscitative measures, further fetal assessment, or operative delivery)
9. Epidural or spinal anesthesia during labor
10. None of the above
72. VACCINES ADMINISTERED TO NEWBORN
1. Hepatitis B Date Given:
2. Other* Specify: Date Given:
73. APGAR SCORE
1 min 5 min 10 min
74. CONGENITAL ANOMALIES OF THE NEWBORN (Check all that apply.)
1. Anencephaly
2. Meningomyelocele/Spina bifida
3. Cyanotic congenital heart disease
4. Congenital diaphragmatic hernia
5. Omphalocele
6. Gastroschisis
7. Limb reduction defect (excluding congenital amputation and dwarfing syndromes)
8. Cleft Lip with or without Cleft Palate
9. Cleft Palate alone
10. Down Syndrome
Karyotype confirmed
Karyotype pending
11. Suspected chromosomal disorder
Karyotype confirmed
Karyotype pending
12. Hypospadias
13. Fetal alcohol syndrome
14. Other congenital anomalies (Specify)
15. None of the above
65. METHOD OF DELIVERY
1. Forceps attempted? Yes No Successful Yes No
2. Vacuum extraction attempted? Yes No Successful Yes No
3. Fetal presentation at delivery Cephalic Breech Other
4. Final route and method of delivery (check one)
Vaginal/spontaneous Vaginal/forceps Vaginal/vacuum
Cesarean, if cesarean was a trial of labor attempted? Yes No
69. MATERNAL MORBIDITY (Check all that apply.) (These are complications associated with labor and delivery.)
1. Maternal transfusion
2. Third or fourth degree perineal laceration
3. Ruptured uterus
4. Unplanned hysterectomy
5. Admission to intensive care unit
6. Unplanned operating room procedure following delivery
7. None of the above
Parent’s Telephone Number: ____________________
42

Form VS240 Rev. 05/01/2010 Pg 4 of 4
CHILD’S NAME MOTHER’S NAME
Test required by K.S.A. 65-153f 153G Serological Test Made:
1st 2nd 3rd (Trimester)
At Delivery Not Performed
If no test made, state reason:
Test required by K.S.A. 65-180 Infant Neonatal Screening specimen taken:
Yes No
Kit Number ____________________
If no test made, state reason:
Test required by K.S.A. 65-1157A Newborn Hearing Screening Accomplished:
Yes No
Infant’s patient number:
Infant’s Primary Care Physician
First Middle Last Title (MD, DO, etc.)
If screening accomplished, Date hearing screened / /
Month Day Year
The results of the hearing screening :
Right ear: Pass Left ear: Pass
Refer for further testing Refer for further testing
Physiologic equipment used : OAE AABR ABR
If screening not accomplished, one reason:
b – missed appointment
c – could not test
d – deceased
i – Incomplete test
m – Infant discharged before screening
n – transferred to NICU
o – other
r – did not consent
s – scheduled but not completed
t – transferred to another hospital
u – no information
x – invalid results
43
Kansas Department Of Health And Environment Office of Vital Statistics
CERTIFICATE OF DEATH State File Number
1. DECEDENT'S LEGAl NAME (Firs1. Middle Last)
1
2 SEX
1
3. IF FEMAlE NAME PRIOR TO FIRST MARRAIGE 14, DATE OF DEATH (Mon1h, Day, Year)
5. SOCIAL SECURITY NUMBER 6 DATE OF BIRTH 7a.AGE•Last Birthday 7b. UNDER 1 YEAR 7c UNDER 1 DAY 8. PLACE OF BIRTH (City and Stale or Foreign Coun1ry) (Month, Day Year) (Years) Months
I
Days Hours
I
Minutes
9. WAS DECEDENT EVER IN 10a. PLACE OF DEATH (Check only one) U.S ARMED FORCES?
D Inpatient DDoA D Nursing Home D Hospice Facility D Assls1ed Uving Facility HOSPITAl
DYes D No D Unknown D ER/Outpallen1 D Decedent's Residence D Other (Specify)
10b. FACILITY NAME (If nol lnstilution, give street and number)
1
10c COUNTY OF DEATH 10d. CITY OR TOWN OF DEATH
1
10a ZIP CODE
11. MARITAL STATUS 12. SURVIVING SPOUSE (If wife, give name before fiBI marriege) D Married D Married, but separa1ed Dw1dowed D Divorced D Never Married D Unknown
13a. RESIDENCE-STREET ADDRESS & APARTMENT NO. 13b. STATE
13c. COUNTY 13d.CITY OR TOWN 13e. ZIP CODE
1
131 INSIDE CITY LIMITS? D Yes D No D Unknown
14. FATHER'S NAME (First, Middle, Last)
1
15. MOTHER'S NAME PRIOR TO FIRST MARRIAGE (Fir.;t, Middle, Lasl)
16a. INFORMANT'S NAME (Flr.;t Middle Las1)
1
16b MAIUNG ADDRESS (Street and Number Clty Slale Zip Code) 16c. RELATIONSHIP TO DECEDENT
17. METHOD OF DISPOSITION 18a PLACE OF DISPOSITION (Name of cemetery, crematory, 18b. LOCATION-City or Town, and State D Burial D Cremation D Removal from Stale or o1her place)
D Donation D Entombmenl D Other (Specify)
19. FUNERAl SERVICE LICENSEE & LICENSE NO (Slgna1ure)
1
20 NAME OF EMBALMER & LICENSE NO.
;.
21. NAME AND ADDRESS OF FIRM
22. CAUSE OF DEATH -Part I. Enter the chain of events - d seases, Injuries. or compl.caUons-thal direcUy caused U,e death. 00 NOT enter terminal events such as cardiac arresl, respiralory arresl, or ventricular fibrillation without showing 1he etlology. 00 NOT ABBREVIATE En1er only ono cause on a line. Add addiUonal lines If necessary. Approximate Interval·
' Onsel to Death ' IMMEDIATE CAUSE (Final '
disease or condiUon resu!Ung a '
In dea1h) DUE TO (OR AS A CONSEQUENCE OF):
.
.
Sequentially 11st conditions. f b. .
any, loading to Immediate DUE TO (OR AS A CONSEQUENCE OF) : cause listed on line a Enter '
' the UNDERLYING CAUSE C
'
(disease or Injury thal Initiated DUE TO (OR AS A CONSEQUENCE OF) the events resulting in dealh) '
LAST. '
d. ' '
PART II Enter other significant conditions contributing to death, but not resulting In lhe 23a.AUTOPSY 23b.WERE AUTOPSY FINDINGS AVAILABLE 2Jc.WAS CORONER CONTACTED? unde�ying cause given In Part I. TO COMPLETE THE CAUSE OF DEATH?
Dves DNo DYes DNo D Unknown D Yes D No D Unknown D Unknown D Nol Applicable
24. DID TOBACCO USE 25. IF FEMALE 26. MANNER OF DEATH CONTRIBUTE TO DEA TH? D Not pregnant within pasl year D Not pregnant, bul pregnant 43 days to 1 year before dealh D Natural D Homicide
DYes D Probably D Pregnant at llme of deaU, D Unknown If pregnant within the last year D Accident D Pending Investigation
DNo D Unknown D Not pregnant but pregnant within 42 days or dealh D Suicide D Could not be de1ermined
27a. DATE OF INJURY 27b. T ME OF INJURY 27c INJURY AT WORK 27d. DESCRIBE HOW INJURY OCCURRED (Mon1h, Day, Year) A.M
Dves DNo P M
27e. PLACE OF INJURY-Residence farm. street. factory, building, etc (Specify)
1
271 LOCAT ON (Street and Number or Rural Route. City or Town. Slate. Zip Code)
28a. DATE PRONOUNCED DEAD 28b. TIME PRONOUNCED DEAD 28c ACTUAl OR PRESUMED 28d NAME OF PERSON PRONOUNCING DEATH (II applicable) 2Be. LICENSE NO (Month, Day, Year) TIME OF DEA TH
A.M AM. P.M P.M.
29a.CERTIFIER (Check only one) CJ Certifying physician - To the best ol my knowledge, deaUl occurred due to the cause(s) and manner stated. D Pronouncing & Certifying physician• To the best of my know1edge. death occurred al lhe time, date, and place, and due to the cause(S) and manner slated. CJ Coroner- On lho basis of examination and/or lnvesUgaUon In my opinion, death occurred at the time, da1e, and place, and due lo Ule cause(s) and manner staled
Signature of certifier ;.. LICENSE NO. DATE CERTIFIER SIGNED
29b. NAME, ADDRESS AND ZIP CODE OF PERSON COMPLETING CAUSE OF DEATH DM D Do.a D SPEC DEPUTY 30. DATE FILED BY STATE REGISTRAR (MonUl, Day, Year)
VS231 R"" 04/0112011
Sample
44
Sample
45

VS233 Rev. 05/01/2010
Kansas Department of Health and Environment Office of Vital Statistics
CERTIFICATE OF STILLBIRTH (FETAL DEATH)
State File Number
1. NAME (First, Middle, Last, Suffix) 2. DATE OF DELIVERY (Month, Day, Year) 3. TIME OF DELIVERY
M
4. SEX 5. CITY, TOWN, OR LOCATION OF DELIVERY 6. COUNTY OF DELIVERY
7. PLACE OF DELIVERY
Hospital Freestanding Birthing Center Home Delivery Clinic/Doctor’s Office Other (Specify)
8. FACILITY NAME (If not institution, give street and number and zip code)
9. MOTHER’S CURRENT LEGAL NAME (First, Middle, Last, Suffix) 10. MOTHER’S LAST NAME PRIOR TO FIRST MARRIAGE
11. DATE OF BIRTH (Month, Day, Year) 12. BIRTHPLACE (State, Territory, or Foreign Country) 13. PRESENT RESIDENCE-STATE
14. COUNTY 15. CITY, TOWN, OR LOCATION 16. STREET AND NUMBER OF PRESENT RESIDENCE
17. ZIPCODE 18. INSIDE CITY LIMITS?
Yes No
19. MOTHER’S MAILING ADDRESS (If same as residence, leave blank)
20. FATHER’S CURRENT LEGAL NAME (First, Middle, Last, Suffix) 21. DATE OF BIRTH (Month, Day, Year) 22. BIRTHPLACE (State, Territory, or Foreign Country)
23. I CERTIFY THAT THE PERSONAL INFORMATION PROVIDED ON THE CERTIFICATE IS CORRECT TO THE BEST OF MY KNOWLEDGE AND BELIEF.
Signature of Parent (or Other Informant)
24. DATE SIGNED (Month, Day, Year)
25. CAUSE/CONDITIONS CONTRIBUTING TO FETAL DEATH 25a. INITIATING CAUSE/CONDITION (Among the choices below, please select the one which most likely began the sequence of events resulting in the death of the fetus.)
Maternal Conditions/Diseases (Specify) Complications of Placenta, Cord, or Membranes – Rupture of membranes prior to onset of labor Abruptio placenta Placental insufficiency Prolapsed cord Chorioamnionitis Other (Specify)
Other Obstetrical or Pregnancy Complications (Specify) Fetal Injury (Specify) Other Fetal Conditions/Disorders (Specify)
Fetal Anomaly (Specify) Fetal Infection (Specify)
Unknown
25b. OTHER SIGNIFICANT CAUSES OR CONDITIONS (Select or specify all other conditions contributing to death in item 25a.)
Maternal Conditions/Diseases (Specify) Complications of Placenta, Cord, or Membranes – Rupture of membranes prior to onset of labor Abruptio placenta Placental insufficiency Prolapsed cord Chorioamnionitis Other (Specify)
Other Obstetrical or Pregnancy Complications (Specify) Fetal Injury (Specify) Other Fetal Conditions/Disorders (Specify)
Fetal Anomaly (Specify) Fetal Infection (Specify)
Unknown
26. ESTIMATED TIME OF FETAL DEATH Dead at time of first assessment, no labor ongoing Dead at time of first assessment, labor ongoing Died during labor, after first assessment Unknown time of fetal death
27a. WAS AN AUTOPSY PERFORMED? Yes No Planned
27b. WAS A HISTOLOGICAL PLACENTAL EXAMINATION PERFORMED? Yes No Planned
27c. WERE AUTOPSY OR HISTOLOGICAL PLACENTAL EXAMINATION RESULTS USED IN DETERMINING THE CAUSE OF FETAL DEATH? Yes No
28. I CERTIFY THAT THIS DELIVERY OCCURRED ON THE DATE STATED ABOVE AND THE FETUS WAS BORN DEAD.
Signature
29. DATE SIGNED (Month, Day, Year) 30. ATTENDANT’S NAME AND TITLE (If delivery not attended by physician) Name (Type) ________________________________________________________
CNM/CM Other Midwife Other (Specify)_____________________ 31. CERTIFIER’S NAME AND TITLE (Type)
M.D. D.O. Other (Specify)
32. CERTIFIER’S MAILING ADDRESS (Street and Number or Rural Route, City or Town, State, Zip Code)
33a. METHOD OF DISPOSITION
Burial Cremation Donation
Hospital Disposition Removal from State
Other (Specify)
33b. PLACE OF DISPOSITION (Name of cemetery, crematory, or other place) 33c. LOCATION (City or Town, and State)
34. FUNERAL DIRECTOR OR HOSPITAL ADMINISTRATOR
Signature
35. FIRM OR HOSPITAL NAME AND ADDRESS 36. DATE FILED BY STATE REGISTRAR (Month, Day, Year)
46
VS233 Rev. 05/01/2010 Pg 2 of 3
CONFIDENTIAL INFORMATION FOR INTERNAL USE ONLY
37. IF HOME DELIVERY, WAS DELIVERY PLANNED AT HOME? Yes No Unknown 38. MOTHER’S MEDICAL RECORD NO.
39a. WAS MOTHER EVER MARRIED? Yes No Unknown 39b. MOTHER MARRIED? (At birth, conception or any time between) Yes No Unknown
40. PARENT’S HISPANIC ORIGIN (Check the box or boxes that best describes whether the parent is Spanish, Hispanic, or Latino. Check the “no” box if the parent is not Spanish, Hispanic, or Latino.)
41. PARENT’S RACE (Check one or more races to indicate what you consider yourself to be.)
41a. MOTHER 41b. FATHER
40a. MOTHER-
No, not Spanish/ Hispanic/Latina
Yes, Mexican/Mexican American/Chicana
Yes, Puerto Rican
Yes, Cuban
Yes, Central American
Yes, South American
Yes, other Spanish/ Hispanic/Latina (Specify)
Unknown
40b. FATHER-
No, not Spanish/ Hispanic/Latino
Yes, Mexican/Mexican American/Chicano
Yes, Puerto Rican Yes, Cuban Yes, Central American Yes, South American Yes, other Spanish/
Hispanic/Latino (Specify)
Unknown
White Black or African
American American Indian or
Alaska Native (Name of the enrolled or principal tribes)
Asian Indian Chinese Filipino Japanese
Korean Vietnamese Other Asian
(Specify)
Native Hawaiian Guamanian or
Chamorro Samoan Other Pacific Islander
(Specify)
Other (Specify)
Unknown
White Black or African
American American Indian or
Alaska Native (Name of the enrolled or principal tribes)
Asian Indian Chinese Filipino Japanese
Korean Vietnamese Other Asian
(Specify)
Native Hawaiian Guamanian or
Chamorro Samoan Other Pacific Islander
(Specify)
Other (Specify)
Unknown
42. ANCESTRY - What is the parents’ ancestry or ethnic origin?- Italian, German, Dominican, Vietnamese, Hmong, French Canadian, etc. (Specify below)
43. OCCUPATION AND BUSINESS/INDUSTRY
Occupation Business/Industry (Do not give name of company.)
42a. MOTHER 43a. MOTHER (Most recent) 43c. MOTHER
42b. FATHER 43b. FATHER (Usual) 43d. FATHER
44. EDUCATION (Check the box that best describes the highest degree or level of school completed at the time of delivery.) 44a. MOTHER’S EDUCATION 8th grade or less 9th - 12th grade, no diploma High school graduate or GED Some College credit, but no degree Associate degree (e.g., AA,AS) Bachelor’s degree (e.g., BA, AB, BS)
Unknown Master’s degree (e.g., MA, MS, MEng, MEd, MSW, MBA) Doctorate (e.g., PhD, EdD) or Professional degree (e.g., MD, DDS, DVM, LLB, JD)
44a. FATHER’S EDUCATION 8th grade or less 9th - 12th grade, no diploma High school graduate or GED Some College credit, but no degree Associate degree (e.g., AA,AS) Bachelor’s degree (e.g., BA, AB, BS)
Unknown Master’s degree (e.g., MA, MS, MEng, MEd, MSW, MBA) Doctorate (e.g., PhD, EdD) or Professional degree (e.g., MD, DDS, DVM, LLB, JD)
45. PREVIOUS LIVE BIRTHS (Do not include this child.)
46. NUMBER OF OTHER OUTCOMES (Spontaneous or induced losses or ectopic or stillbirth pregnancies)
47. PLURALITY – Single, Twin, Triplet, etc. (Specify)
48. IF NOT A SINGLE BIRTH – Born First, Second, Third, etc. (Specify)
45a. Now living Number None
45b. Now dead Number None
46a. Before 20 weeks Number
None
46b. 20 weeks & over Number
None
49. DATE LAST NORMAL MENSES BEGAN (Month, Day, Year)
50. OBSTETRIC ESTIMATE OF GESTATION (Completed Weeks)
45c. DATE OF LAST LIVE BIRTH (Month, Year)
46c. DATE OF LAST OTHER PREGNANCY OUTCOME (Month, Year)
51. WEIGHT OF FETUS (grams)
52. PRENATAL CARE?
Yes No
53. DATE OF FIRST PRENATAL CARE VISIT (Month, Day, Year)
54. DATE OF LAST PRENATAL CARE VISIT (Month, Day, Year)
55. PRENATAL VISIT – Total number (If none, enter “0”)
56. CIGARETTE SMOKING BEFORE & DURING PREGNANCY: Did mother smoke 3 mos. before or during pregnancy? Yes No Unknown
For each time period, enter either the number of cigarettes or the number of packs of cigarettes smoked per day. If none, enter “0". Average number of cigarettes or packs of cigarettes smoked per day:
No. No. Three months before pregnancy: cigarettes or packs First three months of pregnancy: cigarettes or packs Second three months of pregnancy: cigarettes or packs Third Trimester of pregnancy: cigarettes or packs
57. PRINCIPAL SOURCE OF PAYMENT FOR THIS DELIVERY
Medicaid Private/Employer Ins. Self-pay
Indian Health Service CHAMPUS/TRICARE Other government
Other Unknown
58a. MOTHER TRANSFERRED IN FOR DELIVERY DUE TO MATERNAL, MEDICAL, OR FETAL INDICATIONS? Yes No (If yes, enter facility name)
58b. FACILITY TRANSFERRED FROM:
CHILD’S NAME MOTHER’S NAME
47
VS233 Rev. 05/01/2010 Pg 3 of 3
PRENATAL LABOR-DELIVERY/STILLBORN FETUS
59. NUTRITION OF MOTHER
1. Height 2. Prepregnancy
Weight 3. Weight at delivery 4. Did mother get WIC food for
herself? Yes No Unknown
62. MATERNAL MORBIDITY (Check all that apply.) (These are complications associated with labor and delivery.)
1. Maternal transfusion
2. Third or fourth degree perineal laceration
3. Ruptured uterus
4. Unplanned hysterectomy
5. Admission to intensive care unit
6. Unplanned operating room procedure following delivery
7. None of the above
60. MEDICAL RISK FACTORS (Check all that apply.)
1. Diabetes, prepregnancy 2. Diabetes, gestational 3. Hypertension
Prepregnancy (Chronic) Gestational (PIH, preeclampsia) Eclampsia
4. Previous preterm birth 5. Other previous poor pregnancy outcome (SGA, perinatal death, etc.) 6. Vaginal bleeding during this pregnancy prior to labor 7. Pregnancy resulted from infertility treatment (If yes, check all that apply.)
Fertility-enhancing drugs, Artificial insemination or Intrauterine insemination
Assisted reproductive technology (e.g. in vitro fertilization (IVF), gamete intrafallopian transfer (GIFT))
8. Mother had a previous cesarean delivery, if yes, how many Number
9. Alcohol use No. of drinks per week: ______ 10. None of the above
63. INFECTIONS PRESENT AND/OR TREATED (During this pregnancy, check all that apply.)
1. Gonorrhea
2. Syphilis
3. Herpes Simplex Virus (HSV)
4. Chlamydia
5. Listeria
6. Group B Streptococcus
7. Cytomeglovirus
8. Parvo virus
9. Toxoplasmosis
10. AIDS or HIV antibody
11. None of the above
12. Other (Specify) _____________________
61. METHOD OF DELIVERY
1. Forceps attempted? Yes No Successful: Yes No
2. Vacuum extraction attempted? Yes No Successful: Yes No
3. Fetal presentation at delivery Cephalic Breech Other
4. Final route and method of delivery (check one)
Vaginal/spontaneous Vaginal/forceps Vaginal/vacuum
Cesarean, if cesarean was a trial of labor attempted? Yes No
5. Hysterotomy/Hysterectomy Yes No
64. CONGENITAL ANOMALIES OF THE NEWBORN (Check all that apply.)
1. Anencephaly
2. Meningomyelocele/Spina bifida
3. Cyanotic congenital heart disease
4. Congenital diaphragmatic hernia
5. Omphalocele
6. Gastroschisis
7. Limb reduction defect (excluding congenital amputation and dwarfing syndromes)
8. Cleft Lip with or without Cleft Palate
9. Cleft Palate alone
10. Down Syndrome
Karyotype confirmed
Karyotype pending
11. Suspected chromosomal disorder
Karyotype confirmed
Karyotype pending
12. Hypospadias
13. Fetal alcohol syndrome
14. Other congenital anomalies (Specify)
15. None of the above
THIS IS NOT PART OF THE CERTIFICATE OF STILLBIRTH
Test required by K.S.A. 65-153F, 153G
Serological Test Made: _____ 1st _____ 2nd _____ 3rd (Trimester) _____ At Delivery _____ Not Performed
If no test made, state reason: ____________________________________________________
48