selected sociodemographic aspects of costa rican … · selected sociodemographic aspects of costa...
TRANSCRIPT
43
Chapter Three
Selected Sociodemographic Aspects of Costa Rican Residents from the united States, Canada, and Europe According
to the 2000 CensusFlora V. Calderón and Roger E. Bonilla1
It is a well-known fact that in recent decades, within the context of a second wave of globalization (Solinamo 2004), international migration has not only increased its pace, but also diversified in its forms, the categories of im-migrants, and their destinations. The increase in human mobility parallels contemporary globalization processes which intensify economic opportunity, mobilization of capital, and unprecedented development of technology and information systems. Because of that, the present globalization cycle is nu-anced, among other aspects, by new technologies in transportation and tele-communications which have attenuated the cost of mobilization and which form a complex system of transnational social networks that maintain close ties between immigrants and the residents of their communities of origin (Pellegrino 2003).
The great diversity of migratory experiences and the different levels of analysis converge in the absence of a uniform theoretical framework in the ample literature dealing with contemporary migrations. However, Alejandro Portes (1997) affirms that the foundations of that migration are rooted in eco-nomic policy, nurtured by macro-structural inequalities, because of both the job market between countries and regions and the micro-structures of support created by the immigrants themselves across political borders.
Within this ample framework, researchers in different disciplines have dedicated part of their efforts toward explaining, on one hand, the motives which impel migration across national borders and the subsequent migra-tory flows, taking note of the direction, length of stay, and composition of the migrations. The motives tend to be classified into economic (job search) and political (search for refuge and exile), but migratory movements are also motivated by education, recreation, and family reunion. Those migratory
movements most studied are those that follow the path of developing econo-mies toward more developed economies (South-North) and those within the same region (South-South), usually between bordering countries. There are also North-South migrations, which are the subject of this article. This third type of migration, characterized by increasing migratory flows from countries which are traditionally receptors of immigrants, is a phenomenon which is characteristic of contemporary migration and reflects the dynamics, present in the globalized world, of the mobility of a population working in highly skilled jobs. Countries such as Australia, New Zealand, and the United Kingdom, for example, are examining the loss, whether real or perceived, of highly trained workers and planning strategies for attracting those who have emigrated (Omelaniuk and Weiss 2005).
These migrations include everything from the classic mode of permanent migration to a circular mode of migration of several durations; due to advances in means of transportation and communication, the latter type has increased dramatically in recent decades (Hugo 2003). Researchers have documented the fact that migration is a selective process, and that, at present, migration which is motivated by economics is polarized between two extremes in the job market: immigrants with very little specialized skill and those who are highly specialized (Pellegrino and Martínez 2001, Hugo 2003). It should be emphasized that this polarization is partly due to the inconsistency of liberal discourse which foments the mobilization of capital and merchandise but restricts the mobilization of workers.
On the other hand, one of the tendencies in studies about migration aims at analyzing both integration strategies and processes and the repercussions of migration on the destination countries. From this line of inquiry we get a literature based on the concepts of transnational communities and diaspora, which take into account the multiplicity of residence of immigrants, highlight the contributions of the migration to the development of their communities of origin through remittances and circulation of knowledge and skills, and destroy any increase in xenophobia in the receptor countries (Portes 1997, Sandoval 2004).
Analysis of the bibliography concerning migrations makes it clear that the theories and concepts based on the migratory flows of the end of the nineteenth century, as well as the paradigms of permanent migration and assimilation, are no longer valid (Portes 1997, Puga 2001, Hugo 2003, Omelaniuk and Weiss 2005). Australian geographer Graeme Hugo (2003) affirms the need for conceptual analyses that capture transnational hyper-mobility and for empirical studies that highlight the presence of circular immigrants and their social, cultural, economic and political impact on the receptor societies.
44 Selected Sociodemographic Aspects of Costa Rican Residents
Within the context of Latin America and the Caribbean, the key role played by global, capitalist expansion in precipitating migratory movements can be seen in the three main migratory patterns which coexist in the region: 1) immigration overseas, mostly from Europe from the colonial period until the 1970s; 2) intraregional migration, facilitated by geographic and cultural proximity rooted in the historical social and economic heterogeneity among the countries of the region; 3) emigration from the region, mainly toward the United States and Canada (Hamilton et al. 2005). The migrant move-ment from Europe, which was important in the formation of the societies of the region, stopped being of numerical importance in the mid-twentieth century. The second migratory flow is made up of people within the coun-tries of the region, especially those sharing borders, and is an integral part of the development of Latin American and Caribbean countries. The third migratory flow, and the most important at this time numerically speaking, is represented by migration outside the region. The bulk of regional emigration is directed toward the United States, where Latin American immigrants and their descendents have been the largest minority since the beginning of the twenty-first century.
Some studies on Latin America tend to emphasize unskilled migration be-cause of its importance as the largest migratory flow, numerically speaking. However, as of the 1970s, and with even greater intensity as of the 1990s, concern has arisen in the region over the migration of skilled workers toward more developed countries. In the second wave of globalization, the more highly developed economies compete for professionals in information tech-nologies and communications, among others, from developing economies. The ruling concept is the “brain drain,” and the tenor of the discussions turns negative upon perceiving the departure of skilled personnel as a threat to the critical mass of knowledge which can maximize national competitiveness (Martínez 2005).
Recently, however, within the debate on the connections between in-ternational migration and economic development, there has been renewed analytical interest in possible benefits, such as the exchange and circulation of highly qualified individuals (ibid.). The key question is no longer whether migration is harmful or not for development, but rather how to take advantage of migration to benefit both the sender countries and the receptor countries.
Within this line of inquiry studies have emerged on circular movements of people in modalities of mass tourism and the international migratory flow of retired emigrants. Previous to this literature were studies from the 1970s analyzing migrations within the United States of retired residents from the northern states toward southern states. Those studies document that retir-ees opt for residential mobility in search of better climates, areas of natural
Flora V. Calderón and Roger E. Bonilla 45
beauty, intercultural experiences, good services and low prices, and favorable policies on visas, taxes, and properties. This migratory flow can be classified as “amenity migrants” (Dixon, Murray, and Gelatt 2006).
On the international scene, the scarcity of appropriate data and the diffi-culty in conceptualizing movement beyond the classic scopes of permanent job migration have limited analysis (Hugo 2003). However, it is known that changes in job patterns and improvements in health facilitate people opting for a strategy of residential mobility in their later years of life (Puga 2001). The main international movements of retirees in Europe follow the North-South path, from Great Britain to the United States and Australia; in the Americas, movements go from Canada to the southern states of the United States and from North America toward Central America and the Caribbean (ibid.) This migration of retirees may be permanent, seasonal, or circular, and when they settle in rural areas of developed economies or in communities in developing countries, their presence constitutes a significant source of direct foreign investment, through which they contribute to the developmental ef-forts of other countries. Foreign retirees, for example, buy or rent houses, provide work for locals, consume goods and services, and attract more invest-ment and tourism to areas where there are concentrations of retired people (Dixon, Murray, and Gelatt 2006).
People who opt for immigrating to other countries once their working years are over tend to do so for the same reasons that studies showed for the case of the United States. It needs to be pointed out that in the early literature on in-ternational retirement migration (IRM), there are few studies on those people from the United States, Canada and Europe who choose to retire and move to Latin America. This is true despite the intensification in the migratory flow from the United States that is expected as baby boomers (its most numerous generation) grow older and enter retirement age.
In view of contributing to the understanding of this type of migration, the Migration Policy Institute in Washington published a report on retired citi-zens from the United States in Mexico and Panama; both countries receive a large proportion of the retirees who emigrate from the United States (Dixon, Murray, and Gelatt 2006). The document reports that retired immigrants liv-ing outside the United States form part of a hypermobile segment of the U.S. population seeking entertainment. Interviews carried out by Dixon, Murray, and Gelatt (2006) with retired emigrants in Mexico and Panama revealed that they move to places where there is an established migratory flow and that many of them look for support and information in the immigrant networks of the receptor countries.
In this article we set our sights on Costa Rica, a country which is histori-cally a receptor country for immigrants. Costa Rica hosts large contingents
46 Selected Sociodemographic Aspects of Costa Rican Residents
of immigrants from Central America who were displaced by armed con-flicts in the 1970s and 1980s (Barquero and Vargas 2004). Since the mid-twentieth century, the largest group of foreigners in Costa Rica has been the Nicaraguans. Previously, the largest group was the Jamaican immigrants, who in the 1927 census constituted 39 percent of the foreign population; at that time, Nicaraguans were 24 percent of that population (Brenes 1999, p. 3). By the year 2000, people born in Nicaragua represented more than 76 percent of the resident foreign population in Costa Rica. Consequently, documentation and analysis of the different waves of immigration from that neighboring country predominate in academic circles, in mass media, and in popular discourse (ibid.).
In parallel fashion, there are few studies in Costa Rica on the immigra-tion of people from high-income countries. One noteworthy exception is the study carried out by Dolores Puga (2001) on the immigration of retirees from the United States, based on the population census of 1984 and on fieldwork carried out in 1998. The author observed that increasing tourist development in Costa Rica, in conjunction with the country’s international reputation due to its political stability, good standard of living, and low level of violence and crime, has facilitated incorporation of this country as a top destination in international movements of retirees. With data from the 1984 census, from the Costa Rican Institute of Tourism for 1988 (9,370 registered retirees), and the Association of Residents in Costa Rica (20,000 people registered from the United States and Canada), Puga calculated that the number of retirees from the United States was higher per capita than in Mexico, the principal destina-tion in absolute terms.
Immigrants from the United States, Canada and Europe in Costa Rica form part of the diverse migratory types and destinations that characterize this century. According to the IX National Population and Housing Census 2000, people from the United States and Canada in Costa Rica constitute the second largest group, numerically speaking (10,568), and Europeans the fifth group (6,711). In this study, we have taken on the task of quantifying some socio-demographic and socioeconomic aspects of these two “threads of the cultural fabric” of Costa Rica (Murillo 2004) in light of official population statistics.
MAtERIAlS And MEthOdS
Analysts of international migration emphasize both the difficulty of defining and putting into operation adequate sources of information and their scarcity (Brenes 1999). International migration is a dynamic process that intersects different modalities which are not always captured by traditional sources of
Flora V. Calderón and Roger E. Bonilla 47
demographic information. Population censuses, one of the sources most used, present several methodological limitations in studying migrations, among which are the following: 1) they under-register undocumented immigrants; 2) they do not provide information on the immigrants’ migratory status; 3) they under-register temporary residents; 4) they record only accumulated numbers of immigrants but not the migratory flows; analysis of these factors would foster analysis of migration as an event and as a process (Hugo 2003). Nevertheless, population censuses continue to be the most reliable sources for studying migration (Barquero and Vargas 2004).
The data for this study are taken from the results of the 2000 Census and the calculations were effected using version 8 of the STATA program (StataCorp 2005). In this article, we group the foreigners from the United States and Canada into a single group called U.S.-Canadian. In order to define U.S.-Canadian, question 4 of the Census was used, which inquires about the mother’s place of residence at the time the birth of the person being interviewed. A U.S.-Canadian, then, is a person whose mother, at the time of birth of the interviewee, resided in the United States or Canada. In order to define European, once again the mother’s place of residence at the time of birth of the person being interviewed was used, as well as the fifteen countries which constituted the European Union in 2000: Germany, Austria, Belgium, Denmark, Spain, Finland, France, United Kingdom, Greece, The Netherlands (Holland), Ireland, Italy, Luxemburg, Portugal and Sweden.
It is important to point out that the Census only includes permanent resi-dents, not tourists or temporary residents. Because of the obligatory nature of the Census, all those habitual residents who live in collective housing (hotels, jails, convents, etc.) were also included.
SOCIOdEMOgRAPhIC ASPECtS
Quantification and Evolution
In this first instance, through the question about place of birth, a sociodemo-graphic profile was constructed of the residents born in the United States and Canada and in the member nations of the European Union in the year 2000. In this article, the terms “immigrant,” “foreign-born resident,” and “foreign resident” are all used to describe the target population.
Table 3.1 presents the data corresponding to immigration to Costa Rica, according to national censuses from 1927 to 2000. The foreign-born popu-lation, in absolute numbers, decreased progressively from the beginning of the twentieth century until mid-century, but it increased as of 1973. Be-
48 Selected Sociodemographic Aspects of Costa Rican Residents
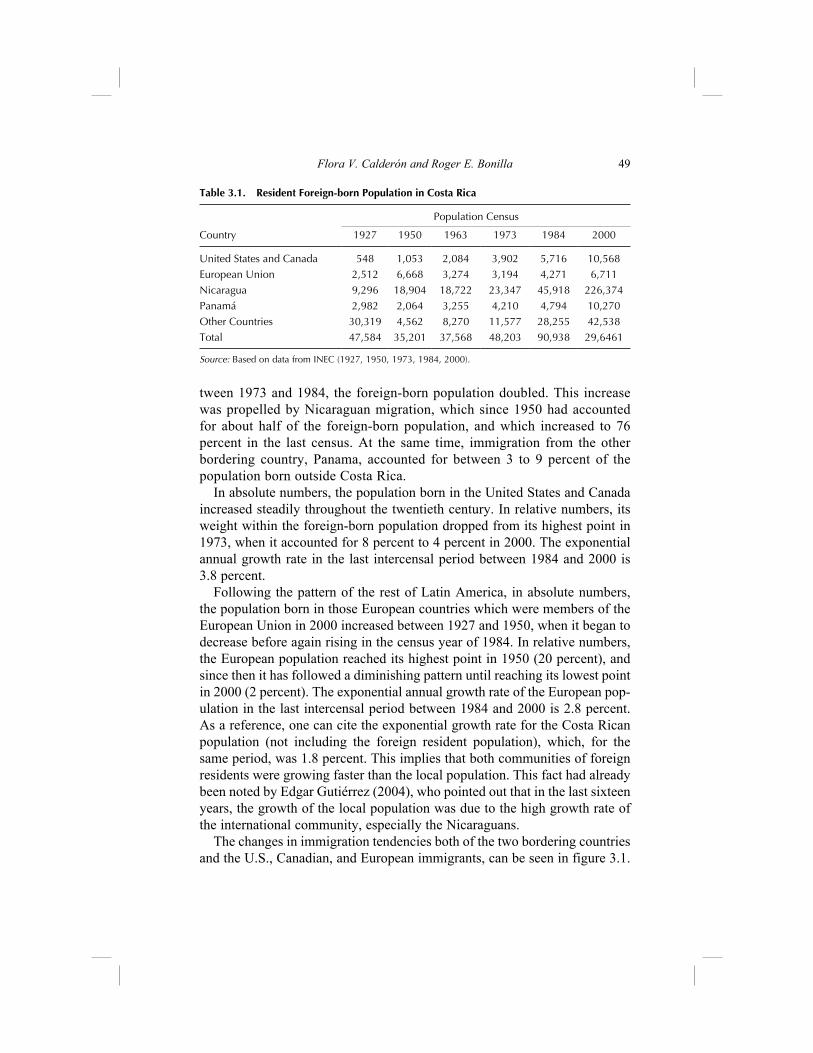
tween 1973 and 1984, the foreign-born population doubled. This increase was propelled by Nicaraguan migration, which since 1950 had accounted for about half of the foreign-born population, and which increased to 76 percent in the last census. At the same time, immigration from the other bordering country, Panama, accounted for between 3 to 9 percent of the population born outside Costa Rica.
In absolute numbers, the population born in the United States and Canada increased steadily throughout the twentieth century. In relative numbers, its weight within the foreign-born population dropped from its highest point in 1973, when it accounted for 8 percent to 4 percent in 2000. The exponential annual growth rate in the last intercensal period between 1984 and 2000 is 3.8 percent.
Following the pattern of the rest of Latin America, in absolute numbers, the population born in those European countries which were members of the European Union in 2000 increased between 1927 and 1950, when it began to decrease before again rising in the census year of 1984. In relative numbers, the European population reached its highest point in 1950 (20 percent), and since then it has followed a diminishing pattern until reaching its lowest point in 2000 (2 percent). The exponential annual growth rate of the European pop-ulation in the last intercensal period between 1984 and 2000 is 2.8 percent. As a reference, one can cite the exponential growth rate for the Costa Rican population (not including the foreign resident population), which, for the same period, was 1.8 percent. This implies that both communities of foreign residents were growing faster than the local population. This fact had already been noted by Edgar Gutiérrez (2004), who pointed out that in the last sixteen years, the growth of the local population was due to the high growth rate of the international community, especially the Nicaraguans.
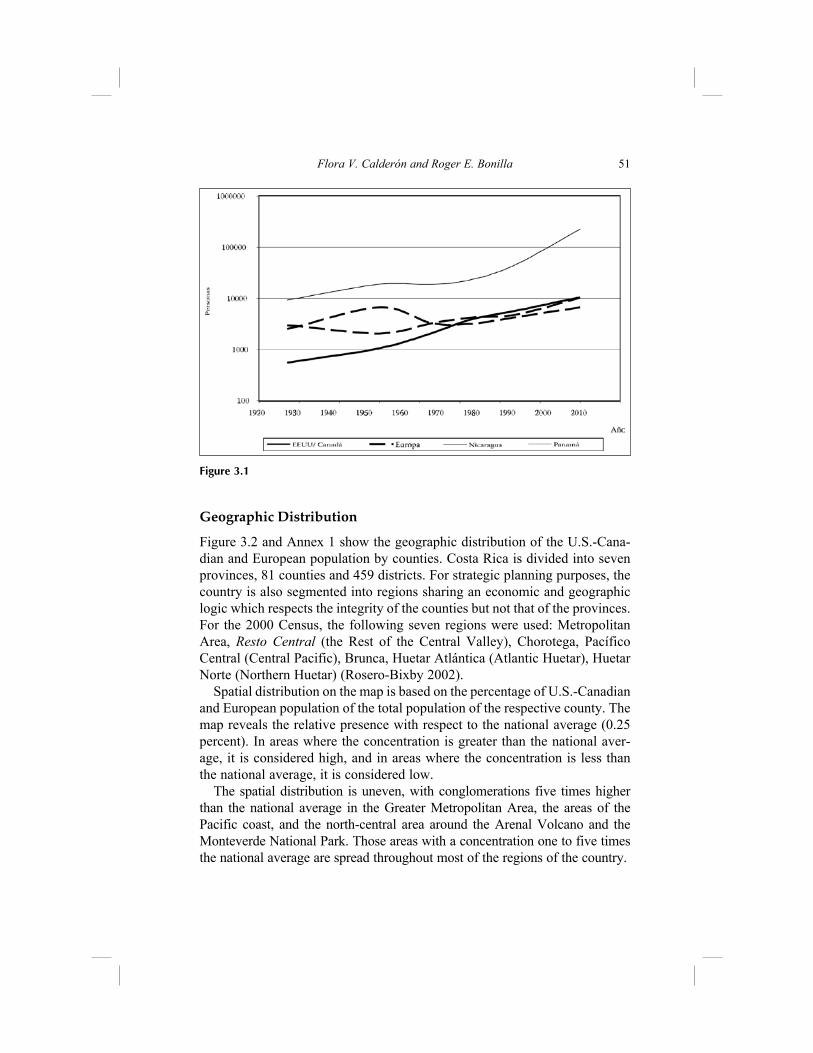
The changes in immigration tendencies both of the two bordering countries and the U.S., Canadian, and European immigrants, can be seen in figure 3.1.
Flora V. Calderón and Roger E. Bonilla 49
Table 3.1. Resident Foreign-born Population in Costa Rica
Population Census
Country 1927 1950 1963 1973 1984 2000
United States and Canada 548 1,053 2,084 3,902 5,716 10,568European Union 2,512 6,668 3,274 3,194 4,271 6,711Nicaragua 9,296 18,904 18,722 23,347 45,918 226,374Panamá 2,982 2,064 3,255 4,210 4,794 10,270Other Countries 30,319 4,562 8,270 11,577 28,255 42,538Total 47,584 35,201 37,568 48,203 90,938 29,6461
Source: Based on data from INEC (1927, 1950, 1973, 1984, 2000).
In the last census in 2000, the number of foreign residents increased to a total of 296,461 people, which represented 7.8 percent of the registered popula-tion. That year, the population of U.S.-Canadian and European residents was 17,279 people (10,568 and 6711, respectively). This accounts for 4.6 per thousand of the total population of Costa Rica (2.8 per thousand and 1.8 per thousand, respectively), and 5.8 percent of the foreign population in the country (3.5 percent and 2.2 percent, respectively).
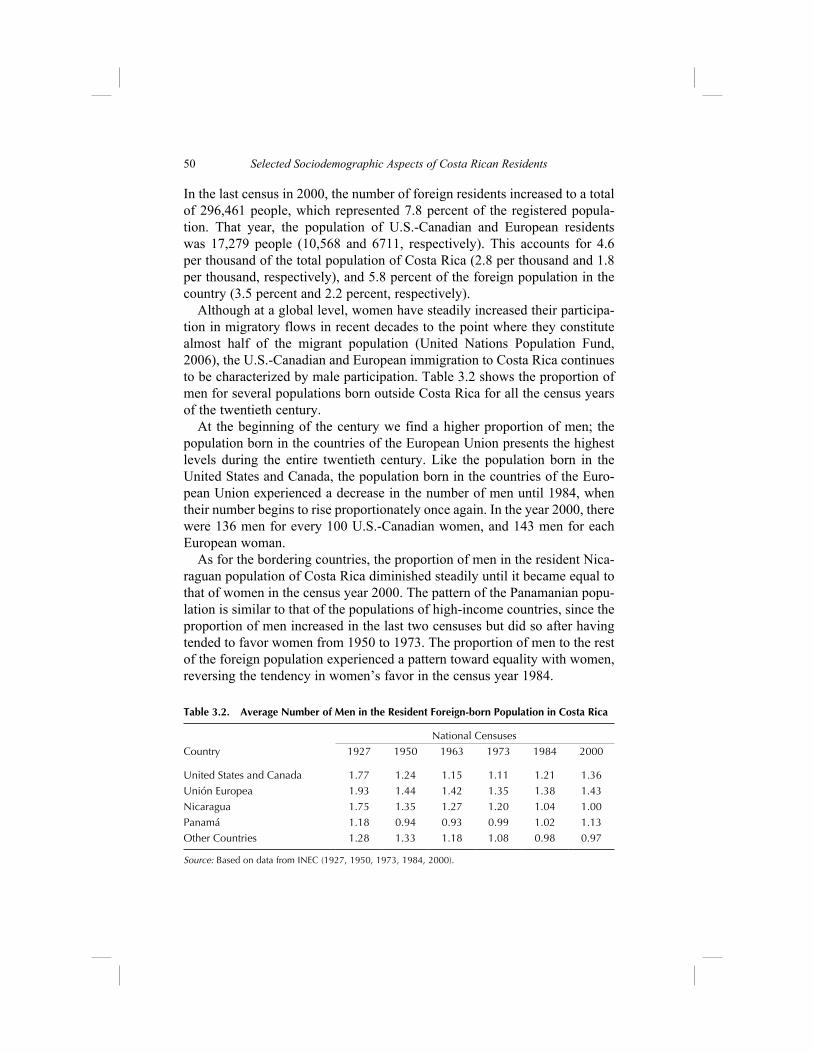
Although at a global level, women have steadily increased their participa-tion in migratory flows in recent decades to the point where they constitute almost half of the migrant population (United Nations Population Fund, 2006), the U.S.-Canadian and European immigration to Costa Rica continues to be characterized by male participation. Table 3.2 shows the proportion of men for several populations born outside Costa Rica for all the census years of the twentieth century.
At the beginning of the century we find a higher proportion of men; the population born in the countries of the European Union presents the highest levels during the entire twentieth century. Like the population born in the United States and Canada, the population born in the countries of the Euro-pean Union experienced a decrease in the number of men until 1984, when their number begins to rise proportionately once again. In the year 2000, there were 136 men for every 100 U.S.-Canadian women, and 143 men for each European woman.
As for the bordering countries, the proportion of men in the resident Nica-raguan population of Costa Rica diminished steadily until it became equal to that of women in the census year 2000. The pattern of the Panamanian popu-lation is similar to that of the populations of high-income countries, since the proportion of men increased in the last two censuses but did so after having tended to favor women from 1950 to 1973. The proportion of men to the rest of the foreign population experienced a pattern toward equality with women, reversing the tendency in women’s favor in the census year 1984.
50 Selected Sociodemographic Aspects of Costa Rican Residents
Table 3.2. Average Number of Men in the Resident Foreign-born Population in Costa Rica
National CensusesCountry 1927 1950 1963 1973 1984 2000
United States and Canada 1.77 1.24 1.15 1.11 1.21 1.36Unión Europea 1.93 1.44 1.42 1.35 1.38 1.43Nicaragua 1.75 1.35 1.27 1.20 1.04 1.00Panamá 1.18 0.94 0.93 0.99 1.02 1.13Other Countries 1.28 1.33 1.18 1.08 0.98 0.97
Source: Based on data from INEC (1927, 1950, 1973, 1984, 2000).
geographic distribution
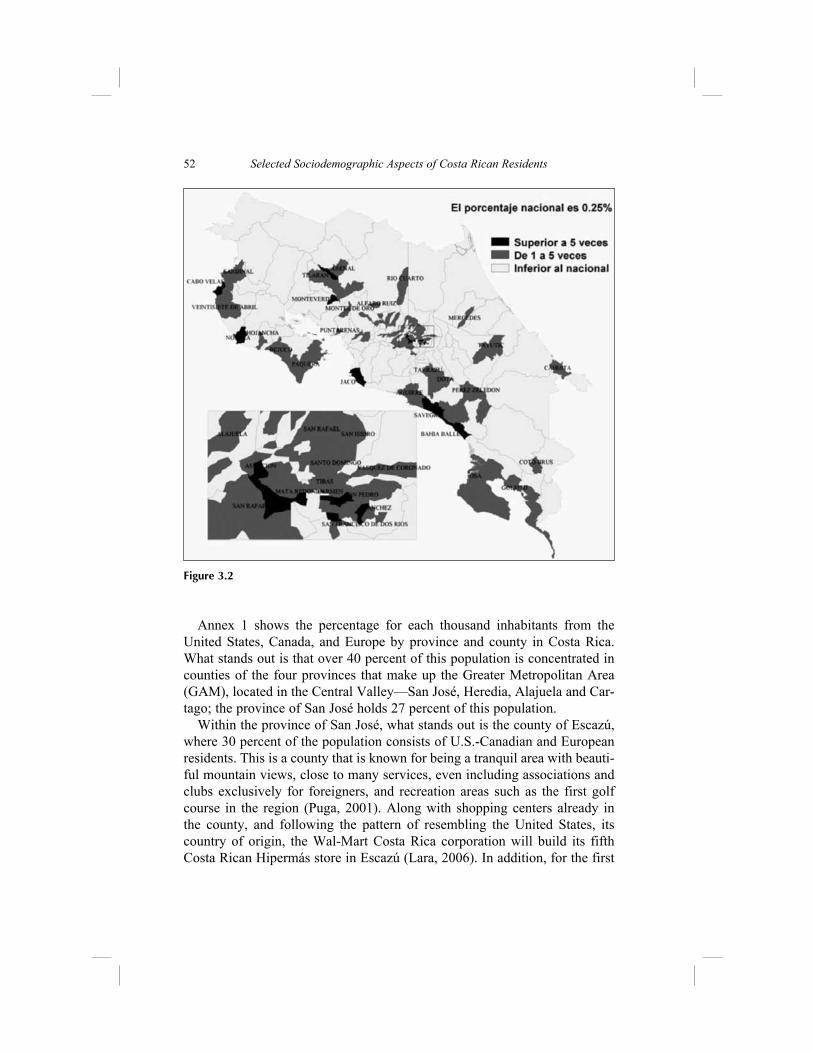
Figure 3.2 and Annex 1 show the geographic distribution of the U.S.-Cana-dian and European population by counties. Costa Rica is divided into seven provinces, 81 counties and 459 districts. For strategic planning purposes, the country is also segmented into regions sharing an economic and geographic logic which respects the integrity of the counties but not that of the provinces. For the 2000 Census, the following seven regions were used: Metropolitan Area, Resto Central (the Rest of the Central Valley), Chorotega, Pacífico Central (Central Pacific), Brunca, Huetar Atlántica (Atlantic Huetar), Huetar Norte (Northern Huetar) (Rosero-Bixby 2002).
Spatial distribution on the map is based on the percentage of U.S.-Canadian and European population of the total population of the respective county. The map reveals the relative presence with respect to the national average (0.25 percent). In areas where the concentration is greater than the national aver-age, it is considered high, and in areas where the concentration is less than the national average, it is considered low.
The spatial distribution is uneven, with conglomerations five times higher than the national average in the Greater Metropolitan Area, the areas of the Pacific coast, and the north-central area around the Arenal Volcano and the Monteverde National Park. Those areas with a concentration one to five times the national average are spread throughout most of the regions of the country.
Flora V. Calderón and Roger E. Bonilla 51
Figure 3.1
Annex 1 shows the percentage for each thousand inhabitants from the United States, Canada, and Europe by province and county in Costa Rica. What stands out is that over 40 percent of this population is concentrated in counties of the four provinces that make up the Greater Metropolitan Area (GAM), located in the Central Valley—San José, Heredia, Alajuela and Car-tago; the province of San José holds 27 percent of this population.
Within the province of San José, what stands out is the county of Escazú, where 30 percent of the population consists of U.S.-Canadian and European residents. This is a county that is known for being a tranquil area with beauti-ful mountain views, close to many services, even including associations and clubs exclusively for foreigners, and recreation areas such as the first golf course in the region (Puga, 2001). Along with shopping centers already in the county, and following the pattern of resembling the United States, its country of origin, the Wal-Mart Costa Rica corporation will build its fifth Costa Rican Hipermás store in Escazú (Lara, 2006). In addition, for the first
52 Selected Sociodemographic Aspects of Costa Rican Residents
Figure 3.2

time in Costa Rica, this locale will follow the design used by that chain in the United States. Carmen Murillo (2004) suggests that the presence of associa-tions, churches, and cultural centers, among others, is evidence of the explicit interest of these sectors in tightening internal bonds as a differentiated com-munity and in making themselves more visible to Costa Rican society. Puga (2001) similarly asserts that the county of Escazú has become a true enclave where one can speak of a U.S.-Canadian colony. Given the high presence of European emigrants in the county, it could likewise be said that there is also a European colony.
This residential concentration of people from the United States, Canada, and Europe fits with the rest of the national population. According to data from the 2000 census, 53 percent of the total population lives in the GAM. The GAM constitutes the principal urban region of Costa Rica and holds the economic and political power of the country. This region has 85 percent of the industries and the best indicators of basic-needs fulfillment in the entire country (Ministerio de la Vivienda y Asentamiento Humanos [MIVAH] [Ministry of Housing and Human Settlement], 2006). Conditions in the GAM attract migratory flows seeking entertainment, which look for good services and job possibilities for skilled labor. It is worth noting that the concentration of U.S.-Canadian and European residents in the GAM in the year 2000 rep-resented a continuation of the residential pattern of retirees from the United States which appeared in the census year of 1984 (Puga, 2001).
In the Costa Rican GAM, unlike other urban areas in Latin America, there is no spatial ethnic segregation. However, there is segregation by socioeconomic group, where poverty and wealth are the deciding factors. According to the 2000 Census, there are 12 agglomerations of high-income families (MIVAH, 2006). These agglomerations are located in areas with good services and infrastructure and coincide with those areas with the greatest concentration of U.S.-Canadian and European residents. Of these twelve agglomerations, Escazú, Montes de Oca, Belén, and Curridabat stand out as having, respectively, 30 percent, 22.8 percent, 16.2 percent, and 10.5 percent, U.S.-Canadian- and European-born foreigners for every 1,000 inhabitants.
Outside the GAM, foreign population concentrations are found in those areas of tourist development along the Central Pacific, Northern Pacific, and Southern Atlantic coasts. In recent years, these areas have experienced accelerated growth in real estate and services; a quick Internet search gives evidence of this development. Fishing villages in these areas are being sur-rounded or displaced by luxury tourist areas around grandiose hotels and resi-dential zones. This development has been fomented, in good measure, by the demands of foreign residents looking for refuge in this “tropical paradise.”
Flora V. Calderón and Roger E. Bonilla 53

In the Central Pacific area, in the Puntarenas province, where 5 percent of the U.S.-Canadians and Europeans live, most are situated in the counties of Garabito and Aguirre, 22 percent and 14 percent, respectively. The districts of Jacó, in Garabito, and Savegre, in Aguirre, have more than five times the distribution of U.S.-Canadians and Europeans in Costa Rica. The beaches of this area are very popular because they are the closest to the capital on the Pacific coast. Along the southern part of this coast there are concentrations of U.S.-Canadians and Europeans five times the national average, specifically in the counties of Osa and Golfito.
In the Northern Pacific, in the province of Guanacaste, where 3 percent of the population of U.S.-Canadians and Europeans live, the greatest con-centration is found in those counties with extensive beaches: the counties of Carrillo (9 percent) and Santa Cruz (8 percent). In the 1984 census, this was already evident in the incipient concentration of residential settlements and hotel development around the Golfo de Papagayo (Puga 2001). The distribution of population groups of U.S.-Canadians and Europeans is not completely homogeneous; the county with the greatest number of U.S.-Canadians is Carrillo (6 percent), while Santa Cruz has the greatest number of Europeans (4 percent). Besides the beautiful beaches and several national parks and protected areas, these counties have several local airports that cut distances from the capital.
Likewise, toward the center of the province, in the county of Tilarán, situ-ated in the Cordillera de Guanacaste, 6 percent of the population is made up of U.S.-Canadian and European residents. In this county, where the well-known Monteverde National Park is located, the splendid mountain views attract tourist development which is ecologically oriented.
In the Atlantic region, Europeans have a greater presence; the county of Talamanca stands out, with 6.8 Europeans for every thousand inhabitants and only 2.8 U.S.-Canadians per thousand. This population is concentrated in the district of Cahuita and can be associated with the attractions near this district, such as Puerto Viejo, Cahuita National Park, the Gandoca-Manzanillo Wildlife Reserve, and indigenous reservations throughout the county of Talamanca.
Puga (2001) points out that the settlements of U.S.-Canadian and Euro-pean populations outside the GAM contribute toward equalizing the unequal geography of development which characterizes Costa Rica. Historically, the areas outside of what now constitutes the GAM have been peripheral to the economic development of the country. Journalist Lizbeth Ulett (2006) re-ported in La Nación that the construction sector increased 8.35 percent in the last year, making it one of the economic growth engines in the country. She points out that most of the construction has come about because of foreign investment in the coastal areas.
54 Selected Sociodemographic Aspects of Costa Rican Residents
However, this geographic equalizing and economic growth takes place at the expense of a polarization of income levels in the job market. In fact, Puga (2001) suggests that the people living near the luxury tourist compounds on the Pacific coast have much greater buying power than those living in the metropolitan area.
The tendency toward the formation of enclaves of foreign residents, rich in entertainment, both in the metropolitan area and in those farther away on the coasts and in the mountains, constitutes one of the most obvious con-sequences of U.S.-Canadian and European immigration to Costa Rica. The greater buying power of these immigrants exerts pressure on local real estate markets which could segregate native populations and distance them from access to services and certain sectors of the real estate market (Puga 2001; Dixon, Murray, and Gelatt 2006).
Population Structure by Sex and Age
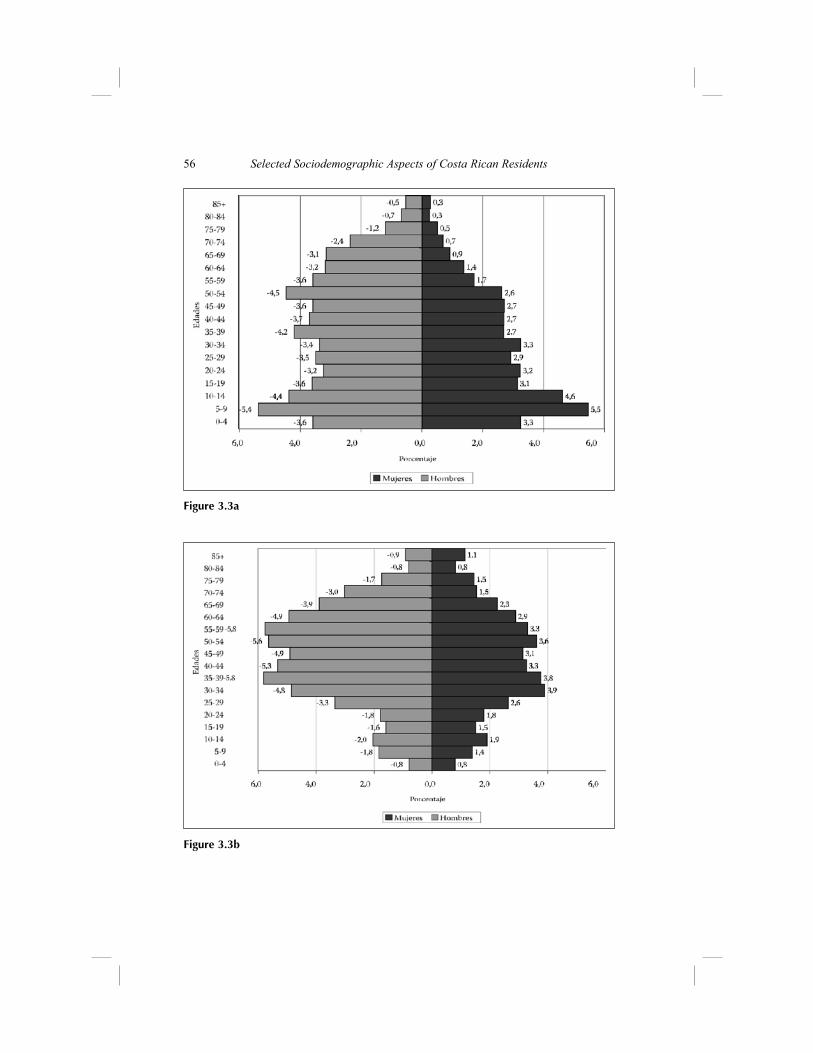
Figure 3.3 shows the population pyramids of the U.S.-Canadian and Euro-pean resident communities in Costa Rica, respectively. Each pyramid shows the percentages for the distribution of age groups of the foreign populations in five-year increments. Knowledge of the composition of the populations is important for strategic planning related to employment, education, health, and recreation, among others.
The pyramid of the U.S.-Canadian resident population in Costa Rica resembles a rectangle showing slow growth. The bulk of the population is found in the age groups which are economically productive (fifteen to sixty-four years), which account for 62.8 percent of the total. Five- to nine-year-olds constitute an explosion of births which results in 26.7 percent of the population being between the ages of zero and fourteen. Those individuals over sixty-five, where the people whose working years are over are found, make up 10.6 percent of the total U.S.-Canadian population. This distribu-tion of percentages demonstrates that Costa Rica is a destination country for families, working individuals, and people who are no long working from the United States and Canada.
The pyramid for the European population looks like a diamond with a small base and a wider cusp. Like the U.S.-Canadian population, the greatest propor-tion of people is found in the ages between fifteen and sixty-four. However, the percentage is greater and accounts for nearly three-fourths of the Euro-pean population (74 percent). The proportions for young and mature ages are inverted in the European population compared to that of the U.S.-Canadians. Individuals whose ages are from zero to fourteen account for 9 percent and people sixty-five and older account for 18 percent of the population.
Flora V. Calderón and Roger E. Bonilla 55
56 Selected Sociodemographic Aspects of Costa Rican Residents
Figure 3.3a
Figure 3.3b
The population pyramids graph the composition by sex of the two foreign populations, as already discussed; they are unequal, with greater participation of men. In the year 2000, the average number of men in the U.S.-Canadian community was 1.35 and for the European, 1.43.
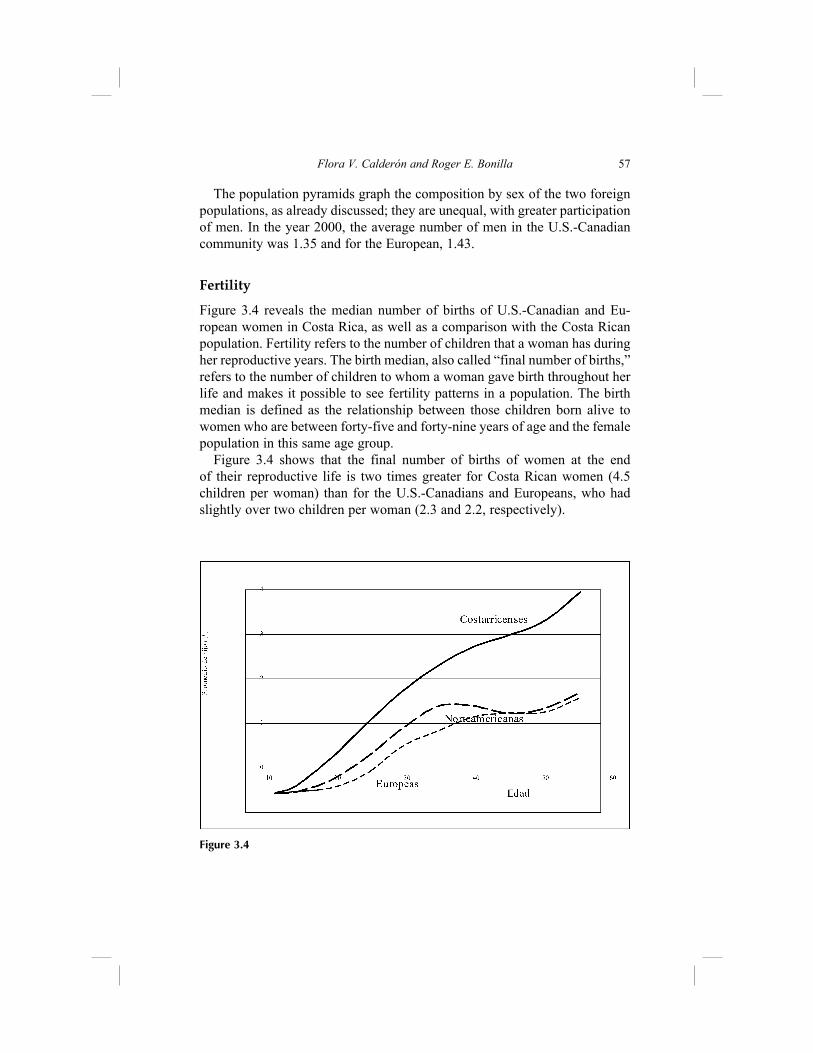
Fertility
Figure 3.4 reveals the median number of births of U.S.-Canadian and Eu-ropean women in Costa Rica, as well as a comparison with the Costa Rican population. Fertility refers to the number of children that a woman has during her reproductive years. The birth median, also called “final number of births,” refers to the number of children to whom a woman gave birth throughout her life and makes it possible to see fertility patterns in a population. The birth median is defined as the relationship between those children born alive to women who are between forty-five and forty-nine years of age and the female population in this same age group.
Figure 3.4 shows that the final number of births of women at the end of their reproductive life is two times greater for Costa Rican women (4.5 children per woman) than for the U.S.-Canadians and Europeans, who had slightly over two children per woman (2.3 and 2.2, respectively).
Flora V. Calderón and Roger E. Bonilla 57
Figure 3.4

household Profile
Table 3.3 shows the typology of homes according to the birth country of the head of household and a comparison with the Costa Rican population. Nuclear households, in their different configurations, have the greatest weight in each population group, from 71 percent for those households headed by a Costa Rican to 61 percent for those households headed by a U.S.-Canadian. Within nuclear households, the greatest proportion is that of married couples with children, who account for half of the households headed by a Costa Ri-can, and between 31 percent for households headed by a U.S.-Canadian and 35 percent for households headed by a European.
The type of household with the second greatest weight is inverted in the households headed by Costa Ricans and those headed by foreign residents. Extended households take second place in the Costa Rican population (18.3 percent) and third place in the U.S.-Canadian (7.5 percent) and European (8.8
58 Selected Sociodemographic Aspects of Costa Rican Residents
Table 3.3. Distribution in Percentages of Types of Households According to Head of Household in the Foreign Resident Population in Costa Rica
Type of HouseholdPlace of Birth of Head of Household
United States and Canada
European Union
Other Countries
Costa Rica
Nuclear Household
Spouses without children 24.8 23.5 9.0 8.5Spouses with children 31.5 35.0 41.8 50.4Single parent with children 4.3 6.0 8.5 11.6
Extended Household
Spouses without children and other relatives 1.3 1.2 2.1 1.3Spouses with children and other relatives 3.4 4.2 12.1 8.9Single parent with children and other relatives 0.8 1.8 5.0 5.1Head of household and other relative 2.0 1.6 3.1 2.9
Household Composition
Nuclear and nonrelatives 2.1 2.0 3.8 1.7Extended and nonrelatives 0.3 0.4 2.7 0.8Head, other relatives and non-relatives 0.3 0.1 0.6 0.2
Other types
Single person 25.6 20.7 8.9 7.8Head and other nonrelative 3.6 3.2 1.9 0.6Collective households 0.1 0.3 0.4 0.1Total Households 4,028 3589 86,883 865,598
Source: Based on data from INEC (2000).
percent) populations, while one-person households hold second place in U.S.-Canadian (25.6 percent) and European (20.7 percent) households and third place in the Costa Rican population (7.8 percent). It can be said that extended families have relatively little weight in all the populations.
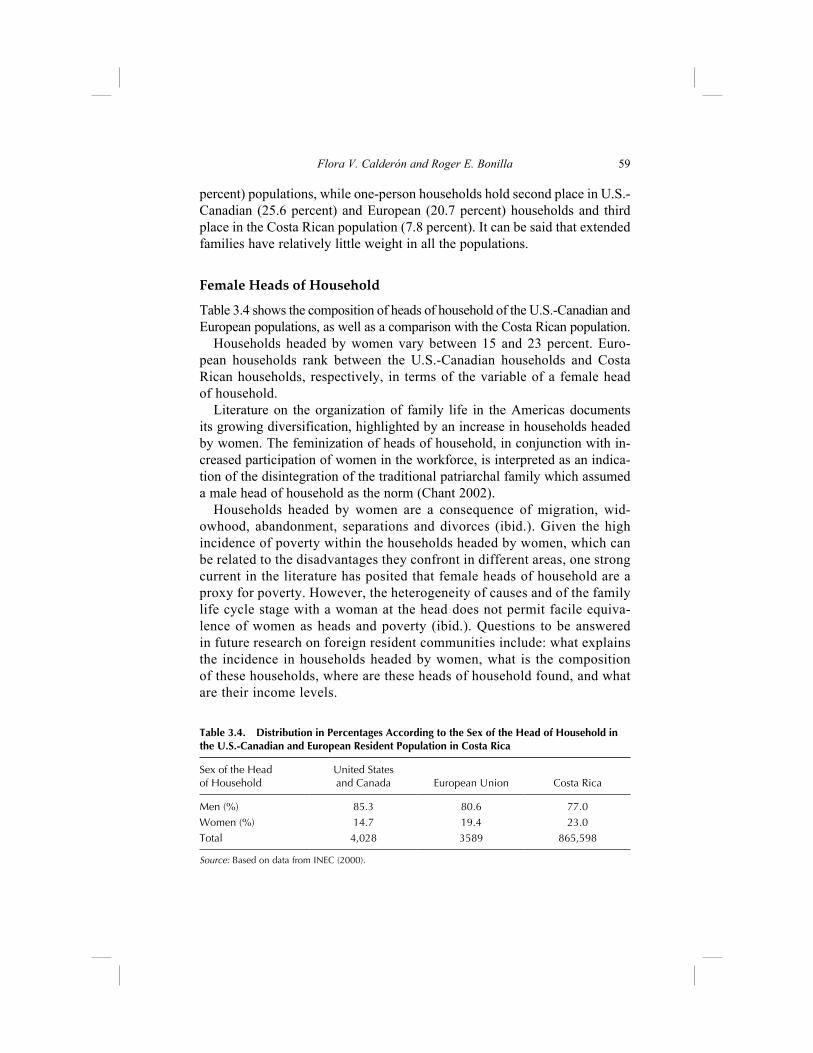
Female heads of household
Table 3.4 shows the composition of heads of household of the U.S.-Canadian and European populations, as well as a comparison with the Costa Rican population.
Households headed by women vary between 15 and 23 percent. Euro-pean households rank between the U.S.-Canadian households and Costa Rican households, respectively, in terms of the variable of a female head of household.
Literature on the organization of family life in the Americas documents its growing diversification, highlighted by an increase in households headed by women. The feminization of heads of household, in conjunction with in-creased participation of women in the workforce, is interpreted as an indica-tion of the disintegration of the traditional patriarchal family which assumed a male head of household as the norm (Chant 2002).
Households headed by women are a consequence of migration, wid-owhood, abandonment, separations and divorces (ibid.). Given the high incidence of poverty within the households headed by women, which can be related to the disadvantages they confront in different areas, one strong current in the literature has posited that female heads of household are a proxy for poverty. However, the heterogeneity of causes and of the family life cycle stage with a woman at the head does not permit facile equiva-lence of women as heads and poverty (ibid.). Questions to be answered in future research on foreign resident communities include: what explains the incidence in households headed by women, what is the composition of these households, where are these heads of household found, and what are their income levels.
Flora V. Calderón and Roger E. Bonilla 59
Table 3.4. Distribution in Percentages According to the Sex of the Head of Household in the U.S.-Canadian and European Resident Population in Costa Rica
Sex of the Head of Household
United States and Canada European Union Costa Rica
Men (%) 85.3 80.6 77.0Women (%) 14.7 19.4 23.0Total 4,028 3589 865,598
Source: Based on data from INEC (2000).

Education Aspects
Table 3.5 shows the percentage of level of education among the U.S.-Ca-nadian and European populations, and a comparison with the Costa Rican population. The level of education of the population is an important indicator of human capital. Some studies on the subject tend to define highly trained workers as those with a university degree.
From table 3.5, it can be seen that the population groups of U.S.-Canadians and Europeans have a higher level of education than the Costa Ricans. A ma-jority of Costa Ricans (87 percent) have a high school education or less, and only 13 percent have university degrees. On the other hand, more than half of the U.S.-Canadian and European residents have university degrees. The propor-tion of Europeans who have completed their higher education (60.4 percent) is significantly greater than that of the Costa Rican university population and slightly higher than the U.S.-Canadian population with that characteristic (52.3 percent). The high level of education of the foreign population is an indicator which could coincide with the characteristics of highly trained migration.
SOCIOECOnOMIC ASPECtS
Composition of the Workforce
Table 3.6 shows the composition of the workforce of U.S.-Canadian and European populations in Costa Rica, in comparison with the Costa Rican population. The distribution of percentages, according to the condition of economic activity, shows that a little over half of the European population (52 percent) participates in the job market, while less than half of the U.S.-Canadian population (44 percent) and Costa Rican population (47 percent) participate in this market.
60 Selected Sociodemographic Aspects of Costa Rican Residents
Table 3.5. Distribution in Percentages of the Level of Education of the U.S.-Canadian and European Resident Population in Costa Rica
Level of Education Completed
United States and Canada
European Union
Costa Rica
None 9.2 2.8 16.5Elementary 27.9 15.8 67.3High School 47.7 39.6 87.3Higher Education 52.3 60.4 12.7Total 10,568 6,711 3,513,718
Source: Based on data from INEC (2000).
Upon disaggregating the composition of the workforce by heads of family, the percentages of economically active populations increase: 73.7 percent of the heads are Costa Rican, 54.3 percent are U.S.-Canadian, and 62.4 percent are European. That is, more than half of the heads of household of the foreign population in question take part in the job market. In accordance with this fact, one can characterize the U.S.-Canadian and European populations as essentially working populations.
In the distribution by occupation, what stands out is the salaried category and categories of the private sector, since these include a majority of the working people in the three populations. In the areas of self-employed, em-ployer, and family job, there is less participation of the three populations; U.S.-Canadian migrants occupy the median position between Europeans and Costa Ricans in these three categories.
Since the mid-twentieth century, work studies which focus on gender have indicated that census data tend to underestimate the participation of women in paid labor. This tendency is reflected in the data of the 2000 census, which show that the Economically Active Population (PEA in Spanish) of women accounts for a relative weight within their populations that varies from 26 to 36 percent, while the male PEA varies from 50 to 68 percent of their respec-tive populations. According to figures from the 2000 Census, in the U.S.-Ca-
Flora V. Calderón and Roger E. Bonilla 61
Table 3.6. Composition of the Work Force of the U.S.-Canadian and European Resident Population in Costa Rica (in Relative and Absolute Numbers). Costa Rica 2000.
Work Status United States and Canada European Union Costa Rica
Economically Active (PEA) 43.9 52.0 46.9Inactive 56.1 48.0 53.1Total 8,331 6,273 20,589,693
Work Category
Salaried 56.5 46.2 73.5Self-employed 21.2 23.3 19.9Employer 20.6 28.4 4.4Family Enterprise 1.7 2.2 2.2Total 3,565 3,200 1,159,234
Institutional Sector
Government 7.9 7.0 16.4Private Sector 90.6 90.1 83.5International Organizations 1.4 2.9 0.2Total 3,565 3,200 1,159,234
Source: Based on data from INEC (2000).
nadian population there are 14.8 men for every ten women in the workforce; in the European population this ratio is 14.6 men for every ten women.
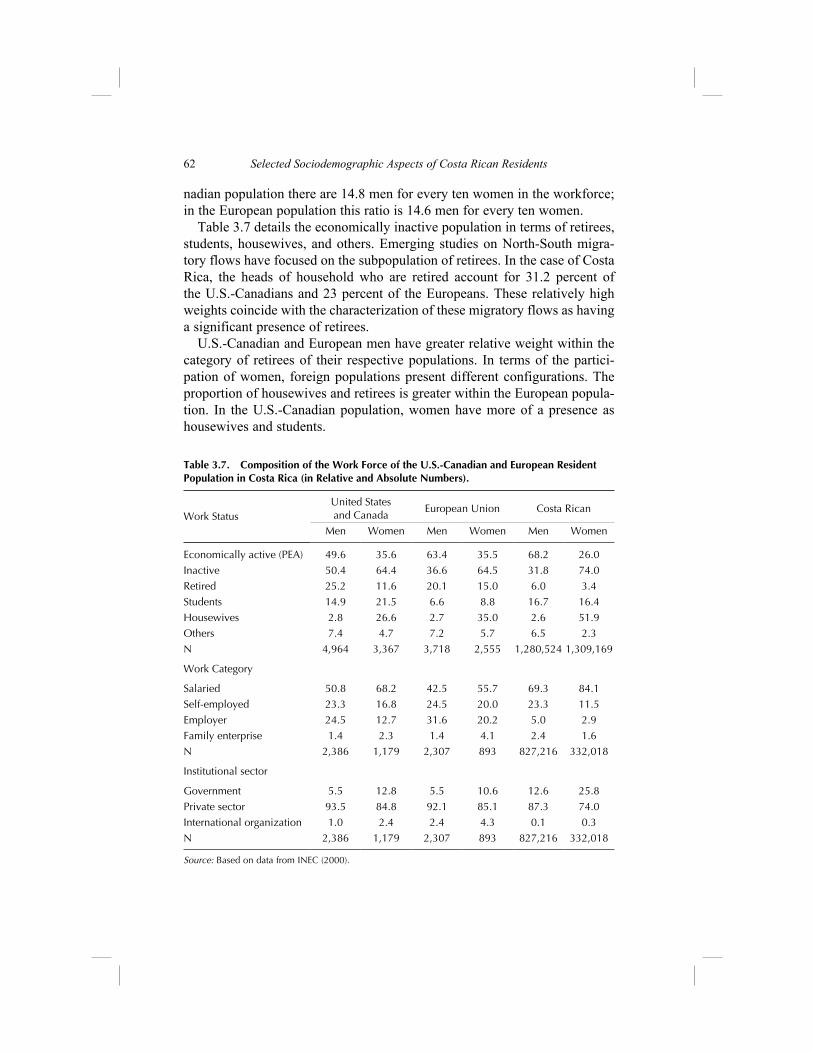
Table 3.7 details the economically inactive population in terms of retirees, students, housewives, and others. Emerging studies on North-South migra-tory flows have focused on the subpopulation of retirees. In the case of Costa Rica, the heads of household who are retired account for 31.2 percent of the U.S.-Canadians and 23 percent of the Europeans. These relatively high weights coincide with the characterization of these migratory flows as having a significant presence of retirees.
U.S.-Canadian and European men have greater relative weight within the category of retirees of their respective populations. In terms of the partici-pation of women, foreign populations present different configurations. The proportion of housewives and retirees is greater within the European popula-tion. In the U.S.-Canadian population, women have more of a presence as housewives and students.
62 Selected Sociodemographic Aspects of Costa Rican Residents
Table 3.7. Composition of the Work Force of the U.S.-Canadian and European Resident Population in Costa Rica (in Relative and Absolute Numbers).
Work StatusUnited States and Canada
European Union Costa Rican
Men Women Men Women Men Women
Economically active (PEA) 49.6 35.6 63.4 35.5 68.2 26.0Inactive 50.4 64.4 36.6 64.5 31.8 74.0Retired 25.2 11.6 20.1 15.0 6.0 3.4Students 14.9 21.5 6.6 8.8 16.7 16.4Housewives 2.8 26.6 2.7 35.0 2.6 51.9Others 7.4 4.7 7.2 5.7 6.5 2.3N 4,964 3,367 3,718 2,555 1,280,524 1,309,169
Work Category
Salaried 50.8 68.2 42.5 55.7 69.3 84.1Self-employed 23.3 16.8 24.5 20.0 23.3 11.5Employer 24.5 12.7 31.6 20.2 5.0 2.9Family enterprise 1.4 2.3 1.4 4.1 2.4 1.6N 2,386 1,179 2,307 893 827,216 332,018
Institutional sector
Government 5.5 12.8 5.5 10.6 12.6 25.8Private sector 93.5 84.8 92.1 85.1 87.3 74.0International organization 1.0 2.4 2.4 4.3 0.1 0.3N 2,386 1,179 2,307 893 827,216 332,018
Source: Based on data from INEC (2000).
The literature on new forms or modalities of international mobility points to growing participation of women in migratory flows in the condition of students (Hugo, 2003). The proportion of female students is greater than that of men in both foreign populations. The relatively short distance from North America, in comparison to the distance from Europe, might explain the greater participation of U.S.-Canadian women. In the Costa Rican population, male and female students participate to a similar degree, around 16 percent in their respective groups.
The profile related to work category also presents differences according to sex. Women have greater participation in the categories of salaried workers and family enterprises, with the exception of Costa Ricans in the latter cate-gory. The men of all three population groups have greater participation in the categories of self-employed and employer; the difference is most significant in the category of employer.
In terms of the institutional sector, while the private sector includes a major-ity of both men and women workers, women have a greater presence in the public sector and in international organizations. This may be due to the affirma-tive action policies presenting conditions which favor employment of women. Within the second wave of globalization, international organizations function as vehicles for the international mobility of highly qualified personnel, where the participation of women is increasing (Pellegrino 2001, Hugo 2003).
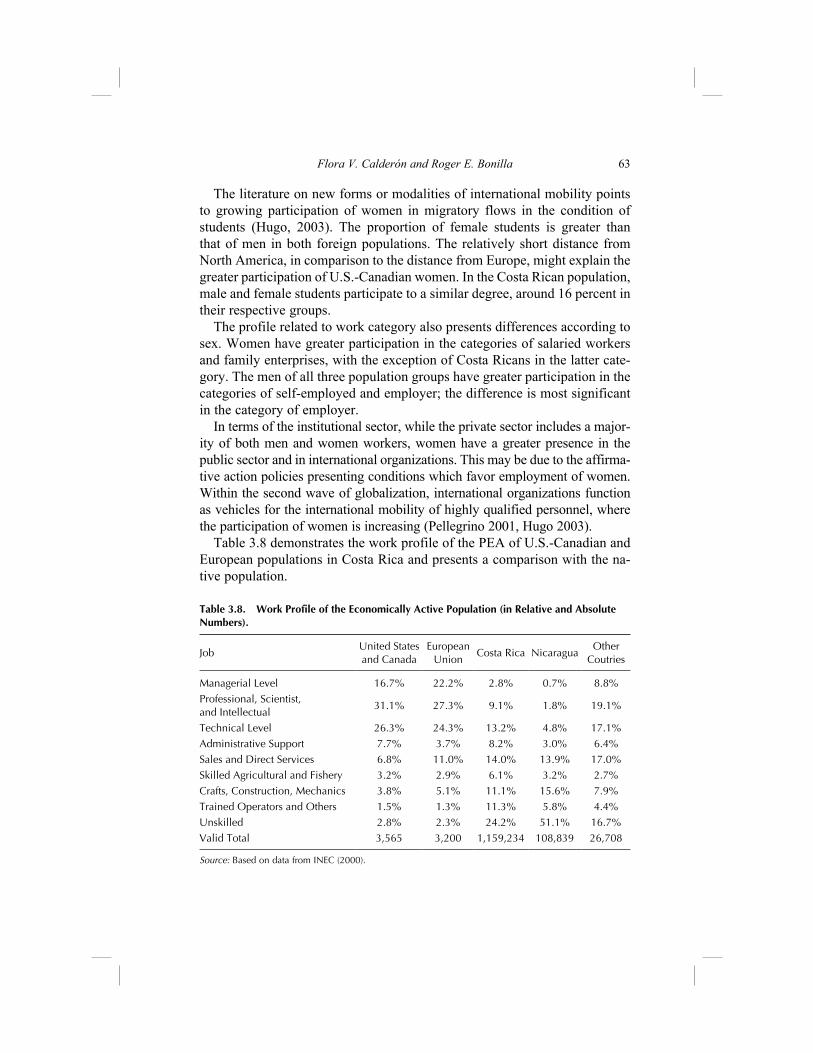
Table 3.8 demonstrates the work profile of the PEA of U.S.-Canadian and European populations in Costa Rica and presents a comparison with the na-tive population.
Flora V. Calderón and Roger E. Bonilla 63
Table 3.8. Work Profile of the Economically Active Population (in Relative and Absolute Numbers).
JobUnited States and Canada
European Union
Costa Rica NicaraguaOther
Coutries
Managerial Level 16.7% 22.2% 2.8% 0.7% 8.8%Professional, Scientist, and Intellectual
31.1% 27.3% 9.1% 1.8% 19.1%
Technical Level 26.3% 24.3% 13.2% 4.8% 17.1%Administrative Support 7.7% 3.7% 8.2% 3.0% 6.4%Sales and Direct Services 6.8% 11.0% 14.0% 13.9% 17.0%Skilled Agricultural and Fishery 3.2% 2.9% 6.1% 3.2% 2.7%Crafts, Construction, Mechanics 3.8% 5.1% 11.1% 15.6% 7.9%Trained Operators and Others 1.5% 1.3% 11.3% 5.8% 4.4%Unskilled 2.8% 2.3% 24.2% 51.1% 16.7%Valid Total 3,565 3,200 1,159,234 108,839 26,708
Source: Based on data from INEC (2000).

U.S.-Canadian and European residents are conglomerated in “white collar” jobs; that is, 74 percent of these populations do work which is managerial, professional or technical, while the proportion of untrained workers is very low. Professional, scientific and intellectual positions carry the greatest weight within the U.S.-Canadian, European, and other foreign resident populations.
According to the data in tables 3.7 and 3.8, we can conclude that the portion of the U.S.-Canadian and European migrant population which is economically active is a migration of highly trained labor. Although there are various defini-tions of migration according to level of education and experience, the simplest and most common way to make it operational is as a flow of professionals and technical personnel with a university education (Pellegrino 2001).2
MIgRAtORy ASPECtS
time of Residence in Costa Rica
Length of stay is a common way to describe migratory flows; in particular, a distinction is made between permanent migration and temporary migra-tion. The migration of U.S.-Canadians and Europeans to Costa Rica can be classified as permanent. Studies on Mexican migration to the United States posit that after three years, the migratory experience can be considered per-manent (Hondagneu-Sotelo 1994). The European community has resided in Costa Rica the longest, an average of 15.5 years, followed by the U.S.-Canadian community with an average residency of 10.7 years. Although the Nicaraguan community has had greater migratory flows, they have a lower average of years of residence in Costa Rica: 9.7 years. This is not surprising, since research has demonstrated the characteristic circularity of Nicaraguan migration. Thus, it can be concluded that, in comparison, the movement of the European and U.S.-Canadian communities is character-ized as permanent migration.
discussion
This article quantifies certain sociodemographic and socioeconomic aspects of the U.S.-Canadian and European resident population in Costa Rica based on official statistics. It highlights two threads of the multicultural Costa Rican fabric at the end of the twentieth century.
The size of the U.S.-Canadian and European population in Costa Rica is 17,279 people (10,568 and 6,711 respectively). The absence of an institu-tionalized army, the relative security, and natural beauty all benefit Costa
64 Selected Sociodemographic Aspects of Costa Rican Residents
Rica, making it an attractive tourist destination, which generates important migrations. Half of the U.S.-Canadians came to Costa Rica to stay as of the first part of the 1990s.
differences
The comparison of foreign populations revealed some substantial differences. Significant among them, the U.S.-Canadian community is a continuous pres-ence with an annual exponential growth rate of 3.8 percent versus 2.8 percent for the European community. The latter, although it has had a historical pres-ence in Costa Rica, experienced a drop in volume in the census year of 1950 and did not begin to recuperate until the end of the 1970s. The combination of U.S.-Canadian residents in Costa Rica is greater than the total number of European immigrants, with a two to one ratio. In spite of growing at a slower rate and having a smaller immigrant group than the U.S.-Canadian com-munity, Europeans have an older presence in Costa Rica, with an average of almost five years more than the average of the U.S.-Canadian community. We know that within the U.S.-Canadian community, those from the United States have greater weight. Possible questions for future research include: 1) What is the composition by nationality within the European community and how has this composition changed over time? 2) How does the European mi-gratory flow from the early twentieth century compare to that which became evident in the 1970s? 3) What processes of the global economy influenced these migratory flows?
The metropolitan area is a space where both communities tend to concen-trate, possibly in order to have greater access to the facilities of the urban area. However, in coastal areas the U.S.-Canadian community appears to prefer the Pacific side, and the European community the Caribbean. From this data, certain questions arise: 1) What explains the different settlement patterns in the coastal areas? 2) Is there a differentiated impact of these dif-ferent settlement patterns on local real estate markets? 3) How do the local communities perceive these communities of foreign residents?
Another difference between the U.S.-Canadian population and the Eu-ropean population is their structure. Young people have greater weight in the U.S.-Canadian community, while people of working age and senior citizens constitute a majority in the European community. Future research could further examine the characteristics of these foreign communities and their members. Some basic questions could be: 1) What similarities and differences exist among the residents of various areas of Costa Rica? 2) Are there networks of social support that connect the residents of differ-ent parts of the country? In the description of the county of Escazú, whose
Flora V. Calderón and Roger E. Bonilla 65
population includes 30 percent U.S.-Canadian and European residents, Puga (2001) suggests that it involves an enclave. These concepts are rooted in that migratory experience which produces permanent settlements, such as those long periods of residency which both communities appear to have. The following questions arise: 1) Does this pattern of experience hold true for all areas, particularly those outside the metropolitan area? 2) Which and how many of the immigrants opt for acquiring Costa Rican citizenship and what effect does that have on settlement patterns? 3) How useful are the concepts of transnational communities and diaspora, with high-mobility members, which derive from the literature on migration within the context of the present cycle of globalization?
Minor differences are found within the PEA of each community. The resident European community has a greater proportion of people actively involved in the work force (52 percent versus 44 percent of the U.S.-Cana-dian population). So-called white collar positions predominate in the work profile of both foreign populations. Nevertheless, there is a slightly greater percentage of people in managerial positions in the European community (22 percent versus 17 percent of the U.S.-Canadian community) and in professional and technical positions in the U.S.-Canadian community (31 percent and 26 percent respectively versus 27 percent and 24 percent of the European community). Seventy-four percent of the foreign residents in both communities are employed in managerial, professional and technical positions. This contrasts considerably with the type of job of Nicaraguan residents, who constitute only 7 percent in said category and, paradoxically, represent the largest proportion of the total foreign population. The largest group of foreign residents is employed mainly in unskilled occupations (51 percent of Nicaraguans versus 3 percent of U.S.-Canadians and 2 percent of Europeans). This contrast in the work profiles of foreigners coincides with the results of other studies that outline a work force in destination countries which is polarized between immigrants with little specialization and immi-grants who are highly specialized.
Level of education is a key aspect in what economics literature refers to as human capital, as an indicator of the ability of the worker to function within the work force. In this context we find both (U.S.-Canadian and European) foreign communities have skilled human capital, where more than half of the people of working age have university education. The level of education and the job profile of both communities suggest “selective migration” in which its participants have the economic and social capital necessary to re-settle and become part of the work force of the destination country.
Research on qualified migration shows that its pattern is usually circular with stays of different length. Some questions which could guide future stud-
66 Selected Sociodemographic Aspects of Costa Rican Residents
ies concerned with delving more deeply into this segment of the resident migrant population of Costa Rica include: 1) What are the particulars of the migratory patterns of the PEA of these two foreign communities? 2) What characterizes the transnational support networks through which foreign resi-dents insert themselves into the job market and how are they mobilized? 3) Are there certain multinational companies which stand out in the hiring of foreign residents in Costa Rica? 4) How qualified are these immigrants com-pared to their peers in their countries of origin?
Similarities
Comparison of the two foreign populations shows great similarity in sev-eral aspects of their composition. For example, both communities are pre-dominantly masculine, have a low birth rate, and most of the households are nuclear and headed by a foreign resident. From this data, the following questions arise: 1) What is the internal composition of the households headed by a foreign resident, according to place of birth? 2) Are the marriages in-tercultural or monocultural? 3) How does the composition of the households affect settlement patterns in the country?
Immigrants are affected by the migratory and macroeconomic policies of the country. Costa Rica is going through a period of reform; it recently revised its migration law, the Free Trade Agreement with the United States was approved, and the Ministry of Foreign Relations is preparing for the first rounds of negotiations for a trade agreement with the European Union. Future research could explore the effects of these policy changes on migratory flows both from North America and from Europe. Are we facing a paradoxical case of economic expansion which simultaneously restricts human mobility?
Puga (2001) notes that the changes made in 1992 to Law 48-12, which was created in 1964 and is known as the Law of Retirees, provoked a decrease in the volume of immigrant retirees. Dixon et al. (2006) reaffirm this fact with results concerning resident retirees in Panama. Participants in the study af-firm that they opted for that country because of the reduction in benefits for foreign retirees in Costa Rica as of 1992. Thus, what have been the effects of the changes in the Migration Law which took effect in 2006?
Validation
To what degree are the results valid and trustworthy? How can we validate the results obtained in the present study? First, it is essential to remember that the importance of analytical studies lies in the calculation of tendencies, per-centages, relative indices, and comparative relations, more so than in absolute
Flora V. Calderón and Roger E. Bonilla 67
total numbers. Likewise, it is necessary to remember that the Census only takes into account habitual residents and not tourists or temporary residents. Therefore, having solely this source, it is vital to validate the results obtained in official statistics.
One element which could lessen the validity of the results is that the category of no-response appears more frequently in these specific popu-lations. This means that in neighborhoods or residential areas with the greatest U.S.-Canadian and European population, it might have been more difficult to account for that information because of restricted access for employees of the National Institute of Statistics and Censuses (INEC in Spanish), despite the judicially obligatory nature of the Census. There is little information available on this issue, which makes it difficult to know the exact number of the U.S.-Canadian and European population in Costa Rica, which then makes it necessary to apply alternative methods of valida-tion. In this study there are three:
1. Testimonial: In the case of U.S.-Canadians, an organization of residents estimates the number of those populations in Costa Rica as approximately between 70 and 90 thousand people. With this criterion, and assuming it is correct, this represents an enormous under-registration of the official population. The estimate from this organization is almost 700 percent more than the estimate in official statistics.
2. Method of census omission: In 2002, the Central American Population Center, in collaboration with the INEC, developed estimates of the popu-lation taking into consideration census omission. In the case of the foreign population, it was estimated there was an omission of approximately 12 percent (Barquero and Vargas 2004). This amount transposes into 336 529 individuals of the total population born outside the country. Based on this premise, the U.S.-Canadian and European population in Costa Rica would be 12 000 and 7500 people, respectively.
3. Temporary residency: Between 1991 and 2005 (with the central date of 2000, the year of the census), approximately 7500 temporary resident per-mits were issued to people from the United States and Canada (Dirección Nacional de Migración y Extranjería, 2006). The average time of arrival in Costa Rica was calculated taking into account, approximately, seven years at each extreme, and as a result, it shows the median for the year 2000. Given that the official statistics of the Dirección Nacional de Migración y Extranjería include some duplications, that is, an emigrant could renew his/her residency permit several times, and assuming that between 60 to 70 percent of these residents are duplicated, the approximate number of U.S.-Canadians with residency permits would be 5300. This coincides
68 Selected Sociodemographic Aspects of Costa Rican Residents
with half of the U.S.-Canadian population reported in the Census. This argument is valid to the degree that the U.S.-Canadian population has residency permits.
Three questions to be answered in future research are: 1) Is it possible to estimate the resident population of U.S.-Canadians and Europeans in Costa Rica by means of methods crossed with censuses from the United States, Eu-rope, etc.? 2) In what sociodemographic aspects do the expatriate populations in Costa Rica differ from those of the residents of their respective countries? 3) What sociodemographic aspects are shared by the foreign populations in Costa Rica and the local population?
As a general conclusion, it can be said that the present study presents ana-lytical information which is important to formulation of future study hypoth-eses and which contributes to evidence that is useful for studying minority social groups in Costa Rica.
nOtES
1. Flora Calderón would like to thank Jorge Barquero and Luis Rosero for their comments on early versions of this article, the Ministry of State and Church for pro-viding data on immigration en Costa Rica, and Stacey Steck for her unconditional support. Roger Bonilla would like to thank the School of Statistics of the University of Costa Rica for its support, the Centro Centroamericano de Población for their tech-nological support, and Ruth Salas for her unconditional support.
2. If we compare the work profiles of the foreign resident populations in Costa Rica, we can conclude that Costa Rica is a receptor country for migrant workers from both extremes of the job market: skilled jobs (U.S.-Canadian, European, and others) and unskilled jobs (principally the Nicaraguan population).
BIBlIOgRAPhy
Barquero, Jorge and Vargas, Juan. (2004). “La migración internacional en Costa Rica: estado actual y Consecuencias.” In Reinaldo Herrera and Grettel López (Eds.), Evolución demográfica de Costa Rica y su impacto en los sistemas de salud y de pensiones. San José: Academia de Centroamérica, pp. 55–88.
Brenes, Gilbert. (1999). “Estimación del volumen y características sociodemográficas de los inmigrantes nicaragüenses en Costa Rica.” Thesis for Magíster Scientiae. Pro-grama de Estudios de Postgrado en Estadística. Universidad de Costa Rica, San José.
Centro Latinoamericano y Caribeño de Demografía. (2005). “Dinámica demográfica y desarrollo en América Latina y el Caribe.” Serie Población y Desarrollo 58, Santiago: Centro Latinoamericano y Caribeño de Demografía.
Flora V. Calderón and Roger E. Bonilla 69
Comisión Económica para América Latina y el Caribe. (2006). Migración interna-cional, derechos humanos y desarrollo en América Latina y el Caribe: Síntesis y Conclusiones. Thirty-first period of sessions, Montevideo, March 20–24, 2006.
Chant, Sylvia. (2002). “Debate: Researching Gender, Families and Households in Latin America: From the 20th to the 21st Century.” In Bulletin of Latin American Research 21, no. 4, pp. 545–75.
Dirección General de Migración y Extranjería. (2006). Costa Rica: Principales movimientos migratorios según año y país, periodo: 2000–2004. Dirección Gen-eral de Migración y Extranjería, Ministerio de Gobernación y Policía. San José, Costa Rica.
Dixon, David, Murray Julie and Gelatt, Julia. (2006). America’s Emigrants: U.S. Re-tirement Migration to Mexico and Panama. The Migration Policy Institute.
Fondo de la Población de las Naciones Unidas. (2006). Estado de la población mun-dial: Hacia la esperanza: Las mujeres y la migración internacional. UNPFA.
Gutiérrez, Edgar. (2004). “Algunas observaciones sobre quiénes somos.” In Alex-ander Jiménez (Ed.), Sociedades hospitalarias: Costa Rica y la acogida de inmi-grantes. San José: Ediciones Perro Azul, pp. 85–102.
Hamilton, K.A., Jachimowicz, M., Patrick, E. and Papademetriou, D. (2005). “Migra-tion trends and patterns in the Americas.” World Migration 2005, pp. 83–101.
Hondagneu-Sotelo, Pierrette. (1994). Gendered Transitions: Mexican Experiences of Immigration. Berkeley: University of California Press.
Hugo, Graeme. (2003). “Circular Migration: Keeping Development Rolling?” Migra-tion Information Source.
Lara, Juan. (2006). “Wal-Mart construirá un Hipermás en Escazú”. La Nación, Sep-tember 22.
Martínez, Jorge. (2005). “Globalizados, pero restringidos. Una visión latinoameri-cana del mercado global de recursos humanos calificados.” Serie Población y Desarrollo 56. Santiago: Centro Latinoamericano y Caribeño de Demografía.
Martínez, Jorge and Villa, Miguel. (2005). International migration in Latin America and the Caribbean: A summary view of trends and patterns. United Nations Expert Group Meeting on International Migration and Development. Population Division. Department of Economic and Social Affairs, United Nations Secretariat, New York, July 6–8.
Ministerio de Vivienda y Asentamientos Humanos. (2006). GEO Gran área metro-politana del Valle Central de Costa Rica: Perspectivas del medio ambiente urbano 2006. MIVAH. MINAE, PNUMA. San José, Costa Rica. Retrieved from www.odd.ucr.ac.cr/documentos/espanol/ GEO_GAM_CR_2006.pdf.
Murillo, Carmen. (2004). “El tejido multicolor de la cultura costarricense.” In Alex-ander Jiménez (ed.), Sociedades hospitalarias: Costa Rica y la acogida de inmi-grantes. San José: Ediciones Perro Azul, pp. 67–85.
Omelaniuk, Irena and Weiss, Lothar. (2005). “Introduction: Migration challenges in the 21st century.” In World Migration 2005, pp. 13–22.
Pellegrino, Adela and Martínez, Jorge. (2001). “Una aproximación al diseño de políticas sobre la migración internacional calificada en América Latina.” Serie Población y Desarrollo 23. Santiago: CELADE-FNUAP.
70 Selected Sociodemographic Aspects of Costa Rican Residents
Pellegrino, Adela. (2001). “Trends in Latin American skilled migration: ‘Brain Drain’ or ‘Brain Exchange’?” In International Migration 39, no. 5, pp. 111–32.
Pellegrino, Adela. (2003). “La migración internacional en América Latina y el Car-ibe: tendencias y perfiles de los migrantes.” In Serie Población y Desarrollo 35. Santiago: CELADE y División de Población Banco Interamericano de Desarrollo.
Portes, Alejandro. (1997). “Immigration theory for a new century: Some problems and opportunities.” In International Migration Review 31, no. 4, pp. 799–825.
Puga, Dolores. (2001). “Un lugar en el sol: inmigración de jubilados en Costa Rica.” In Luis Rosero-Bixby, (Ed.), Población del istmo 2000: Familia, migración, vio-lencia y medio ambiente. San José: Centro Centroamericano de Población.
Rosero-Bixby, Luis. (2002). Estimaciones y proyecciones de población por distrito y otras áreas geográficas: Costa Rica 1970–2015. San José: Centro Centroameri-cano de Población e Instituto Nacional de Estadísticas y Censos.
Sandoval, Carlos. (2004). “El ‘otro’ nicaragüense en tres actos: Populismo intelec-tual, ficción teatral y políticas públicas.” In Alexander Jiménez (Ed.), Sociedades hospitalarias: Costa Rica y la acogida de inmigrantes. San José: Ediciones Perro Azul, pp. 27–66.
Solinamo, Andrés. (2004). Globalization, history, and international migration: A view from Latin America. Working Paper 37. Policy Integration Department, Word Commission on the Social Dimension of Globalization. Geneva: International Labour Office.
Ulett, Lizbeth. (2006). “Producción costarricense creció un 6,9% a julio”. In La Nación, September 22.
ANNEX 3.1
Flora V. Calderón and Roger E. Bonilla 71