selected industry supported research at curent
TRANSCRIPT

Selected Industry Supported Research at
CURENT
Presented by Yilu Liu
University of Tennessee and Oak Ridge National Lab.
JSIS, May 13, 2021

Acknowledgements
This work was supported primarily by the ERC Program of the National
Science Foundation and DOE under NSF Award Number EEC-1041877
and the CURENT Industry Partnership Program.
Other US government and industrial sponsors of CURENT research
are also gratefully acknowledged.
2
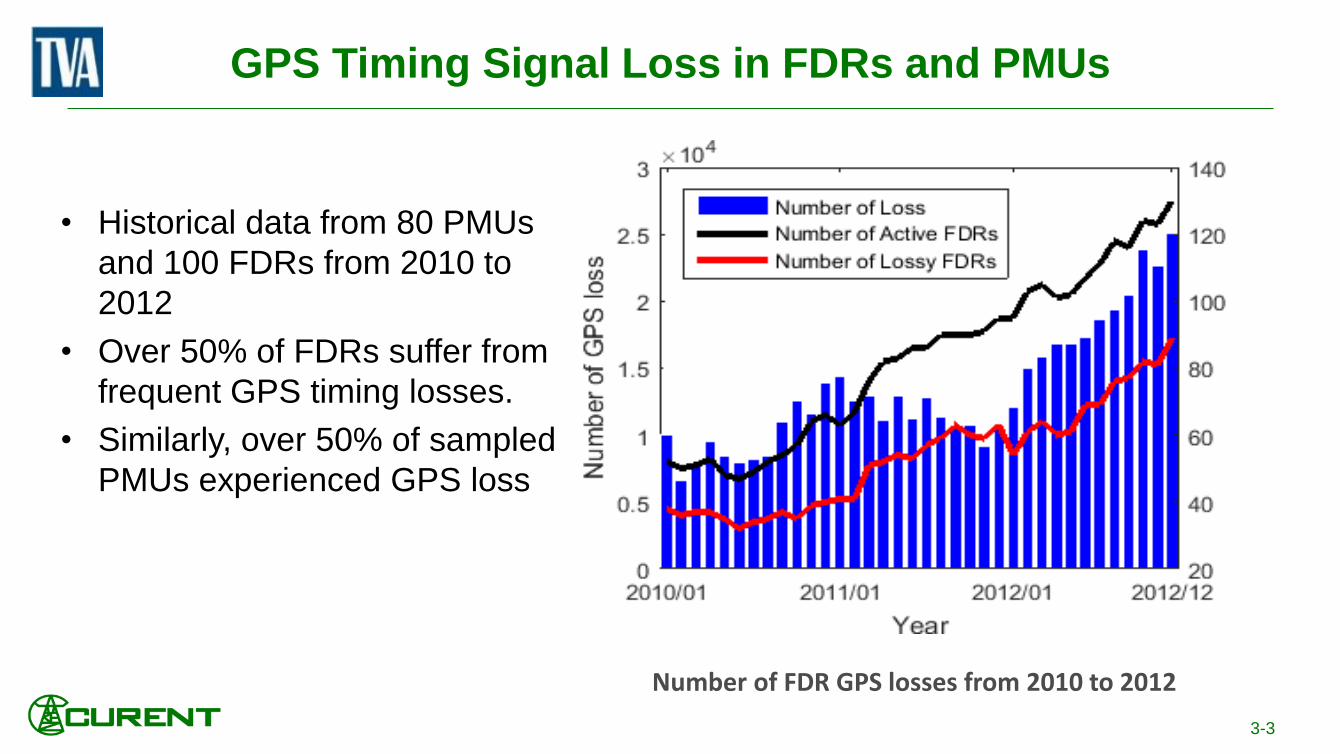
GPS Timing Signal Loss in FDRs and PMUs
• Historical data from 80 PMUs
and 100 FDRs from 2010 to
2012
• Over 50% of FDRs suffer from
frequent GPS timing losses.
• Similarly, over 50% of sampled
PMUs experienced GPS loss
Number of FDR GPS losses from 2010 to 2012
3-3
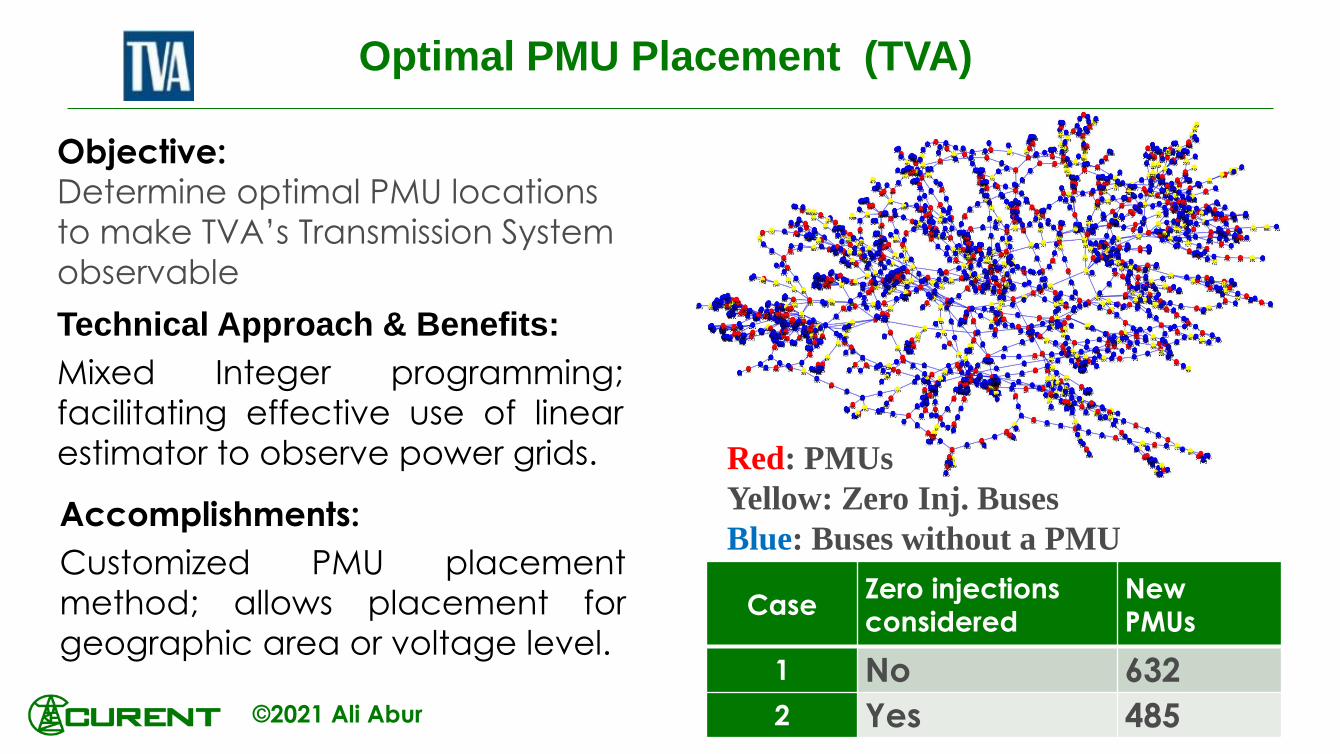
Technical Approach & Benefits:
Mixed Integer programming;
facilitating effective use of linear
estimator to observe power grids.
Objective:Determine optimal PMU locations
to make TVA’s Transmission System
observable
4-4
Optimal PMU Placement (TVA)
Accomplishments:
Customized PMU placement
method; allows placement for
geographic area or voltage level.Case
Zero injectionsconsidered
NewPMUs
1 No 632
2 Yes 485
Red: PMUs
Yellow: Zero Inj. Buses
Blue: Buses without a PMU
©2021 Ali Abur
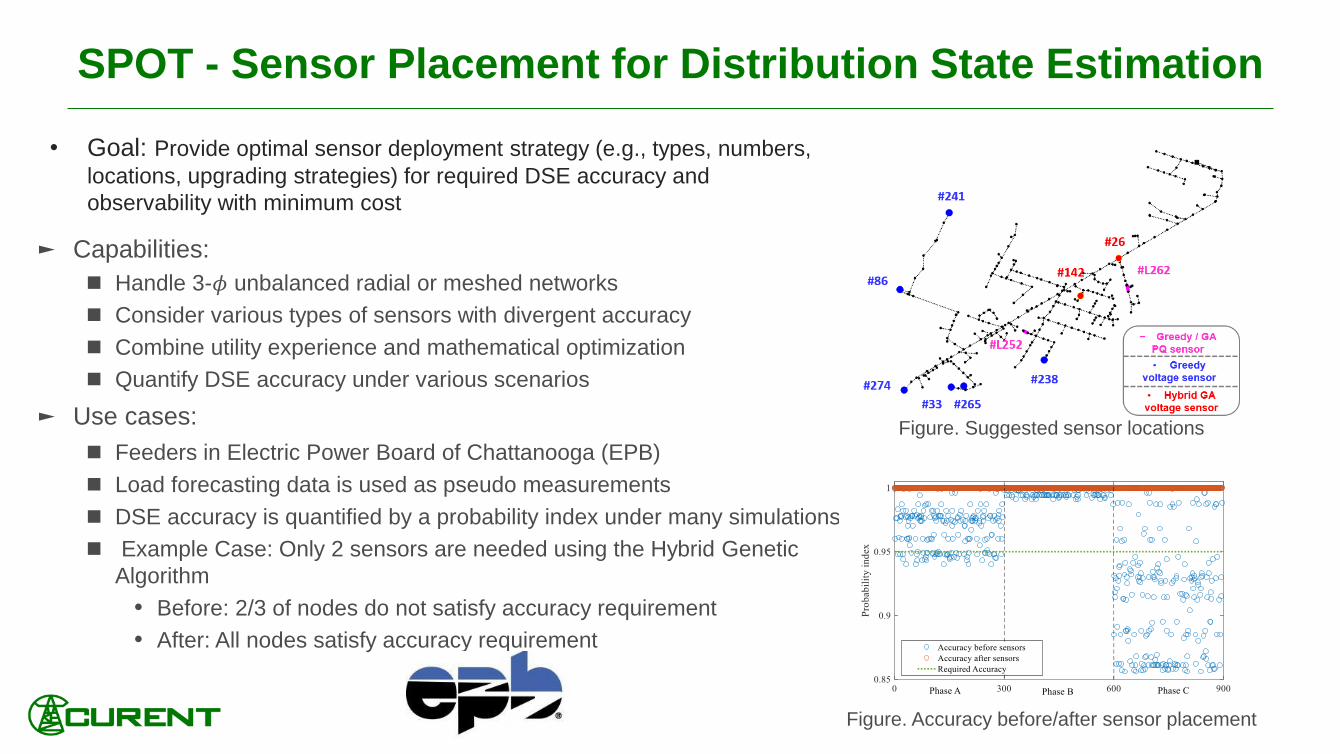
SPOT - Sensor Placement for Distribution State Estimation
• Goal: Provide optimal sensor deployment strategy (e.g., types, numbers,
locations, upgrading strategies) for required DSE accuracy and
observability with minimum cost
► Capabilities:
◼ Handle 3-𝜙 unbalanced radial or meshed networks
◼ Consider various types of sensors with divergent accuracy
◼ Combine utility experience and mathematical optimization
◼ Quantify DSE accuracy under various scenarios
► Use cases:
◼ Feeders in Electric Power Board of Chattanooga (EPB)
◼ Load forecasting data is used as pseudo measurements
◼ DSE accuracy is quantified by a probability index under many simulations
◼ Example Case: Only 2 sensors are needed using the Hybrid Genetic
Algorithm
• Before: 2/3 of nodes do not satisfy accuracy requirement
• After: All nodes satisfy accuracy requirement
Figure. Suggested sensor locations
Figure. Accuracy before/after sensor placement

Real-time Events Detection and Triangulation
• Implemented and operates in a power grid with 400 PMUs
• Detected event types: Generation trip and load shedding
• High resolution real-time measurement in huge volume
• Data quality issues in real time measurements
• Tested accuracy and robust of the application for operational purpose
• Tested with 10 simulation event cases and 1 real-world event case
• Tested with 75 ambient cases
6
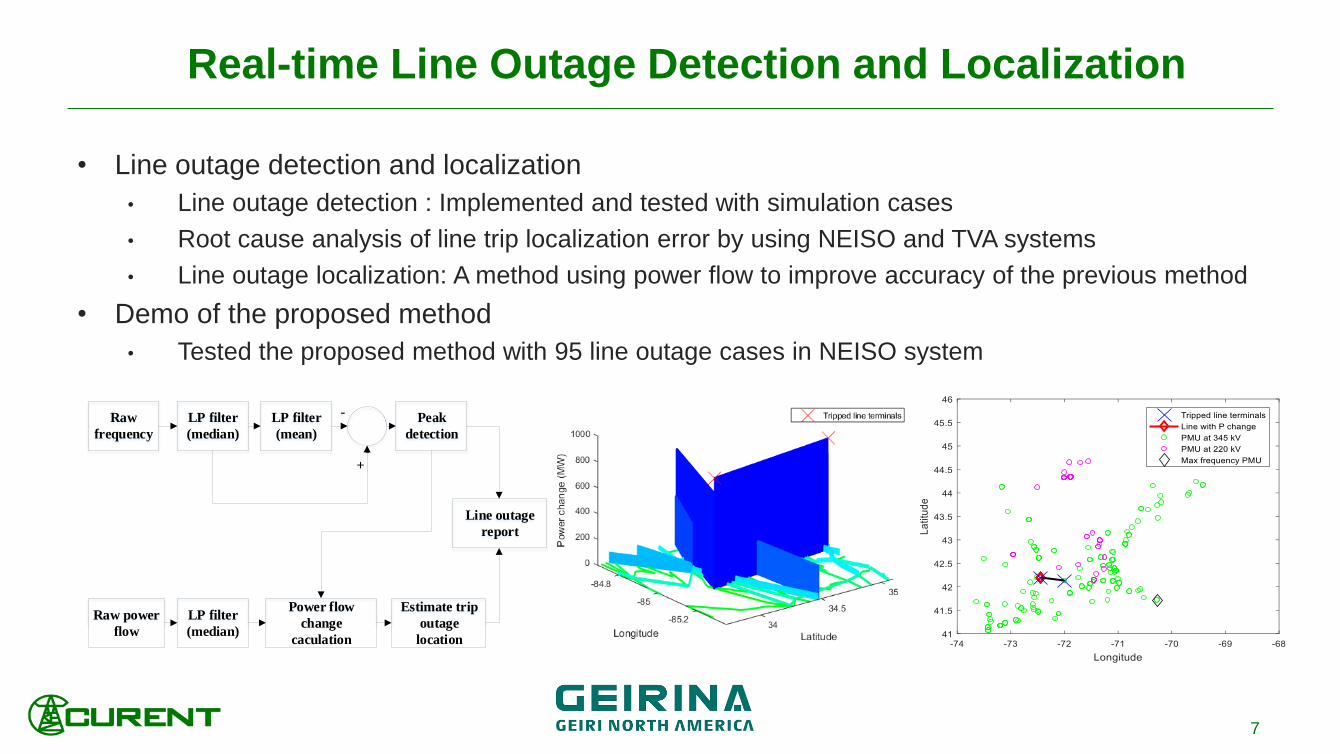
Real-time Line Outage Detection and Localization
• Line outage detection and localization
• Line outage detection : Implemented and tested with simulation cases
• Root cause analysis of line trip localization error by using NEISO and TVA systems
• Line outage localization: A method using power flow to improve accuracy of the previous method
• Demo of the proposed method
• Tested the proposed method with 95 line outage cases in NEISO system
7
Raw
frequency
LP filter
(median)
LP filter
(mean)
Line outage
report
Peak
detection
-
-+
Raw power
flow
Power flow
change
caculation
Estimate trip
outage
location
LP filter
(median)
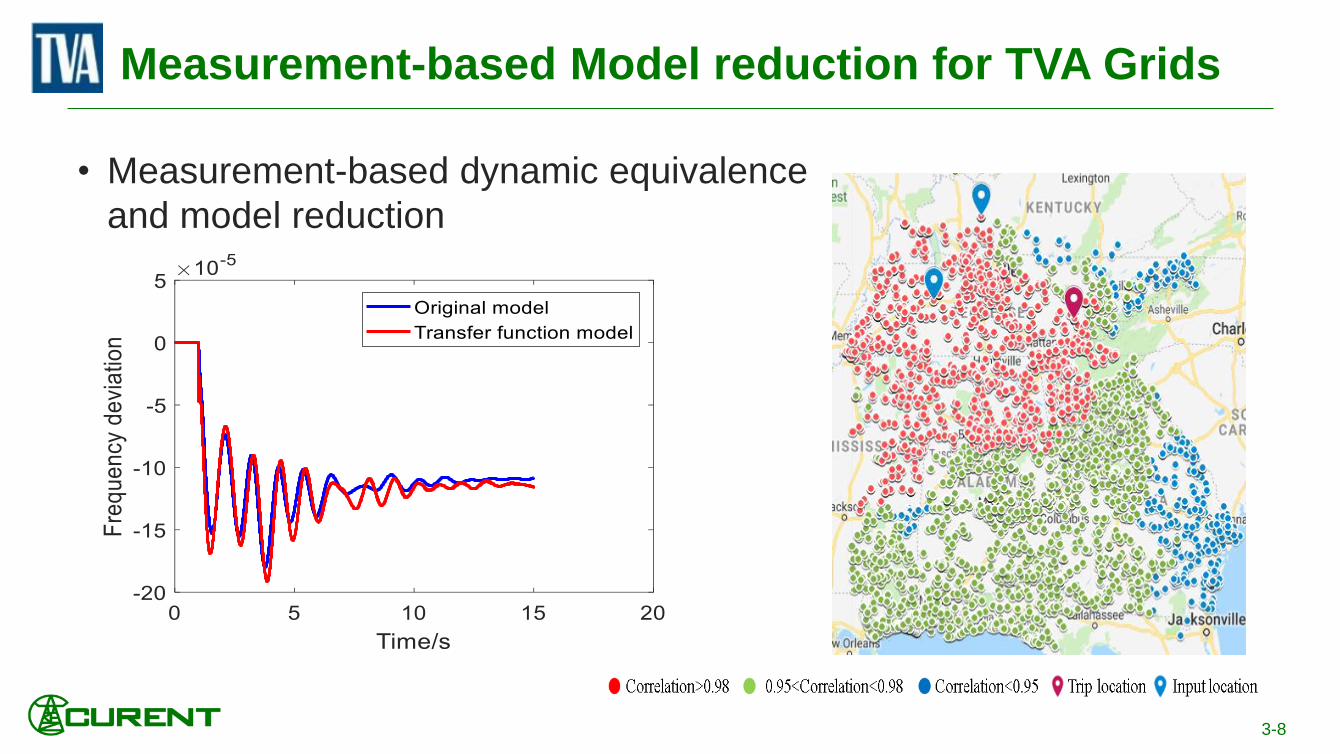
Measurement-based Model reduction for TVA Grids
• Measurement-based dynamic equivalence
and model reduction
3-8
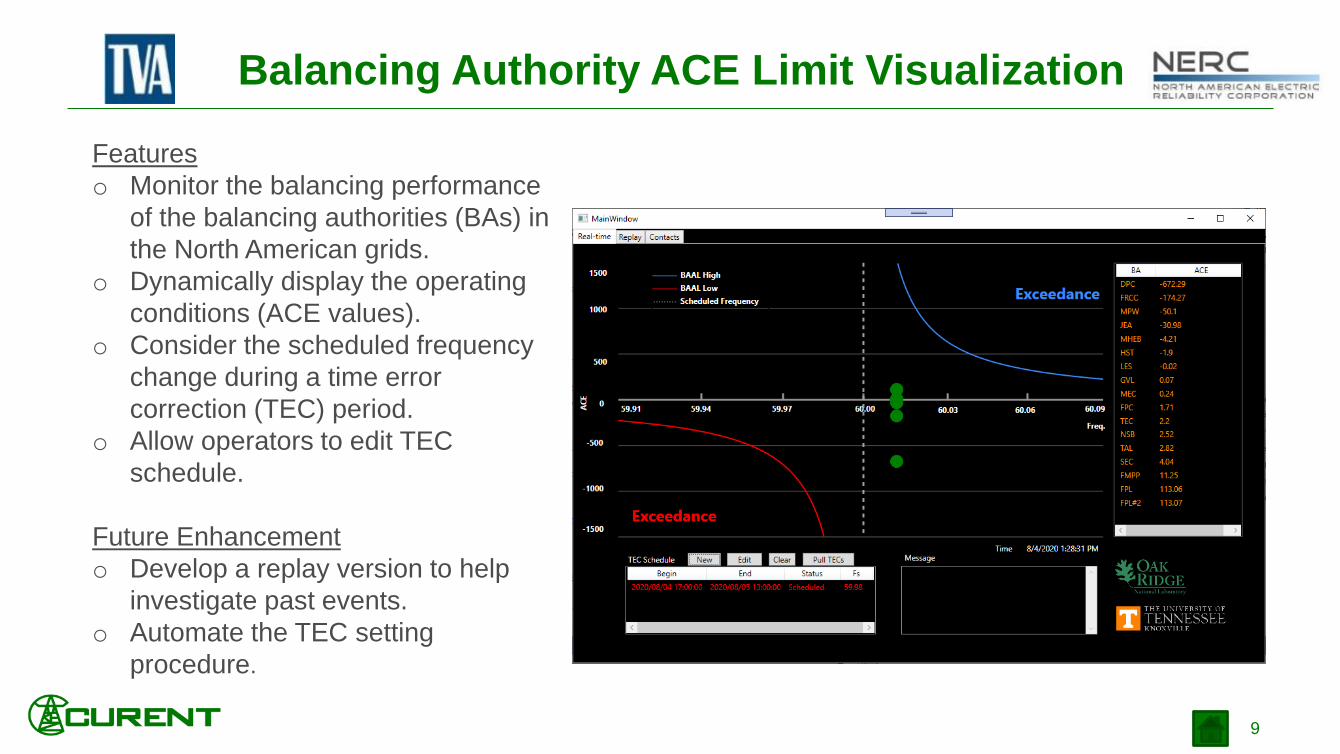
Balancing Authority ACE Limit Visualization
Features
o Monitor the balancing performance
of the balancing authorities (BAs) in
the North American grids.
o Dynamically display the operating
conditions (ACE values).
o Consider the scheduled frequency
change during a time error
correction (TEC) period.
o Allow operators to edit TEC
schedule.
Future Enhancement
o Develop a replay version to help
investigate past events.
o Automate the TEC setting
procedure.
9
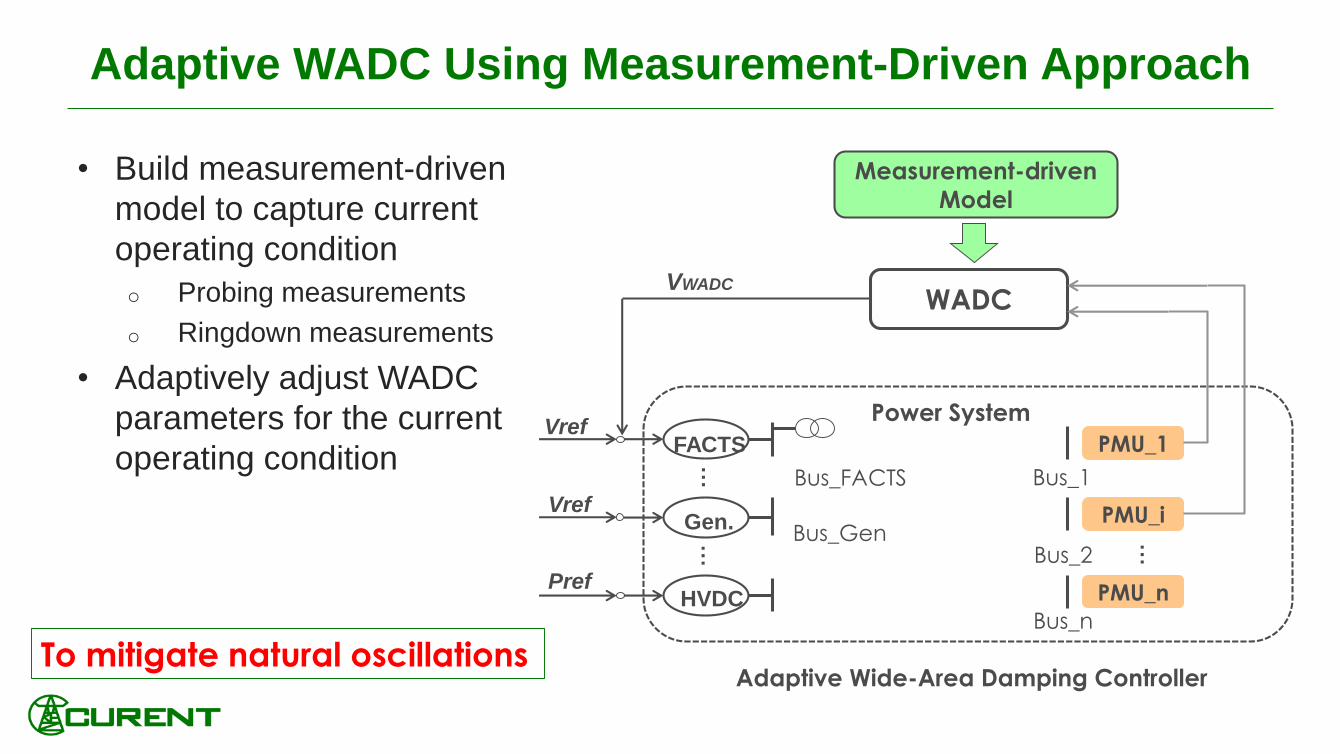
Adaptive WADC Using Measurement-Driven Approach
• Build measurement-driven
model to capture current
operating condition
o Probing measurements
o Ringdown measurements
• Adaptively adjust WADC
parameters for the current
operating condition
Gen.
Vref
Pref
……
Vref
FACTS PMU_1
Measurement-driven
Model
WADC
PMU_i
PMU_n
…
Power System
HVDC
Bus_1
Bus_2
Bus_n
Bus_FACTS
Bus_Gen
VWADC
Adaptive Wide-Area Damping ControllerTo mitigate natural oscillations

Mode #2
Mode #1
Adaptive Oscillation Damping Control: NYPA
• 2019 planning model: 70k-bus
• Two dominant modes: West-North and West-South
• Input signal: o Bus frequency in Area E
o Bus frequency difference A and E
• Actuator: Marcy STATCOM and Niagara generators
Niagara
Marcy
Adaptive WADC under cascading event
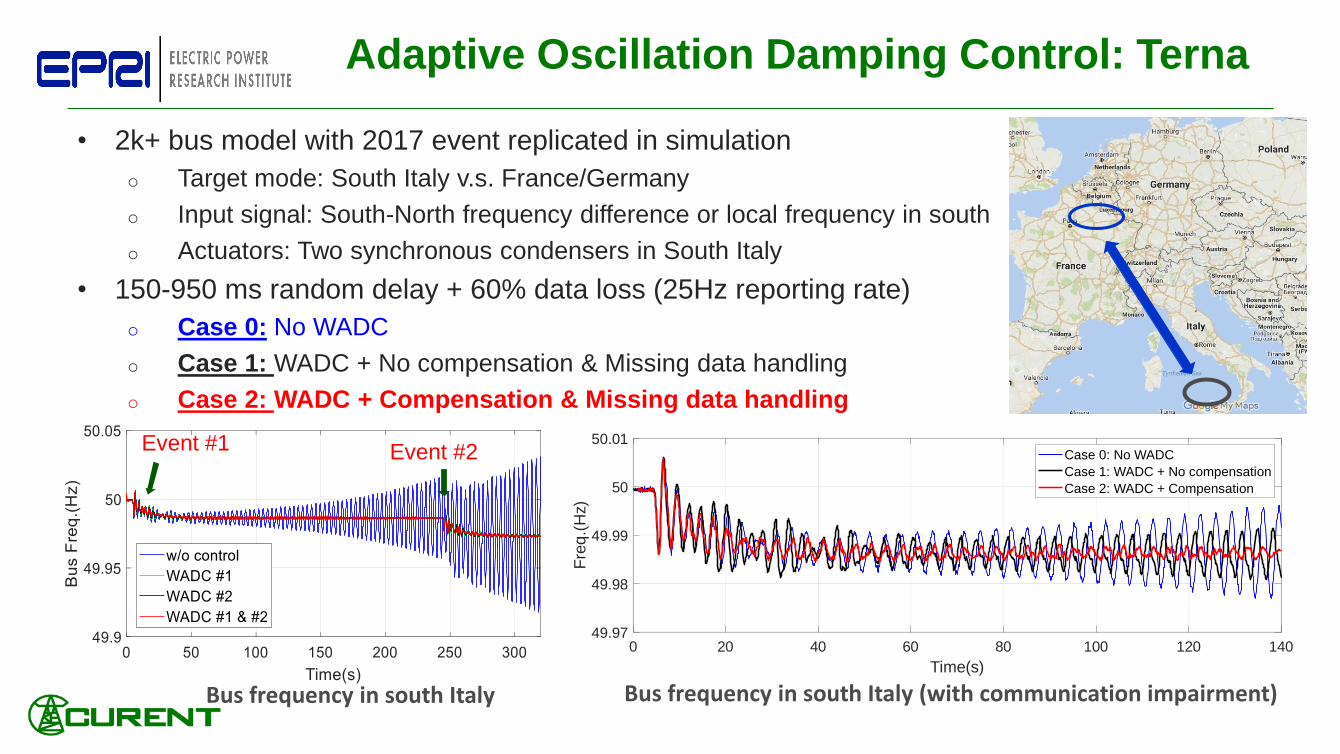
Adaptive Oscillation Damping Control: Terna
• 2k+ bus model with 2017 event replicated in simulation
o Target mode: South Italy v.s. France/Germany
o Input signal: South-North frequency difference or local frequency in south
o Actuators: Two synchronous condensers in South Italy
• 150-950 ms random delay + 60% data loss (25Hz reporting rate)
o Case 0: No WADC
o Case 1: WADC + No compensation & Missing data handling
o Case 2: WADC + Compensation & Missing data handling
Bus frequency in south Italy
Event #1 Event #2
0 20 40 60 80 100 120 140
Time(s)
49.97
49.98
49.99
50
50.01
Fre
q.(
Hz)
Case 0: No WADC
Case 1: WADC + No compensation
Case 2: WADC + Compensation
Bus frequency in south Italy (with communication impairment)

Adaptive Oscillation Damping Control: SEC Case
• 2k+ bus full model with 2017 system separation event replicated
• Target mode: west/south v.s. central/east
• Observation signal: Bus frequency between west and central
• Actuators: Generator governors, exciters, and SVCs
• Improve damping ratio and transient stability simultaneously
❑ Three incidents since 2015 that resulted in tripping tie-line between west and central - system
separation
Rotor Angle (with WADC)Rotor Angle (no WADC)

Adaptive Oscillation Damping Control: Great Britain
• Reduced 36-zone GB grid model in PowerFactory
o Target oscillation mode: North-South, ~0.88Hz
o Input signal: bus frequency between north and south
o Actuator: HVDC links
• Simulation and controller HIL test are ongoing
o Simulation in PowerFactory
o Converting PowerFactory model to RTDS.
Frequency difference-POD at different HVDCS

Forced Oscillation Mitigation Using BESS
• Controller
o Input: Frequency deviation of a
HV bus close to the BESS
o Output: Added to 𝑃aux to
modulate the active current
command
o Forced oscillation detector
o Droop control
• WECC BESS model used
o Active power control of the
BESS electrical control model
BESS model with forced oscillation control
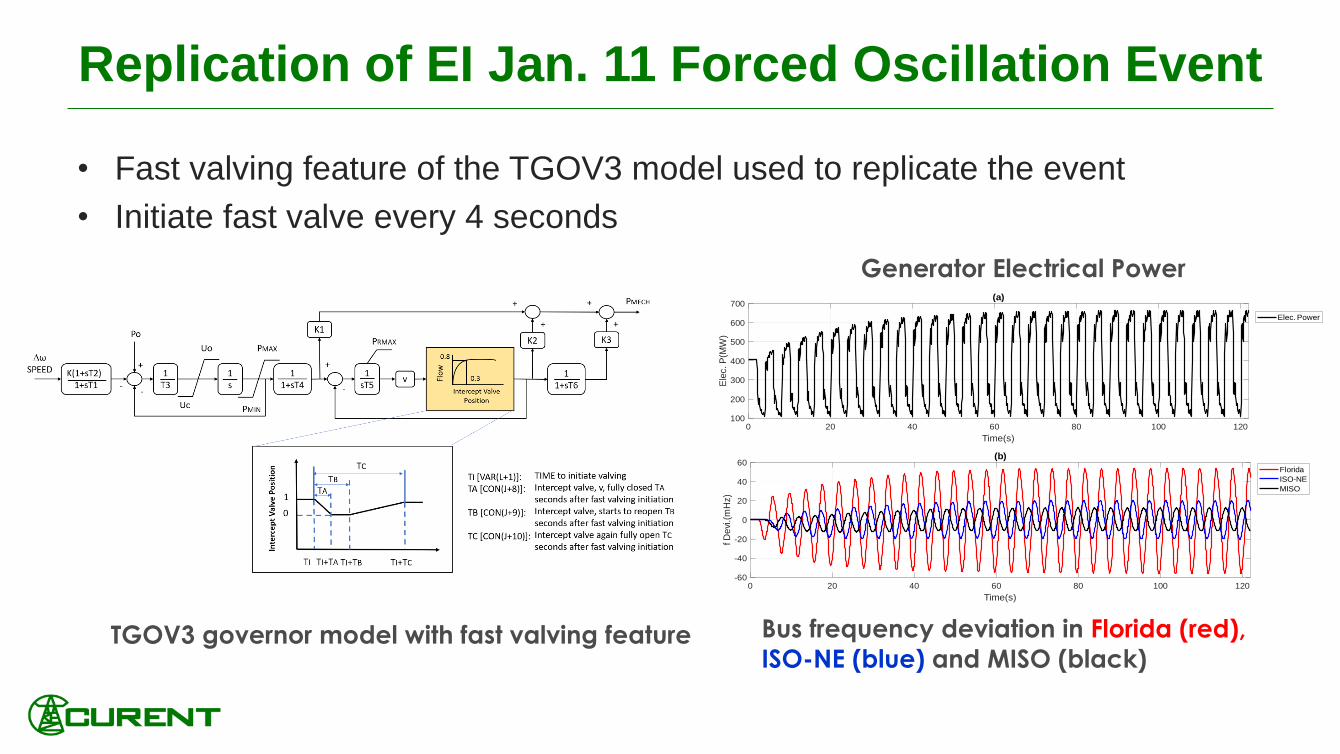
Replication of EI Jan. 11 Forced Oscillation Event
• Fast valving feature of the TGOV3 model used to replicate the event
• Initiate fast valve every 4 seconds
0 20 40 60 80 100 120
Time(s)
100
200
300
400
500
600
700
Ele
c. P
(MW
)
(a)
Elec. Power
0 20 40 60 80 100 120
Time(s)
-60
-40
-20
0
20
40
60
f D
evi
.(m
Hz)
(b)
Florida
ISO-NE
MISO
TGOV3 governor model with fast valving feature
Generator Electrical Power
Bus frequency deviation in Florida (red),
ISO-NE (blue) and MISO (black)

Locating Source of Forced Oscillation
▪ Locate the source of forced oscillation based on mode angle analysis
EI case on 01/11/2019 08:44 EI case on 04/07/2020 09:36
1.FFT analysis to obtain mode angle of the oscillation;
2.Geographically unwrap the mode angle;
3.Area with the most leading mode angle is the source.
▪ Steps:
According to observation, mode angle gradually
reduces from the source area to other areas.
WECC case on 04/28/2020
0°
30°
-5°0°
125°90°
0°
280°245°
Frequency Measurement during Forced Oscillation
Fre
qu
en
cy (
Hz)
Time
PMU 1PMU 2
▪ Cases:
17
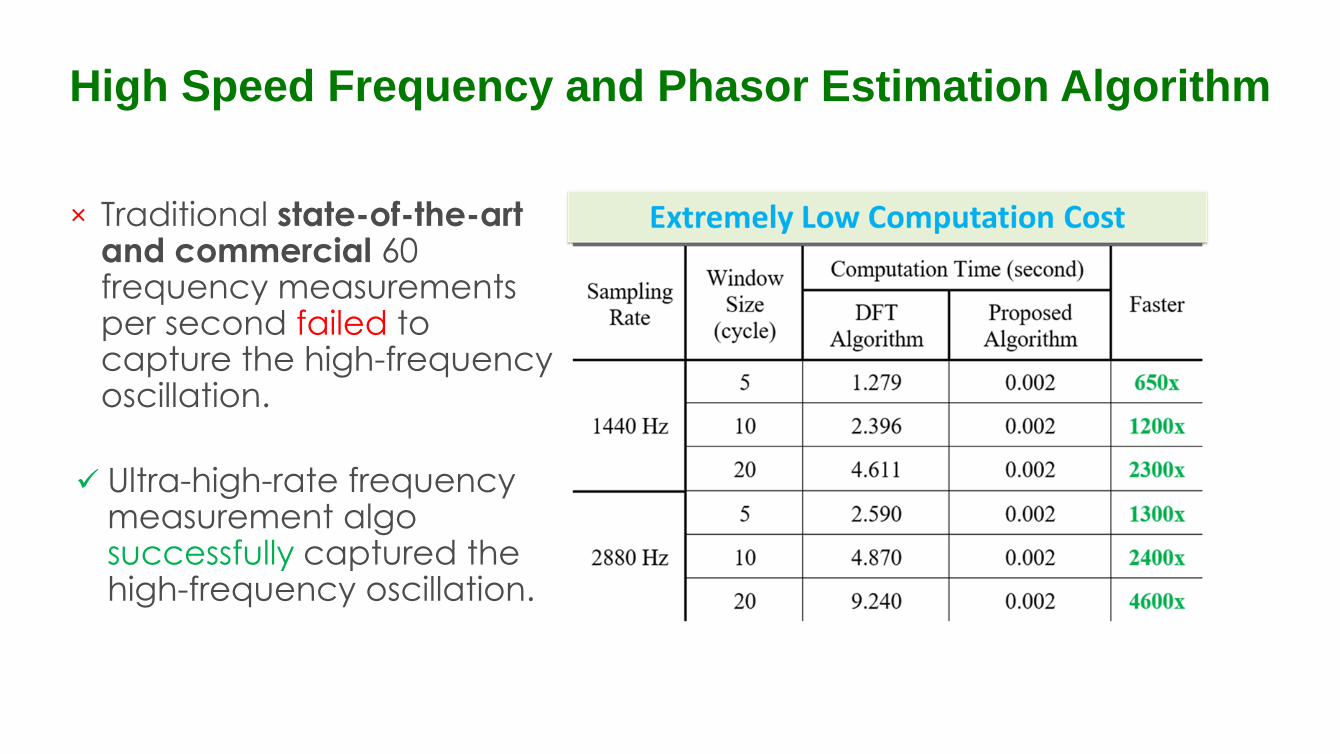
× Traditional state-of-the-art and commercial 60 frequency measurements per second failed to capture the high-frequency oscillation.
✓ Ultra-high-rate frequency measurement algo successfully captured the high-frequency oscillation.
High Speed Frequency and Phasor Estimation Algorithm
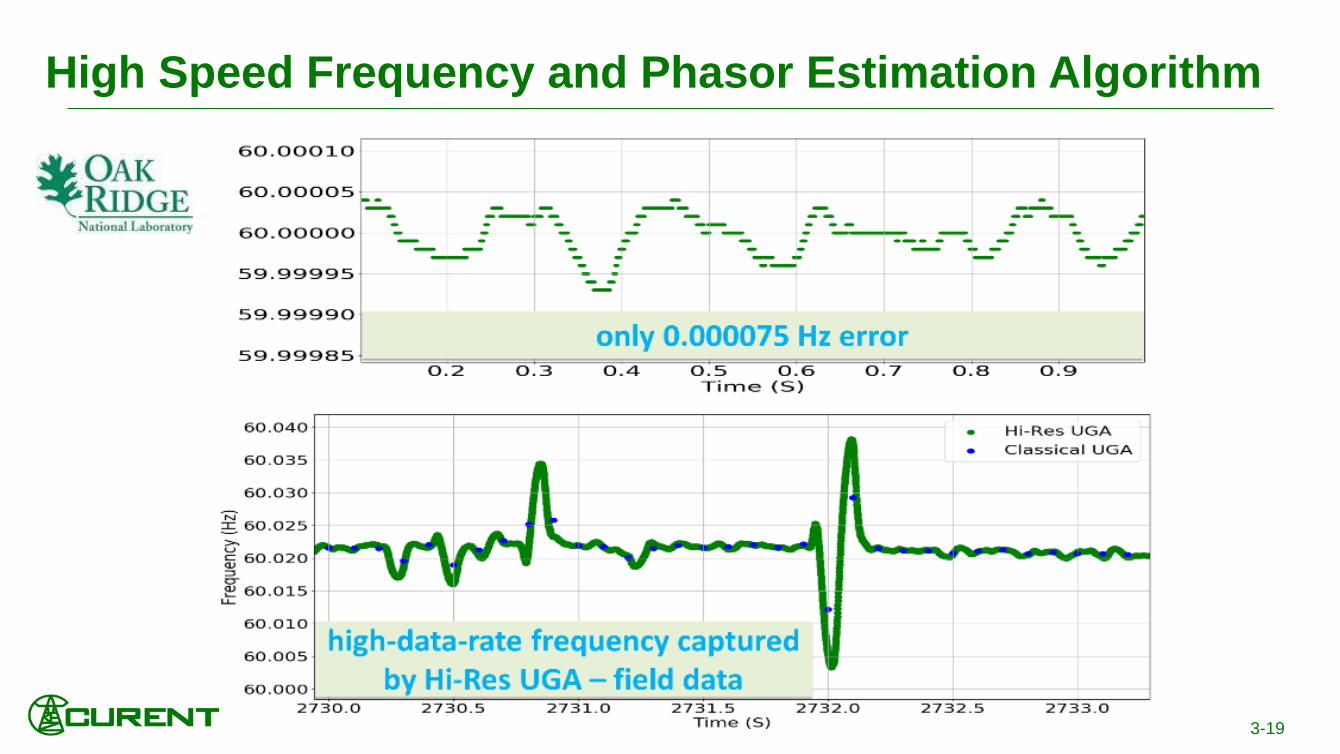
High Speed Frequency and Phasor Estimation Algorithm
3-19
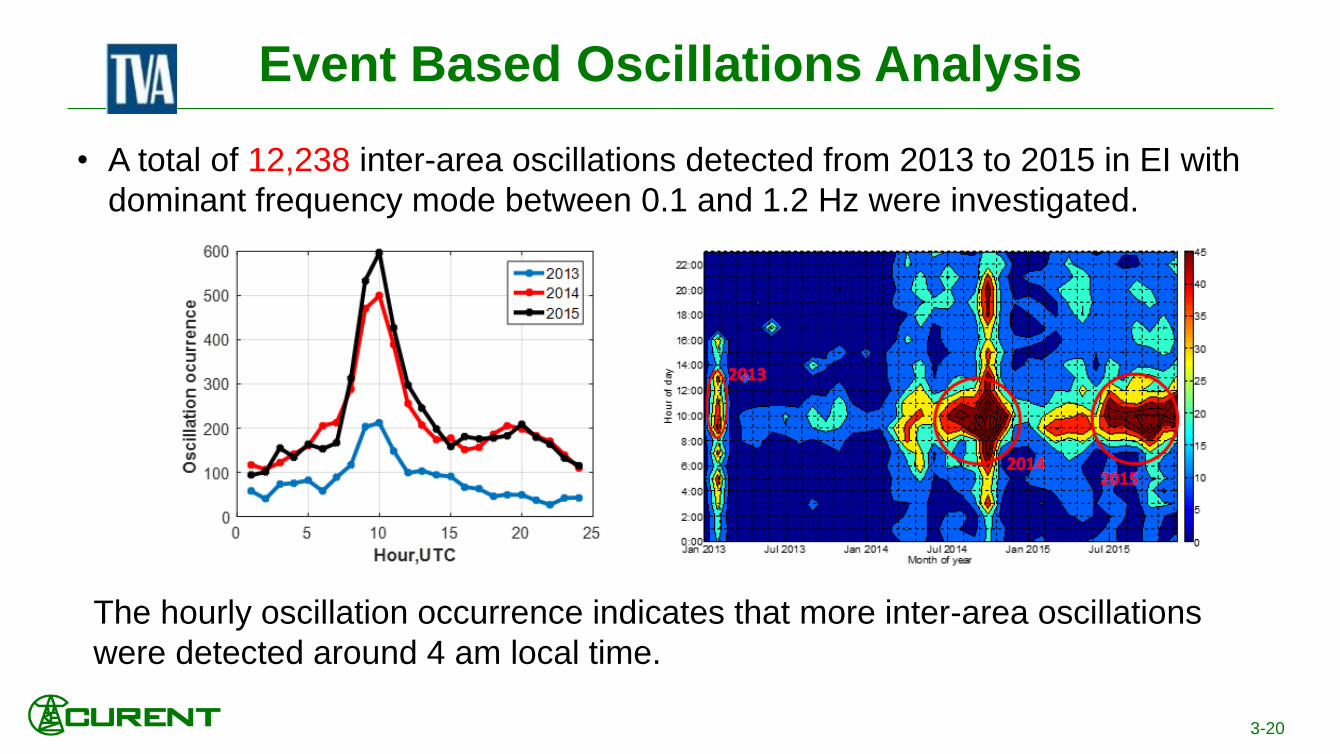
Event Based Oscillations Analysis
• A total of 12,238 inter-area oscillations detected from 2013 to 2015 in EI with
dominant frequency mode between 0.1 and 1.2 Hz were investigated.
The hourly oscillation occurrence indicates that more inter-area oscillations
were detected around 4 am local time.
3-20

Grid Inertia Estimation by Machine Learning
from Ambient Synchrophasor Data
Comparison of measured and estimated daily inertia in
WECC during heavy and light load seasonsAmbient frequency trajectory and the projection of
characteristic ellipsoid at 100% inertia level
3-21