seismic wave attenuation in carbonates - semantic … · seismic wave attenuation in carbonates ......
TRANSCRIPT
Boise State UniversityScholarWorks
CGISS Publications and Presentations Center for Geophysical Investigation of the ShallowSubsurface (CGISS)
6-4-2009
Seismic Wave Attenuation in CarbonatesLudmila AdamBoise State University
M. BatzleColorado School of Mines
K. T. LewallenExxonMobil Upstream Research Company
Kasper van WijkBoise State University
Copyright 2009 by the American Geophysical Union. DOI: 10.1029/2008JB005890

Seismic wave attenuation in carbonates
L. Adam,1,2 M. Batzle,3 K. T. Lewallen,4 and K. van Wijk1
Received 23 June 2008; revised 7 December 2008; accepted 22 January 2009; published 25 June 2009.
[1] The effect of pore fluids on seismic wave attenuation in carbonate rocks is importantfor interpreting remote sensing observations of carbonate reservoirs undergoingenhanced oil recovery. Here we measure the elastic moduli and attenuation in thelaboratory for five carbonate samples with 20% to 30% porosity and permeability between0.03 and 58.1 mdarcy. Contrary to most observations in sandstones, bulkcompressibility losses dominate over shear wave losses for dry samples and samples fullysaturated with either liquid butane or brine. This observation holds for four out offive samples at seismic (10–1000 Hz) and ultrasonic frequencies (0.8 MHz) andreservoir pressures. Attenuation modeled from the modulus data using Cole-Cole relationsagrees in that the bulk losses are greater than the shear losses. On average,attenuation increases by 250% when brine substitutes a light hydrocarbon in thesecarbonate rocks. For some of our samples, attenuation is frequency-dependent,but in the typical exploration frequency range (10–100 Hz), attenuationis practically constant for the measured samples.
Citation: Adam, L., M. Batzle, K. T. Lewallen, and K. van Wijk (2009), Seismic wave attenuation in carbonates, J. Geophys. Res.,
114, B06208, doi:10.1029/2008JB005890.
1. Introduction
[2] Velocity and amplitude analysis of elastic waves iscommon practice in reservoir rock physics. Variations inreservoir seismic properties can be related to fluid changeswithin them. Intrinsic wave attenuation, or the conversion ofmechanical energy into heat, has been a topic of research formany years. Although numerous studies examine mostlyclastic rocks [Winkler and Nur, 1982; Best et al., 1994;Murphy, 1982;Wyllie et al., 1962; Spencer, 1979; Best et al.,2007], there are few laboratory measurements of attenuationin carbonates rocks, and even fewer experimental data atexploration seismic frequencies and reservoir pressures[Lienert and Manghnani, 1990; Paffenholz and Burkhardt,1989; Spencer, 1981; Batzle et al., 2005; Gautam, 2003].Because more than half of the current major oil and gasreservoirs in the world are in carbonates, these rocks havebecome important topics of rock property research. Ourstudy analyzes wave attenuation in five carbonate samplesat seismic frequencies (101–103 Hz), and at an ultrasonicfrequency (106 Hz) for three of the samples. The rocks aremeasured dry and fully saturated with a light hydrocarbonand with a brine, at reservoir pressures.[3] There are several ways to describe intrinsic seismic
losses, and in this paper we use the definition of attenuation
as the inverse of the quality factor (Q). Intrinsic attenuationcan be defined as Q�1 = Im[M*]/Re[M*], where M* is thecomplex modulus or velocity; and the imaginary part (Im)of the complex modulus is small. Different waves andflexural modes allow us to study the shear wave (QS
�1),compressional wave (QP
�1), extensional (QE�1) and bulk
compressibility (QK�1) attenuation. Winkler and Nur [1979]
and Winkler [1979] analytically show that one of thefollowing relations between the attenuation modes willalways be true:
Q�1S > Q�1
E > Q�1P > Q�1
K ; ð1Þ
Q�1K > Q�1
P > Q�1E > Q�1
S ; ð2Þ
Q�1K ¼ Q�1
P ¼ Q�1E ¼ Q�1
S : ð3Þ
[4] For a porous medium and on the basis of the con-ceptual model of two identical cracks perpendicular to eachother and touching at their tips, Winkler [1979] interpretsrelation (1) as the expected behavior when the rock is fullysaturated, while equation (2) is for partially saturated rocks.This is generally true in sandstones for either sonic orultrasonic frequencies: the shear losses at full saturationare mostly observed to be greater than the bulk or com-pressional wave losses [Winkler and Nur, 1982; Best et al.,1994; Murphy, 1982; Wyllie et al., 1962; Spencer, 1979;Toksoz et al., 1979]. Pore shape and distribution in sand-stone could dictate that either P wave or S wave attenuationcan dominate at logging frequencies [Assefa et al., 1999;Prasad and Meissner, 1992].
JOURNAL OF GEOPHYSICAL RESEARCH, VOL. 114, B06208, doi:10.1029/2008JB005890, 2009ClickHere
for
FullArticle
1Department of Geosciences, Boise State University, Boise, Idaho,USA.
2Formerly at Department of Geophysics, Colorado School of Mines,Golden, Colorado, USA.
3Department of Geophysics, Colorado School of Mines, Golden,Colorado, USA.
4ExxonMobil Upstream Research Company, Houston, Texas, USA.
Copyright 2009 by the American Geophysical Union.0148-0227/09/2008JB005890$09.00
B06208 1 of 14

[5] However, published data on carbonates are mixedregarding which attenuation mode dominates. Lucet[1989] and Lucet et al. [1991] measured QE
�1 and QS�1 on
15 saturated limestones at sonic and ultrasonic frequencies.QE�1 > QS
�1 for virtually all the fully water saturatedsamples. Paffenholz and Burkhardt [1989] and Cadoret etal. [1998] observe that QE
�1 > QS�1 at seismic and sonic
frequencies respectively for water-saturated samples. Re-cently, Best et al. [2007] and Agersborg et al. [2008]measured carbonate samples at ultrasonic frequencies andhigh differential pressures. Differential pressure is thedifference between hydrostatic confining pressure and porepressure. The three carbonate samples from Best et al.[2007] show mixed relations between QP
�1 and QS�1, be-
cause the samples have velocity and attenuation anisotropyresulting from the complex pore structure. Four out of thesix samples from Agersborg et al. [2008] have estimates ofQP�1 greater than QS
�1 under dry and fully brine saturatedconditions at 30 MPa differential pressure. Most of theprevious work, except for Lucet [1989] and Assefa et al.[1999], has been performed at room conditions and withthe samples either dry or saturated with water and measuredat high frequencies. Here we study samples near thereservoir differential pressures over a broad frequencyrange, dry and saturated with brine, as well as with a lighthydrocarbon for the purpose of reservoir characterization.For our fully saturated carbonate samples, the correlationamong the different attenuation modes is described byrelation (2).[6] For our carbonate sample set, we address five impor-
tant relationships. Specifically, we examine the relationbetween the modes of attenuation, compare Q at seismicand ultrasonic frequencies, measure the sensitivity of Q tofluids (either a light hydrocarbon or a brine), investigate thefrequency dependence of Q in the exploration seismicbandwidth (10–100 Hz), and determine if there is a corre-lation between attenuation and permeability. Both the sen-sitivity of attenuation to fluids and its correlation topermeability are important for studying the evolution ofreservoir systems, because one possible application forutilizing attenuation as a monitoring tool is during enhanced
oil recovery where water, steam or CO2 is injected into thereservoir to stimulate oil production. Although quantitativeintrinsic attenuation data from surface seismic have been aninterpretive challenge historically, characterizing attenuationbecomes more robust as acquisition and processing tech-nologies continue to improve.
2. Samples
[7] The core samples in this study come from two MiddleEastern carbonate reservoirs undergoing enhanced oil re-covery. The core plugs from the first reservoir are samples100, 200, and 300. For this field, light hydrocarbon pro-duction is stimulated by injecting brine into the reservoir[Soroka et al., 2005]. Samples from the second reservoir arenamed B and C; corresponding to the same samples as inthe work by Adam et al. [2006]. The samples are eitheralmost pure calcite or dolomite (>95% total volume), withless than 3% clays. Table 1 summarizes the petrographicalanalysis. Porosity and permeability are measured usingstandard helium porosimetry and air permeability equip-ment. Permeability values are corrected for Klinkenberggas slippage. The samples are cylindrical, and either 2.5 or3.75 cm in diameter, with lengths varying from 4.3 to5.5 cm. We now describe the petrographical characteristicsof the samples, and thin sections for the samples are shownin Figure 1.[8] Sample 100 has a mud-supported wackestone texture.
Blue haze in the thin sections implies abundant micropo-rosity (Figure 1). The presence of microporosity suggeststhe sample has a large content of irreducible water in situ.Micropores are 1–5 mm. The main fossil observed isOrbitolina. The sample is mostly calcite with calcite cement.Dolomite is deposited in small vugs after the dissolution ofcalcite (burial dolomite). It contains autogenic quartz andlinear clam fragments [Scholle and Ulmer-Scholle, 2003].[9] Sample 200 also has a mud-supported wackestone
texture. This sample is similar to sample 100, except thatmicropores are larger (20–50 mm). The sample is partiallyburrowed and dolomite crystals are less coarse. This samplehas larger amounts of fossils fragments than sample 100(e.g., rudist fragments [Scholle and Ulmer-Scholle, 2003]).[10] Sample 300 has a packstone borderline grainstone
texture with abundant skeletal debris with inter-particleporosity. This type of porosity results in better permeability.Echinoderm fossils are surrounded by a synaxial overgrowthof calcite cement. Different textures between stylolytes areprobably the result of high- and low-energy environments.[11] Sample B has a mudstone texture, composed of rela-
tively pure dolomite with a nonplanar fabric and a unimodal,aphanocrystalline to very finely crystalline structure. Thesample has horizontal solution seams (or microstylolites) andsmall vugs (<1 mm), possibly infilled by an iron oxide.[12] Sample C has a skeletal grainstone texture with
finely crystalline spar matrix. Skeletal grains have beenlargely dissolved, but those remaining are foraminifera(mostly miliolids and other rotalids), ranging from 0.25 to1.5 mm in diameter, moderately sorted. Contains moldicporosity, partially filled with euhedral dolomite rhombs(30–60 mm in diameter), and interparticle porosity, partiallyfilled with subhedral finely crystalline calcite.
Table 1. Petrological Data for the Carbonate Seta
Samples
100 200 300 B C
Porosity (%) 32.79 30.46 20.39 4.60 21.00Permeability (mdarcy) 6.75 5.19 58.10 0.03 5.50Grain density (g/cm3) 2.71 2.71 2.71 2.84 2.70Calcite (%) 90.6 89.4 98.6 0.7 75.8Dolomite (%) 8.5 9.6 TR 97.0 20.6Quartz (%) 0.6 0.7 1.2 0.6 1.2Phyllosilicates (%) 0.0 TR TR 0.8 2.4Texture wacke wacke pack mud grainDepth (m) 2479 2452 2456 3181 3138Reservoir Pd (MPa) 34.5 34.5 34.5 35.8 35.8Heterogeneity none none vertical
bandshorizontalbands
none
aMineralogy was obtained from XRD analysis and are reported inpercent per volume. TR means less than 0.3%. Texture follows modifiedDunham’s carbonate classification [Moore, 2001]: mud, mudstone; wacke,wackestone; pack, packstone; and grain, grainstone. Porosity and perme-ability are measured at 18.3 MPa confining pressure for samples 100, 200,and 300 and at reservoir pressures for samples B and C. By heterogeneitywe refer to visual or CT scan heterogeneous features.
B06208 ADAM ET AL.: SEISMIC WAVE ATTENUATION IN CARBONATES
2 of 14
B06208

[13] On the basis of the fossil types, samples 100, 200,and 300 were deposited in the photolytic zone. In all threesamples the cement is calcite and there are no clays.[14] Samples 100 and 200 are similar in most petrographic
aspects, with the main difference being the pore size esti-mated from the digital thin section images. Sample 100 has1–5 mm pores, compared to 20–50 mm for sample 200.Small radius pores (�10 mm) generally have small porethroats, while larger radius pores (>10 mm) could either havelarge or small pore throats [Lindquist et al., 2000]. Thus,sample 200 may have larger pore throats than sample 100.Pore throats are important, as they control the time fluidpressure takes to reach equilibrium after being disturbed by a
passing wave. This fluid pressure disequilibrium controlsattenuation. Figure 2 shows the CT scans of the samples.Gray scales represent densities contrasts. Sample 300 is themost heterogeneous, with vertical textural bands. Althoughwe do not have the CT scan for sample 100, the scanningelectron microscope (SEM), thin section and visual inspec-tion show similarities to sample 200. Sample C, in spite ofabundant fossils, is overall homogeneous. Finally, Figure 3contains the SEM images of samples 100, 200, and 300.Crystals of dolomite are observed for samples 100 and 200but are mostly absent for sample 300, verifying the XRD data(Table 1).
Figure 1. Thin section of samples (a) 100, (b) 200, (c) (300, (d) B, and (e) C. Shown in plane polarizedlight. Dyed epoxy is blue and represents pore space.
Figure 2. CT scans of samples (a) 200, (b) 300, and (c) B. Gray color variations represent densitycontrasts. Observe how sample 300 is heterogeneous with bands of different textures/porosity.
B06208 ADAM ET AL.: SEISMIC WAVE ATTENUATION IN CARBONATES
3 of 14
B06208

[15] Velocity and attenuation anisotropy is not expectedto be significant on these samples based on CT scans andvisual inspection. Still, we do not quantitatively show thepresence or absence of anisotropy.
3. Experimental Procedure
[16] The core samples are measured dry (humidified, asdescribed below), 100% saturated with liquid butane(C4H10, a light hydrocarbon) or with high-salinity brine(180,000 ppm NaCl). Samples are first measured dry, thenbutane is injected into the sample until there is no more flowfrom the fluid pump to the sample, indicating we havereached a full saturation state. Butane at room conditions isa gas, but becomes liquid at pressures greater than 0.3 MPa.To remove the liquid butane from the sample pore space, weslowly decrease the pore pressure until we reach the roompressure condition. We then open the fluid lines to let thebutane gas escape. Brine is injected into the sample thesame way as for butane. Samples are coated with animpermeable polyimide film (Kapton), over which semi-conductor strain gages are glued to measure rock deforma-tions at seismic frequencies. This film keeps moisture insidethe rock, prevents nitrogen diffusion and eliminates theBiot-Gardner effect observed in unjacketed rocks [Gardner,1962; White, 1986; Morig and Burkhardt, 1989].[17] All dry samples, except sample B, are initially
humidified by storing the samples in a humidifying chamberat 98% humidity for 2 weeks, to create matrix softening thatresults from moisture in the pore space. Clark et al. [1980]showed that introducing water vapor (�1% water saturationin pores) to oven dry samples can significantly reduce therock bulk and shear moduli, and increase attenuation. Thewater content is not expected to be less than 1% inreservoirs, as even gas filled reservoirs have irreduciblewater in the pore space. The rock sensitivity to water vaporis directly related to the pores surface area. Nonetheless, wewill show here that as the brine saturation of the rockincreases, the rock frame softens. Such weakening couldwell be observed in reservoirs where brine displaces theoriginal gas or fluid.[18] Figure 4 is a drawing of the sample setup and a
sketch of the recorded low-frequency strains for the differ-ent gages. At seismic frequencies, moduli and attenuationare measured by applying a sinusoidal stress to the rock andmeasuring the resulting strain in different directions on therock sample and on the reference material (aluminum). Themeasured strain amplitudes are low (�10�7), the same
Figure 3. Scanning electron microscope (SEM) for samples (a) 100, (b) 200, and (c) 300. Sample 100shows dolomite crystals. There are no SEM images for samples B and C.
Figure 4. Sample schematic for measurements at seismicfrequencies (with strain gages) and ultrasonic frequencies(with transducers). Confining pressure is applied to thewhole system, and pore pressure is controlled through thepore fluid lines. The strain gage responses for the three gagelocations are also sketched.
B06208 ADAM ET AL.: SEISMIC WAVE ATTENUATION IN CARBONATES
4 of 14
B06208

amplitude as the deformation imposed on the reservoirs inthe field by seismic waves. The samples and reference arecylindrical and are attached in series with the cylinder axiscoinciding with the axis of applied stress. The moduli areestimated from the amplitude of the strain signatures (fordetails, see Batzle et al. [2006]). To measure ultrasonicfrequencies, we use transducers embedded in the aluminumreference (Figure 4). We record the waveform transmittedthrough the rock core [Birch, 1960]. From the measuredtime of flight and sample length, we estimate the P andS wave velocities and from these, the rock moduli. Sampleswith visible heterogeneity or large vugs the size of the straingages (�0.5 cm) are avoided because the gages willmeasure the properties of the heterogeneity, biasing theestimate of attenuation. For the ultrasonic pulse, theseheterogeneities can create scattering losses.[19] The whole system as shown in Figure 4 is lowered
into a high-pressure vessel. Confining (hydrostatic) pressure(Pc) is applied with nitrogen gas; while the pore pressure(Pp) is controlled through the pore fluid lines with differenttypes of fluids. We present attenuation data recorded underdifferential pressure (Pd): Pd = Pc � Pp. Velocity andattenuation data are measured at Pd = 31 MPa differentialpressure for samples 100 and 200, Pd = 24 MPa for sample300, and for samples B and C, Pd = 21 MPa. For all rocks,Pp was held constant at 3.5 MPa. Because the samplesetup is pressurized with nitrogen gas, for safety reasonsthe system is not able to quite reach the reservoir’s confin-ing pressure. However, the pressures in the experimentalsetup are close to the reservoirs differential pressure (seeTable 1).[20] In our experiments, we estimate QE
�1 and QS�1 at
seismic frequencies, and QP�1 and QS
�1 at ultrasonic fre-quencies. In a viscoelastic material, the strain lags in phasewith respect to the stress. This phase lag (q) can bedescribed in terms of the complex modulus: Q�1 =Im[M*]/Re[M*] = tanq � q. Because the phase lag is small,we can approximate the tangent by the angle itself. In ourlow-frequency experiments, attenuation is estimated fromthe phase lags between the different strains. The phase isobtained by using a lock-in amplifier. We assume that thephase of the strain on the aluminum represents the phase ofthe applied stress. This is a reasonable assumption becausethe attenuation for aluminum is low (Q�1 � 10�5). Thus,extensional attenuation (QE
�1) is estimated from the phaselag of the vertical strain on the rock and the referencealuminum. The vertical strain on the rock has the largeststrain waveform amplitudes, yielding robustness in theestimate of QE
�1. To obtain the shear wave attenuation, weuse the following relation [White, 1965]:
1
QS
’ 1
QE
� n tan qnð Þ1þ n
ð4Þ
where n is Poisson’s ration and qn is the phase lag betweenthe vertical and horizontal strain on the rock sample.Poisson’s ratio at seismic frequencies is obtained from theratio of the horizontal and vertical strain amplitude on therock. The estimate of QS
�1 is not overly sensitive to an errorin n. A ±10% bias in n translates into a ±2% error QS
�1.Winkler and Nur [1982] derive equations that enable the
estimation of a specific mode of attenuation for isotropicmaterials from two other attenuation modes and thePoisson’s ratio. We estimate the P wave and the bulkcompressibility attenuation from [Winkler and Nur, 1982]
1� nð Þ 1� 2nð ÞQP
¼ 1þ nQE
� 2n 2� nð ÞQS
1� 2nQK
¼ 3
QE
� 2 n þ 1ð ÞQS
ð5Þ
[21] For the ultrasonic data, attenuation is estimated bythe spectral ratio method [Toksoz et al., 1979; Hauge, 1981].An aluminum sample of the same shape and dimensions asthe rock sample is used as a reference material to establishthe base spectra. Aluminum has a high bulk modulus (K =76 GPa) and a high Q. The waveforms on the aluminumsample were measured at room conditions and under31 MPa confining pressure, but there is no significantdifference in the ultrasonic waveform or on the amplitudespectrum at these conditions. The direct arrivals for thesample and aluminum are windowed by a Hanning-typefunction, and the amplitude spectra are obtained from adiscrete Fourier transform to these isolated events. Q isestimated from the logarithm of the ratio of amplitudespectra as a function of frequency. P and S wave attenuationare directly estimated from the waveforms, and we use therelations in equation (5) to estimate the remaining twoattenuation modes.
4. Parameter Uncertainty
[22] Estimates of the error in our data are represented interms of the standard deviation (s) between our noisyobservations and data predicted by an assumed true model(for details, see Adam et al. [2006]). For the low-frequencydata, this is the standard deviation of our phase measure-ments and the Poisson’s ratio. The repeatability or standarddeviation of the phase measurements with our lock-inamplifier is on average 0.03 degrees [Gautam, 2003].One standard deviation of the Poisson’s ratio (n) is onaverage 0.002. These phase and n standard deviations arepropagated to estimate the error in Q�1 at seismic fre-quencies. On average, at low frequencies, one standarddeviation in 1/QK, 1/QP, 1/QE, 1/QS are 0.0042, 0.0090,0.0023, 0.0031, respectively. The average s in P wave andS wave seismic velocity are 121 and 42 m/s, respectively.[23] Attenuation at ultrasonic frequencies is estimated
by the spectral ratio method on the recorded waveforms.On average, the estimated standard deviation for 1/QK,1/QP, 1/QE, 1/QS at ultrasonic frequencies are 0.0019,0.0007, 0.0019, 0.0012, respectively. The average s forP wave and S wave ultrasonic velocities are 22.4 m/sand 7.8 m/s, respectively.[24] We cannot quantify the bias estimate on our Q
estimate because we do not know the true model, but wecan estimate part of a bias on Q on the basis of thedifference in attenuation estimates between two methodol-ogies. The frequency shift [Quan and Harris, 1997] and thespectral ratio methods assume Q to be frequency-indepen-dent, but Q is estimated differently by integrating or takingthe ratio of amplitude spectra, respectively. On average, the
B06208 ADAM ET AL.: SEISMIC WAVE ATTENUATION IN CARBONATES
5 of 14
B06208

ultrasonic attenuation estimates between these two methodsdiffer by 18%. Other sources of bias on Q are possible ifwe have errors in the following two parameters. (1) If thereis a ±10% variation in this window size, the error in Q is±20% because we either include late arrivals or the windowis not long enough to contain the whole amplitude infor-mation of the direct arrival. (2) If there is a ±5% error in thepicked first arrival time, Q has an error of ±6%.
5. Dispersion
[25] Figure 5 shows the P wave velocity as a function offrequency for samples 100, 200, and 300, estimated atseismic frequencies between 10 and 1000 Hz, and accom-
panied by a single ultrasonic data point at 0.8 MHz. We plotthe low-frequency velocity at three representative points(10, 100, and 1000 Hz) obtained from the parameterestimation and error analysis described in section 4. Thedata points near 104 Hz are obtained from sonic log data inthe wells from which the rock samples were cored. Thisvelocity is an average over a 0.6 m depth range centered atthe sample depth. From the resistivity and bulk density logs,we conclude that the samples were extracted from brine-saturated reservoir intervals. Overall, the P wave velocityfor the three samples consistently increases with frequency.At low frequencies, sample 300 has large error bars in thevelocity, so the velocity in this sample could be interpretedas nondispersive in the seismic frequency range.[26] There are two reasons why the ultrasonic velocity is
higher than seismic and log velocities. High velocities atultrasonic frequencies can result from the bulk stiffeningdue to pore fluid pressures being unable to reach equilibriumwithin one wave period [Biot, 1956b]. At low frequenciesthere is enough time for the pore fluid pressure to relax, thesystem is, therefore, more compliant, which results in lowervelocities. Our observed velocity dispersion is in agreementwith those from the broad frequency range experiment onsandstones by Sams et al. [1997] and Best and Sams [1997].This velocity dispersion could be modeled by existingdispersive media theories [Biot, 1956a, 1956b; O’Connelland Budiansky, 1977; Dvorkin et al., 1995; Muller andGurevich, 2005]. However, choosing the wave dispersionmechanisms that best describe our data is beyond the scopeof this paper.[27] An alternative explanation why the ultrasonic veloc-
ity is higher than for seismic and log frequencies is that theultrasonic wave propagation is path-dependent. This phe-nomenon is particularly relevant given our transducer size.Each ultrasonic crystal (P and S wave) in our transducerpackage has a diameter of 0.75 cm, compared to thealuminum casing diameter of 3.75 cm. Small transducersare used because the aluminum casing is also our referencematerial for the strain measurements, and a large crystalembedded into the casing would change the elastic proper-ties of the aluminum. Because the transducer face is smallwith respect to the sample diameter, the generated high-frequency wave can propagate through the fastest path inthe sample. For a heterogeneous sample with high and lowcompressibility regions, a portion of the ultrasonic pulsepreferentially propagates along incompressible, high-speedwave regions according to Fermat’s principle.[28] For sample 300, the log data agree better with the low-
frequency data than with the ultrasonic data (Figure 5). Fromthe CT scan for sample 300 (Figure 2), zones of high and lowcompressibility are aligned with the pulse propagation direc-tion, accentuating the fast path phenomenon. The ultrasonicenergy then can traverse this heterogeneous sample morequickly, leading to an overestimate of the average wave speedof sample 300. This analysis is qualitative at this point, but itshows how a relatively high ultrasonic velocity can be due tofluid-rock dispersion as well as path dependence dispersion.
6. Attenuation Modes
[29] Figures 6 to 10 show the different attenuation modesfor all the samples as a function of frequency for three pore-
Figure 5. P wave velocity as a function of frequency forsamples 100, 200, and 300, measured dry and fullysaturated with liquid butane and brine. A linear fit isapplied to the low-frequency data (3, 100, and 1000 Hz).The data at 104 Hz are obtained from the sonic logs. One sfor the ultrasonic data is the size of the markers. Pd,differential pressure.
B06208 ADAM ET AL.: SEISMIC WAVE ATTENUATION IN CARBONATES
6 of 14
B06208
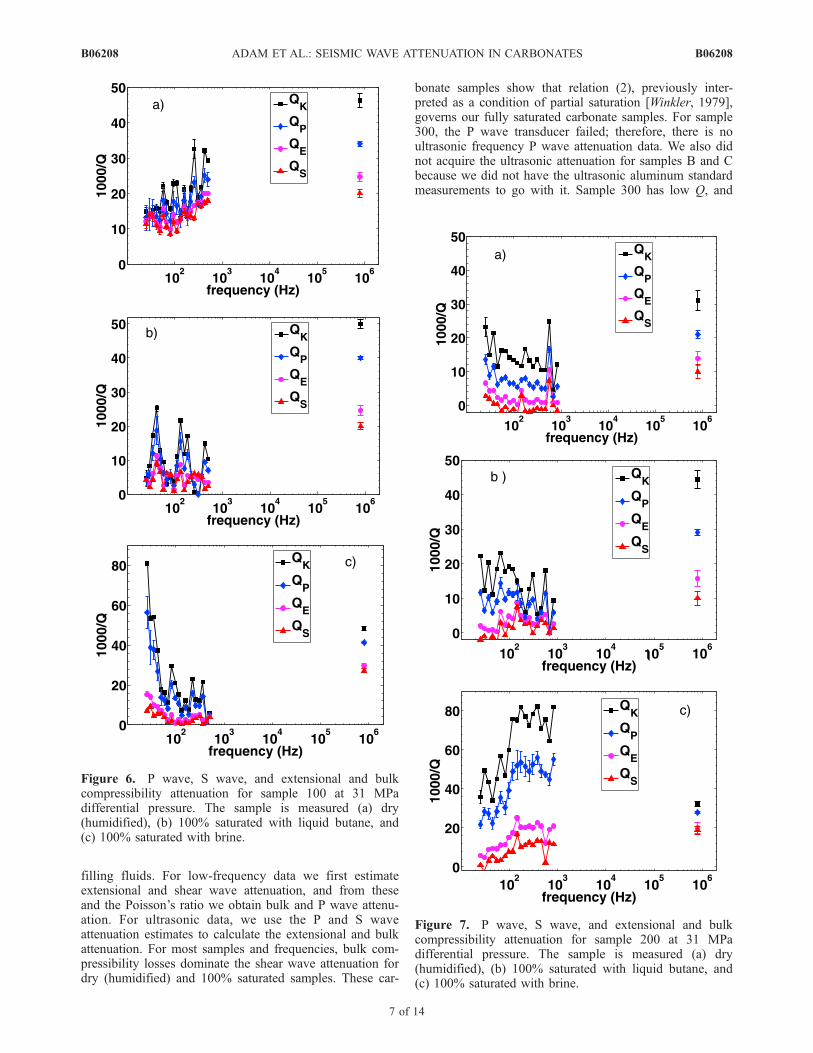
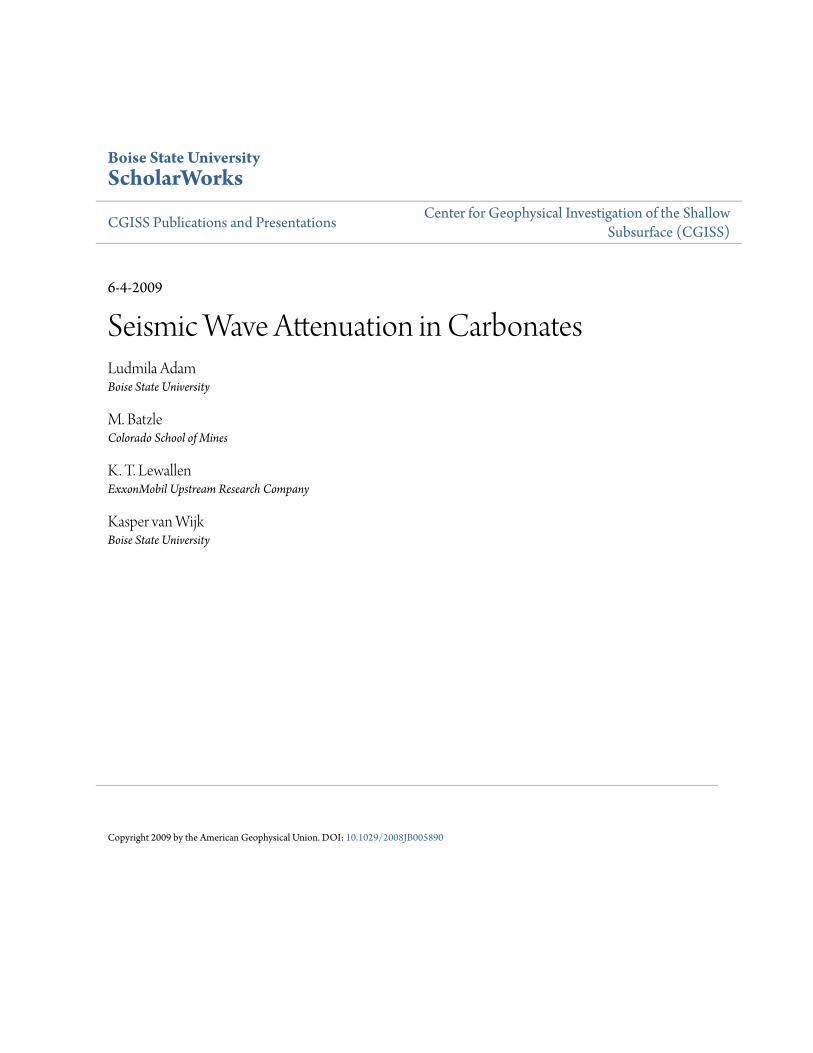
filling fluids. For low-frequency data we first estimateextensional and shear wave attenuation, and from theseand the Poisson’s ratio we obtain bulk and P wave attenu-ation. For ultrasonic data, we use the P and S waveattenuation estimates to calculate the extensional and bulkattenuation. For most samples and frequencies, bulk com-pressibility losses dominate the shear wave attenuation fordry (humidified) and 100% saturated samples. These car-
bonate samples show that relation (2), previously inter-preted as a condition of partial saturation [Winkler, 1979],governs our fully saturated carbonate samples. For sample300, the P wave transducer failed; therefore, there is noultrasonic frequency P wave attenuation data. We also didnot acquire the ultrasonic attenuation for samples B and Cbecause we did not have the ultrasonic aluminum standardmeasurements to go with it. Sample 300 has low Q, and
Figure 6. P wave, S wave, and extensional and bulkcompressibility attenuation for sample 100 at 31 MPadifferential pressure. The sample is measured (a) dry(humidified), (b) 100% saturated with liquid butane, and(c) 100% saturated with brine.
Figure 7. P wave, S wave, and extensional and bulkcompressibility attenuation for sample 200 at 31 MPadifferential pressure. The sample is measured (a) dry(humidified), (b) 100% saturated with liquid butane, and(c) 100% saturated with brine.
B06208 ADAM ET AL.: SEISMIC WAVE ATTENUATION IN CARBONATES
7 of 14
B06208

overall the attenuations are equal for all modes. Highattenuation is probably responsible for the inability todistinguish between attenuation modes.[30] There are two ways we try to ensure full saturation of
the connected pore space. First, we calculate the connectedpore volume from the porosity and dimensions of thesample. We then monitor the fluid flow into the sampleuntil there is no more flow from the pump to the sample.The volume of injected fluid is within 2% of the computedpore volume. Second, we observe the bulk modulus as a
function of brine saturation. Figure 11 shows the bulkmodulus as a function of saturation for sample 300. Theaddition of pore fluid stiffens the sample, which we observeas an increase in bulk modulus. The significant increase ofthe bulk modulus at 100% saturation supports the assump-tion that sample 300 is fully saturated. Observe that a smallamount of gas (�8%) drops the bulk modulus close to itsdry sample value for seismic frequencies. For ultrasonicfrequencies, the bulk modulus starts increasing at a satura-tion lower (�23%) than for the seismic frequencies
Figure 8. P wave, S wave, and extensional and bulkcompressibility attenuation for sample 300 at 24 MPadifferential pressure. The sample is measured (a) dry(humidified), (b) 100% saturated with liquid butane, and(c) 100% saturated with brine.
Figure 9. P wave, S wave, and extensional and bulkcompressibility attenuation for sample B at 21 MPadifferential pressure. The sample is measured (a) dry(humidified), (b) 100% saturated with liquid butane, and(c) 100% saturated with brine.
B06208 ADAM ET AL.: SEISMIC WAVE ATTENUATION IN CARBONATES
8 of 14
B06208

(�62%). As mentioned in section 5, the velocity or modulusincrease with frequency can result from rock-fluid disper-sion mechanisms or path effects. Samples partially saturatedby imbibition can have regions that are saturated whileothers remain dry. These saturated regions can form prefer-ential high-speed paths with high bulk moduli.[31] The dominance of the bulk over shear attenuation for
our saturated samples can be explained two ways. The firstis related to the fact that relations (1) and (2) are associatedwith full or partial saturation respectively. This interpreta-
tion is based on a conceptual model of two identical lowaspect ratio pores (cracks) perpendicular to each other attheir tips [see Winkler and Nur, 1982, Figure 15]. Becausewe are dealing with carbonate rocks of complex texture, thevariety of pore shapes may not be well described by this twocrack model. Thus, the saturation state of carbonate rocksmight not be possible to determine from the relation amongthe different attenuation modes. Second, Dvorkin et al.[1995] show that squirt flow from softer pores or cracksto stiffer pores in fully saturated rocks can predict that thecompressional wave attenuation is greater than the shearwave losses. This model is hard to implement with our data,because attenuation for low pressure is calculated from dataat high pressure, where cracks or compliant pores areassumed to be closed. Also, pore scale squirt models areprobably not dominant at seismic frequencies [Pride et al.,2004], but the same idea regarding losses has been extendedto seismic frequencies by substituting the notion of pores bymesoscopic regions [Pride et al., 2004; Masson and Pride,2007].[32] In our carbonate samples, no microcracks are ob-
served from the thin sections, but the existence of compliantpores is interpreted from the pressure dependence of theshear modulus in Figure 12. At lower pressures, compliantpores open, softening the rock frame and lowering themodulus and velocity. All the samples show similar pressuredependence for the modulus and velocity as for Figure 12.Because of the textural complexity of carbonate rocks andbecause hydrostatic stress is applied, compliant pores canremain open even at high differential pressure, creating softrock regions. Therefore, losses resulting from fluid move-ment from softer to stiffer regions is possible for ourcarbonate samples at high differential pressures, and canresult in compressional losses dominating over shear losses.[33] There are several experimental challenges when
measuring attenuation that must be accounted for wheninterpreting the results plotted in Figures 6–10. First, thefluid lines in Figure 4 have a manual valve which we closewhen acquiring low-frequency data. The fluid lines aredesigned to allow high fluid flow into and out of thesample. Unless the valve is completely closed, the appliedstress at low frequencies (<50 Hz) creates significant fluidmovement from the sample and into the fluid lines. Thisfluid flow effect is illustrated in Figure 6c for frequencies
Figure 10. P wave, S wave, and extensional and bulkcompressibility attenuation for sample C at 21 MPadifferential pressure. The sample is measured (a) dry(humidified), (b) 100% saturated with liquid butane, and(c) 100% saturated with brine.
Figure 11. Bulk modulus as a function of brine saturationfor sample 300 at seismic and ultrasonic frequencies. At100 Hz, the bulk modulus increases 25% from 97% to100% brine saturation.
B06208 ADAM ET AL.: SEISMIC WAVE ATTENUATION IN CARBONATES
9 of 14
B06208

less than 50 Hz, for which high attenuation is not related tothe viscoelastic properties of the rock, but to a valvemalfunction.[34] A second challenge is that the low-frequency appa-
ratus has system resonances at frequencies that depend onthe vessel as well as the geometry and properties of the rockand aluminum samples. Resonance peaks at 150 and 257 Hzaffect the attenuation measurements in Figure 8c. Thisresonance is evidenced by the attenuation peaks at thosetwo frequencies, biasing the attenuation estimates in the150 to 1000 Hz range. Therefore, to avoid the attenuationinstability generated by the system resonances for sample300, we only analyze frequencies between 10 and 100 Hz.[35] A third challenge is to interpret how the heteroge-
neous rock texture observed on sample 300 can affect thelow-frequency attenuation and modulus estimates. Twelvestrain gages are glued on the sample and reference in groupsof three every 90 degrees. One of the four sample sides issketched in Figure 4. Gages on the 0� and 180�, and 90� and270� faces are averaged into one strain during the acquisi-tion recording. We then average the resulting 0�–180� and90�–270� strains into one final strain estimate. Therefore,significant heterogeneity on one or more of the sample facescan affect the estimate of modulus and attenuation throughthis averaging process. It is possible that for sample 300,the textural heterogeneity evidenced in Figure 2 causes thehigh attenuation values plotted in Figure 8. Another possi-bility, however, is that because this sample has the largestpermeability of the five measured samples, the high fluidmobility is responsible for the increased attenuation. Theattenuation for sample 300 between 10 and 100 Hz isfrequency-dependent, increasing with increasing frequency.
[36] In general, directly correlating attenuation betweenseismic and ultrasonic frequencies is not straightforward.At exploration seismic frequencies (10 to 100 Hz), allsamples but sample 300 show that attenuation is frequency-independent (Figures 6 to 10). However, for frequenciesbetween 10 and 1000 Hz, attenuation estimates increasewith increasing frequency for samples 100, 200, and 300.For a single relaxation mechanism, attenuation as a functionof frequency is described by a bell-shaped curve with a peakwhich can depend on the rock permeability and fluidviscosity [Biot, 1956a, 1956b; Mavko and Nur, 1979].Multiple attenuation mechanisms can result in multiplemaxima. Our data (with a gap in observations between103 and 106 Hz) does not require a more complex modelthan the most conservative model of a single relaxationmechanism. For the measured samples, the attenuationmaximum may be located in the data gap between 103
and 106 in Figures 7c and 8, or at a frequency greater than106 Hz in Figures 6, 7b, and 7c.
7. Bulk Modulus Attenuation and Fluids
[37] Figure 13 shows the estimated bulk modulus atten-uation as a function of frequency for all measured fluids andsamples. Attenuation is nonzero when samples are dry(humidified) because a fluid layer on carbonate grains canincrease attenuation compared to an oven-dry sample whenthe stress generated by the passing wave creates movementof the small amount of water [Clark et al., 1980; Murphy etal., 1986; Winkler and Nur, 1982]. Winkler et al. [1979]analyze the effect of frictional loss with strain for sandstonesamples, and show that strain becomes a loss mechanism forstrain amplitudes greater than 10�6. In their study, for dry orslightly saturated samples measured at strains between 10�7
and 10�6, extensional attenuation is nonzero (QE � 100),but the loss mechanism is not attributed to friction. We donot attribute our observed attenuation to friction betweengrains because our measurements are at a single strainamplitude of 10�7.[38] Attenuation estimates when the rock is dry or fully
saturated with butane are comparable for all samples, but weobserve an increase in attenuation when brine replacesliquid butane. The changes from butane to brine resemblea reservoir fluid substitution process. We observe that theP wave attenuation increases by 150% to 400%, dependingon the sample, when a brine replaces a light hydrocarbon inthe pore space. By comparison, the P wave velocity changesonly 4% to 10% when brine substitutes liquid butane inthese samples. For a producing field and if time-lapse dataare available, this attenuation sensitivity to fluids may beuseful as an additional seismic attribute for dynamic reser-voir monitoring.[39] Samples 100 and 200 have significantly different
attenuation when saturated with brine, although petrograph-ically they are similar. Sample 200 may have larger porethroats than sample 100, so that the induced pore pressuregradients responsible for attenuation will reach equilibriumdifferently for these two samples. It is important to keep inmind that our samples remain undisturbed in the apparatusduring the exchange of fluids. There is no handling of thesample between attenuation measurements at varying satu-rating conditions. Therefore, even if the absolute values of
Figure 12. Sample C showing shear modulus weakeningand strengthening at seismic and ultrasonic frequenciesrespectively. Measurements are performed from high to lowdifferential pressures. Circles represent repeated differentialpressures going from low to high differential pressures afterthe initial unloading cycle was finalized. Note that as wedecrease the differential pressure, more compliant pores andcracks open. Error bars are one standard deviation (one sfor the seismic frequency data is contained in the size of thesymbol).
B06208 ADAM ET AL.: SEISMIC WAVE ATTENUATION IN CARBONATES
10 of 14
B06208

the attenuation might have some bias, especially for sample300, we expect this bias to be consistent between fluids.[40] We now describe possible reasons for the attenuation
to increase when brine substitutes liquid butane. Fluidviscosity controls the frequency at which the maximumpeak of attenuation occurs. At 3.5 MPa and 25�C, theviscosity of liquid butane and brine are similar, 0.2 cPand 1 cP, respectively. Nonetheless, the small viscositydifference between water and butane could still affect theattenuation of the rock [Gautam, 2003; Best et al., 1994].Another possible reason for high attenuation in brine-saturated carbonates is related to the weakening of the rockframe upon water saturation.[41] Figure 12 shows the shear modulus as a function of
differential pressure for sample C at 100 Hz and ultrasonicfrequencies (0.8 MHz). We observe that as differentialpressure decreases and compliant pores open, the rock shearmodulus decreases (weakens) from dry (humidified) to fullybrine saturated. Therefore, there is a correlation betweenincreasing numbers of compliant pores and an increase inthe shear modulus weakening. If the solid frame of the rock
does not change, the rock shear modulus is not sensitive tothe saturating fluid, because the shear modulus of fluids iszero. However, the modulus decrease due to brine can beexplained by the weakening of the rock frame resultingfrom the interaction of a polar fluid such as water with thesolid frame of the rock [Khazanehdari and Sothcott, 2003;Adam et al., 2006; Risnes et al., 2005]. Rock surfaceenergies or solid bounds between grains can break in thepresence of water, weakening the rock. This processincreases the pore space and can increase attenuation.Spencer [1981] measured extensional modulus attenuationin a fully water saturated limestone at low frequencies (10–100 Hz), and showed that attenuation is caused by thereduction in surface energy in the grains (matrix softening).Vo-Thanh [1995] shows that the shear wave attenuationdepends on the amount of water saturation in limestoneand sandstone. We observe that frame weakening is alsodependent on the amount of water in the pore space. Thisrock frame softening is shown in Figure 14, where theshear modulus weakens by increasing brine saturation forsample 300.
Figure 13. Bulk compressibility attenuation for all samples: (a) 100, (b) 200, (c) 300, (d) B, and (e) C.Dry measurements were performed with the samples humidified, not oven dry. Therefore, some waterexists in the pore space. Butane and brine test are run at full saturation. The differential pressures are asreported in Figures 6 to 10.
B06208 ADAM ET AL.: SEISMIC WAVE ATTENUATION IN CARBONATES
11 of 14
B06208

[42] An alternative attenuation mechanism can resultfrom local fluid flow between the gap in the grain contactand the adjacent pores [Murphy et al., 1986]. This waveattenuation is dependent on the saturation state of the rock,and the frequency at which the peak of maximum attenu-ation occurs. The latter is largely a function of the fluid andthe size of the grain contact gap. As the aspect ratio of thisgap decreases, the attenuation maximum moves towardlower frequencies. After brine saturation, grain contactscould have lower aspect ratios (solid bounds break), whichunder the grain contact loss mechanism means that themaximum attenuation peak shifts to lower frequencies. Forour limited low-frequency interval, a peak is hard to define.Nonetheless, the attenuation maximum shift to lower fre-quencies can be observed as an increase in attenuation (see,e.g., Figure 13b). Finally, for our samples, brine is notbelieved to be dissolving the carbonate grains, becauseFigure 12 shows that the frame weakening process isreversible (black circles). In conclusion, the increase of softregions in the rock due to brine (newly opened graincontacts compared to dry or butane-saturated carbonates),can increase the differential fluid-rock movements, andtherefore attenuation.
8. Numerical Modeling
[43] In sections 6 and 7 we have suggested reasons whyQK�1 > QS
�1 in our carbonate samples. Here we support theseinterpretations of measured attenuation with numericalmodeling constrained by our estimated values of elasticmoduli and velocities. The amplitude and phase of ourmeasured waveforms provide estimates of the elastic moduliand attenuation, respectively. These two attributes can beassumed independent. For an elastic sample, the strainamplitude yields moduli and the strain phase shifts are zero.That same sample under different saturation conditions canbehave viscoelastically, with the same strain amplitude asfor the elastic sample, but with a nonzero phase shift. On thebasis that phase strain amplitude is independent of phase,we model attenuation from the measured modulus and showthat QK
�1 > QS�1.
[44] The modulus frequency dependence in a material isdirectly related to the attenuation. In the extreme case of nomodulus dispersion, there is no attenuation; which is afundamental relation described by the Kramers-Kronigequations. In practice, Cole and Cole [1941] obtain anequation that describes the complex modulus (M*) disper-sion as a function of frequency (w):
M* wð Þ ¼ M0 �M1ð Þ1þ iwt0ð Þ1�a þM1 ð6Þ
where M0 and M1 are the moduli at zero and infinitefrequency, respectively; t0 is the relaxation time and a is aparameter that controls the curvature of the S-shapedmodulus dispersion; a is bounded between 0 and 1, and ifa = 0, equation (6) reduces to the modulus dispersionrelation for a standard linear solid or Debye model. The avalue controls the amplitude of the attenuation peak.[45] We use equation (6) to model attenuation under the
assumption that there is only one relaxation mechanism(i.e., one attenuation peak) between 10 and 106 Hz. Wemodel the imaginary part of the complex modulus byapplying a least squares fit to the real part of the measuredmodulus. We use the 3 Hz data as M0, the ultrasonic datapoint as M1, and t0 and a follow from the best fit to themodulus versus frequency data. We model attenuation bytaking the ratio of the imaginary and real parts of themodeled complex modulus. The solid lines in Figures 15aand 15b show the best fit to the real part bulk modulus andthe modeled attenuation for sample 100 saturated withbrine, respectively.[46] Our measurements cover a large range of frequen-
cies, but within 3 orders of magnitude (103–106) we onlyhave one datum. Modeling attenuation as a function offrequency is highly sensitive to this ultrasonic datum. Toshow this sensitivity, we vary the ultrasonic data point.Twenty ultrasonic bulk moduli are generated from a Gauss-ian distribution of the ultrasonic errors. The dashed lines inFigure 15a are the best fits for each of the 20 ultrasonicpoints. The corresponding modeled attenuation are plottedas dashed lines in Figure 15b. For the large range ofpossible ultrasonic bulk modulus, the modeled attenuationpeak (1000/Q) can vary from 25 to 75. Therefore, quanti-
Figure 14. Shear modulus weakening with brine satura-tion for sample 300 at 100 Hz and 21 MPa differentialpressure.
Figure 15. (a) Bulk modulus and (b) attenuation forsample 100 fully brine saturated. Dots are the measureddata, and the lines are the modeled moduli and attenuationusing the Cole-Cole relation.
B06208 ADAM ET AL.: SEISMIC WAVE ATTENUATION IN CARBONATES
12 of 14
B06208

tatively estimating Q from measured bulk modulus issensitive to the uncertainty in the ultrasonic data.[47] Figure 16 shows that the modeled bulk attenuation is
greater than the shear wave attenuation for the modeledbrine-saturated samples. The same observation holds forwhen the samples are dry or fully saturated with liquidbutane. The fact that bulk losses dominate over shear lossesis in agreement with the experimental attenuation datashown in Figures 6 to 10. Sample B is not modeled becausethe ultrasonic bulk modulus is slightly lower than the low-frequency data; probably because the ultrasonic pulse isslowed down due to scattering in the horizontal layers inthis sample.
9. Conclusions
[48] In contrast to clastics, our measurements in fivecarbonate rocks show that bulk modulus attenuation andcompressional wave attenuation are greater than the shearwave attenuation when samples are fully saturated witheither liquid butane or brine at reservoir conditions. Thisobservation is consistent over a large range in frequencies(10–1000 Hz and 0.8 MHz) and is repeatable using twodifferent experimental methodologies. Attenuation is ob-served to be frequency-independent for the explorationseismic frequencies (10–100 Hz) for four of five samples.From published laboratory data, the saturation state ofsandstones could be interpreted based on whether the bulkor shear losses dominate; however, from our observations,this correlation will probably not be straightforward forcarbonates. The sensitivity of attenuation, particularly thebulk modulus losses, to the type of fluid in the pore space ismuch greater than for velocities. Bulk modulus attenuationcould change from 150% to 400% (depending on thesample) when brine replaces a light hydrocarbon. Bycomparison, the average compressional wave velocitychanges by 7% for our samples.[49] The laboratory measurements described here could
aid in the interpretation of surface seismic data. In carbo-nates, the compressional wave seismic signature can bemore sensitive to the wave losses than the shear wave data,especially when brine substitutes a light hydrocarbon. Eventhought estimating intrinsic attenuation from surface seis-
mic still faces some challenges, the recent improvements indata quality should make this estimation more reliable.
[50] Acknowledgments. We thank ADNOC, ADCO, and StatoilHydrofor permission to publish the paper.We are grateful for the help and suggestionsreceived from Manika Prasad, John Scales, and Ronny Hofmann. Finally, wethank ExxonMobil URC and Michelle Stoklosa for the petrographic analysis.We greatly thank the Associate EditorWilliamWaite, and the reviewers AngusBest and William Murphy for their thorough reviews and suggestions thatsignificantly improved this paper.
ReferencesAdam, L., M. Batzle, and I. Brevik (2006), Gassmann’s fluid substitutionand shear modulus variability in carbonates at laboratory seismic andultrasonic frequencies, Geophysics, 71(6), F173–F183, doi:10.1190/1.2358494.
Agersborg, R., T. A. Johansen, M. Jakobsen, J. Sothcott, and A. Best(2008), Effects of fluids and dual-pore systems on pressure-dependentvelocities and attenuations in carbonates, Geophysics, 73(5), N35–N47,doi:10.1190/1.2969774.
Assefa, S., C. McCann, and J. Sothcott (1999), Attenuation of P- andS-waves in limestones,Geophys. Prospect., 47(3), 359–392, doi:10.1046/j.1365-2478.1999.00136.x.
Batzle, M., R. Hofmann, M. Prasad, G. Kumar, L. Duranti, and D.-H. Han(2005), Seismic attenuation: Observations and mechanisms, SEG Tech.Abstr., 24(1), 1565–1568, doi:10.1190/1.2147991.
Batzle, M. L., D. Hua Han, and R. Hofmann (2006), Fluid mobility andfrequency-dependent seismic velocity—Direct measurements, Geophy-sics, 71(1), N1–N9.
Best, A. I., and M. S. Sams (1997), Compressional wave velocity andattenuation at ultrasonic and sonic frequencies in near-surface sedimen-tary rocks, Geophys. Prospect., 45(2), 327–344.
Best, A. I., C. McCann, and J. Sothcott (1994), The relationships betweenthe velocities, attenuations and petrophysical properties of reservoir se-dimentary rocks, Geophys. Prospect., 42, 151–178.
Best, A. I., J. Sothcott, and C. McCann (2007), A laboratory study ofseismic velocity and attenuation in near-surface sedimentary rocks, Geo-phys. Prospect., 55, 609–625.
Biot, M. A. (1956a), Theory of propagation of elastic waves in a fluid-saturated porous solid. I. Low-frequency range, J. Acoust. Soc. Am.,28(2), 168–178, doi:10.1121/1.1908239.
Biot, M. A. (1956b), Theory of propagation of elastic waves in a fluid-saturated porous solid. II. Higher frequency range, J. Acoust. Soc. Am.,28(2), 179–191, doi:10.1121/1.1908241.
Birch, F. (1960), The velocity of compressional waves in rocks to10 kilobars: 1, J. Geophys. Res., 65, 1083–1102.
Cadoret, T., G. Mavko, and B. Zinszner (1998), Fluid distribution effect onsonic attenuation in partially saturated limestones, Geophysics, 63(1),154–160, doi:10.1190/1.1444308.
Clark, V. A., B. R. Tittmann, and T. W. Spencer (1980), Effect of volatileson attenuation (Q�1) and velocity in sedimentary rocks, J. Geophys. Res.,85, 5190–5198.
Cole, K. S., and R. H. Cole (1941), Dispersion and absorption in dielectrics.I. Alternating current characteristics, J. Chem. Phys., 9, 341–351.
Dvorkin, J., G. Mavko, and A. Nur (1995), Squirt flow in fully saturatedrocks, Geophysics, 60(1), 97–107, doi:10.1190/1.1443767.
Gardner, G. H. F. (1962), Extensional waves in fluid-saturated porouscylinders, J. Acoust. Soc. Am., 34(1), 36–39, doi:10.1121/1.1909010.
Gautam, K. (2003), Fluids effects on attenuation and dispersion of elasticwaves, Master’s thesis, Colo. Sch. of Mines, Golden.
Hauge, P. S. (1981), Measurements of attenuation from vertical seismicprofiles, Geophysics, 46(11), 1548–1558, doi:10.1190/1.1441161.
Khazanehdari, J., and J. Sothcott (2003), Variation in dynamic elastic shearmodulus of sandstone upon fluid saturation and substitution, Geophysics,68(2), 472–481.
Lienert, B. R., and M. H. Manghnani (1990), The relationship betweenQE(�1) and dispersion in extensional modulus, E, Geophys. Res. Lett.,
17(6), 677–680.Lindquist, W. B., A. Venkatarangan, J. Dunsmuir, and T. Wong (2000),Pore and throat size distributions measured from synchrotron X-ray to-mographic images of Fontainebleau sandstones, J. Geophys. Res.,105(B9), 21,509–21,528.
Lucet, N. (1989), Vitesse et attenuation des ondes elastiques et ultrasoni-ques dans les roches sous pression de confinement, Ph.D. thesis, Univ.de Paris VI, Paris.
Lucet, N., P. N. J. Rasolofosaon, and B. Zinszner (1991), Sonic propertiesof rocks under confining pressure using the resonant bar technique,J. Acoust. Soc. Am., 89(3), 980–990, doi:10.1121/1.400643.
Figure 16. Modeled bulk and shear wave attenuation forfully brine saturated samples: (a) 100, (b) 200, (c) 300, and(d) C.
B06208 ADAM ET AL.: SEISMIC WAVE ATTENUATION IN CARBONATES
13 of 14
B06208

Masson, Y. J., and S. R. Pride (2007), Poroelastic finite difference modelingof seismic attenuation and dispersion due to mesoscopic-scale heteroge-neity, J. Geophys. Res., 112, B03204, doi:10.1029/2006JB004592.
Mavko, G. M., and A. Nur (1979), Wave attenuation in partially saturatedrocks, Geophysics, 44(2), 161–178.
Moore, C. H. (2001), Carbonate Reservoirs: Porosity Evolution and Diag-enesis in a Sequence Stratigraphic Framework, Dev. Sedimentol., vol. 55,Elsevier, Amsterdam.
Morig, R., and H. Burkhardt (1989), Experimental evidence for the Biot-Gardner theory, Geophysics, 54(4), 524–527, doi:10.1190/1.1442679.
Muller, T. M., and B. Gurevich (2005), Wave-induced fluid flow in randomporous media: Attenuation and dispersion of elastic waves, J. Acoust.Soc. Am., 117(5), 2732–2741, doi:10.1121/1.1894792.
Murphy, W. F. (1982), Effects of partial water saturation on attenuation inMassilon sandstone and Vycor porous glass, J. Acoust. Soc. Am., 71(6),1458–1468.
Murphy, W. F., K. W. Winkler, and R. L. Kleinberg (1986), Acousticsrelaxation in sedimentary rocks: Dependence on grain contacts and fluidsaturation, Geophysics, 51(3), 757–766.
O’Connell, R. J., and B. Budiansky (1977), Viscoelastic properties of fluid-saturated cracked solids, J. Geophys. Res., 82, 5719–5736.
Paffenholz, J., and H. Burkhardt (1989), Absorption and modulus measure-ments in the seismic frequency and strain range on partially saturatedsedimentary rocks, J. Geophys. Res., 94, 9493–9507.
Prasad, M., and R. Meissner (1992), Attenuation mechanisms in sands:Laboratory versus theoretical (Biot) data, Geophysics, 57(5), 710–719,doi:10.1190/1.1443284.
Pride, S. R., J. G. Berryman, and J. M. Harris (2004), Seismic attenuationdue to wave-induced flow, J. Geophys. Res., 109, B01201, doi:10.1029/2003JB002639.
Quan, Y., and J. M. Harris (1997), Seismic attenuation tomography using thefrequency shift method, Geophysics, 62(3), 895–905, doi:10.1190/1.1444197.
Risnes,R.,M.Madland,M.Hole, andN.Kwabiah (2005),Waterweakening ofchalk—Mechanical effects of water–glycol mixtures, J. Petroleum Scienceand Engineering, 48(1–2), 21–36, doi:10.1016/j.petrol.2005.04.004.
Sams, M. S., J. P. Neep, M. H. Worthington, and M. S. King (1997), Themeasurement of velocity dispersion and frequency-dependent intrinsicattenuation in sedimentary rocks, Geophysics, 62(5), 1456–1464.
Scholle, P. A., and D. S. Ulmer-Scholle (2003), A Color Guide to thePetrography of Carbonate Rocks: Grains, Textures, Porosity, Diagenesis,AAPG Mem., 77.
Soroka, W. L., P. Melville, E. Kleiss, M. Al-Jenaibi, A. B. Al-Jeelani, H. H.Hafez, and A. Modavi (2005), Successful pilot onshore Abu Dhabi showsthat 4D can monitor fluid changes in a giant middle east carbonate field,SEG Tech. Abstr., 24(1), 2430, doi:10.1190/1.2148212.
Spencer, J. W. (1979), Bulk and shear attenuation in Berea sandstone: Theeffects of pore fluids, J. Geophys. Res., 84, 7521–7523.
Spencer, J. W. (1981), Stress relaxation at low frequencies in fluid satu-rated rocks: Attenuation and modulus dispersion, J. Geophys. Res., 86,1803–1812.
Toksoz, M. N., D. H. Johnston, and A. Timur (1979), Attenuation ofseismic waves in dry and saturated rocks: I. Laboratory measurements,Geophysics, 44(4), 681–690.
Vo-Thanh, D. (1995), Influence of fluid chemistry on shear-wave attenua-tion and velocity in sedimentary rocks, Geophys. J. Int., 121, 737–749.
White, J. E. (1965), Seismic Waves; Radiation, Transmission, and Attenua-tion, McGraw-Hill, New York.
White, J. E. (1986), Biot-Gardner theory of extensional waves in porousrods, Geophysics, 51(3), 742–745, doi:10.1190/1.1442126.
Winkler, K. W. (1979), The effects of pore fluids and frictional sliding onseismic attenuation, Ph.D. thesis, Stanford Univ., Stanford, Calif.
Winkler, K., and A. Nur (1979), Pore fluids and seismic attenuation inrocks, Geophys. Res. Lett., 6, 1–4, doi:10.1029/GL006i001p00001.
Winkler, K. W., and A. Nur (1982), Seismic attenuation: Effects of porefluids and frictional-sliding, Geophysics, 47(1), 1 –15, doi:10.1190/1.1441276.
Winkler, K. W., A. Nur, and M. Gladwin (1979), Friction and seismicattenuation in rocks, Nature, 277, 528–531.
Wyllie, M. R. J., G. H. F. Gardner, and A. R. Gregory (1962), Studies ofelastic wave attenuation in porous media, Geophysics, 27(5), 569–589,doi:10.1190/1.1439063.
�����������������������L. Adam and K. van Wijk, Department of Geosciences, Boise State
University, 1910 University Drive, Boise, ID 83725, USA. ([email protected])M. Batzle, Department of Geophysics, Colorado School of Mines, 1500
Illinois Street, Golden, CO 80401, USA.K. T. Lewallen, ExxonMobil Upstream Research Company, 3120 Buffalo
Speedway, Houston, TX 77098, USA.
B06208 ADAM ET AL.: SEISMIC WAVE ATTENUATION IN CARBONATES
14 of 14
B06208