seismic risk assessment of three types of exterior beam ... risk assessment of three types of...
TRANSCRIPT

Seismic risk assessment of three types of exterior beam-column joints using fragility curves
N. H. Hamid & S. A. Anuar Faculty of Civil Engineering, Universiti Teknologi MARA, Malaysia
Abstract
The seismic risk assessments for one-third scales of three different types of reinforced concrete (RC) beam-column joints using fragility curves under Performance Based Earthquake Engineering (PBEE) are investigated. Three types of RC beam-column joints, as those with bracing (Type 1), overlapping of reinforcement (Type 2) and anchorage of longitudinal bars (Type 3), were tested and analyzed. The seismic performances of these joints were observed during experimental work and we classify the damage states according to the drift limit. Visual observation on crack propagations such as widths, diagonal cracks, crack patterns, spalling and crushing of the concrete on the joints together with buckling of longitudinal reinforced bar were examined. A fragility curve is used to evaluate the seismic risk assessment of these beam-column joints using a graph for colour coding system and damage limit states. Beam-column joint Type 3 has the least damage with 80% Confident Interval (CI) to survive under DBE (Design Basic Earthquake) and 55% CI under Maximum Considered Earthquake (MCE) followed by Type 1 and Type 2. Keywords: beam-column joint, fragility curves, HAZUS, seismic risk assessment, colour coding, damage-states, Design Basic Earthquake, Maximum Considered Earthquake.
1 Introduction
The 2004 Banda Acheh Earthquake had caused a devastating tsunami to eleven (11) countries including West Malaysia, Thailand, India, Sri Lanka and African countries in the world. Researchers need to investigate and conduct risk assessment on the seismic performance of the reinforced concrete buildings in
Risk Analysis IX 85
www.witpress.com, ISSN 1743-3517 (on-line) WIT Transactions on Information and Communication Technologies, Vol 47, © 2014 WIT Press
doi:10.2495/RISK140081

Malaysia due to the long-distance earthquake from the 2004 Banda Acheh Earthquake. West Malaysia is located 450 to 650 km closed to Sunda Tench and Burma microplate. This plate is one of the most active plates in the world and it moves 70 mm per year towards Malaysia. Frequent earthquakes which occurred in Sumatra have significant impact on the medium and high-storey reinforced concrete buildings in Malaysia. A safe building needs to be designed with more economical material and lesser damages if the earthquakes strike in certain area in high seismic region which closed to Malaysia. There are also some sleeping fault lines in Malaysia located at Empangan Kenyir, Janda Baik, Ranau in Sabah and Jerantut in Pahang. However, these fault lines only contribute a very low intensity shaking which varies between 2.8 to 4.6 on the Richter scale. Based on the minor to moderate earthquake activity that occurred in Malaysia, the Lebir fault line has become the most active fault line, which occurred twice in 1984 and 1985. Figure 1 shows the hazard maps of West Malaysia for 500 years (exceedance 10% in 50 years under DBE) and a 2500 years return period (exceedance 2% in 50 years under MCE) [1].
(a) 500 years return period. (b) 2500 years return period.
Figure 1: Hazard map of West Malaysia for (a) 500 years return period, and (b) 2500 years return period [1].
Even though Malaysia is located far away from “Pacific Ring of Fire” there is no exemption occurrence of structures failures due to long-distance earthquake events such as the 1985 Mexico Earthquake. However, there was an investigation on four typical reinforced concrete buildings in Malaysia such as Mahkamah Kuala Terengganu, Blok 3B Quarters Putrajaya, Jabatan Pendaftaran Negara Putrajaya and Hospital Besar, Kota Bharu using finite element modeling [2]. In their study, the impact of earthquakes from local fault and long-distant earthquake from past earthquake events such as Acheh, Nias, Semangko, Tawau and Bintulu earthquakes have insignificant impact on reinforced concrete buildings in Malaysia.
86 Risk Analysis IX
www.witpress.com, ISSN 1743-3517 (on-line) WIT Transactions on Information and Communication Technologies, Vol 47, © 2014 WIT Press
Most of the RC buildings in Malaysia were designed according to British Standard (BS8110) which does not have any specific provisions for seismic loads which lead to weak-column and strong-beam capacity design. The experimental work on beam-column joint was conducted by Ghani and Hamid [3] showed that the failure of captive column above the intersection of beam and column joint. Spalling of concrete and major cracks was also observed on the corbel which leads to the vulnerability of RC buildings. Therefore, it is necessary to evaluate the vulnerability and risk of these buildings under two conditions of earthquakes which are Basic Design Earthquake (DBE) and Maximum Considered Earthquake using fragility curves. The confidential interval and cumulative density function of the fragility curve in term of percentage will be obtained based on the damage limit states as described in the following topic.
2 Characterisation of beam-column joint’s damages
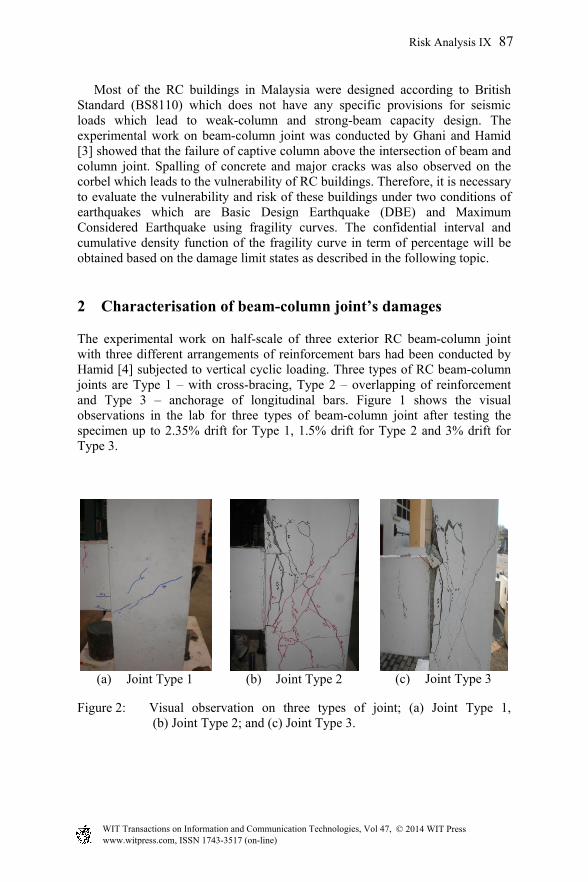
The experimental work on half-scale of three exterior RC beam-column joint with three different arrangements of reinforcement bars had been conducted by Hamid [4] subjected to vertical cyclic loading. Three types of RC beam-column joints are Type 1 – with cross-bracing, Type 2 – overlapping of reinforcement and Type 3 – anchorage of longitudinal bars. Figure 1 shows the visual observations in the lab for three types of beam-column joint after testing the specimen up to 2.35% drift for Type 1, 1.5% drift for Type 2 and 3% drift for Type 3.
(a) Joint Type 1
(b) Joint Type 2
(c) Joint Type 3
Figure 2: Visual observation on three types of joint; (a) Joint Type 1, (b) Joint Type 2; and (c) Joint Type 3.
Risk Analysis IX 87
www.witpress.com, ISSN 1743-3517 (on-line) WIT Transactions on Information and Communication Technologies, Vol 47, © 2014 WIT Press

Table 1: Classification of damage level and colour coding for Joint Type 1.
Colour coding
Description of damage level Displacement (mm)
Drift damage
Ductility factor
Green (slight damage)
No deformation of beam. No crack occurs.
20
31
1.00 1.55
2 3.1
Yellow (moderate damage)
Crack occurs on the surface of the beam and spalling concrete at the certain part of the specimen.
32 35 38 39
1.60 1.75 1.90 1.95
3.2 3.5 3.8 3.9
Orange (heavy damage)
Crack becomes wide and spalling of concrete more frequent.
43 45 46
2.15 2.25 2.30
4.3 4.5 4.6
Red (complete damage)
Failure of the specimen.
47
2.35
4.7
Table 2: Classification of damage level and colour coding for Joint Type 2.
Colour coding
Description of damage level Displacement (mm)
Drift damage
Ductility factor
Green (slight damage)
No deformation of beam. No crack occurs.
6 8
10
0.30 0.40 0.50
0.6 0.8 1.0
Yellow (moderate damage)
Crack occurs on the surface of the beam and spalling concrete at the certain part of the specimen.
11 13 14 15
0.55 0.65 0.70 0.75
1.1 1.3 1.4 1.5
Orange (heavy damage)
Crack becomes wide and spalling of concrete more frequent.
18 22 28
0.90 1.10 1.40
1.8 2.2 2.8
Red (complete damage)
Failure of the specimen.
30
1.50
3
Table 3: Classification of damage level and colour coding for Joint Type 3.
Colour coding
Description of damage level Displacement (mm)
Drift damage
Ductility factor
Green (slight damage)
No deformation of beam. No crack occurs at joint.
10 15 20
0.50 0.75 1.00
1.0 1.5 2.0
Yellow (moderate damage)
Crack occurs on the surface of the beam and spalling concrete.
28 35 38
1.40 1.75 1.90
2.8 3.5 3.8
Orange (heavy damage)
Crack becomes wide and spalling of concrete more frequent.
42 45 47
2.10 2.25 2.35
4.2 4.5 4.7
Red (complete damage)
Failure of the specimen.
60
3.00
6.0
88 Risk Analysis IX
www.witpress.com, ISSN 1743-3517 (on-line) WIT Transactions on Information and Communication Technologies, Vol 47, © 2014 WIT Press

3 Development of fragility curve
The risk assessment of the RC beam-column joint can be carried out using the probabilistic tool known as fragility curve. Fragility curve is defined as a relationship between ground shaking intensity and the probability of reaching or exceeding a certain response level for the assessment of seismic losses in increasing demand both for pre-earthquake disaster planning and post-earthquake recovery and retrofitting programs. Fragility curve had been used as risk analysis and to asses seismic performance for different types of wall panel [5], steel water tank [6], nuclear power plants [7], double storey house constructed using shear-key precast wall panel [8] and others structural components. In order to develop fragility curves which required the spectral acceleration amplitude for a period of T = 1 sec, the drift damage limit must be converted to spectral acceleration units. According to FEMA [9], the base shear demand for long period structures with high damping is given by the following equation:
LTB
SACd (1)
where S is soil type factor, A is the peak ground acceleration (normalized with
respect to g), T is the period of vibration and LB is the factor of damping more
than 5%. The structural period of vibration according to yield strength and displacement is given by the following equation:
gCFg
W
K
mT
c
222 (2)
where base shear capacity is W
FC
c , F is the yield strength (base shear) of the
structure, is the yield displacement of the structure, W is seismic weight of the structures and K is the stiffness of the structures. By substituting equation (2) into equation (1) and equating base shear capacity equal to base shear demand, then the following equation becomes:
L
cdc B
SAgCCC
2
22
4 (3)
By substituting H ,
g
HCcBSA Li
2 (4)
Risk Analysis IX 89
www.witpress.com, ISSN 1743-3517 (on-line) WIT Transactions on Information and Communication Technologies, Vol 47, © 2014 WIT Press
Equation (4) is used to convert from drift damage limit to the spectral acceleration which will be used for the development of fragility curves. According to Mander [10], the theoretical probabilistic formulation in developing fragility curves need to consider several items such as the expected site-specific response characteristics, the inelastic strength and deformation capacity of the structure, damage limit states, randomness of ground motion response spectral demand and uncertainties in modeling structural capacity. The intersection of the capacity curve and appropriate damped elastic demand curve provides a “performance point” based on the estimate of the structural strength and displacement demand. The probability distributions over these two curves indicated the uncertainty and randomness of the structures performance with a wide range of possible performance outcomes. The randomness and uncertainty can be represented as probability distribution function. This distribution function can be represented as a lognormal cumulative probability density function known as “fragility curves”. The cumulative probability function is given by;
)(SaF =
i
a
A
S
DC
ln1
(5)
where Φ = standard log-normal cumulative distribution function, Sa = the spectral amplitude for a period of T = 1 sec, Ai = the median spectral acceleration necessary to cause the ith damage state to occur, and ΒC/D = normalized composite log-normal standard deviation. Thus, the aim of this research is to assess the risk of damage for three types reinforced concrete beam-column joints subjected to vertical cyclic loading using fragility curve. The design of beam-column joint, experimental work, visual observation of the damage and classification of damages were conducted by Hamid [4]. The detail explanation of the research methodology for the fragility curve is explained in next topic.
4 Methodology
In this paper, three types of beam-column joint were investigated based on the visual observation of damage to the structures at different level of drifts. Type 1 is beam-column joint with bracing reinforcement where the reinforcement bending in column section forms the bracing in beam-column joint region. Type 2 is connection details which provide an overlapping of reinforcement where additional connections between beam-column are used in order to form an overlapping bar. Type 3 is anchorage of longitudinal beam bars where the longitudinal beam bars are anchored into the column in order to ensure proper gripping of bar in joint [4]. The damages are categorized using colour coded and performance level. The damage states are generally related to the structural response parameter such as spectral displacement, average roof drift ratio and ductility. In this research, two tables of HAZUS [11] are used in characterizing the damages state of beam-column joint. Table 4 and 5 are used to identify the
90 Risk Analysis IX
www.witpress.com, ISSN 1743-3517 (on-line) WIT Transactions on Information and Communication Technologies, Vol 47, © 2014 WIT Press

damage state and expected ductility factor based on numbering system. Fragility curves for Joint Type 1, Joint Type 2 and Joint Type 3 by combination tables of Table 1, Table 2, Table 3, Table 4, Table 5 and Equation 5. Figure 3 shows the fragility curve for Joint Type 1 together with DBE and MCE. Figure 4 shows the fragility curve for Joint Type 2 and Figure 5 shows the fragility curve for Joint Type 3.
Table 4: Definition of damage state by HAZUS [11].
Table 5: Standard performance levels definition [5].
Damage state
HAZUS descriptor
Post earthquake utility structures
Evidence Outage time
Expected Ductility Factor
1 None No damage None (pre-yield) - 1 2 Slight Slight damage Cracking < 3 days 2 3 Moderate Repairable
damage Large cracks over spalled
< 3 months 3
4 Heavy Irreparable damage
Failure of components
> 3 months 4
5 Complete Irreparable damage
Partial/total collapse
> 3 months 6
Performance level
Colour coding
Description of damage
Fully Operational
Green Only minor damage, minor cracks, buildings retain their original stiffness and strength, non-structural components operate and the building can be used and the risk to life is very low.
Functional Orange Only minor damage, structures retain nearly all their original stiffness and strength, nonstructural components are secured and utilities are functional, repairs may be instituted at the convenience of the building users, and risk of life is low.
Life Safety Yellow Significant structural and nonstructural damage, the building has lot a significant amount of its original stiffness, but retain some lateral strength and margin against collapse, nonstructural components are secure but no operating, the building may not be safe to occupy until repaired.
Near Collapse
Red A limiting damage state in which substantial damage has occurred, the building has lost most of its original stiffness and strength and has little margin against collapse.
Risk Analysis IX 91
www.witpress.com, ISSN 1743-3517 (on-line) WIT Transactions on Information and Communication Technologies, Vol 47, © 2014 WIT Press

5 Interpretation of results
Three types of beam-column joint were investigated based on the visual observation of damage to the structures at different levels of drifts in the laboratory. The state of damage after drift damage is normally quantified using a colour-coded or number format, performance level and ductility factor. Result of fragility curves was analyzed and represented in term of percentage under Design Basic Earthquake (DBE) and Maximum Considered Earthquake (MCE). Cumulative Density Factor (CDF) were obtained from Peak Ground Acceleration (PGA = 0.4 g) for DBE and PGA = 0.8 g for MCE. Confidence Interval (CI) were obtained by taken a reading on vertical scale at right of the graph which is at the same level of the CDF reading were taken.
Figure 3: Fragility curve for Joint Type 1.
Figure 4: Fragility curve for Joint Type 2.
92 Risk Analysis IX
www.witpress.com, ISSN 1743-3517 (on-line) WIT Transactions on Information and Communication Technologies, Vol 47, © 2014 WIT Press

Figure 5: Fragility curve for Joint Type 3.
Table 6 shows the damage state of Joint Type 1 based on fragility curve in Figure 3. Beam-column joint with bracing reinforcement would have 38% slight damage, 2% repairable damage, 1% irrepairable damage and 0% heavy damage or collapsed under DBE. While under MCE, Type 1 would have 80% slight damage, 12% repairable damage, 7% irrepairable damage and 5% heavy damage or collapsed.
Table 6: Damage state for Joint Type 1.
DBE = 0.4 g MCE = 0.8 g
Slightly Damage CDF = 38% Slightly Damage CDF = 80%
CI = 62% CI = 20%
Repairable Damage CDF = 2% Repairable Damage CDF = 12%
CI = 98% CI = 88%
Irrepairable Damage CDF = 1% Irrepairable Damage CDF = 7%
CI = 99% CI = 93%
Heavy Damage CDF = 0% Heavy Damage CDF = 5%
CI = 100% CI = 95%
Collapse CDF = 0% Collapse CDF = 0%
CI = 100% CI = 100% Table 7 shows the damage state for beam-column joint Type 2 (connection details which provide an overlapping of reinforcement) based on the fragility curve as shown in Figure 4. Connection details which provide an overlapping of reinforcement would have 70% slight damage, 22% repairable damage, 5% irrepairable damage and only 2% heavy damage or collapsed as shown in Table 7.
Risk Analysis IX 93
www.witpress.com, ISSN 1743-3517 (on-line) WIT Transactions on Information and Communication Technologies, Vol 47, © 2014 WIT Press

Table 8 shows the damage state of beam-column Joint Type 3 (anchorage of longitudinal beam bars. In damage state classification, anchorage of longitudinal beam bars would have 16% slight damage, 2% repairable damage, 1% irrepairable damage, and 0% heavy damage or collapsed under DBE. While under MCE, Type 3 would have 55% slight damage, 10% repairable damage, 4% irrepairable damage, and only 2% heavy damage or collapsed as shown in Table 8.
Table 7: Damage state for Joint Type 2.
DBE = 0.4 g MCE = 0.8 g
Slightly Damage CDF =70% Slightly Damage CDF = 95%
CI = 30% CI = 5%
Repairable Damage CDF = 22% Repairable Damage CDF = 62%
CI = 78% CI = 38% Irrepairable CDF = 5% Irrepairable Damage CDF = 30%
CI = 95% CI = 70%
Heavy Damage CDF = 2% Heavy Damage CDF = 15%
CI = 98% CI = 85%
Collapse CDF = 0% Collapse CDF = 0%
CI = 100% CI = 100%
Table 8: Damage state for Joint Type 3.
DBE = 0.4 g MCE = 0.8 g
Slightly Damage CDF = 16% Slightly Damage CDF = 55%
CI = 84% CI = 45%
Repairable Damage CDF = 2% Repairable Damage CDF = 10%
CI = 98% CI = 90% Irrepairable CDF = 1% Irrepairable Damage CDF = 4%
CI = 99% CI = 96%
Heavy Damage CDF = 0% Heavy Damage CDF = 2%
CI = 100% CI = 98%
Collapse CDF = 0% Collapse CDF = 0%
CI = 100% CI = 100%
6 Conclusions and recommendations
Based on definition of damage state by HAZUS and standard performance level definition, Joint Type 1 (beam-column joints with cross-bracing reinforcement bars) become the most effective type among the three type of joint used in this
94 Risk Analysis IX
www.witpress.com, ISSN 1743-3517 (on-line) WIT Transactions on Information and Communication Technologies, Vol 47, © 2014 WIT Press

study with the greater percentage of green tag and slightly damage. Furthermore, this type of damage suffered the least damage as compare to the two types of joints. According to the fragility analysis and visual observation, it can be concluded that Joint Type 1 has suffered a minor to moderate damages. This joint has the highest vertical strengths, ductility and reduced crack at the joint under vertical cyclic loading. It is recommended that full-scale of 3D exterior beam-column joint should be designed using Eurocode 2, constructed the 3D specimen in heavy structural laboratory, tested the specimen under lateral cyclic loading by imposing load at top of the column, analyze the graph of hysteresis loops, identify the damage state based on visual observation, develop fragility curve and finally, assess the seismic risk of the beam-column joint.
Acknowledgements
The authors would like to thank the Fundamental Research Grant Scheme (FRGS), the Research Management Institute (RMI) for funding this research work and Faculty of Civil Engineering, Universiti Teknologi MARA Malaysia for all the facilities provided for experimental work. Nevertheless, the authors also would like to express their deep gratitude and co-operation of the technicians of Heavy Structures, postgraduate and undergraduate students for the completion of this project.
References
[1] Adnan, A., New Seismic Hazard Map Using New Generation Attenuation for Seismic Design of Infrastructures in Putrajaya, Malaysia, Seminar Teknikal Kebangsaan Gempa Bumi & Tsunami di Malaysia (NaTSET 2010), Kuala Lumpur, 2010.
[2] Adnan, A., Suradi. S, Selvanayagam.P.N, Darus. Z., Vulnerability of Public Buildings Subjected To earthquake By Finite Element Modeling, Proceeding of the 6th Asia-Pacific Structural Engineering and Construction Conference (ASPEC 2006). October 15–17, 2006.
[3] Ghani, K.D. and Hamid, N.H., Experimental Investigation on A non-seismic Precast RC Beam-column Exterior Joint Under Quasi-static Lateral Cyclic Loading, Safety and Seismic Engineering, WIT Press, ISSN No: 1743–3509, Vol. no. 134, pp. 827–837, 2013.
[4] Hamid, N.H., Seismic Performance of Beam-column Joints in Reinforced Concrete Buildings Subjected to Reversible Vertical Cyclic Loading, Malaysian Journal of Civil Engineering, 22(2), pp 264–290, 2010.
[5] Hamid, N.H., Assess Seismic Performance of Three Types of Concrete Structural Wall Panels Using Fragility Curves, Malaysia Construction Research Journal; Vol. 6, No. 1, pp. 13–28, 2010.
[6] O’Rourke, M.J. and So, P., Seismic Fragility Curves for On-Grade Steel Tanks, Earthquake Spectra, Volume 16, No. 4, pp. 801–815, 2000.
Risk Analysis IX 95
www.witpress.com, ISSN 1743-3517 (on-line) WIT Transactions on Information and Communication Technologies, Vol 47, © 2014 WIT Press

[7] Kennedy, R.P., Cornell, C.A., Campbell, R.D., Kaplan, S. and Perla, H.F., Probability Seismic Safety Study of An Existing Nuclear Power Plant, Nuclear Engineering and Design, No. 59, pp. 3–338,1980.
[8] Hamid, N.H., Mohamad, N.M, Hamid, Z., Gani, S.H.A., Seismic Assessment of Full-scale Single Bay Double-Storey House Using Fragility Curve, Malaysian Construction Research Journal, Vol. 1, No. 2, pp. 65–77, 2012.
[9] FEMA 273, NERHP Guidelines for the Seismic Rehabilition of Buildings and FEMA 274, Commentary, Federal Emergency Management Agency, Washington, USA, 1997.
[10] Mander, J.B., Beyond Ductility: The Quest Goes On, Symposium to Celebrate the Lifetime of Professors Emeritus Tom Paulay and Bob Park, Christchurch, New Zealand, pp. 75–86, 2003.
[11] HAZUS 99-SR2, Earthquake Loss Estimation Methodology, HAZUS Technical Report, Federal Emergency Agency and National Institute of Buildings Science, Washington D.C., 2004.
96 Risk Analysis IX
www.witpress.com, ISSN 1743-3517 (on-line) WIT Transactions on Information and Communication Technologies, Vol 47, © 2014 WIT Press