seismic quality index of rock mass - srce
TRANSCRIPT

M. Gazdek, M. Bačić, M. Saša Kovačević Indeks seizmičke kvalitete (SQi) stijenske mase
ISSN 1330-3651(Print), ISSN 1848-6339 (Online) UDC/UDK 552.122.08:550.344.094.5
SEISMIC QUALITY INDEX (SQi) OF ROCK MASS Mario Gazdek, Mario Bačić, Meho Saša Kovačević
Original scientific paper The existing rock mass classifications are, to a smaller or larger extent, deficient in regards to the specifics of particular locations. No classification, however, uses the velocity of seismic waves as initial parameters in the classification procedure. This paper introduces the term seismic quality index (SQi) as a comparative indicator of the discontinuity state of rock mass which confirms the potential of velocity of longitudinal waves as a classifier, especially for carbonate rock mass in weathering zones. The field of numerical values for SQi is generated from the relationship slowness – seismic impedance – porosity, in a particular cell of the velocity matrix. Changes in the field of seismic quality index SQi cause changes in velocity values in an observed cell and neighbouring cells. The procedure to determine the seismic quality index will be shown on the example of an actual tomographic seismic profile for which discontinuities were previously defined using a standard geological-geophysical evaluation procedure. Use of SQi on the basis of fields of values, will allow to define more precisely zoning and determine the significance of discontinuities in terms of existing classification of carbonate rock mass in karst regions. Keywords: Refraction Tomography, Rock Mass Discontinuities, Seismic Quality index Indeks seizmičke kvalitete (SQi) stijenske mase
Izvorni znanstveni članak Postojeće klasifikacije stijenske mase su, u manjoj ili većoj mjeri, manjkave obzirom na specifičnosti pojedine lokacije. Ni jedna klasifikacija, međutim, ne koristi brzine seizmičkih valova kao ulazne parametre u postupku klasifikacije. U radu se uvodi pojam indeksa seizmičke kvalitete (SQi) kao komparativnog pokazatelja stanja diskontinuiranosti stijenske mase koji potvrđuje potencijal brzina uzdužnih valova kao klasifikatora, naročito karbonatnih stijena u zoni trošenja. Polje numeričkih vrijednosti SQi generira se iz odnosa sporost - seizmička impedancija – poroznost, u pojedinoj ćeliji matrice brzine. Promjene polja indeksa seizmičke kvalitete SQi uzrokuju promijenjene vrijednosti brzine u promatranoj ćeliji i susjednim ćelijama. Procedura određivanja indeksa seizmičke kvalitete prikazati će se na primjeru stvarnog tomografskog seizmičkog presjeka, na kojem su prethodno definirani diskontinuiteti standardnom procedurom geološko - geofizičke procjene. Primjena SQi kao polja vrijednosti omogućiti će preciznije zoniranje i određivanje važnosti diskontinuiteta u postojećim klasifikacijama karbonatnih stijena krša. Ključne riječi: diskontinuiteti stijenske mase, indeks seizmičke kvalitete, refrakcijska tomografija 1 Introduction Although the scope of geophysical investigations in underground engineering is often very extensive, application of experience, theories or models in actual engineering conditions continues to remain an open and unresolved problem [1]. The motive for interpreting wave velocities obtained by geophysical investigations lies in the possibility of stratigraphic profiling and the determination of the state of subsoil or rock mass. For engineering purposes, geophysical methods which are primarily used are based on the generation and analysis of longitudinal P waves. Those methods are seismic reflection and seismic refraction. The later method is more often used and is based on the determination of velocities of artificially generated waves in subsoil and rock mass that return to the surface after refraction at the boundaries of layers exhibiting different velocities [2, 3]. Interpretation of acquired data provides the velocity distribution of longitudinal P waves along the profile. The final product of geophysical refraction profiling is the tomographic seismic profile, which represents the physical-statistical structure of an image of longitudinal wave velocities in subsoil or rock mass and is shown in Fig. 1.
In rock mass engineering, an important role in determining the state of rock mass is provided by rock mass classification. Previous experience is based solely on establishing a correlation between the velocities of P waves using standard parameters from engineering classification [4, 5, 6, 7].
Figure 1 Refraction tomographic profile [2]
A significant larger scope of information regarding
the link between velocities of P waves and numerical values of particular classifications is given at a global level for eruptive and metamorphic rock masses, just as the classification parameters have been researched in more detail. In such rock masses, the correlation between the velocity of P waves and numerical values of particular classifications, for instance, RMR or Q, are based on statistical analysis of data from hundreds of relational sets. However, despite the larger amount of data, the analyses relating to eruptive and metamorphic rock masses provide a poor representation of data on the relationship between the velocities of longitudinal waves and rock mass quality in surface zones to a depth of 20, 30 or 50 m, i.e. in zones that are of interest for most geotechnical projects. Besides the fact that carbonate rock mass, based on its physical-mechanical properties, differs from eruptive and metamorphic rock masses, they are exceptionally subjected to the process of karstification and a significant change in the properties leading to the stated depths. Carbonate rock mass in karst is characterised by the presence of discontinuity systems,
Tehnički vjesnik 21, 1(2014), 79-86 79
Seismic quality index (SQi) of rock mass M. Gazdek, M. Bačić, M. Saša Kovačević
caverns and fault zones. Most of the investigation boreholes are vertical hence most often there is a difference between the axial position of investigation borehole and the direction of the main discontinuity systems in karst. Namely, sub-vertical discontinuities which are parallel to the borehole axis can remain ‘uncaptured’ and therefore completely invisible. Since the data from an investigation borehole still provides the greatest credibility when determining state of rock mass, there is a clear emphasis on error of the model that rests solely on investigation boreholes. The fact is that the existing classifications, which in a dominant sense are based on investigation borehole, are to smaller or larger extent deficient in regards to the specifics of particular locations which is especially emphasised in karst conditions. On the other hand, application of the seismic refraction method allows a greater coverage of the investigated area, but this method also has a particular limitation from the aspect of detection of discontinuities. Due to the nature of constructions of a tomographic image and cell dimensions, in the best possible opportunity, discontinuities are visible having the smallest dimensions in 2D space of at least 50 % of the dimensions of cell of tomographic refraction image. However, even then only those changes that correlate to actual physical discontinuities are visible, but their existence and dimensions should be actually determined.
All that leads to the introduction of a seismic quality index (SQi) which serves as an auxiliary method for the state of quality for any rock mass categorisation system. The seismic quality index is not presented by a single number but represents an illustration of seismic quality that is generated from the field of values depicting the velocities of longitudinal P waves. When classifying carbonate rock mass in karst areas it is possible to define the zoning and determining the significance of the discontinuity with respect to the planned engineering structure. On the basis of such determined discontinuities, a conclusion can always be made in regards to a spatial (2D) allocation of representative and specific physical and mechanical rock mass properties. The concept of the seismic quality index originates in Croatian karst where the weathering and discontinuity is especially important due to the exceptional influence on the mechanical properties of rock mass. It is important to note that more than 50 % of the Croatian landmass is karst [8, 9, 10], and hence an understanding of the concept of the seismic quality index has a solid basis. 2 Theoretical background
The transformation from the distance-time (x-t) domain to the velocity-depth (v-d), belongs to the area of physical mathematics and comprises the geophysical core of the seismic refraction method, but this illustration of a seismic profile is missing a geophysical component which would explicitly define the geological or geotechnical significance of the resulting profile. Therefore, the fundamental idea is to intentionally cause a disturbance in the static (frozen) and smooth picture of the seismic profile, but in the manner that the disturbance satisfies the physical concept and statistical hypothesis of the distribution of a selected parameter or selected
relationship of the engineering, geological or geotechnical parameters. Regardless of the complexity and properties of such a mathematical transformation, within the ‘new’ space the fundamental physical parameter becomes seismic velocity, which allows further analysis of seismic velocity and other mechanical parameters without altering the fundamentals of the transformation. The mutual relationships regarding velocity values in the cells are determined from three independently defined mechanical principles: slowness [11], seismic impedance [12] and porosity [13]. The field of numerical values for SQi are generated from a mutual interaction of the stated terms, i.e. from the relationship slowness – seismic impedance – porosity, in a particular cell of the velocity matrix. Changes to the fields of the seismic quality index SQi cause changes to the velocity value in the observed cell and neighbouring cells.
The fundamental designations used to define the synthesis of the relationship slowness – seismic impedance – porosity are given at the plain y0z (left coordinate system whereby the axis z has a gravitation field direction) and are shown in Tab. 1.
Table 1 Designations for defining slowness - seismic impedance - porosity relation
Designation Definition m
designation for a rock mass matrix or solid substance in the cell
n designation for rock mass non-matrix (no substance in the cell)
y designation for model dimension in the y axis direction
z designation for model dimension in the z axis direction
Dty time shift when passing along the y axis Dtz time shift when passing along the z axis
v total velocity of the wave passing through the cell model
v velocity of wave passing through the substance and/or in the direction
I cell model dimensions of substances
n coefficient or ratio of substance impedances
ρ mass density of substance in model cell
Note: is a metavariable symbol.
a) Principle of slowness
Slowness, according to the definition, is a reciprocal value of wave dispersion velocity which for nominal paths has a time dimension [11], and therefore the slowness principle is used for analysing the total time it takes for wave to pass through a matrix cell of the velocity field of longitudinal P waves. Due to different properties and allocation of substances in the model cell, during passage the potential time defect Dt in different routes and directions is observed. The model of substances in the cell is a combination of the Voigt-Reuss model [14, 15], whereas the defect values Dt(y or z) control the geometric relationship, i.e. the matrix Im and non-matrix In dimension. The matrix represents the rock mass substance that is attributed with dominant properties, whereas the non-matrix defines the remaining empty space which is not identified. Since the cells of the field
80 Technical Gazette 21, 1(2014), 79-86
M. Gazdek, M. Bačić, M. Saša Kovačević Indeks seizmičke kvalitete (SQi) stijenske mase
of velocities of longitudinal waves are equidimensional, it can be correctly presumed that the dimensions of the model cells are equal in each direction, i.e. Iy=Iz=I, whereas in that case the time shifts Dty and Dtz are determined only by velocities vy and vz. All of this leads to the formation of two equations (1) and (2) providing expression for velocities in particular directions, as well as dimensions of substances in the cell model.
01 =⋅±
−⋅−
−⋅ yy
n
y
n
y
m
ym vt
vv
Ivv
vv
I ∆ , (1)
01 =⋅±
−⋅−
−⋅ zz
n
z
n
z
m
zm vt
vvI
vv
vvI ∆ . (2)
b) The principle of seismic impedance
The product of velocity and density is generally called acoustic impedance [12], though according to this designation such a definition should strictly refer only to longitudinal P waves in air. The term seismic impedance extends the definition to wave velocities, and in this discussion this relates exclusively to longitudinal P waves. The principle of seismic impedance serves in expressing mutual velocity relationships in a particular direction and the velocity through a particular substance (matrix or non-matrix). With the presumption that there is no anisotropy of density in the cell (ρy=ρz=ρ), and that the model and virtual impedances have been introduced as functions of normal stress and vibration velocity of a substance, the following is true:
,ym
mym
y anvv
=⋅=ρρ (3)
,zm
mzm
z anvv
=⋅=ρρ (4)
,yn
nyn
y bnvv
=⋅=ρρ (5)
.zn
nzn
z bnvv
=⋅=ρρ (6)
These defined coefficients of substance impedance evidently control the corresponding velocities and finally define the relationships of particular substances in different directions (event separation):
,zmzymy anan ⋅=⋅ (7)
.znzyny bnbn ⋅=⋅ (8) c) The principle of porosity
The principle of porosity relates to the implementation of the relation (9) concerning the density of substances in a cell in order to define the porosity-velocity relationship [13].
.nnmm III ρρρ ⋅+⋅=⋅ (9)
This relation implicitly presumes the isotropy of the density model, hence relations from the seismic impedance principle can be used. Should the relation regarding cell porosity be expressed in terms of density, then the matrix and non-matrix dimensions can be expressed using ratios of seismic impedance in particular directions:
,0)1()( =⋅−⋅−⋅−⋅⋅ ynyynyymym bnIbnanI (10)
.0)1()( =⋅−⋅−⋅−⋅⋅ znzznzzmzm bnIbnanI (11) d) Synthesis of slowness – seismic impedance - porosity
By uniting all presumptions, conditions and relations, we are able to define a system of equations which would provide a definition of geometrical relation of substances from an individual cell in a velocity field. Indicators of levels of transmission or transience for seismic energy (TSE) through a 2D cell, dimensioned from the velocity field, would now actually be the solution to this system. Firstly, it is necessary to form a system of equations for slowness – porosity. The formed relations from the previous discussion have the form:
( ) ( ) 01 )()()( =⋅±−⋅−−⋅ z,yz,yz,ym vtbIbaI ∆ - slowness, (12) ( ) ( ) 01)()( =⋅−⋅−⋅−⋅⋅ bnIbnanI z,yz,ym - porosity. (13) Finally, the system providing a synthesis of the
slowness and porosity principles comprises the following two equations:
( ) ( )( ) ,0)(111 =⋅−⋅⋅+−⋅−−⋅ zzyym
zzyy vtvtI
nana ∆∆ (14)
( ) ( )( ) .0)(111 =⋅+⋅−⋅+−⋅+−⋅ zzyym
zzyy vtvtI
nana ∆∆ (15)
Here it is possible to more clearly notice the number
and type of unknowns in the slowness – porosity relation. The system is defined by determining four unknowns: a(y,z) i n(y,z). Since there exist four more unknowns: Dt(y,z) i v(y,z), two more possible equations using the seismic impedance principle in a cell are defined:
0=⋅−⋅ zzyy anan , (16)
and the fact that velocity within a cell is a vector constant (vy
2 + vz2 = v2):
0222 =−− czy vaa , (17)
i.e. the velocity of the main refractor upon which the seismic interpretation is based. Generally speaking, velocity vm replaces velocity at the sample when it would be possible to define exclusively in each 2D cell. In this way, the numerical value explicitly expresses two unknowns, i.e. v(y,z)→ vc. The only matter remaining unresolved is the issue of two unknowns Dt(y,z) which relate to possible slowness defects. In reality it is completely irrelevant where they do
Tehnički vjesnik 21, 1(2014), 79-86 81
Seismic quality index (SQi) of rock mass M. Gazdek, M. Bačić, M. Saša Kovačević
or do not exist, since there is an intentional attempt to introduce ‘chaos’ in the picture of velocities in order to ‘resurrect’ a static (frozen) image of fields of velocities which are the result of seismic interpretations. On account of discontinuity, here the ‘time defect’ of particular cells is monitored with respect to velocity vc:
( ) ( )( ) ( )
.11 +− −
⋅=z,yz,y
cz,yz,y vv
vIt∆ (18)
Such a defined field shows an image of local
transients of seismic energy (TSE) whose values do not exceed 1. Should now the whole field be standardised using velocity 1/vc (or slowness), a reconstructed seismic image of velocity represents the seismic quality index (SQi) field. This image now clearly shows the visible discontinuities that indicate the areas of exceptional deviation of those mechanical properties (impedance and absence of rock mass matrices) which are incorporated into the matrix for longitudinal wave velocities.
The stated equations are implemented in the program package Wolfram Mathematica 5.0 [16], which served for compiling program code for determining the fields of seismic quality index SQi values. Gazdek [1] has given a program code for determining the seismic quality index fields from a refraction tomographic profile. 3 Tomography profile interpretation by SQi
The concept of the seismic quality index SQi model
has been verified on actual tomography cross-sections acquired as a result of refraction profiling. On the same cross-sections the discontinuities were previously registered using standard procedures for geological-geophysical evaluation. The geological-geophysical procedure is based on the ability and experience of the interpreter to link geological and seismic images from investigated location where the interpreter identifies the geological type and state of the location based on values and distribution of velocity of longitudinal waves. This procedure provides an indication of the presence of discontinuities in rock mass.
Further on a comparison of profiles from refraction tomography and generated profiles from seismic index quality will be given. The course of the procedure used to compare initial geological and geophysical interpretation with reconstructed seismic image, in which the basic element is no longer velocity but instead the seismic quality index, will be shown using the example of a refraction profile undertaken in the scope of investigation works for the purpose of foundation design of the Shopping centre in Rijeka. 3.1 Geological – geophysical interpretation of the
tomography profile
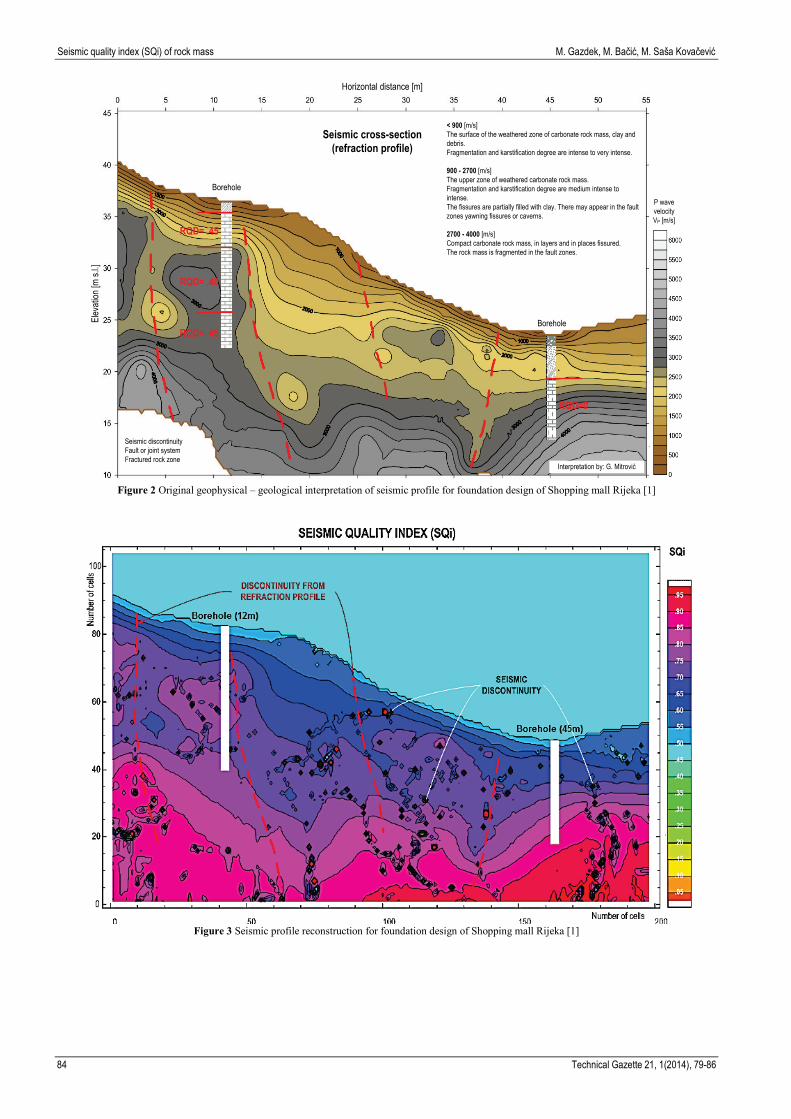
The first step in the procedure is carrying out a standard geological and geophysical interpretation in the following manner. Fig. 2 shows a refraction tomography profile with distribution of P wave velocities. The measured profile is 55 m long and approx. 35 m deep. Zoning of the rock mass as a seismic medium is based on
assessments of local conditions, where the geophysicists and geologists cooperate to define the velocity intervals. In this case, the rock mass is divided up into three velocity groups, as shown in Tab. 2.
Table 2 Rock mass zones depending on P wave velocities Velocity interval
(m/s) Description
0 ÷ 900
The surface of the weathered zone of carbonate rock mass, clay and debris. Fragmentation and karstification degree are intense to very intense.
900 ÷ 2700
The upper zone of weathered carbonate rock mass. Fragmentation and karstification degree are medium intense to intense. The fissures are partially filled with clay. There may appear in the fault zones yawning fissures or caverns.
2700 ÷ 4000
Compact carbonate rock mass, in layers and in places fissured. The rock mass is fragmented in the fault zones.
On the same profile the positions of the investigation
boreholes were interpolated with marked values of RQD index obtained by core analysis, and from observations a change in the state of rock mass at the surface designated possible locations and the presence of discontinuities. The actual state of the rock mass on the surface and abrupt bending of the contour of P velocities represents the sole indicator which can be used to position discontinuities (more intense fragmented zone, fissure or fault systems). It is evident that the RQD index cannot be correlated with the velocity values of the longitudinal waves. This is especially true for the right borehole at approx. the 45
metres of profile, where the RQD index amounts to zero in the rock mass zone with a P velocity in the boundaries of 2000 m/s to 4000 m/s. The deviation of the RQD index and velocities of longitudinal waves is evident also at the position of the left borehole (at approx. 12 metres of profile) where the zones providing different velocities, for instance 0 ÷ 2250 m/s and 2250 ÷ 4000 m/s, are joined by the same value of the RQD index equalling 0,45. Generally, the aim of geological interpretation for seismic cross-section in carbonate rock masses is mostly sub-horizontal layering and sub-vertical discontinuity, and a possible removal of this presumption is not analysed or is considered to be a prior erroneous.
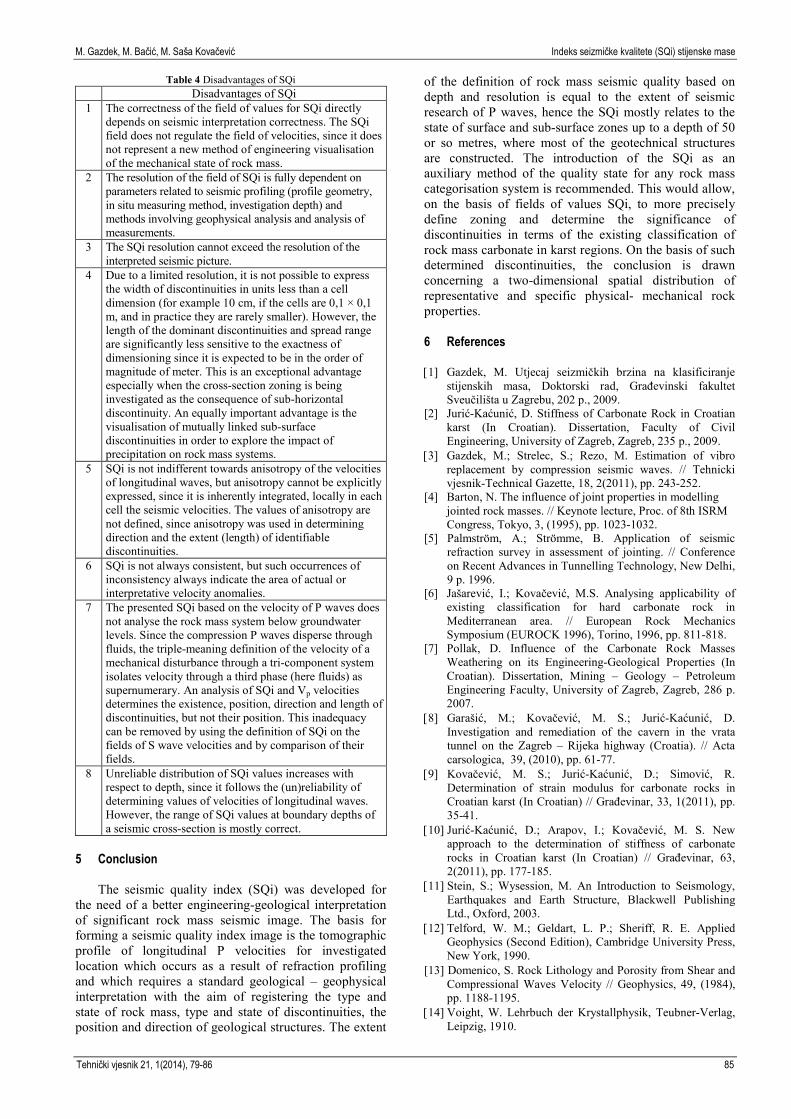
3.2 Forming an SQi profile
Once geological-geophysical interpretation of the tomographic profile has been carried out, the following step includes reconstruction of the seismic image of the seismic quality index (SQi) as shown in Fig. 3. The numerical value for the SQi is standardised by the maximum velocity in the seismic profile, which is attributed to the zone of fresh rock mass or basic refractor. If the colour legend is carefully observed, its division into 20 groups becomes evident. A colour group is not limited and arbitrary, but instead depends on geological complexity of the observed tomographic profile. As the range of measured P velocities in the tomographic profile varies amounts to 250 ÷ 4500 m/s, and the number of groups becomes 20, a change in the
82 Technical Gazette 21, 1(2014), 79-86
M. Gazdek, M. Bačić, M. Saša Kovačević Indeks seizmičke kvalitete (SQi) stijenske mase
SQi by 1 indicates velocity changes by 225 m/s, hence change increment in the index by 5 %. For instance, a value of the seismic quality index SQi equalling 5 relates to a rock mass zone where the seismic quality is 25 % in comparison to the zone possessing the maximum velocity of 4500 m/s, whereas a SQi of 10 refers to a zone where the seismic quality is 50 % with respect to the fresh rock mass. The relationship between tomographic profile dimensions (55 m length and 35 m depth) and the number of cells (195 and 105) provides the conclusion that discontinuities greater than a cell dimension, i.e. 0,3 m, are directly visible. The cumulative discontinuity of smaller dimensions becomes clearly visible at the cell dimension level, and such cells changes are linked to successive levels that designate discontinuities. Figure 3 shows the form of black points that interrupt the continuity of seismic quality index SQi values. It is actually these changes that designate the area that could be interpreted as sub-vertical discontinuities, and in comparison to tomographic profile now their horizontal links and existence are clearly visible. Furthermore, if we observe the position boreholes in the seismic quality index diagram, it is evident that the upper third section of the left borehole (at 12 m of profile) provides a SQi in the range from 10 to 15. Rock mass in that zone therefore, shows a 50 ÷ 70 % quality of fresh rock mass. The lower two-thirds of the left borehole provide a SQi of 14 to 15 (70 ÷ 75 % of the rock mass foundation quality). Even though the RQD was carried out on the 0,1 m wide core, a link between RQD and SQi is noticeable. If we observe the position of the borehole in the seismic quality index image, it is clear that displacing a borehole by around 3 m to the right (from the position of the 165 cell to the 175 cell position), borehole SQi acquires low values since it would in that case pass through vertical discontinuity. Furthermore, Fig. 2 showing the tomographic presentation of velocity provides no indication of the occurrence of discontinuities in that area, whereas the velocity contours are relatively curved. On the other hand, the RQD value at zero in the same area shows the fact that the rock mass in that area is significantly fragmented. It apparently shows an emphasised potential of seismic quality index in the positioning of boreholes and other forms of investigation works. For development of SQi concept, the existing coherent investigations of carbonate rock mass were used where the interpretation of P wave velocities verified the presumed engineering-geological model or showed possible deviations, and later verified by investigation boreholes. The type and state of carbonate rock mass subsequently were not limited, but instead the correct SQi was a direct consequence of the engineering-geological model. The range of the rock mass seismic quality definition based on investigation depth and resolution is equal to the range of seismic P waves investigations, hence the SQi mostly refers to the state of surface and sub-surface zones up to depth of 50 or so meters, which are zones important for construction of the majority of geotechnical structures.
4 Advantages and disadvantages of SQi
Tab. 3 shows the advantages of the seismic quality index, whereas its disadvantages are given in Tab. 4.
Table 3 Advantages of SQi
Advantages of SQi 1 Independence in the selection of the refraction method,
i.e. tomographic seismic interpretation. 2 Applicability for any field of P wave velocities. 3 Applicability also for field of S wave velocities, if
necessary to analyse seismic impedance of shear waves. 4 In determining the numerical values of the seismic
quality index of rock mass only a velocity matrix of observed seismic waves is necessary.
5 The SQi distinguishes and localises the effects of masked apparent improvements in mechanical properties, since it directly tracks the mutual relationships of the neighbouring cells covering the velocity fields. (Changes in mechanical properties are carried out from the velocity fields determined relatively with respect to the best properties in the depth of the investigated cross-section. ‘Poor’ values therefore cannot be better, but can certainly be ‘poorer’, since the upper values of the velocity interval are tracked.)
6 The SQi value is determined from the idealisation of porosity in a typical volume of rock mass accepted in the (engineering) mechanics of the rock mass.
7 Forming the field of SQi values determines the position and directions of dominant, potential mechanical discontinuities.
8 The SQi is a relative and local size attributed to the observed rock mass cross-section.
9 With localisation, a significant deviation in the assessment of the state of fissuring in the rock mass is avoided, since the velocities become relative due to a maximally interpreted in situ velocity, and not velocities measures at the samples.
10 The SQi allows a comparison of geometrically identical cross-sections after occurred or implemented changes of the mechanical properties of rock mass to the mechanical properties of rock mass.
11 More clearly than the field of velocities, SQi indicates the area of changes in the rock mass state, which is especially important when the seismic image and engineering-geological model does not correspond in an appropriate manner.
12 SQi has a numerical value, but in comparison to most engineering parameters, it is at least two-dimensional just like the seismic picture.
13 The SQi represents a quick mathematical and interpretation routine which is applied for visualisation of engineering quality of the seismic cross-section of rock mass.
14 The SQi is understandable for non-geophysics experts
Tehnički vjesnik 21, 1(2014), 79-86 83
Seismic quality index (SQi) of rock mass M. Gazdek, M. Bačić, M. Saša Kovačević
RQD= .45
RQD=0
RQD= .40
RQD= .45
Seismic cross-section(refraction profile)
Horizontal distance [m]
Borehole
Borehole
P wave velocityVP [m/s]
Interpretation by: G. Mitrović
Seismic discontinuityFault or joint systemFractured rock zone
Elev
ation
[m s.
l.]
< 900 [m/s]The surface of the weathered zone of carbonate rock mass, clay and debris. Fragmentation and karstification degree are intense to very intense.
900 - 2700 [m/s]The upper zone of weathered carbonate rock mass. Fragmentation and karstification degree are medium intense to intense. The fissures are partially filled with clay. There may appear in the fault zones yawning fissures or caverns.
2700 - 4000 [m/s]Compact carbonate rock mass, in layers and in places fissured. The rock mass is fragmented in the fault zones.
Figure 2 Original geophysical – geological interpretation of seismic profile for foundation design of Shopping mall Rijeka [1]
Figure 3 Seismic profile reconstruction for foundation design of Shopping mall Rijeka [1]
84 Technical Gazette 21, 1(2014), 79-86
M. Gazdek, M. Bačić, M. Saša Kovačević Indeks seizmičke kvalitete (SQi) stijenske mase
Table 4 Disadvantages of SQi Disadvantages of SQi
1 The correctness of the field of values for SQi directly depends on seismic interpretation correctness. The SQi field does not regulate the field of velocities, since it does not represent a new method of engineering visualisation of the mechanical state of rock mass.
2 The resolution of the field of SQi is fully dependent on parameters related to seismic profiling (profile geometry, in situ measuring method, investigation depth) and methods involving geophysical analysis and analysis of measurements.
3 The SQi resolution cannot exceed the resolution of the interpreted seismic picture.
4 Due to a limited resolution, it is not possible to express the width of discontinuities in units less than a cell dimension (for example 10 cm, if the cells are 0,1 × 0,1 m, and in practice they are rarely smaller). However, the length of the dominant discontinuities and spread range are significantly less sensitive to the exactness of dimensioning since it is expected to be in the order of magnitude of meter. This is an exceptional advantage especially when the cross-section zoning is being investigated as the consequence of sub-horizontal discontinuity. An equally important advantage is the visualisation of mutually linked sub-surface discontinuities in order to explore the impact of precipitation on rock mass systems.
5 SQi is not indifferent towards anisotropy of the velocities of longitudinal waves, but anisotropy cannot be explicitly expressed, since it is inherently integrated, locally in each cell the seismic velocities. The values of anisotropy are not defined, since anisotropy was used in determining direction and the extent (length) of identifiable discontinuities.
6 SQi is not always consistent, but such occurrences of inconsistency always indicate the area of actual or interpretative velocity anomalies.
7 The presented SQi based on the velocity of P waves does not analyse the rock mass system below groundwater levels. Since the compression P waves disperse through fluids, the triple-meaning definition of the velocity of a mechanical disturbance through a tri-component system isolates velocity through a third phase (here fluids) as supernumerary. An analysis of SQi and Vp velocities determines the existence, position, direction and length of discontinuities, but not their position. This inadequacy can be removed by using the definition of SQi on the fields of S wave velocities and by comparison of their fields.
8 Unreliable distribution of SQi values increases with respect to depth, since it follows the (un)reliability of determining values of velocities of longitudinal waves. However, the range of SQi values at boundary depths of a seismic cross-section is mostly correct.
5 Conclusion
The seismic quality index (SQi) was developed for
the need of a better engineering-geological interpretation of significant rock mass seismic image. The basis for forming a seismic quality index image is the tomographic profile of longitudinal P velocities for investigated location which occurs as a result of refraction profiling and which requires a standard geological – geophysical interpretation with the aim of registering the type and state of rock mass, type and state of discontinuities, the position and direction of geological structures. The extent
of the definition of rock mass seismic quality based on depth and resolution is equal to the extent of seismic research of P waves, hence the SQi mostly relates to the state of surface and sub-surface zones up to a depth of 50 or so metres, where most of the geotechnical structures are constructed. The introduction of the SQi as an auxiliary method of the quality state for any rock mass categorisation system is recommended. This would allow, on the basis of fields of values SQi, to more precisely define zoning and determine the significance of discontinuities in terms of the existing classification of rock mass carbonate in karst regions. On the basis of such determined discontinuities, the conclusion is drawn concerning a two-dimensional spatial distribution of representative and specific physical- mechanical rock properties.
6 References [1] Gazdek, M. Utjecaj seizmičkih brzina na klasificiranje
stijenskih masa, Doktorski rad, Građevinski fakultet Sveučilišta u Zagrebu, 202 p., 2009.
[2] Jurić-Kaćunić, D. Stiffness of Carbonate Rock in Croatian karst (In Croatian). Dissertation, Faculty of Civil Engineering, University of Zagreb, Zagreb, 235 p., 2009.
[3] Gazdek, M.; Strelec, S.; Rezo, M. Estimation of vibro replacement by compression seismic waves. // Tehnicki vjesnik-Technical Gazette, 18, 2(2011), pp. 243-252.
[4] Barton, N. The influence of joint properties in modelling jointed rock masses. // Keynote lecture, Proc. of 8th ISRM Congress, Tokyo, 3, (1995), pp. 1023-1032.
[5] Palmström, A.; Strömme, B. Application of seismic refraction survey in assessment of jointing. // Conference on Recent Advances in Tunnelling Technology, New Delhi, 9 p. 1996.
[6] Jašarević, I.; Kovačević, M.S. Analysing applicability of existing classification for hard carbonate rock in Mediterranean area. // European Rock Mechanics Symposium (EUROCK 1996), Torino, 1996, pp. 811-818.
[7] Pollak, D. Influence of the Carbonate Rock Masses Weathering on its Engineering-Geological Properties (In Croatian). Dissertation, Mining – Geology – Petroleum Engineering Faculty, University of Zagreb, Zagreb, 286 p. 2007.
[8] Garašić, M.; Kovačević, M. S.; Jurić-Kaćunić, D. Investigation and remediation of the cavern in the vrata tunnel on the Zagreb – Rijeka highway (Croatia). // Acta carsologica, 39, (2010), pp. 61-77.
[9] Kovačević, M. S.; Jurić-Kaćunić, D.; Simović, R. Determination of strain modulus for carbonate rocks in Croatian karst (In Croatian) // Građevinar, 33, 1(2011), pp. 35-41.
[10] Jurić-Kaćunić, D.; Arapov, I.; Kovačević, M. S. New approach to the determination of stiffness of carbonate rocks in Croatian karst (In Croatian) // Građevinar, 63, 2(2011), pp. 177-185.
[11] Stein, S.; Wysession, M. An Introduction to Seismology, Earthquakes and Earth Structure, Blackwell Publishing Ltd., Oxford, 2003.
[12] Telford, W. M.; Geldart, L. P.; Sheriff, R. E. Applied Geophysics (Second Edition), Cambridge University Press, New York, 1990.
[13] Domenico, S. Rock Lithology and Porosity from Shear and Compressional Waves Velocity // Geophysics, 49, (1984), pp. 1188-1195.
[14] Voight, W. Lehrbuch der Krystallphysik, Teubner-Verlag, Leipzig, 1910.
Tehnički vjesnik 21, 1(2014), 79-86 85

Seismic quality index (SQi) of rock mass M. Gazdek, M. Bačić, M. Saša Kovačević
[15] Reuss, A. Berechnung der Fliegrenze von Mischkristallen. // Angew. Mathem. U. Mech, 9, (1929), pp. 49-58.
[16] ‘Wolfram Mathematica 5.0’. The Wolfram Centre Lower Road, Long Hanborough, Oxfordshire OX29 8FD, United Kingdom Authors' addresses Dr. sc. Mario Gazdek, dipl. ing. geot. Geotehnički fakultet Hallerova aleja 7 42000 Varaždin, Croatia E-mail: [email protected] Mario Bačić, mag. ing. aedif. Sveučilište u Zagrebu Građevinski fakultet Zavod za geotehniku Kačićeva 26 10000 Zagreb, Croatia E-mail: [email protected] Prof. dr.sc. Meho Saša Kovačević, dipl. ing. građ. Sveučilište u Zagrebu Građevinski fakultet Zavod za geotehniku Kačićeva 26 10000 Zagreb, Croatia E-mail: [email protected]
86 Technical Gazette 21, 1(2014), 79-86