seismic performance of precast concrete summary … · to investigate the seismic performance of...
TRANSCRIPT
Spr ing 2009 | PCI Journal116
Editor’s quick points
n Researchers recently completed a three-phase research project to investigate the seismic performance of precast concrete segmental bridges.
n The research showed that segment joints can undergo large rotations that open gaps in the superstructure without signifi-cant loss of strength.
n This research also showed that damage in a superstructure-column system is limited to the column when vertical earth-quake demands are not considered.
n When vertical earthquake demands are included and the clamping force at the superstructure segment joints is reduced, some segment joints may open without compromising the behavior of the system.
Seismic performance of precast concrete segmental bridges: Summary of experimental research on segment-to-segment jointsSami Megally, Marc J. Veletzos, Kelly Burnell, José I. Restrepo, and Frieder Seible
Advantages of precast concrete segmental bridges include rapid construction, reduced environmental impact, and re-duced influence on current traffic patterns during construc-tion. These benefits have proved to reduce construction costs, resulting in increased use of segmental construction throughout the world. The popularity of precast concrete segmental bridges in high seismic zones in the United States, however, has been hampered by severe restrictions on their construction due to a lack of seismic research.
To address this concern, the American Segmental Bridge Institute (ASBI), the California Department of Transporta-tion (Caltrans), and the University of California at San Diego (UCSD) developed a comprehensive research project that investigated the seismic performance of precast concrete seg-mental bridges. This three-phase, large-scale research project, funded by Caltrans, was recently completed at UCSD.
117PCI Journal | Spr ing 2009
This article provides a general overview of the various research phases and design recommendations from the completed project. It is important to note that the results from phases I and II were already published.1,2,3 Thus, some details of the construction and damage progression of these test units were omitted from this article due to space considerations.
Prototype structure
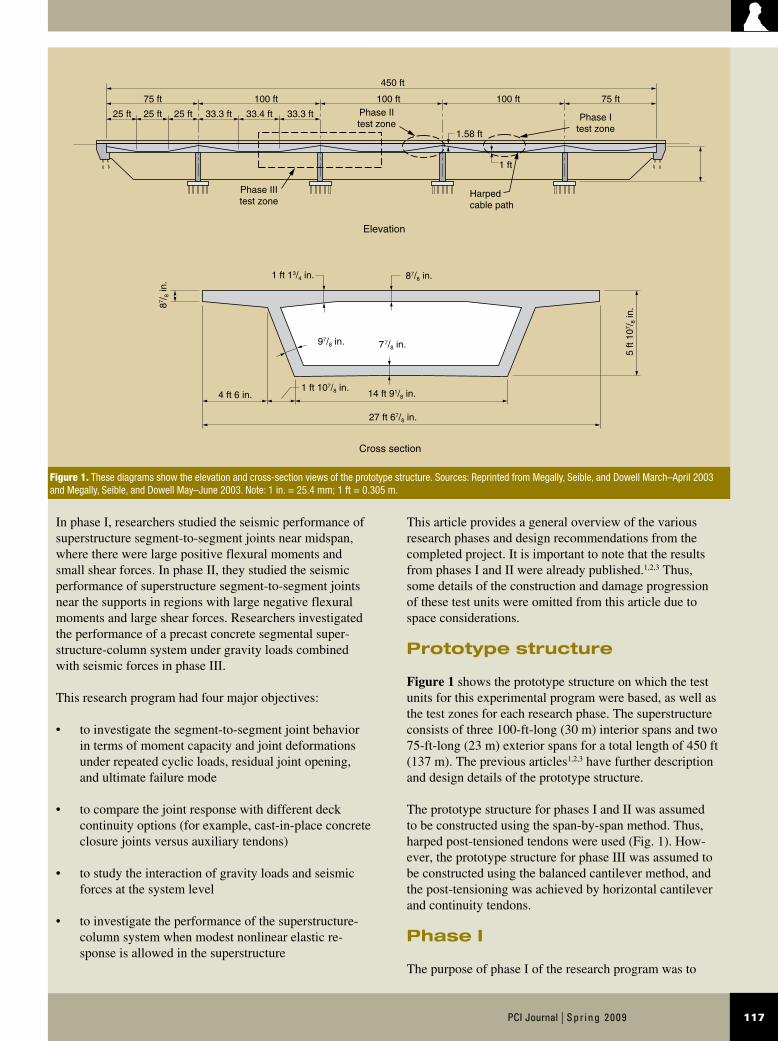
Figure 1 shows the prototype structure on which the test units for this experimental program were based, as well as the test zones for each research phase. The superstructure consists of three 100-ft-long (30 m) interior spans and two 75-ft-long (23 m) exterior spans for a total length of 450 ft (137 m). The previous articles1,2,3 have further description and design details of the prototype structure.
The prototype structure for phases I and II was assumed to be constructed using the span-by-span method. Thus, harped post-tensioned tendons were used (Fig. 1). How-ever, the prototype structure for phase III was assumed to be constructed using the balanced cantilever method, and the post-tensioning was achieved by horizontal cantilever and continuity tendons.
Phase I
The purpose of phase I of the research program was to
In phase I, researchers studied the seismic performance of superstructure segment-to-segment joints near midspan, where there were large positive flexural moments and small shear forces. In phase II, they studied the seismic performance of superstructure segment-to-segment joints near the supports in regions with large negative flexural moments and large shear forces. Researchers investigated the performance of a precast concrete segmental super-structure-column system under gravity loads combined with seismic forces in phase III.
This research program had four major objectives:
to investigate the segment-to-segment joint behavior •in terms of moment capacity and joint deformations under repeated cyclic loads, residual joint opening, and ultimate failure mode
to compare the joint response with different deck •continuity options (for example, cast-in-place concrete closure joints versus auxiliary tendons)
to study the interaction of gravity loads and seismic •forces at the system level
to investigate the performance of the superstructure-•column system when modest nonlinear elastic re-sponse is allowed in the superstructure
Figure 1. These diagrams show the elevation and cross-section views of the prototype structure. Sources: Reprinted from Megally, Seible, and Dowell March–April 2003 and Megally, Seible, and Dowell May–June 2003. Note: 1 in. = 25.4 mm; 1 ft = 0.305 m.
100 ft75 ft
25 ft25 ft 25 ft 33.3 ft 33.4 ft 33.3 ft
Phase IIItest zone
Elevation
Phase IItest zone
Phase Itest zone
Harpedcable path
100 ft 100 ft 75 ft
1.58 ft
1 ft
450 ft
1 ft 13/4 in.
1 ft 107/8 in.14 ft 91/8 in.
27 ft 67/8 in.
97/8 in.
87 /8
in. 87/8 in.
77/8 in.
4 ft 6 in.
Cross section
5 ft
107 /
8 in
.
97/8 in. 77/8 in.
Spr ing 2009 | PCI Journal118
study the behavior of segment-to-segment joints in regions of large positive flexural moments and small shear forces, that is, near midspan. These regions are of interest because
the effects of vertical earthquake motion may significantly increase the demands on the superstructure.
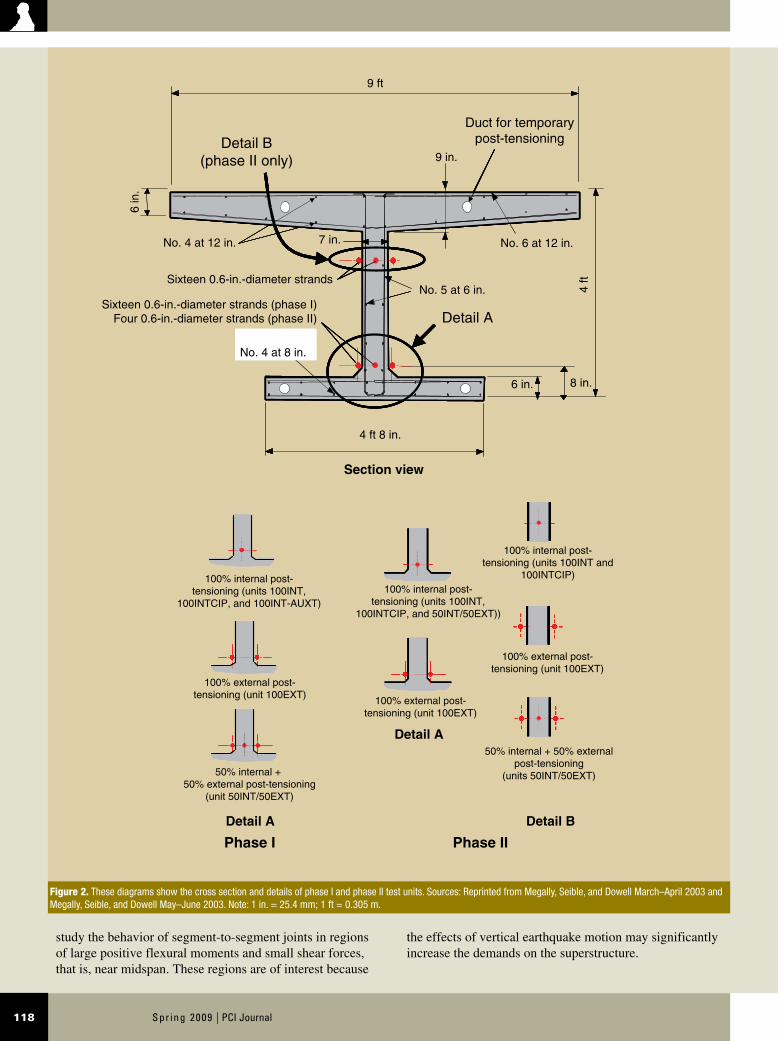
Figure 2. These diagrams show the cross section and details of phase I and phase II test units. Sources: Reprinted from Megally, Seible, and Dowell March–April 2003 and Megally, Seible, and Dowell May–June 2003. Note: 1 in. = 25.4 mm; 1 ft = 0.305 m.
#4 @ 8''No. 4 at 8''
#4 @ 8''
No. 6 at 12 in.
6 in.
9 in.
7 in.
4 ft 8 in.
4 ft
6 in
.
9 ft
8 in.
No. 5 at 6 in.
Detail A
Duct for temporarypost-tensioning
Section view
Detail A
Detail A
Detail B
Phase IIPhase I
Detail B(phase II only)
No. 4 at 12 in.
Sixteen 0.6-in.-diameter strands
Sixteen 0.6-in.-diameter strands (phase I)Four 0.6-in.-diameter strands (phase II)
No. 4 at 8 in.
100% internal post-tensioning (units 100INT and
100INTCIP)100% internal post-
tensioning (units 100INT,100INTCIP, and 50INT/50EXT))
100% internal post-tensioning (units 100INT,
100INTCIP, and 100INT-AUXT)
100% external post-tensioning (unit 100EXT)
100% external post-tensioning (unit 100EXT)
100% external post-tensioning (unit 100EXT)
50% internal + 50% externalpost-tensioning
(units 50INT/50EXT)50% internal + 50% external post-tensioning
(unit 50INT/50EXT)
119PCI Journal | Spr ing 2009
diameter (15 mm) ASTM A4164 strands with an ultimate tensile strength of 270 ksi (1860 MPa). The prestressing force was equal for all test units and was calculated such that the concrete stresses resulting from post-tensioning were equivalent to the stresses in the prototype structure prior to a seismic event.
The influence of two different design parameters on the seismic performance of the test units was studied: the ratio of internal to external post-tensioning in the section and the type of deck continuity. For convenience, the test units were organized into two different test series to highlight the variations of these parameters (Table 1).
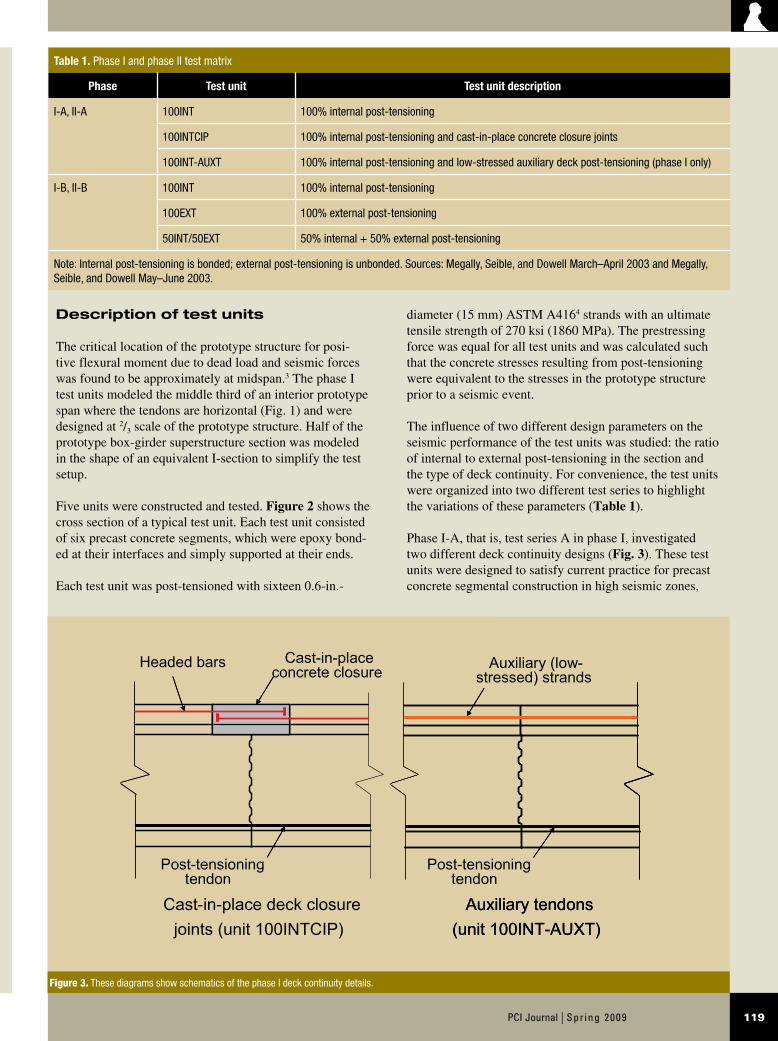
Phase I-A, that is, test series A in phase I, investigated two different deck continuity designs (Fig. 3). These test units were designed to satisfy current practice for precast concrete segmental construction in high seismic zones,
Description of test units
The critical location of the prototype structure for posi-tive flexural moment due to dead load and seismic forces was found to be approximately at midspan.3 The phase I test units modeled the middle third of an interior prototype span where the tendons are horizontal (Fig. 1) and were designed at 2/3 scale of the prototype structure. Half of the prototype box-girder superstructure section was modeled in the shape of an equivalent I-section to simplify the test setup.
Five units were constructed and tested. Figure 2 shows the cross section of a typical test unit. Each test unit consisted of six precast concrete segments, which were epoxy bond-ed at their interfaces and simply supported at their ends.
Each test unit was post-tensioned with sixteen 0.6-in.-
Table 1. Phase I and phase II test matrix
Phase Test unit Test unit description
I-A, II-A 100INT 100% internal post-tensioning
100INTCIP 100% internal post-tensioning and cast-in-place concrete closure joints
100INT-AUXT 100% internal post-tensioning and low-stressed auxiliary deck post-tensioning (phase I only)
I-B, II-B 100INT 100% internal post-tensioning
100EXT 100% external post-tensioning
50INT/50EXT 50% internal + 50% external post-tensioning
Note: Internal post-tensioning is bonded; external post-tensioning is unbonded. Sources: Megally, Seible, and Dowell March–April 2003 and Megally, Seible, and Dowell May–June 2003.
Figure 3. These diagrams show schematics of the phase I deck continuity details.
Auxiliary tendons(unit 100INT-AUXT)
Auxiliary (low-stressed) strands
Cast-in-place deck closure joints (unit 100INTCIP)
Cast-in-place concrete closure
Headed bars
Post-tensioning tendon
Post-tensioning tendon
Auxiliary tendons(unit 100INT-AUXT)
Spr ing 2009 | PCI Journal120
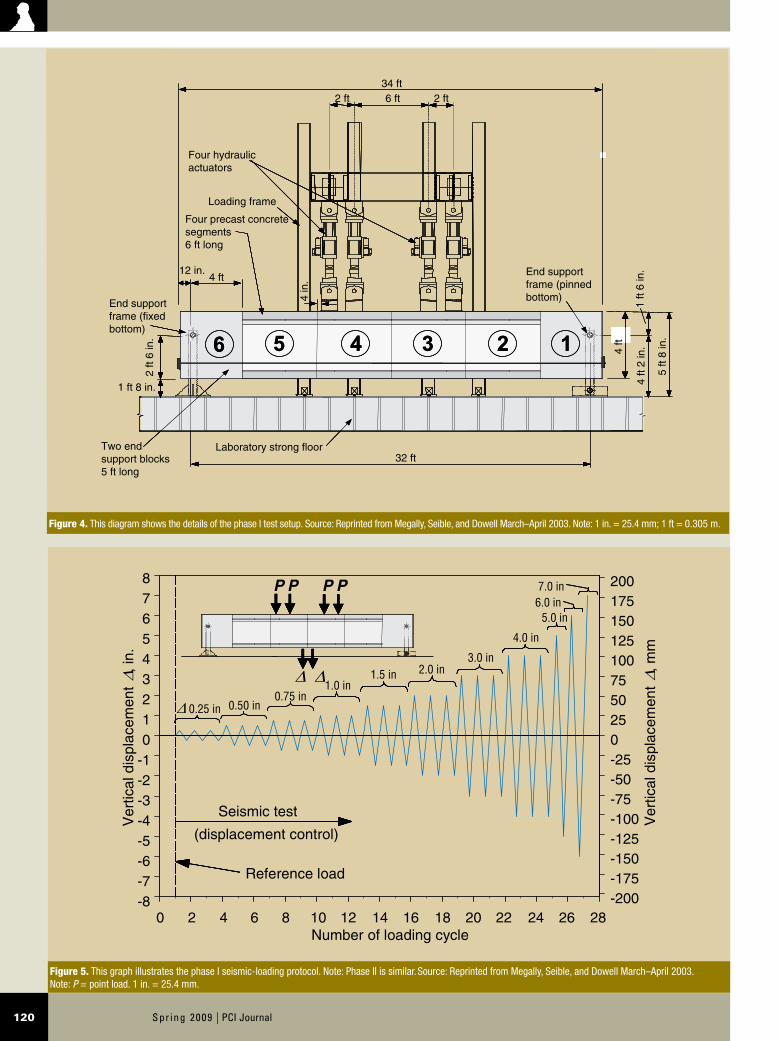
Figure 4. This diagram shows the details of the phase I test setup. Source: Reprinted from Megally, Seible, and Dowell March–April 2003. Note: 1 in. = 25.4 mm; 1 ft = 0.305 m.
45 1236 4455 11223366 45 1236 4455 11223366
End supportframe (pinnedbottom)
End supportframe (fixedbottom)
Two endsupport blocks5 ft long
Laboratory strong floor
1 ft 8 in.
34 ft
12 in.4 ft
2 ft 2 ft6 ft
4 in
.
2 ft
6 in
.
32 ft
4 ft
4 ft
2 in
.
5 ft
8 in
.
1 ft
6 in
.
Four precast concretesegments6 ft long
Loading frame
Four hydraulicactuators
Figure 5. This graph illustrates the phase I seismic-loading protocol. Note: Phase II is similar. Source: Reprinted from Megally, Seible, and Dowell March–April 2003. Note: P = point load. 1 in. = 25.4 mm.
Seismic test
Reference load
(displacement control)
Number of loading cycle
P
∆
P
∆
PP
Ver
tical
dis
plac
emen
t ∆ ,
in.
Ver
tical
dis
plac
emen
t ∆ ,
mm
0.75 in0.50 in∆0.25 in
1.0 in1.5 in 2.0 in
3.0 in
4.0 in
5.0 in6.0 in7.0 in
876543210
-1-2-3-4-5-6-7-8
2001751501251007550250-25-50-75-100-125-150-175-200
0 2 4 6 8 10 12 14 16 18 20 22 24 26 28
121PCI Journal | Spr ing 2009
of low-stressed auxiliary tendons in the deck slab. The design details of test unit 100INT-AUXT were similar to those of the San Francisco–Oakland Bay Bridge (SFOBB) skyway. Thus, this test unit also served as a proof test of designs that are in place in high seismic zones in Califor-
such as California. Test units were designed to minimize the likelihood of residual joint opening following a seismic event. Test unit 100INTCIP used mild-steel reinforce-ment and a cast-in-place concrete closure joint. Test unit 100INT-AUXT provided deck continuity through the use
Table 2. Summary of phase I experimental results
Test unit Pu ,* kip ∆u ,* in. ∆r ,† in. ∆r /∆Ref ,† % /Ref MTest ,* kip-ft
MCalc ,* kip-ft
MTest/MCalc
100INT 490 4.8 1.17 8.36 4.21 1.60 3126 2993 1.04
100INTCIP 480 5.9 0.53 3.79 8.75 3.33 3062 2974 1.03
100INT-AUXT 484 6.6 1.10 7.86 9.82 3.73 3087 3000 1.03
100EXT 417 6.6 0.14 1.00 2.63 1.00 2688 2732 0.98
50INT/50EXT 451 4.1 0.82 5.86 3.87 1.47 2894 2867 1.01
Source: Data from Megally, Seible, and Dowell March–April 2003 and Densley, Megally, and Seible 2003.
* Values given for downward loading direction.† ∆r and were determined for the +3 in. displacement cycle.
Note: MCalc = nominal flexural moment capacity in accordance with the American Association of State Highway and Transportation Officials’ Guide Specifications for Design and Construction of Segmental Concrete Bridges and Standard Specifications for Highway Bridges; MTest = peak experimental flexural moment at the critical joint; Pu = peak experimental external load (downward direction); ∆r = residual vertical displacement after unloading the seismic forces; ∆Ref = values of ∆r for unit 100EXT; ∆u = maximum displacement; = measured equivalent viscous damping coefficient as a ratio of critical damping; Ref = values of for unit 100EXT. 1 in. = 25.4 mm; 1 ft = 0.305 m; 1 kip = 4.448 kN.
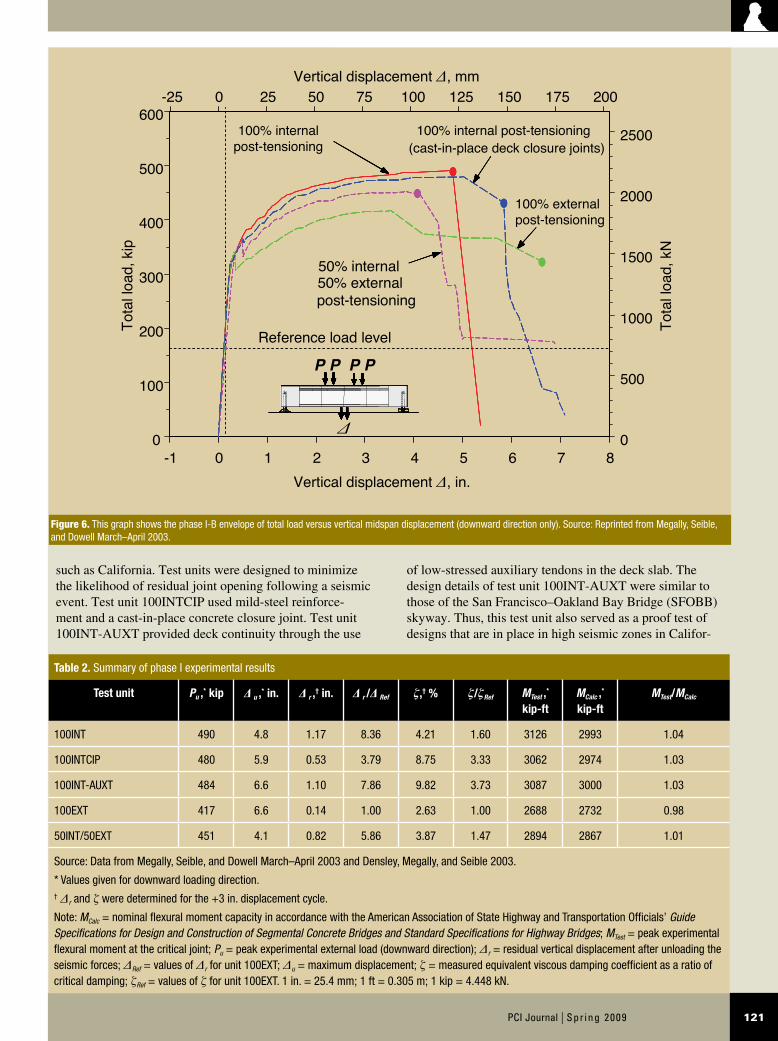
Figure 6. This graph shows the phase I-B envelope of total load versus vertical midspan displacement (downward direction only). Source: Reprinted from Megally, Seible, and Dowell March–April 2003.
-1 0 1 2 3 4 5 6 7 80
100
200
300
400
500
600-25 0 25 50 75 100 125 150 175 200
Vertical displacement ∆, mm
Vertical displacement ∆, in.
0
500
1000
1500
2000
2500To
tal lo
ad, k
ip
50% internal
100% external post-tensioning
Reference load level
100% internal post-tensioning
50% external post-tensioning
100% internal post-tensioning(cast-in-place deck closure joints)
∆
P P P P
Tota
l load
, kN
Spr ing 2009 | PCI Journal122
nia. Test unit 100INT was used as a benchmark for these two different designs.
Phase I-B, that is, test series B in phase I, investigated three ratios of internal to external post-tensioning, includ-ing 100% bonded internal post-tensioning, 100% unbonded external post-tensioning, and a mixture of 50% bonded internal and 50% unbonded external post-tensioning. The 50INT/50EXT test unit represented the current maximum limit of external post-tensioning as permitted by AASH-TO’s Guide Specifications for Design and Construction of Segmental Bridges.5
Test setup
Figure 4 shows a schematic elevation view of the test unit and the load frame. Each test unit was simply supported by a steel pin and steel links at its ends. At one end, the steel links were fixed at their bottom to restrain horizontal movement. At the other end, the steel links were pinned at their bottom with rocker links to allow rotation of the frame legs and horizontal expansion and contraction of the test units.
Four vertical, servo-controlled hydraulic actuators applied
external loads to each test unit. These loads simulated the effects of highway loading and vertical seismic displace-ments on the superstructure. The midspan joint of each test unit was subjected to no shearing force and the greatest positive flexural moment as at the midspan joint of the prototype span.
Electrical resistance gauges measured strains in the con-crete and prestressing steel. Linear potentiometers mea-sured vertical displacements along the span, segment joint openings, vertical sliding between segments, and support displacements.
At the beginning of the test, each unit was loaded in the downward direction to a prescribed level so that the stresses at the midspan joint were equal to those in the prototype struc-ture under combined dead load, superimposed dead load, and prestressing loads (both primary and secondary). This load level is referred to as the reference load level throughout this paper. There was a load protocol followed for each test unit:
Stage one, service-load conditioning• Two interior actuators controlled the load during this test stage. Each test unit was loaded to the reference load level of 74.5 kip (331 kN) per actuator. The actuator load
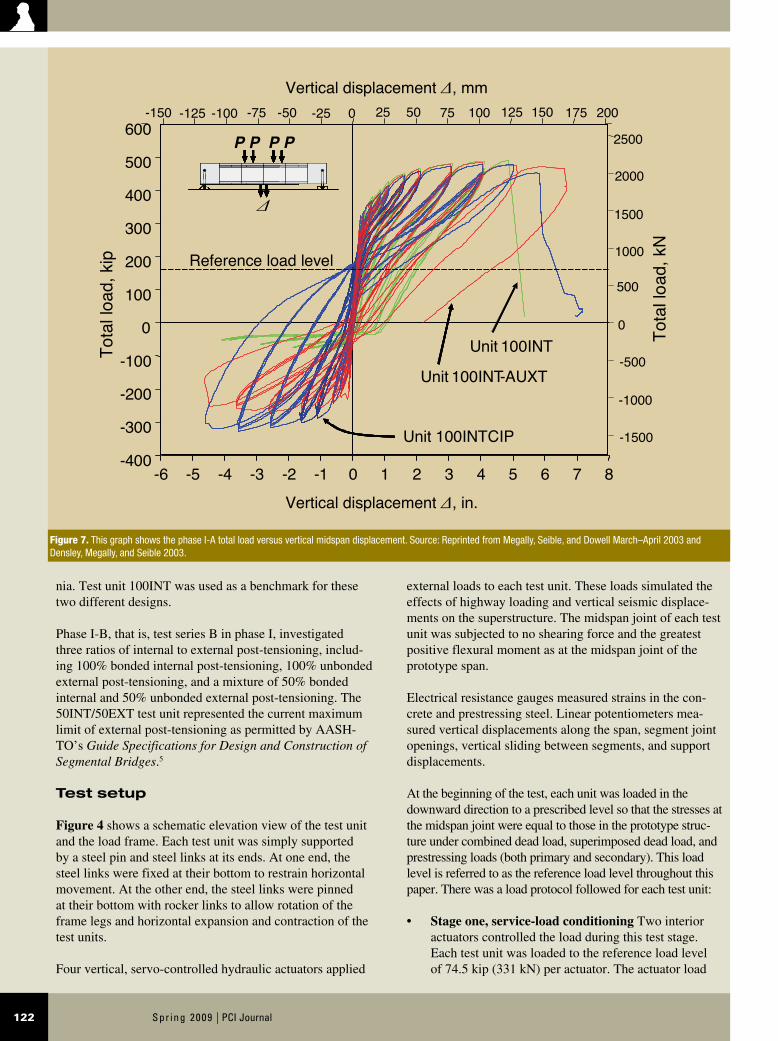
Figure 7. This graph shows the phase I-A total load versus vertical midspan displacement. Source: Reprinted from Megally, Seible, and Dowell March–April 2003 and Densley, Megally, and Seible 2003.
-6 -5 -4 -3 -2 -1 0 1 2 3 4 5 6 7 8-400
-300
-200
-100
0
100
200
300
400
500
600
Unit 100INTCIP
Unit 100INT-AUXT
500
1000
1500
2000
2500
-1500
-1000
-500
0
25 50 75 100 125 150 175 200-150 -125 -100 -75 -50 -25 0
Unit 100INTTota
l loa
d, k
ip Reference load level
Tota
l loa
d, k
N
∆
P P P P
Vertical displacement ∆, mm
Vertical displacement ∆, in.
123PCI Journal | Spr ing 2009
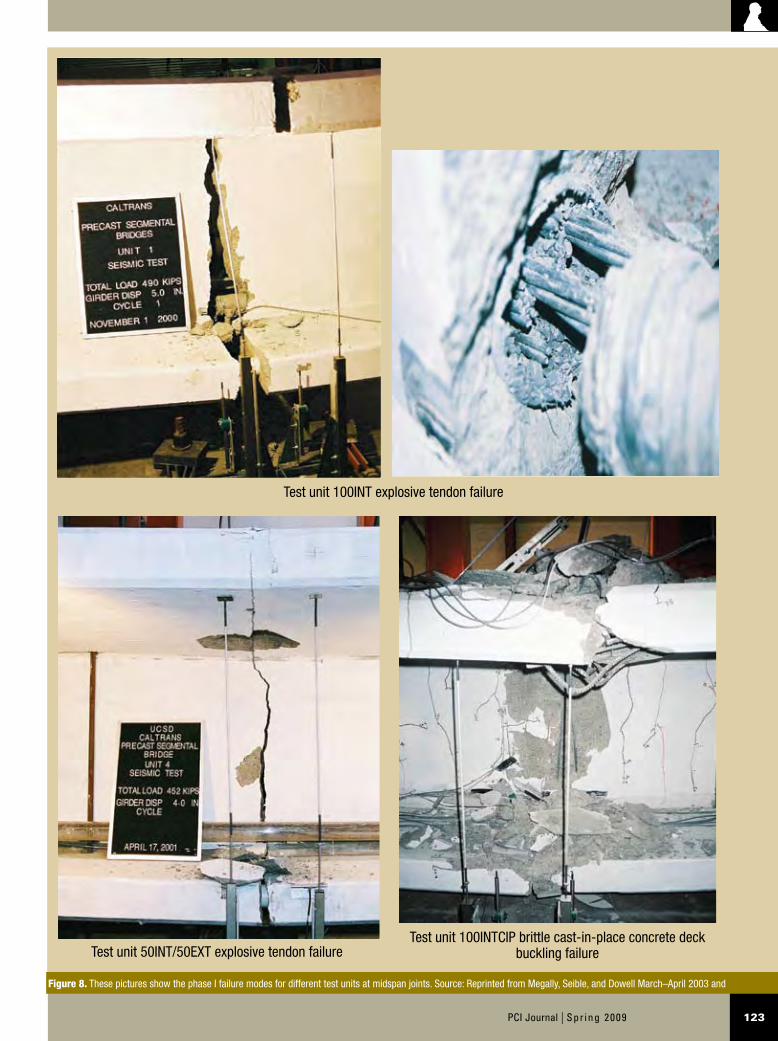
Test unit 50INT/50EXT explosive tendon failureTest unit 100INTCIP brittle cast-in-place concrete deck
buckling failure
Figure 8. These pictures show the phase I failure modes for different test units at midspan joints. Source: Reprinted from Megally, Seible, and Dowell March–April 2003 and Densley, Megally, and Seible 2003.
Test unit 100INT explosive tendon failure
Spr ing 2009 | PCI Journal124
65 kip (500 kN and 290 kN). The upper and lower load limits provided the same midspan stresses as the prototype structure under maximum and minimum service loads.1 The purpose of this testing stage was to investigate the effects of service loading on the seismic performance of the superstructure.
Stage two, seismic test• All four actuators provided displacement control with equal forces maintained for each actuator throughout this test stage. Each test unit was loaded to the reference load level of 40.5 kip (180 kN) per actuator, or a total load of 162 kip (721 kN). Each test unit was then subjected to fully reversed cyclic vertical displacements at midspan with increasing amplitude to failure. Three cycles were completed for each target displacement up to 4 in. (100 mm). Only one cycle was performed at each displacement level beyond 4 in. Figure 5 shows the displacement history during the seismic test.
Experimental results
During stage one, all test units experienced low tensile stresses.1,3 Thus, segment joint openings did not occur in any of the test units. Because of this linear-elastic behavior of the test units during stage one, only the results of stage two will be discussed.
In general, all test units showed significant inelastic deformations prior to failure and test unit 100EXT ex-hibited a joint rotation capacity significantly higher than all of the other test units. Test units with bonded tendons spread plasticity and opened three segment-to-segment joints, while test units with external tendons (100EXT, 50INT/50EXT) concentrated the deformations at only one segment joint. In addition, article 9.17 of the AASHTO Standard Specifications for Highway Bridges6 and article 11.2 of the AASHTO guide specifications5 provided good predictions of the moment capacity.
The test units with internal, bonded tendons showed larger energy dissipation capacity, which was caused by yielding of the post-tensioning and increased cracking. The benefit typically associated with increased damp-ing is reduced seismic displacement of the structural system. It is not likely that this benefit will be realized because the current design philosophy limits damage to the superstructure using capacity design principles. The ability of the superstructure to dissipate energy may not be an important issue in design because plastic hinges are anticipated in the columns, not at superstructure segment-to-segment joints.
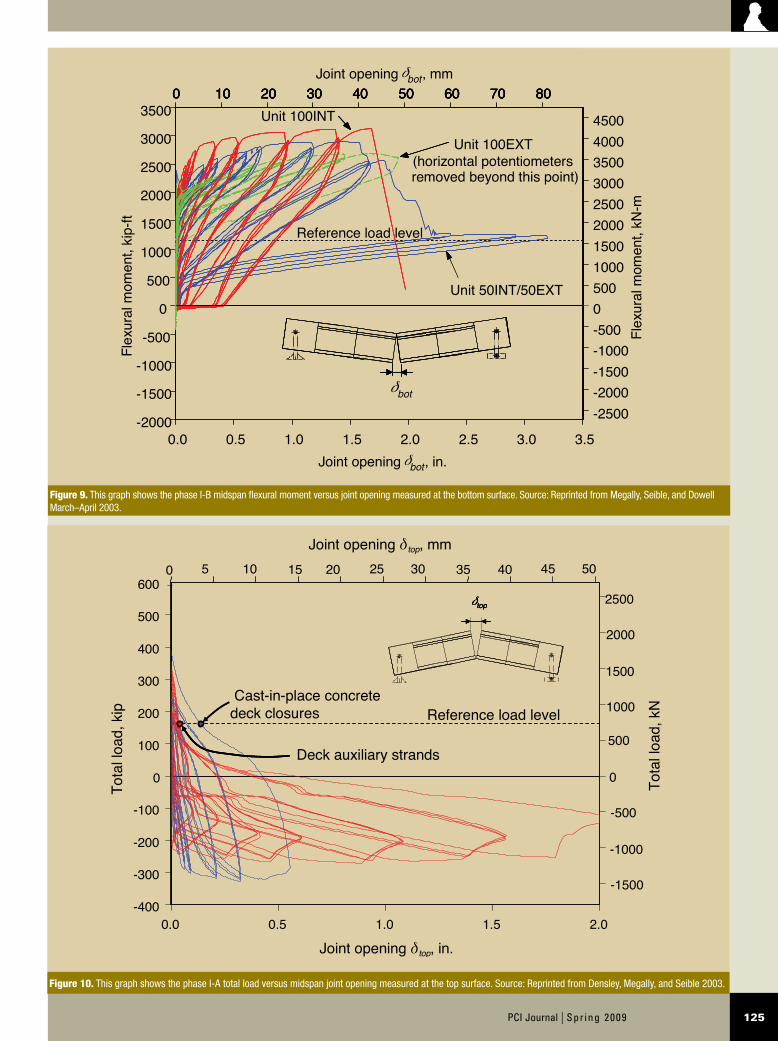
was then cycled 100,000 times between 112 kip and Test unit 100EXT gradual deck compression failure
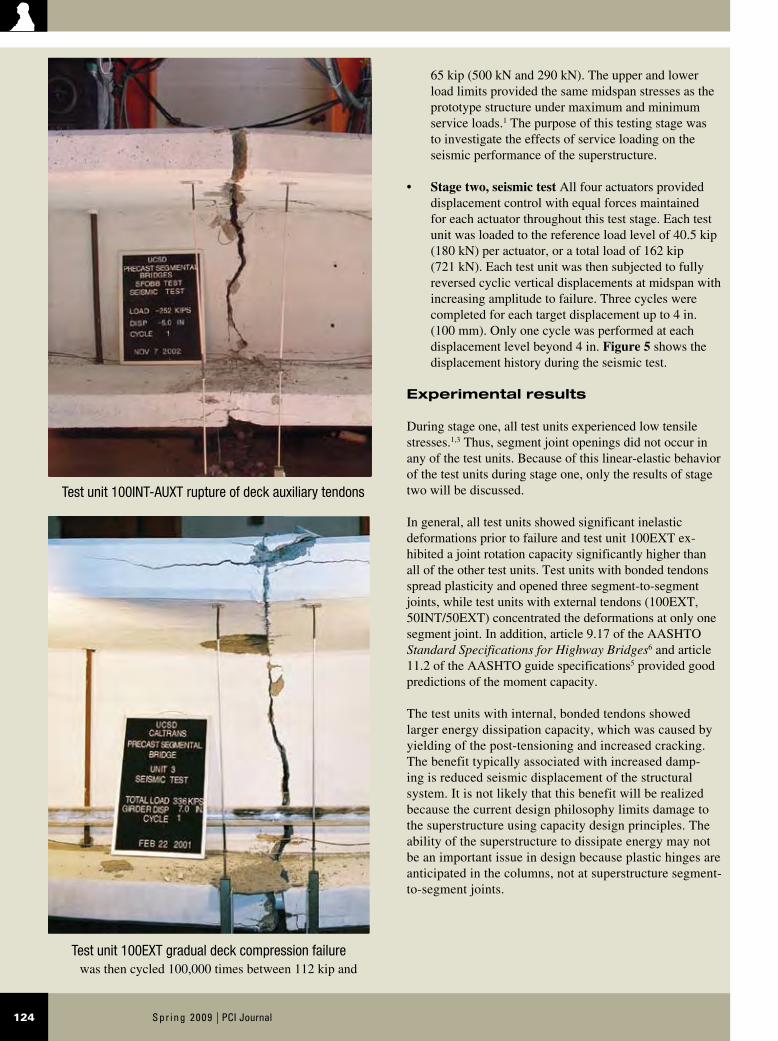
Test unit 100INT-AUXT rupture of deck auxiliary tendons
125PCI Journal | Spr ing 2009
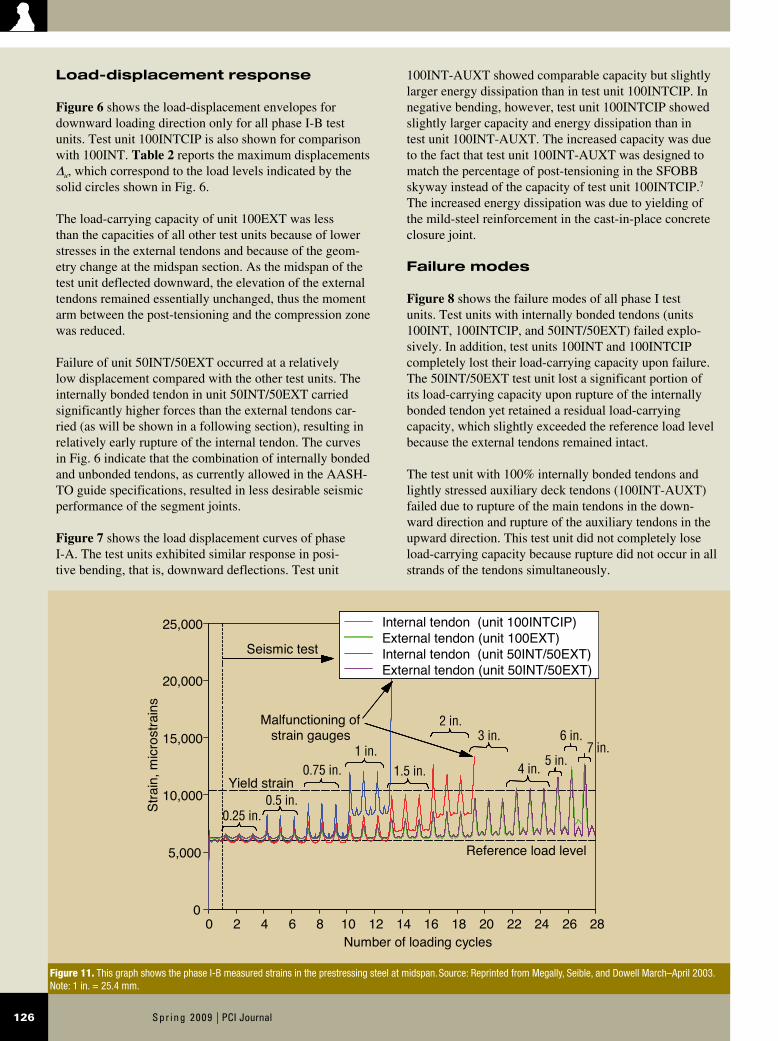
Figure 9. This graph shows the phase I-B midspan flexural moment versus joint opening measured at the bottom surface. Source: Reprinted from Megally, Seible, and Dowell March–April 2003.
0.0 0.5 1.0 1.5 2.0 2.5 3.0 3.5-2000
-1500
-1000
-500
0
500
1000
1500
2000
2500
3000
3500
-2500-2000-1500-1000-500050010001500200025003000350040004500
0 10 20 30 40 50 60 70 80
removed beyond this point)
Flex
ural
mom
ent,
kip-
ft
Unit 50INT/50EXT
Joint opening δbot, mm
Joint opening δbot, in.
Reference load level
Unit 100EXT
Unit 100INT
(horizontal potentiometers
δbot
Flex
ural
mom
ent,
kN-m
0 10 20 30 40 50 60 70 800 10 20 30 40 50 60 70 800 10 20 30 40 50 60 70 80
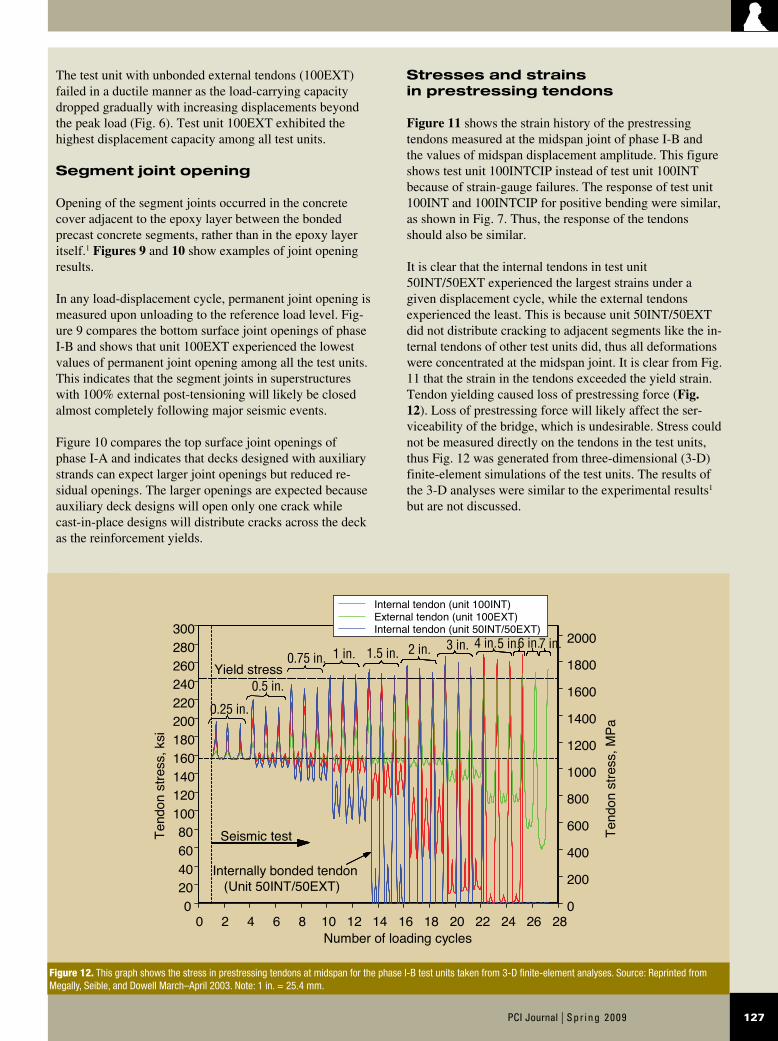
Figure 10. This graph shows the phase I-A total load versus midspan joint opening measured at the top surface. Source: Reprinted from Densley, Megally, and Seible 2003.
0.0 0.5 1.0 1.5 2.0-400
-300
-200
-100
0
100
200
300
400
500
600
Reference load level
Deck auxiliary strands
Cast-in-place concrete deck closures
500
1000
1500
2000
2500
-1500
-1000
-500
0
Joint opening δtop, in.
Tota
l loa
d, k
ip
Tota
l loa
d, k
N
5 10 15 20 25 30 35 400 45 50
δtopδtopδtop
Joint opening δtop, mm
Spr ing 2009 | PCI Journal126
100INT-AUXT showed comparable capacity but slightly larger energy dissipation than in test unit 100INTCIP. In negative bending, however, test unit 100INTCIP showed slightly larger capacity and energy dissipation than in test unit 100INT-AUXT. The increased capacity was due to the fact that test unit 100INT-AUXT was designed to match the percentage of post-tensioning in the SFOBB skyway instead of the capacity of test unit 100INTCIP.7 The increased energy dissipation was due to yielding of the mild-steel reinforcement in the cast-in-place concrete closure joint.
Failure modes
Figure 8 shows the failure modes of all phase I test units. Test units with internally bonded tendons (units 100INT, 100INTCIP, and 50INT/50EXT) failed explo-sively. In addition, test units 100INT and 100INTCIP completely lost their load-carrying capacity upon failure. The 50INT/50EXT test unit lost a significant portion of its load-carrying capacity upon rupture of the internally bonded tendon yet retained a residual load-carrying capacity, which slightly exceeded the reference load level because the external tendons remained intact.
The test unit with 100% internally bonded tendons and lightly stressed auxiliary deck tendons (100INT-AUXT) failed due to rupture of the main tendons in the down-ward direction and rupture of the auxiliary tendons in the upward direction. This test unit did not completely lose load-carrying capacity because rupture did not occur in all strands of the tendons simultaneously.
Load-displacement response
Figure 6 shows the load-displacement envelopes for downward loading direction only for all phase I-B test units. Test unit 100INTCIP is also shown for comparison with 100INT. Table 2 reports the maximum displacements ∆u, which correspond to the load levels indicated by the solid circles shown in Fig. 6.
The load-carrying capacity of unit 100EXT was less than the capacities of all other test units because of lower stresses in the external tendons and because of the geom-etry change at the midspan section. As the midspan of the test unit deflected downward, the elevation of the external tendons remained essentially unchanged, thus the moment arm between the post-tensioning and the compression zone was reduced.
Failure of unit 50INT/50EXT occurred at a relatively low displacement compared with the other test units. The internally bonded tendon in unit 50INT/50EXT carried significantly higher forces than the external tendons car-ried (as will be shown in a following section), resulting in relatively early rupture of the internal tendon. The curves in Fig. 6 indicate that the combination of internally bonded and unbonded tendons, as currently allowed in the AASH-TO guide specifications, resulted in less desirable seismic performance of the segment joints.
Figure 7 shows the load displacement curves of phase I-A. The test units exhibited similar response in posi-tive bending, that is, downward deflections. Test unit
Figure 11. This graph shows the phase I-B measured strains in the prestressing steel at midspan. Source: Reprinted from Megally, Seible, and Dowell March–April 2003. Note: 1 in. = 25.4 mm.
Malfunctioning of
0 2 4 6 8 10 12 14 16 18 20 22 24 26 280
5,000
10,000
15,000
20,000
25,000
Number of loading cycles
Reference load level
Seismic test
Yield strain
strain gauges
Stra
in, m
icro
stra
ins
2"
Internal tendon (Unit 100INTCIP)External tendon (Unit 100EXT)Internal tendon (Unit 50INT/50EXT)External tendon (Unit 50INT/50EXT)2"
Internal tendon (Unit 100INTCIP)External tendon (Unit 100EXT)Internal tendon (Unit 50INT/50EXT)External tendon (Unit 50INT/50EXT)2"
Internal tendon (unit 100INTCIP)External tendon (unit 100EXT)Internal tendon (unit 50INT/50EXT)External tendon (unit 50INT/50EXT)
1 in. 7 in.6 in.
5 in.4 in.
3 in.2 in.
1.5 in.0.75 in.
0.5 in.0.25 in.
127PCI Journal | Spr ing 2009
Stresses and strains in prestressing tendons
Figure 11 shows the strain history of the prestressing tendons measured at the midspan joint of phase I-B and the values of midspan displacement amplitude. This figure shows test unit 100INTCIP instead of test unit 100INT because of strain-gauge failures. The response of test unit 100INT and 100INTCIP for positive bending were similar, as shown in Fig. 7. Thus, the response of the tendons should also be similar.
It is clear that the internal tendons in test unit 50INT/50EXT experienced the largest strains under a given displacement cycle, while the external tendons experienced the least. This is because unit 50INT/50EXT did not distribute cracking to adjacent segments like the in-ternal tendons of other test units did, thus all deformations were concentrated at the midspan joint. It is clear from Fig. 11 that the strain in the tendons exceeded the yield strain. Tendon yielding caused loss of prestressing force (Fig. 12). Loss of prestressing force will likely affect the ser-viceability of the bridge, which is undesirable. Stress could not be measured directly on the tendons in the test units, thus Fig. 12 was generated from three-dimensional (3-D) finite-element simulations of the test units. The results of the 3-D analyses were similar to the experimental results1 but are not discussed.
The test unit with unbonded external tendons (100EXT) failed in a ductile manner as the load-carrying capacity dropped gradually with increasing displacements beyond the peak load (Fig. 6). Test unit 100EXT exhibited the highest displacement capacity among all test units.
Segment joint opening
Opening of the segment joints occurred in the concrete cover adjacent to the epoxy layer between the bonded precast concrete segments, rather than in the epoxy layer itself.1 Figures 9 and 10 show examples of joint opening results.
In any load-displacement cycle, permanent joint opening is measured upon unloading to the reference load level. Fig-ure 9 compares the bottom surface joint openings of phase I-B and shows that unit 100EXT experienced the lowest values of permanent joint opening among all the test units. This indicates that the segment joints in superstructures with 100% external post-tensioning will likely be closed almost completely following major seismic events.
Figure 10 compares the top surface joint openings of phase I-A and indicates that decks designed with auxiliary strands can expect larger joint openings but reduced re-sidual openings. The larger openings are expected because auxiliary deck designs will open only one crack while cast-in-place designs will distribute cracks across the deck as the reinforcement yields.
Figure 12. This graph shows the stress in prestressing tendons at midspan for the phase I-B test units taken from 3-D finite-element analyses. Source: Reprinted from Megally, Seible, and Dowell March–April 2003. Note: 1 in. = 25.4 mm.
020406080
100120140160180200220240260280300
0 2 4 6 8 10 12 14 16 18 20 22 24 26 28
Internal Tendon (Unit 100INT)External Tendon (Unit 100EXT)Internal Tendon (Unit 50INT/50EXT)
0
200
400
600
800
1000
1200
1400
1600
1800
2000
(Unit 50INT/50EXT)
Seismic test
Number of loading cycles
Internally bonded tendon
Yield stress
Internal tendon (Unit 100INT)External tendon (Unit 100EXT)Internal tendon (Unit 50INT/50EXT)
Tend
on s
tress
, ksi
Tend
on s
tress
, MPa
1 in.7 in.6 in.5 in.4 in.3 in.2 in.1.5 in.0.75 in.
0.5 in.
0.25 in.
Internal Tendon (Unit 100INT)External Tendon (Unit 100EXT)Internal Tendon (Unit 50INT/50EXT)
Internal tendon (Unit 100INT)External tendon (Unit 100EXT)Internal tendon (Unit 50INT/50EXT)
Internal tendon (unit 100INT)External tendon (unit 100EXT)Internal tendon (unit 50INT/50EXT)
Spr ing 2009 | PCI Journal128
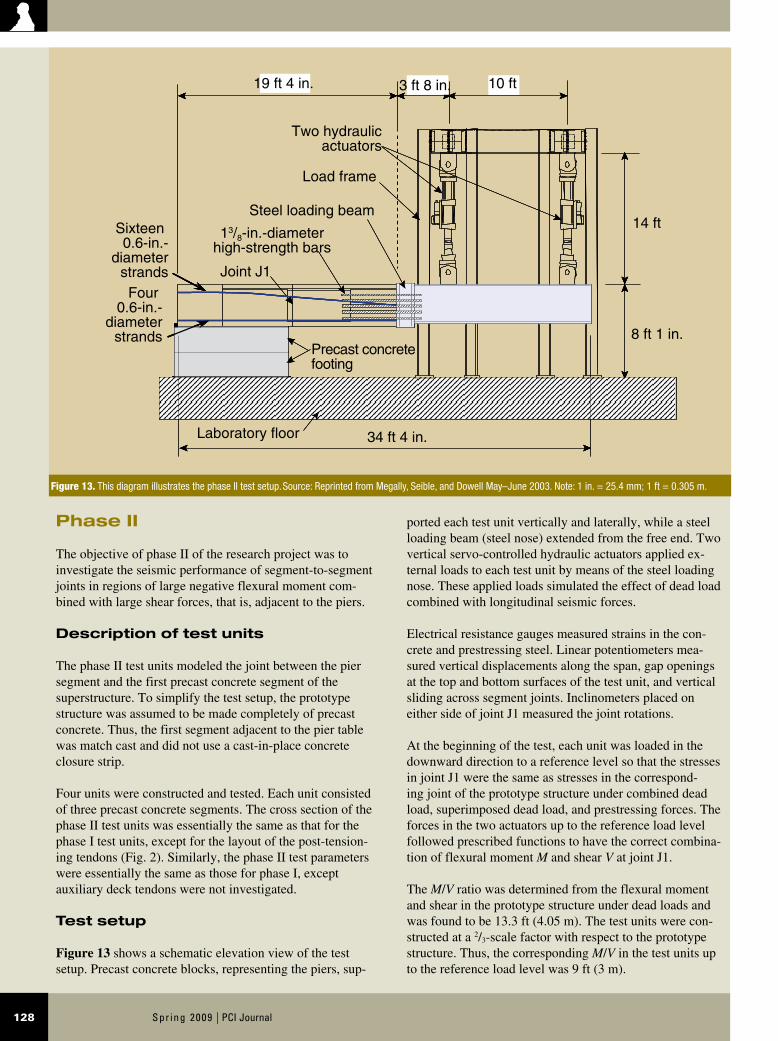
ported each test unit vertically and laterally, while a steel loading beam (steel nose) extended from the free end. Two vertical servo-controlled hydraulic actuators applied ex-ternal loads to each test unit by means of the steel loading nose. These applied loads simulated the effect of dead load combined with longitudinal seismic forces.
Electrical resistance gauges measured strains in the con-crete and prestressing steel. Linear potentiometers mea-sured vertical displacements along the span, gap openings at the top and bottom surfaces of the test unit, and vertical sliding across segment joints. Inclinometers placed on either side of joint J1 measured the joint rotations.
At the beginning of the test, each unit was loaded in the downward direction to a reference level so that the stresses in joint J1 were the same as stresses in the correspond-ing joint of the prototype structure under combined dead load, superimposed dead load, and prestressing forces. The forces in the two actuators up to the reference load level followed prescribed functions to have the correct combina-tion of flexural moment M and shear V at joint J1.
The M/V ratio was determined from the flexural moment and shear in the prototype structure under dead loads and was found to be 13.3 ft (4.05 m). The test units were con-structed at a 2/3-scale factor with respect to the prototype structure. Thus, the corresponding M/V in the test units up to the reference load level was 9 ft (3 m).
Phase II
The objective of phase II of the research project was to investigate the seismic performance of segment-to-segment joints in regions of large negative flexural moment com-bined with large shear forces, that is, adjacent to the piers.
Description of test units
The phase II test units modeled the joint between the pier segment and the first precast concrete segment of the superstructure. To simplify the test setup, the prototype structure was assumed to be made completely of precast concrete. Thus, the first segment adjacent to the pier table was match cast and did not use a cast-in-place concrete closure strip.
Four units were constructed and tested. Each unit consisted of three precast concrete segments. The cross section of the phase II test units was essentially the same as that for the phase I test units, except for the layout of the post-tension-ing tendons (Fig. 2). Similarly, the phase II test parameters were essentially the same as those for phase I, except auxiliary deck tendons were not investigated.
Test setup
Figure 13 shows a schematic elevation view of the test setup. Precast concrete blocks, representing the piers, sup-
Figure 13. This diagram illustrates the phase II test setup. Source: Reprinted from Megally, Seible, and Dowell May–June 2003. Note: 1 in. = 25.4 mm; 1 ft = 0.305 m.
3'- 8" 10'19'- 4" 3'- 8" 10'19'- 4"19’-4” 3’-8” 10’3'- 8" 10'19'- 4" 3'- 8" 10'19'- 4"
19 ft 4 in. 10 ft
14 ft
3 ft 8 in.
8 ft 1 in.
34 ft 4 in.
13/8-in.-diameterhigh-strength bars
Sixteen 0.6-in.-
diameterstrandsFour
0.6-in.-diameter
strands
Laboratory floor
Joint J1
Precast concretefooting
Two hydraulicactuators
Load frame
Steel loading beam
129PCI Journal | Spr ing 2009
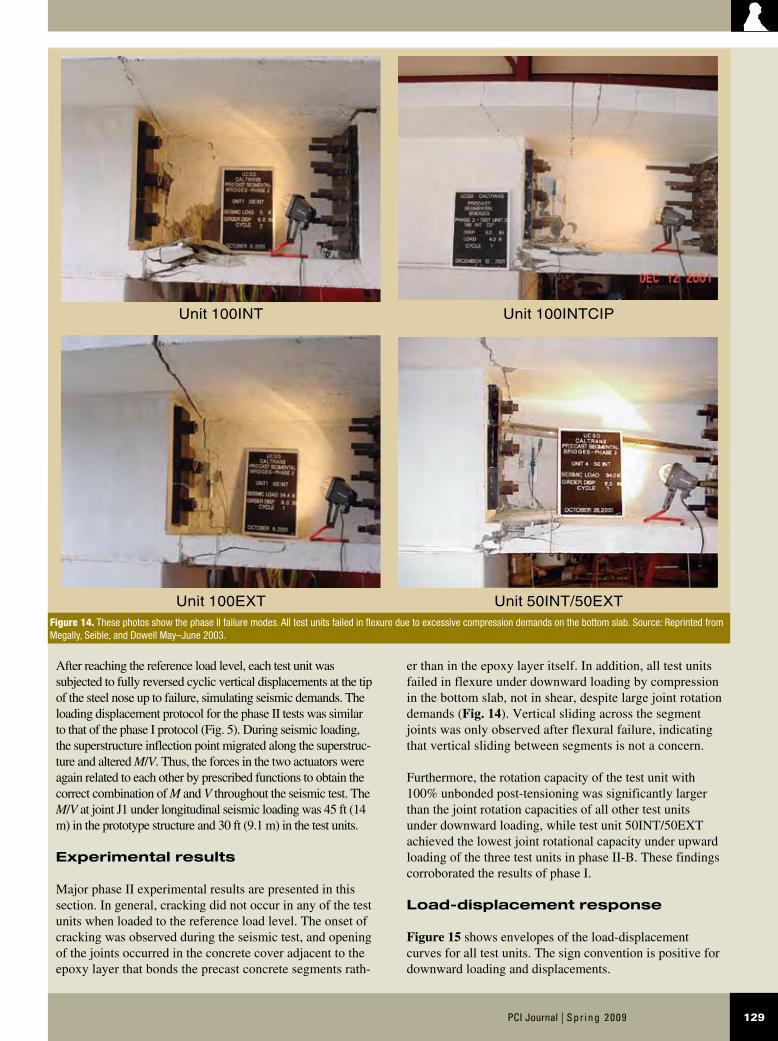
er than in the epoxy layer itself. In addition, all test units failed in flexure under downward loading by compression in the bottom slab, not in shear, despite large joint rotation demands (Fig. 14). Vertical sliding across the segment joints was only observed after flexural failure, indicating that vertical sliding between segments is not a concern.
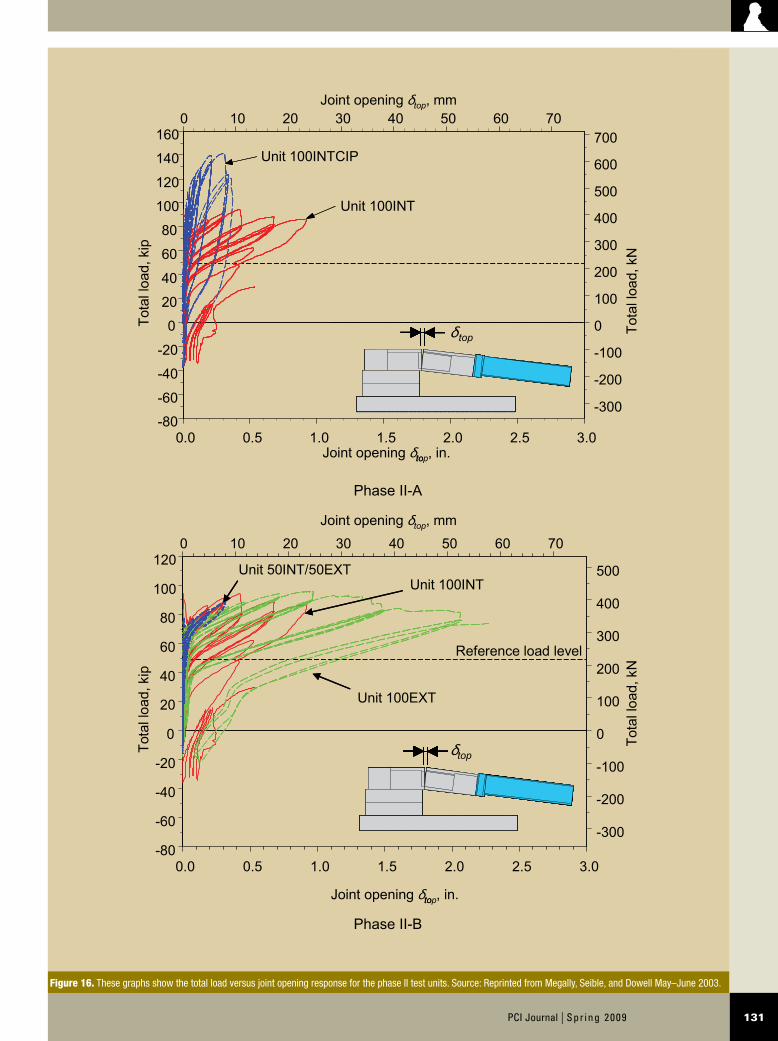
Furthermore, the rotation capacity of the test unit with 100% unbonded post-tensioning was significantly larger than the joint rotation capacities of all other test units under downward loading, while test unit 50INT/50EXT achieved the lowest joint rotational capacity under upward loading of the three test units in phase II-B. These findings corroborated the results of phase I.
Load-displacement response
Figure 15 shows envelopes of the load-displacement curves for all test units. The sign convention is positive for downward loading and displacements.
After reaching the reference load level, each test unit was subjected to fully reversed cyclic vertical displacements at the tip of the steel nose up to failure, simulating seismic demands. The loading displacement protocol for the phase II tests was similar to that of the phase I protocol (Fig. 5). During seismic loading, the superstructure inflection point migrated along the superstruc-ture and altered M/V. Thus, the forces in the two actuators were again related to each other by prescribed functions to obtain the correct combination of M and V throughout the seismic test. The M/V at joint J1 under longitudinal seismic loading was 45 ft (14 m) in the prototype structure and 30 ft (9.1 m) in the test units.
Experimental results
Major phase II experimental results are presented in this section. In general, cracking did not occur in any of the test units when loaded to the reference load level. The onset of cracking was observed during the seismic test, and opening of the joints occurred in the concrete cover adjacent to the epoxy layer that bonds the precast concrete segments rath-
Figure 14. These photos show the phase II failure modes. All test units failed in flexure due to excessive compression demands on the bottom slab. Source: Reprinted from Megally, Seible, and Dowell May–June 2003.
Unit 100INT
Unit 100EXT
Unit 100INTCIP
Unit 50INT/50EXT

Spr ing 2009 | PCI Journal130
than unit 100INT.
Figure 15 shows that the load-carrying capacities of the phase II-B test units were close to each other. However, unit 100EXT, with 100% unbonded post-tensioning, could undergo significantly higher downward displacement than
The reinforced cast-in-place concrete closure joint in unit 100INTCIP increased the downward load-carrying capacity (Fig. 15). Compression failure of unit 100INTCIP occurred under downward loading at a similar displace-ment to unit 100INT. However, under upward loading, unit 100INTCIP failed at a significantly higher displacement
Figure 15. This graph shows the phase II total load versus vertical displacement envelopes. Source: Reprinted from Megally, Seible, and Dowell May–June 2003.
P2
∆
P1
-16 -14 -12 -10 -8 -6 -4 -2 0 2 4 6 8 10 12 14-80
-60
-40
-20
0
20
40
60
80
100
120
140
160-400 -350 -300 -250 -200 -150 -100 -50 0 50 100 150 200 250 300 350
-300
-200
-100
0
100
200
300
400
500
600
700
Vertical displacement ∆ , mm
Tota
l loa
d, k
ip
Unit 100INT
Reference load level
Unit 100INTCIP
Unit 100EXT
Unit 50INT/50EXT
Vertical displacement ∆ , in.
-300
-200
-100
0
100
200
300
Unit 100INTCIP
Unit 100EXT
Tota
l loa
d, k
NTable 3. Summary of phase II experimental results
Test unit Pu ,* kip ∆u ,* in. ∆r ,† in. ∆r /∆Ref ,† % /Ref
MTest ,* kip-ft
MCalc ,* kip-ft
MTest/MCalc
100INT 94.2 6.0 1.53 9.00 4.84 2.47 2082 2189 0.95
100INTCIP 141.3 6.4 1.99 11.71 5.79 2.95 3504 3543 0.99
100EXT 95.6 12.9 0.17 1.00 1.96 1.00 2124 2089 1.02
50INT/50EXT 96.0 7.2 0.39 2.29 3.70 1.89 2136 2156 0.99
Source: Megally, Seible, and Dowell May–June 2003.
* Values for downward loading direction.† ∆r and were determined for the 4.5 in. displacement cycle.
Note: MCalc = nominal flexural moment capacity calculated in acordance with the American Association of State Highway and Transportation Officials’ Guide Specifications for Design and Construction of Segmental Concrete Bridges and Standard Specifications for Highway Bridges.; MTest = peak ex-perimental flexural moment at the critical joint; Pu = peak load; ∆r = residual vertical displacement after unloading the seismic forces; ∆Ref = values of ∆r for unit 100EXT; ∆u = maximum displacement measured near the tip of the steel loading nose, corresponds to the load levels indicated by the solid circles shown in Fig. 15; = measured equivalent viscous damping coefficient as a ratio of critical damping; Ref = values of for unit 100EXT. 1 in. = 25.4 mm; 1 ft = 0.305 m; 1 kip = 4.448 kN.
131PCI Journal | Spr ing 2009
Figure 16. These graphs show the total load versus joint opening response for the phase II test units. Source: Reprinted from Megally, Seible, and Dowell May–June 2003.
0.0 0.5 1.0 1.5 2.0 2.5 3.0-80
-60
-40
-20
0
20
40
60
80
100
120
140
160To
tal l
oad,
kip
0 10 20 30 40 50 60 70
-300
-200
-100
0
100
200
300
400
500
600
700
Joint opening δtop, mm
Joint opening δtop, mm
Unit 100INTCIP
Tota
l loa
d, k
N
Unit 100INT
δtop
Joint opening δtop, in.to
Phase II-A
0.0 0.5 1.0 1.5 2.0 2.5 3.0-80
-60
-40
-20
0
20
40
60
80
100
120
Tota
l loa
d, k
ip
0 10 20 30 40 50 60 70
-300
-200
-100
0
100
200
300
400
500
Unit 100EXT
Unit 100INT
Reference load levelTo
tal l
oad,
kN
Unit 50INT/50EXT
δtop
Phase II-B
Joint opening δto , in.top
Spr ing 2009 | PCI Journal132
results confirm the findings of the phase I experiments, that the highest ductility and displacement capacity can be achieved by the use of 100% unbonded post-tensioning.
Table 3 summarizes the experimental peak total loads and dis-placements of all test units in the downward loading direction.
all other test units with internally bonded tendons. Rather than the explosive compression failure of the bottom slab observed in all other test units, the load-carrying capacity of unit 100EXT dropped gradually with increased applied displacements in the post-peak range.
Figure 15 also shows that under upward loading, unit 50INT/50EXT failed at a relatively small displacement compared with the other test units of phase II-B. The
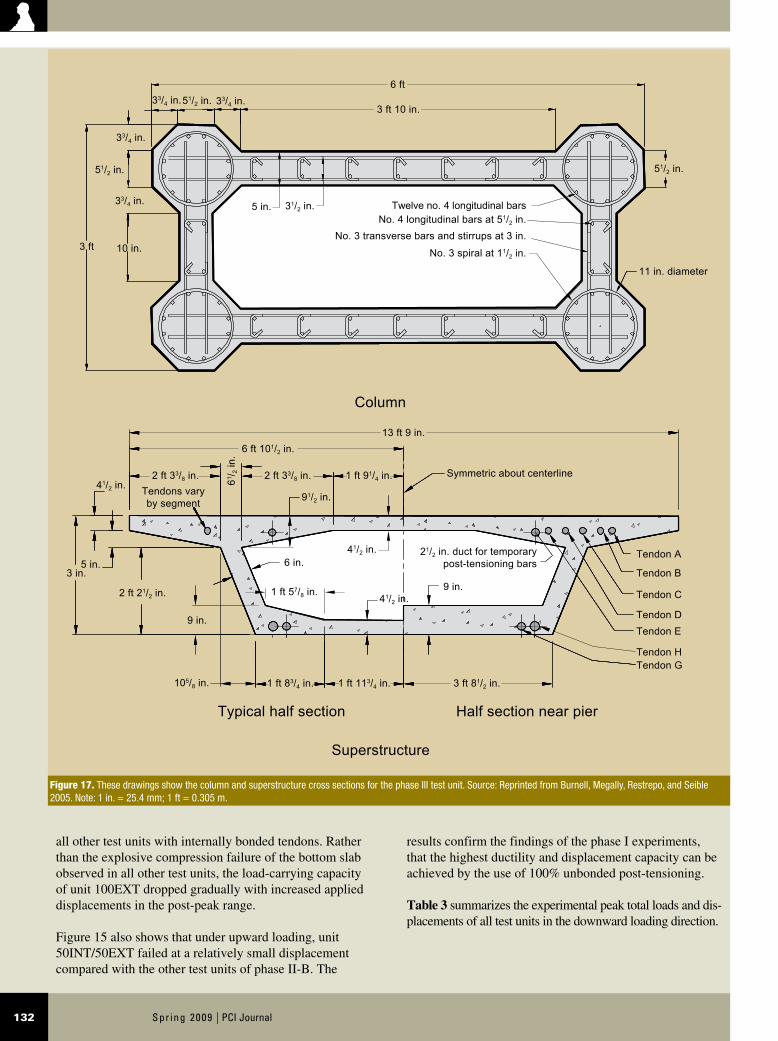
Figure 17. These drawings show the column and superstructure cross sections for the phase III test unit. Source: Reprinted from Burnell, Megally, Restrepo, and Seible 2005. Note: 1 in. = 25.4 mm; 1 ft = 0.305 m.
5"
#3 spiral at 1 1/2"
12-#4 long. bars#4 long. bars at 5 1/2"
#3 trans. bars and stirrups at 3"
312"5"
No. 3 spiral at 1 1/2"
Twelve No. 4 longitudinal barsNo. 4 longitudinal bars at 5 1/2"
No. 3 transverse bars and stirrups at 3"
312"5"
#3 spiral at 1 1/2"
12-#4 long. bars#4 long. bars at 5 1/2"
#3 trans. bars and stirrups at 3"
312"
412" 2-1/2" duct for temporary
post-tensioning bars
Twelve no. 4 longitudinal barsNo. 4 longitudinal bars at 51/2 in.
No. 3 transverse bars and stirrups at 3 in.
No. 3 spiral at 11/2 in.
21/2 in. duct for temporarypost-tensioning bars
Symmetric about centerline
Tendon A
Tendon B
Tendon C
Tendon DTendon E
Tendon HTendon G
Tendons varyby segment
Superstructure
Typical half section Half section near pier
Column
33/4 in.51/2 in. 33/4 in.6 ft
3 ft 10 in.
13 ft 9 in.6 ft 101/2 in.
1 ft 57/8 in.
2 ft 33/8 in. 2 ft 33/8 in.
1 ft 83/4 in. 1 ft 113/4 in. 3 ft 81/2 in.
1 ft 91/4 in.
33/4 in.
51/2 in.
33/4 in.
10 in.3 ft
5 in.
11 in. diameter
31/2 in.
41/2 in.
105/8 in.
61 / 2 in
.
91/2 in.
41/2 in.
41/2 in.9 in.
9 in.
6 in.3 in.
5 in.
2 ft 21/2 in.
51/2 in.
133PCI Journal | Spr ing 2009
Strains and stresses in prestressing tendons
The results with regard to strains and stresses in the post-tensioning tendons of the phase II test units were similar to those of the phase I test units and are not presented due to space considerations. In general, the results indicated that the tendons of test unit 100EXT experienced the lowest strains, while the internal tendons of the 50INT/50EXT test unit experienced the highest strains. The increased strains on the internal tendons of the 50INT/50EXT test unit caused the tendons to yield and lose their prestressing force earlier than all other tendons.
Phase III
The primary objective of phase III of the research program was to investigate the performance of a precast concrete segmental superstructure-column system under combined gravity and seismic loads. The secondary objective was to study the performance of the superstructure-column system when inelastic response was allowed in the super-structure.
Description of test unit
The phase III test unit modeled the prototype superstruc-ture between midspan of adjacent spans and the column down to the midheight inflection point (Fig. 1). The test
Segment joint opening
Figure 16 shows top-surface joint openings versus total vertical loads for all phase II test units. The joint opening measured at the reference load level following unload-ing for any displacement cycle represents permanent joint opening.
Figure 16 shows the joint opening results from phase II-A and indicates that the deck mild-steel reinforcement cross-ing joint J1 controlled the joint opening in unit 100INTCIP when compared with the joint opening in unit 100INT. Figure 16 also indicates that a permanent opening of joint J1 in unit 100INT was slightly less than the maximum joint opening in unit 100INTCIP during corresponding loading cycles. This was due to substantial plastic deformations of the mild-steel reinforcement in the cast-in-place concrete closure joint of unit 100INTCIP. In other words, the pres-ence of cast-in-place concrete at segment-to-segment joints near the columns resulted in relatively large permanent openings of joints.
Figure 16 also shows the joint opening results from phase II-B and indicates that higher joint openings can be reached without failure by use of 100% unbonded post-tensioning, compared with test units that have internally bonded ten-dons. Figure 16 and Table 3 also indicate that unit 100EXT experienced the smallest permanent joint openings among all test units for a given displacement cycle.
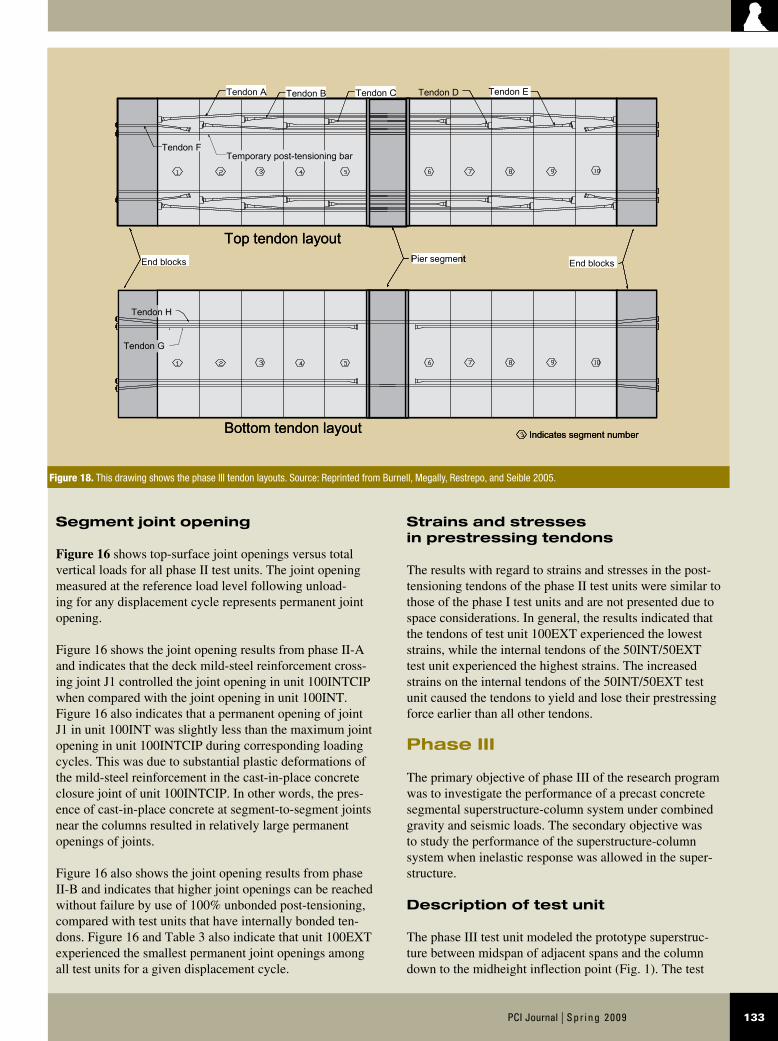
Figure 18. This drawing shows the phase III tendon layouts. Source: Reprinted from Burnell, Megally, Restrepo, and Seible 2005.
Tendon A Tendon B Tendon C
Tendon F
Tendon H
Temp. PT Bar
Top tendon layoutEnd Blocks
Tendon A Tendon B Tendon C Tendon D
Tendon F
Tendon G
Tendon H
Temporary post-tensioning bar
End blocks End blocks
Indicates segment number
Pier segment
Bottom tendon layout
Tendon A Tendon B Tendon C
Tendon F
Tendon H
Temp. PT Bar
Top tendon layoutEnd Blocks
Tendon A Tendon B Tendon C Tendon E
Tendon F
Tendon G
Tendon H
Temporary post-tensioning bar
End blocks End blocks
Indicates segment number
Pier segment
Bottom tendon layout
Spr ing 2009 | PCI Journal134
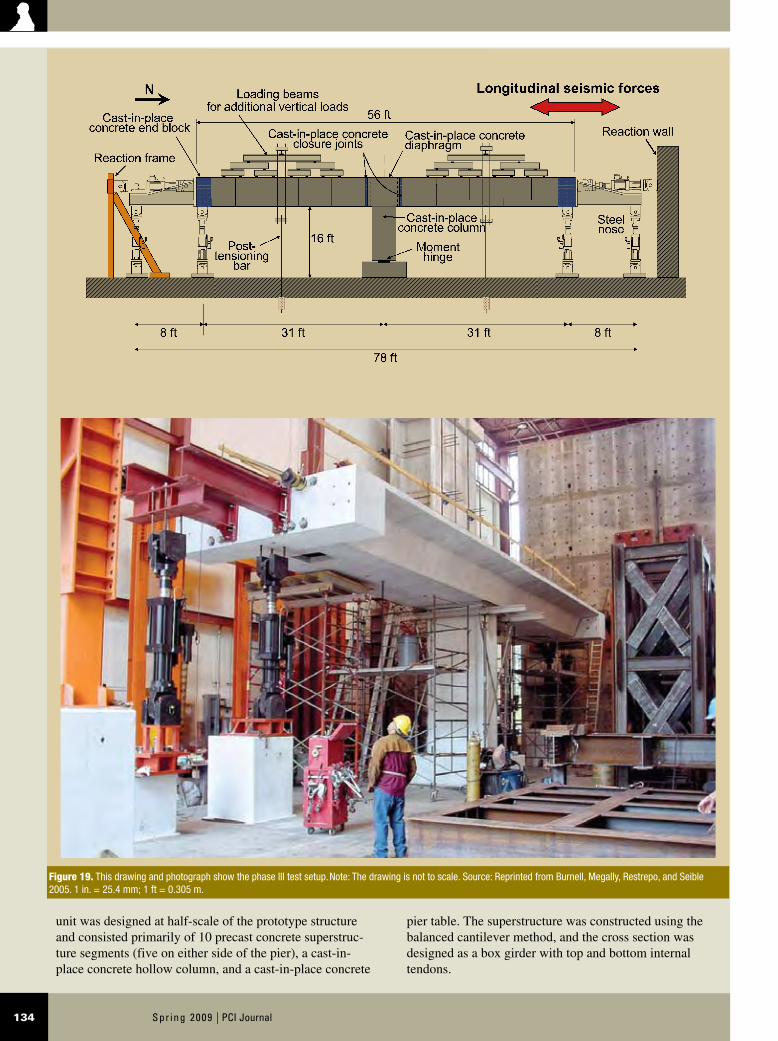
pier table. The superstructure was constructed using the balanced cantilever method, and the cross section was designed as a box girder with top and bottom internal tendons.
unit was designed at half-scale of the prototype structure and consisted primarily of 10 precast concrete superstruc-ture segments (five on either side of the pier), a cast-in-place concrete hollow column, and a cast-in-place concrete
Figure 19. This drawing and photograph show the phase III test setup. Note: The drawing is not to scale. Source: Reprinted from Burnell, Megally, Restrepo, and Seible 2005. 1 in. = 25.4 mm; 1 ft = 0.305 m.
Longitudinal seismic forces N
78 ft
8 ft 31 ft
56 ft
16 ft
Reaction frame
Post-tensioning
barMoment
hinge
Cast-in-placeconcrete column
Loading beamsfor additional vertical loads
Cast-in-place concreteclosure joints
Cast-in-place concrete end block Cast-in-place concrete
diaphragmReaction wall
Steelnose
31 ft 8 ft
135PCI Journal | Spr ing 2009
wiffle tree, evenly distributed a single point load on each span into 64 point loads across the deck, thus simulating a distributed load.
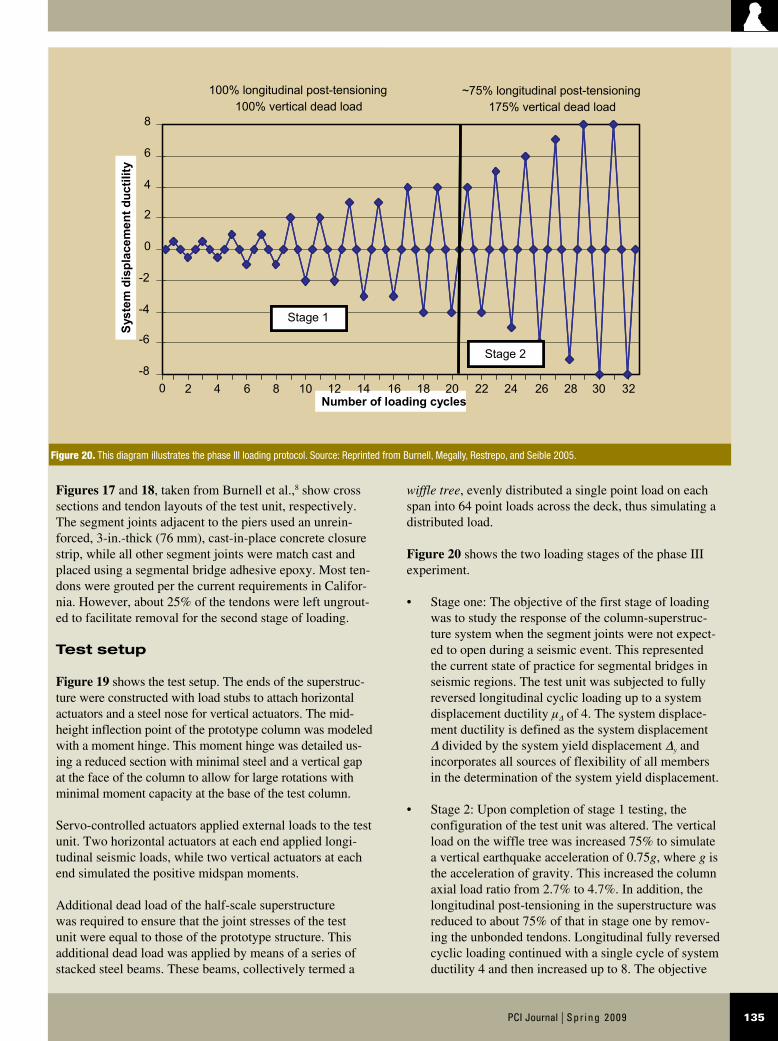
Figure 20 shows the two loading stages of the phase III experiment.
Stage one: The objective of the first stage of loading •was to study the response of the column-superstruc-ture system when the segment joints were not expect-ed to open during a seismic event. This represented the current state of practice for segmental bridges in seismic regions. The test unit was subjected to fully reversed longitudinal cyclic loading up to a system displacement ductility μ∆ of 4. The system displace-ment ductility is defined as the system displacement ∆ divided by the system yield displacement ∆y and incorporates all sources of flexibility of all members in the determination of the system yield displacement.
Stage 2: Upon completion of stage 1 testing, the •configuration of the test unit was altered. The vertical load on the wiffle tree was increased 75% to simulate a vertical earthquake acceleration of 0.75g, where g is the acceleration of gravity. This increased the column axial load ratio from 2.7% to 4.7%. In addition, the longitudinal post-tensioning in the superstructure was reduced to about 75% of that in stage one by remov-ing the unbonded tendons. Longitudinal fully reversed cyclic loading continued with a single cycle of system ductility 4 and then increased up to 8. The objective
Figures 17 and 18, taken from Burnell et al.,8 show cross sections and tendon layouts of the test unit, respectively. The segment joints adjacent to the piers used an unrein-forced, 3-in.-thick (76 mm), cast-in-place concrete closure strip, while all other segment joints were match cast and placed using a segmental bridge adhesive epoxy. Most ten-dons were grouted per the current requirements in Califor-nia. However, about 25% of the tendons were left ungrout-ed to facilitate removal for the second stage of loading.
Test setup
Figure 19 shows the test setup. The ends of the superstruc-ture were constructed with load stubs to attach horizontal actuators and a steel nose for vertical actuators. The mid-height inflection point of the prototype column was modeled with a moment hinge. This moment hinge was detailed us-ing a reduced section with minimal steel and a vertical gap at the face of the column to allow for large rotations with minimal moment capacity at the base of the test column.
Servo-controlled actuators applied external loads to the test unit. Two horizontal actuators at each end applied longi-tudinal seismic loads, while two vertical actuators at each end simulated the positive midspan moments.
Additional dead load of the half-scale superstructure was required to ensure that the joint stresses of the test unit were equal to those of the prototype structure. This additional dead load was applied by means of a series of stacked steel beams. These beams, collectively termed a
Figure 20. This diagram illustrates the phase III loading protocol. Source: Reprinted from Burnell, Megally, Restrepo, and Seible 2005.
Syst
em d
ispl
acem
ent d
uctil
ity
-8
-6
-4
-2
0
2
4
6
8
Stage 1
Stage 2
100% longitudinal post-tensioning100% vertical dead load
~75% longitudinal post-tensioning175% vertical dead load
Number of loading cycle0
Syst
em d
ispl
acem
ent d
uctil
ity
Stage 1
Stage 2
Number of loading cycles 2 4 6 8 10 12 14 16 18 20 22 24 26 28 30 32
Spr ing 2009 | PCI Journal136
No damage to the superstructure was observed during testing. However, upon reviewing the data, it was apparent that a hairline crack opened at the closure joint adjacent to the pier at ductility 4. This hairline crack was determined to be the reopening and propagation of a shrinkage crack and closed completely upon unloading of the test unit.
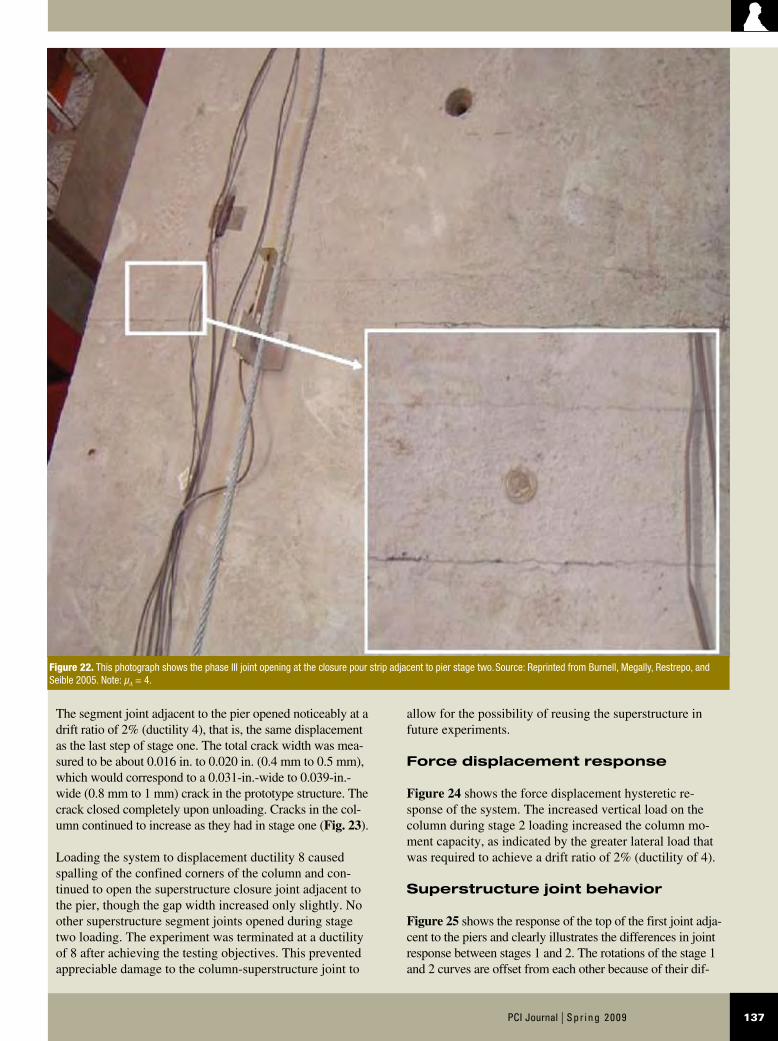
Stage two observations In general, the superstruc-ture segment joints adjacent to the pier opened due to the increased vertical load and the reduced longitudinal post-tensioning in the superstructure (Fig. 22). As the longitu-dinal displacements increased from a drift ratio of 2% to 4% (ductility 4 to ductility 8), the gap in the segment joints increased only modestly, implying that the increased lat-eral displacement increased the rotational demands on the plastic hinge at the top of the piers and did not significantly increase the demands in the superstructure.
of stage two was to investigate the performance of a column-superstructure system where nonlinear elastic behavior of the superstructure was expected.
Experimental results
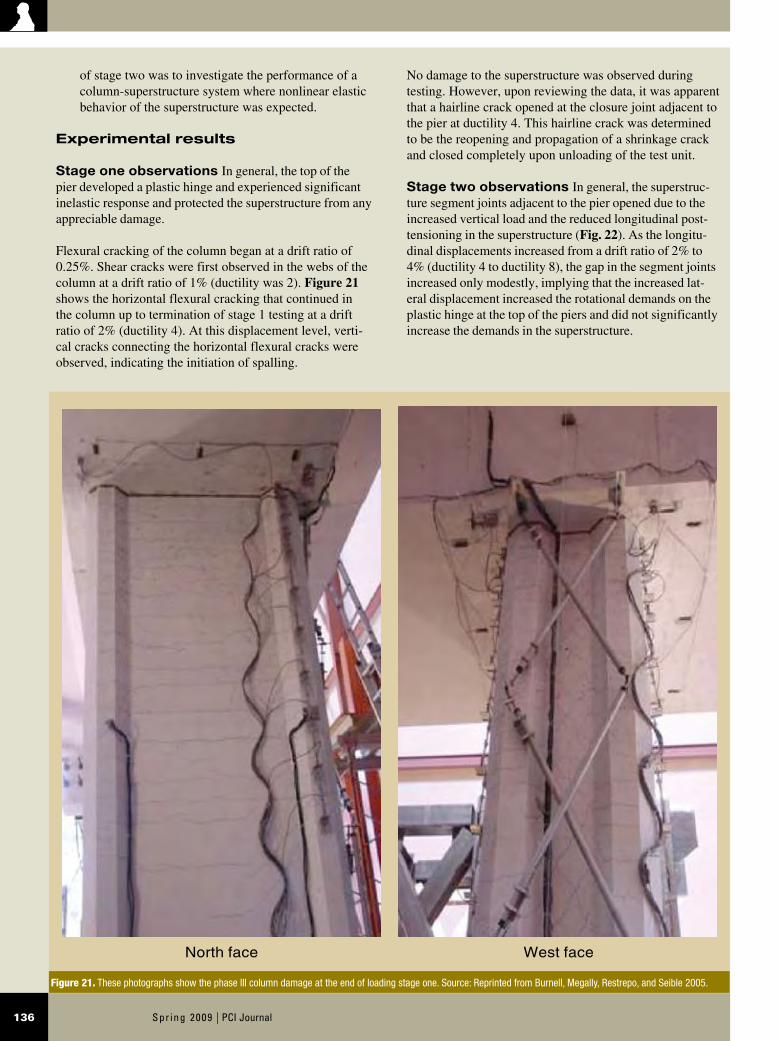
Stage one observations In general, the top of the pier developed a plastic hinge and experienced significant inelastic response and protected the superstructure from any appreciable damage.
Flexural cracking of the column began at a drift ratio of 0.25%. Shear cracks were first observed in the webs of the column at a drift ratio of 1% (ductility was 2). Figure 21 shows the horizontal flexural cracking that continued in the column up to termination of stage 1 testing at a drift ratio of 2% (ductility 4). At this displacement level, verti-cal cracks connecting the horizontal flexural cracks were observed, indicating the initiation of spalling.
Figure 21. These photographs show the phase III column damage at the end of loading stage one. Source: Reprinted from Burnell, Megally, Restrepo, and Seible 2005.
North face West face
137PCI Journal | Spr ing 2009
allow for the possibility of reusing the superstructure in future experiments.
Force displacement response
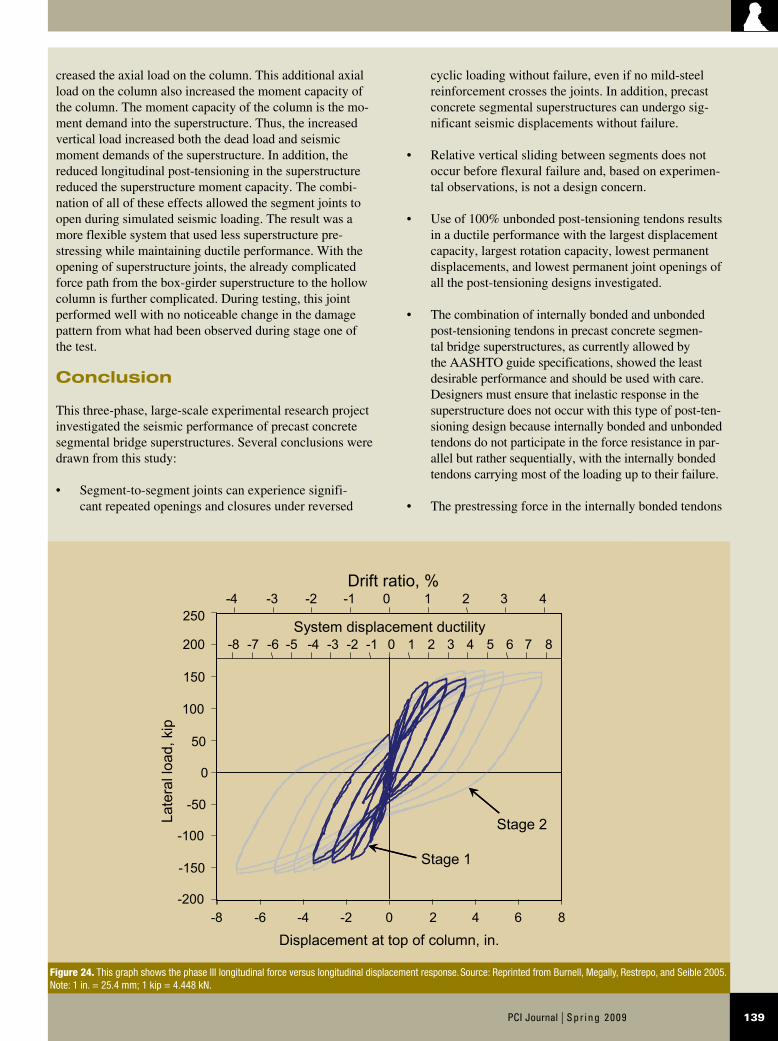
Figure 24 shows the force displacement hysteretic re-sponse of the system. The increased vertical load on the column during stage 2 loading increased the column mo-ment capacity, as indicated by the greater lateral load that was required to achieve a drift ratio of 2% (ductility of 4).
Superstructure joint behavior
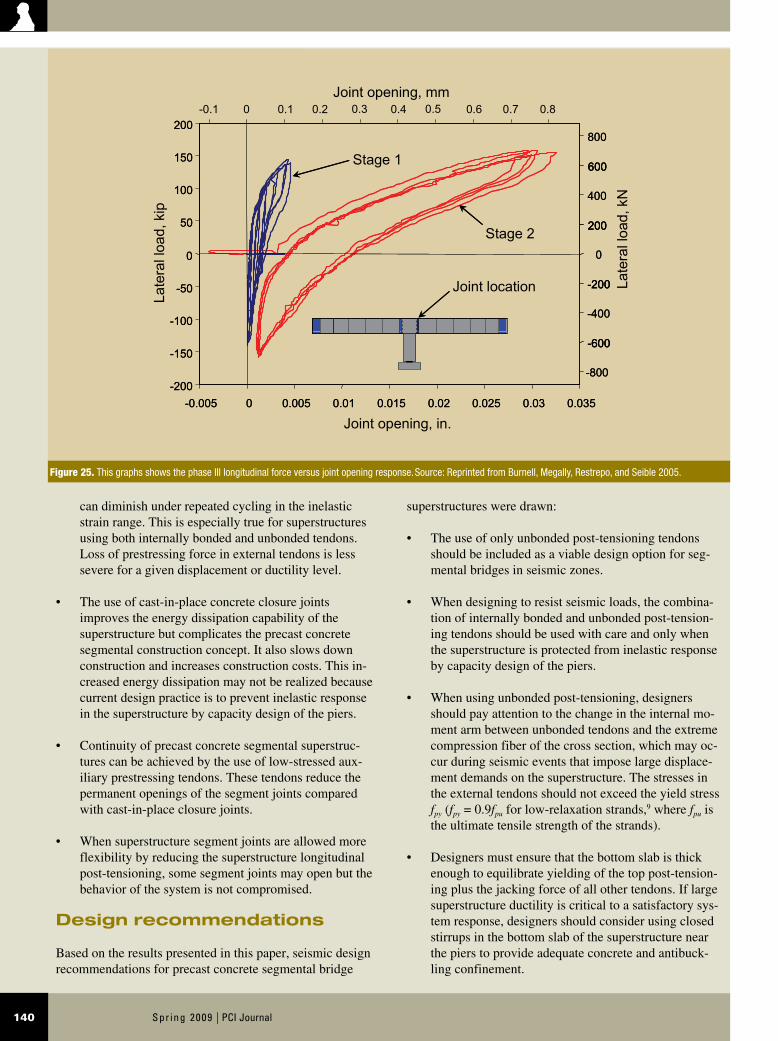
Figure 25 shows the response of the top of the first joint adja-cent to the piers and clearly illustrates the differences in joint response between stages 1 and 2. The rotations of the stage 1 and 2 curves are offset from each other because of their dif-
The segment joint adjacent to the pier opened noticeably at a drift ratio of 2% (ductility 4), that is, the same displacement as the last step of stage one. The total crack width was mea-sured to be about 0.016 in. to 0.020 in. (0.4 mm to 0.5 mm), which would correspond to a 0.031-in.-wide to 0.039-in.-wide (0.8 mm to 1 mm) crack in the prototype structure. The crack closed completely upon unloading. Cracks in the col-umn continued to increase as they had in stage one (Fig. 23).
Loading the system to displacement ductility 8 caused spalling of the confined corners of the column and con-tinued to open the superstructure closure joint adjacent to the pier, though the gap width increased only slightly. No other superstructure segment joints opened during stage two loading. The experiment was terminated at a ductility of 8 after achieving the testing objectives. This prevented appreciable damage to the column-superstructure joint to
Figure 22. This photograph shows the phase III joint opening at the closure pour strip adjacent to pier stage two. Source: Reprinted from Burnell, Megally, Restrepo, and Seible 2005. Note: μ∆ = 4.
Spr ing 2009 | PCI Journal138
It is clear from Fig. 25 that the revised boundary condi-tions of stage 2 (that is, reduced post-tensioning and increased vertical load) significantly reduced the joint stiff-ness. Energy dissipation in both stages was likely caused by friction between the rough surfaces that were opening and closing against each other or by friction between the tendon and the grout surrounding the tendon along the unbonded length after debonding of the tendons.
Column-superstructure interaction
During stage one loading, all of the inelastic deforma-tion occurred in the substructure, while the superstructure remained elastic. Plastic hinging of the piers protected the superstructure from damage, meeting the objectives of cur-rent design procedures.
The opening of the superstructure joints observed during the second stage of loading indicated that the column- superstructure system no longer limited inelastic deforma-tion to the columns. The increased vertical load increased the moment demands on the superstructure joints and in-
ferent superstructure boundary conditions (that is, longitudinal superstructure post-tensioning and vertical dead load).
As noted previously, no superstructure cracks or segment joint openings were noticed during stage 1 testing. How-ever, upon examination of the data, it was apparent that propagation of a small shrinkage crack occurred at the top of the joint nearest the column. The stage 1 curve in Fig. 25 illustrates this crack propagation. The peak residual gap width is indicated by the deformation at the intersection of the horizontal axis with the unloading portions of the stage 1 curve and was 0.002 in. (0.05 mm) at a ductility of 4 (2% drift ratio). This corresponds to a 0.004-in.-wide (0.1 mm) peak residual gap in the prototype structure.
Clear opening of the top of the joint nearest the column was observed during stage 2 testing (Fig. 25). The first cycle of stage 2 loading involved greater loads than the cycles that followed, indicating that the crack was propa-gating down the section. The peak residual gap opening was about 0.012 in. (0.30 mm) and remained essentially unchanged from a ductility of 4 to 8.
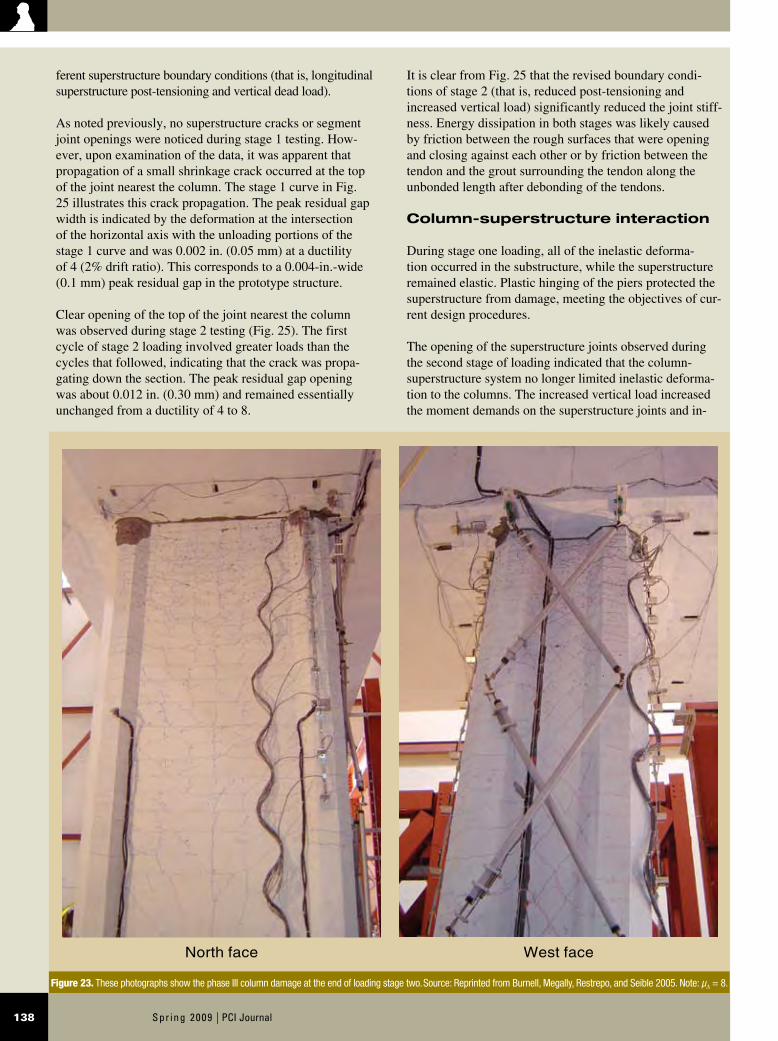
Figure 23. These photographs show the phase III column damage at the end of loading stage two. Source: Reprinted from Burnell, Megally, Restrepo, and Seible 2005. Note: μ∆ = 8.
North face West face
139PCI Journal | Spr ing 2009
cyclic loading without failure, even if no mild-steel reinforcement crosses the joints. In addition, precast concrete segmental superstructures can undergo sig-nificant seismic displacements without failure.
Relative vertical sliding between segments does not •occur before flexural failure and, based on experimen-tal observations, is not a design concern.
Use of 100% unbonded post-tensioning tendons results •in a ductile performance with the largest displacement capacity, largest rotation capacity, lowest permanent displacements, and lowest permanent joint openings of all the post-tensioning designs investigated.
The combination of internally bonded and unbonded •post-tensioning tendons in precast concrete segmen-tal bridge superstructures, as currently allowed by the AASHTO guide specifications, showed the least desirable performance and should be used with care. Designers must ensure that inelastic response in the superstructure does not occur with this type of post-ten-sioning design because internally bonded and unbonded tendons do not participate in the force resistance in par-allel but rather sequentially, with the internally bonded tendons carrying most of the loading up to their failure.
The prestressing force in the internally bonded tendons •
creased the axial load on the column. This additional axial load on the column also increased the moment capacity of the column. The moment capacity of the column is the mo-ment demand into the superstructure. Thus, the increased vertical load increased both the dead load and seismic moment demands of the superstructure. In addition, the reduced longitudinal post-tensioning in the superstructure reduced the superstructure moment capacity. The combi-nation of all of these effects allowed the segment joints to open during simulated seismic loading. The result was a more flexible system that used less superstructure pre-stressing while maintaining ductile performance. With the opening of superstructure joints, the already complicated force path from the box-girder superstructure to the hollow column is further complicated. During testing, this joint performed well with no noticeable change in the damage pattern from what had been observed during stage one of the test.
Conclusion
This three-phase, large-scale experimental research project investigated the seismic performance of precast concrete segmental bridge superstructures. Several conclusions were drawn from this study:
Segment-to-segment joints can experience signifi-•cant repeated openings and closures under reversed
Figure 24. This graph shows the phase III longitudinal force versus longitudinal displacement response. Source: Reprinted from Burnell, Megally, Restrepo, and Seible 2005. Note: 1 in. = 25.4 mm; 1 kip = 4.448 kN.
Displacement at top of column, in.
Drift ratio, %
Late
ral l
oad,
kip
-200
-100
-150
-50
50
100
150
200
250
-8
-4
-8 -7 -6 -5 -4 -3 -2 -1 0 1 2 3 4 5 6 7 8
-3 -2 -1 0 1 2 3 4
-6 -4 -2 0 2 4 6 8
0
System displacement ductility
Stage 2
Stage 1
Spr ing 2009 | PCI Journal140
superstructures were drawn:
The use of only unbonded post-tensioning tendons •should be included as a viable design option for seg-mental bridges in seismic zones.
When designing to resist seismic loads, the combina-•tion of internally bonded and unbonded post-tension-ing tendons should be used with care and only when the superstructure is protected from inelastic response by capacity design of the piers.
When using unbonded post-tensioning, designers •should pay attention to the change in the internal mo-ment arm between unbonded tendons and the extreme compression fiber of the cross section, which may oc-cur during seismic events that impose large displace-ment demands on the superstructure. The stresses in the external tendons should not exceed the yield stress fpy (fpy = 0.9fpu for low-relaxation strands,9 where fpu is the ultimate tensile strength of the strands).
Designers must ensure that the bottom slab is thick •enough to equilibrate yielding of the top post-tension-ing plus the jacking force of all other tendons. If large superstructure ductility is critical to a satisfactory sys-tem response, designers should consider using closed stirrups in the bottom slab of the superstructure near the piers to provide adequate concrete and antibuck-ling confinement.
can diminish under repeated cycling in the inelastic strain range. This is especially true for superstructures using both internally bonded and unbonded tendons. Loss of prestressing force in external tendons is less severe for a given displacement or ductility level.
The use of cast-in-place concrete closure joints •improves the energy dissipation capability of the superstructure but complicates the precast concrete segmental construction concept. It also slows down construction and increases construction costs. This in-creased energy dissipation may not be realized because current design practice is to prevent inelastic response in the superstructure by capacity design of the piers.
Continuity of precast concrete segmental superstruc-•tures can be achieved by the use of low-stressed aux-iliary prestressing tendons. These tendons reduce the permanent openings of the segment joints compared with cast-in-place closure joints.
When superstructure segment joints are allowed more •flexibility by reducing the superstructure longitudinal post-tensioning, some segment joints may open but the behavior of the system is not compromised.
Design recommendations
Based on the results presented in this paper, seismic design recommendations for precast concrete segmental bridge
Figure 25. This graphs shows the phase III longitudinal force versus joint opening response. Source: Reprinted from Burnell, Megally, Restrepo, and Seible 2005.
-200
-150
-100
-50
0
50
100
150
200
-0.005 0 0.005 0.01 0.015 0.02 0.025 0.03 0.035
-0.1 0 0.1 0.2 0.3 0.4 0.5 0.6 0.7 0.8
Stage 2
Stage 1
Joint opening, in.
Joint opening, mm
Late
ral l
oad,
kN
Late
ral l
oad,
kip
-600
-200
200
600
-400
0
400
800
-800
Joint location
-200
-150
-100
-50
0
50
100
150
200
-0.005 0 0.005 0.01 0.015 0.02 0.025 0.03 0.035
-600
-200
200
600
-400
0
400
800
-800
-600
-200
200
600
141PCI Journal | Spr ing 2009
7. Densley, D., S. H. Megally, and F. Seible. 2003. Seis-mic Performance of Precast Segmental Bridge Super-structures with Lightly Stressed Continuity Tendons. Structural systems research report SSRP-2003/10, Department of Structural Engineering, University of California at San Diego, La Jolla, CA.
8. Burnell, K. P., S. H. Megally, J. I. Restrepo, and F. Seible. 2005. Seismic Testing of Precast Segmental Bridges, Phase III: Bridge Systems Test. Structural systems research report SSRP-2005/01, Department of Structural Engineering, University of California at San Diego, La Jolla, CA.
9. AASHTO. 2007. LRFD Bridge Design Specifica-tions. 4th ed. Washington, DC: AASHTO.
Notation
fpu = ultimate tensile stress of post-tensioning strands
fpy = yield stress in post-tensioning strands
g = acceleration of gravity
M = flexural moment
MCalc = nominal flexural moment capacity
MTest = peak experimental flexural moment
Pi = applied load in actuator i
Pu = peak applied load
V = shear
∆ = displacement
∆r = residual displacement
∆u = maximum displacement
∆y = yield displacement
δbot = joint opening measured at the bottom superstruc-ture surface
δtop = joint opening measured at the top superstructure surface
μD = system displacement ductility
= measured equivalent viscous damping coefficient as a ratio of critical damping
Acknowledgment
The authors acknowledge Caltrans for funding this research under contracts no. 59A0051 and no. 59A0337. They also acknowledge members of the AASHTO, PCI, and ASBI for their comments in the development of the ex-perimental program. Sika Corporation donated the epoxy. Schwager Davis (SDI) donated the post-tensioning strands for test unit 100INT-AUXT in phase I. Dywidag-Systems International, USA, donated the post-tensioning strands for all other test units. Kie-Con Precasters constructed the precast segments of the phase III experiment.
The authors acknowledge Manu Garg and Jeff Densley for their hard work, dedication, and contributions to the segmental bridge research project. They also gratefully acknowledge the staff at the Charles Lee Powell Structural Systems laboratory for their hard work and dedication. Particular thanks go to L. Berman, C. Latham, A. Sherman, C. Sterns, F. Ho, B. Parks, J. Ward, M. Dyson, S. Sherritt, P. Nelson, and the invaluable undergraduate staff.
The authors express their appreciation to the PCI Journal reviewers for their valuable and constructive comments.
References
1. Megally, S., F. Seible, and R. K. Dowell. 2003. Seismic Performance of Precast Segmental Bridges: Segment-to-Segment Joints Subjected to High Flex-ural Moments and Low Shears. PCI Journal, V. 48, No. 2 (March–April): pp. 81–96.
2. Megally, S., F. Seible, and R. K. Dowell. 2003. Seismic Performance of Precast Segmental Bridges: Segment-to-Segment Joints Subjected to High Flex-ural Moments and High Shears. PCI Journal, V. 48, No. 3 (May–June): pp. 72–90.
3. Megally, S., F. Seible, M. Garg, and R. K. Dowell. 2002. Seismic Performance of Precast Segmen-tal Bridge Superstructures with Internally Bonded Prestressing Tendons. PCI Journal, V. 47, No. 2 (March–April): pp. 40–56.
4. American Standard for Testing and Materials (ASTM) A416. 2006. Standard Specifications for Steel Strand, Uncoated Seven-Wire for Prestressed Concrete. West Conshohocken, PA: ASTM.
5. American Association of State Highway and Trans-portation Officials (AASHTO). 1999. Guide Specifica-tions for Design and Construction of Segmental Con-crete Bridges. 2nd ed. Washington, DC: AASHTO.
6. AASHTO. 2002. Standard Specifications for High-way Bridges. 13th ed. Washington, DC: AASHTO.

Spr ing 2009 | PCI Journal142
About the authors
Sami Megally, PhD, P.E., is a senior engineer for PBS&J Inc. in San Diego, Calif.
Marc J. Veletzos, PhD, P.E., is an assistant professor for the Department of Civil Engineering at Merrimack College in North Andover, Mass.
Kelly Burnell, MS, P.E., is a bridge engineer for David Evans and Associates Inc. in Salem, Ore.
Jose I. Restrepo, PhD, is a professor for the Department of Structural Engineering at the University of California at San Diego. He is a past recipient of the Charles C. Zollman Award.
Frieder Seible, PhD, P.E., is the dean of Jacobs School of Engineering and an Eric and Johanna Reissner Professor of Structural Engineering for the Department of Structural Engineering at the University of California at San Diego.
Synopsis
Segmental construction of precast concrete bridges can accelerate construction and minimize the cost of bridges in congested urban environments and environ-mentally sensitive regions. Despite proven benefits, the use of precast concrete segmental bridges in seismic regions of the United States remains limited. A main obstacle to their use is concern regarding the seismic response of segment-to-segment joints. To
address this concern, researchers recently completed a three-phase research project to investigate the seismic performance of precast concrete segmental bridges.
The first and second phases of the project studied the performance of precast concrete segments in super-structure regions of high moment–low shear and high moment–high shear, respectively. The third phase of the project investigated the performance of a large-scale, balanced-cantilever, superstructure-pier system under two stages of seismic loading. The first load-ing stage studied the system performance when the superstructure segment joints were designed to remain closed, per current design practices. The second loading stage investigated the system performance when nonlinear elastic response was permitted in the superstructure.
This paper summarizes the major experimental results from all three phases of the research project and will show that segment joints can undergo large rotations that open gaps in the superstructure without signifi-cant loss of strength. In addition, this research showed that damage in a superstructure-column system is limited to the column when vertical earthquake demands are not considered. However, when vertical earthquake demands are included and the clamping force at the superstructure segment joints is reduced, some segment joints may open but the behavior of the system is not compromised.
Keywords
Bonded tendon, bridge, earthquake, finite-element analysis, large-scale testing, post-tensioning, segmen-tal construction, seismic, superstructure, tendon.
Review policy
This paper was reviewed in accordance with the Precast/Prestressed Concrete Institute’s peer-review process.
Reader comments
Please address any reader comments to PCI Journal editor-in-chief Emily Lorenz at [email protected] or Precast/Prestressed Concrete Institute, c/o PCI Journal, 209 W. Jackson Blvd., Suite 500, Chicago, IL 60606. J