seismic monitoring in krafla - landsvirkjun.is were calculated based on pick polarities suing the...
TRANSCRIPT

Seismic Monitoring in KraflaNovember 2015 to November 2016
LV-2017-015


Key Page
LV report no: LV-2017-015 Date: February 2017
Number of pages: 20 Copies: 6 Distribution: On www.lv.is Open Limited until
Title: Seismic Monitoring in Krafla. November 2015 to November 2016.
Authors/Company: Hanna Blanck, Kristján Ágústsson and Karl Gunnarsson
Project manager: Ásgrímur Guðmundsson (LV) Magnús Ólafsson (ÍSOR)
Prepared for: Prepared by Iceland GeoSurvey (ÍSOR) for Landsvirkjun.
Co operators:
Abstract: The seismic network installed in Krafla has been under continuous development since
2013. Data is streaming in real-time and data analysis is carried out on a daily basis. In this report, the operation of the network and the analysis of the seismic activity for the period from November 1st 2015 to October 31st 2016 is presented. A total of 5037 earthquake were recorded, of which 4531 could be relocated using the hypoDD software.
The results of the analysis of seismicity are comparable those presented in last year’s report. Most earthquakes occurred at one to two km depth. The brittle-ductile boundary lies in about 2.3 km depth. To SW the depth is somewhat larger that might indicate lateral limit of a magma chamber. The magnitudes range from -0.53 to 3.36. The b-value is higher than one indicating a weak crust.
The Vp/Vs ratio inside the geothermal area is 1.71 and 1.78 outside of it.
For selected events, representing different areas within the geothermal field focal mechanism were calculated based on pick polarities suing the FPFIT software. They indicate a highly variable, extension dominated stress regime.
The seismic activity shows a semi-annual trend. Both in spring and autumn more earthquakes are recorded than in summer and winter. A cause has not been clearly identified but variations in injection rates or seasonal variations in precipitation are conceivable.
Keywords:
Seismicity, earthquakes, brittle-ductile boundary, Vp/Vs ratio, focal mechanism, seasonal variations, Krafla, Landsvirkjun, ÍSOR
ISBN no:
Approved by Landsvirkjun’s project manager
Project manager’s signature Reviewed by
Ólafur G. Flóvenz


- 5 -
Table of contents
1 Introduction ......................................................................................................................... 7
2 The seismic network ........................................................................................................... 7
3 Recorded earthquakes ...................................................................................................... 10
4 Spatial distribution of event ........................................................................................... 10
5 Magnitude distribution ................................................................................................... 13
6 Vp/Vs ratio.......................................................................................................................... 15
7 Focal mechanism ............................................................................................................... 17
8 Seasonal variations ........................................................................................................... 18
9 Summary ............................................................................................................................. 19
10 References ........................................................................................................................... 20
List of tables
Table 1. Seismic stations in Krafla, their locations and type of sensors and digitizers. .............. 8
List of figures
Figure 1. Seismic network for monitoring Krafla, Þeistareykir and Námafjall .......................... 9
Figure 2. Number of earthquakes recorded per day and the cumulative number of events ...... 10
Figure 3. Spatial distribution of earthquakes in surface projection, E-W and N-S sections..... 11
Figure 4. Depth distribution of the events located in Krafla area ............................................. 12
Figure 5. Magnitude-frequency relation. Measured magnitudes vary from -0.53 to 3.36 ....... 14
Figure 6. Vp/Vs ratio in Krafla geothermal area ....................................................................... 16
Figure 7. Focal mechanisms of selected earthquakes in Krafla area .......................................... 17
Figure 8. Number of daily recorded events from October 25th 2013 until October 31st 2016 ... 18

- 6 -

- 7 -
1 Introduction
In this report we present the results of the earthquake monitoring in Krafla geothermal
area during the time period from November 1st 2015 to October 31st 2016. The task
involves the development and maintenance of the local seismic network, automatic data
transfer to Landsvirkjun (LV, The National Power Company) and to Iceland GeoSurvey
(ÍSOR) and the processing and analysis of the data. LV owns and runs the seismic
stations and takes care of the maintenance of the stations as well as the data transfer in
cooperation with ÍSOR. Data is also achieved from the Icelandic regional seismic
network, the SIL-network, which is operated by the Icelandic Meteorological Office
(IMO). ÍSOR processes, analyses and interprets the data in the context of the geothermal
field.
2 The seismic network
The local permanent seismic network in Krafla geothermal area, including the stations
installed in Námafjall and in Þeistareykir, consists of 17 stations. During the time period
discussed in this report only one change in position were made to the layout of the
network. In October the station HDH was demounted and reinstalled north northeast of
its former location as HDHA.
In addition to the network run by LV and ÍSOR, we are having access to 6 seismic stations
in the area which are run by the Icelandic Meteorological Office (IMO) as a part of the
national seismic network (The SIL network).
Description of the stations is shown in Table 1 and their location in Figure 1.
In this report the area and the seismic activity analysed is limited to the area plotted in
Figure 1.

- 8 -
Table 1. Seismic stations in Krafla, their locations and type of sensors and digitizers.
Station name
Latitude Longitude Elevation
[m] Depth
[m] Sensor Digitizer
Begin data
End time *
GRT 65.702178 -16.730277 611.0 - Lennartz LE-3Dlite Reftek 29.09.2006
HHK 65.690815 -16.807241 467.0 46.0 Lennartz LE-3D5s Reftek 27.09.2006
HVET5 65.711570 -16.769200 652.0 9.0 Lennartz LE-3Dlite Reftek 21.10.2015
LHN 65.717229 -16.781867 545.0 60.0 OYO Geospace Reftek 14.05.2008
SBS 65.687880 -16.758784 445.0 57.0 OYO Geospace Reftek 30.09.2006
SPB 65.724682 -16.754413 569.0 26.0 Lennartz LE-3D5s Reftek 27.09.2006
GFJ 65.747990 -16.849720 531.0 - Lennartz LE-3D5s Reftek 30.08.2013
HDH 65.745583 -16.735417 655.0 - Lennartz LE-3Dlite Guralp 02.09.2013
18.10.2016*
HDHA 65.751033 -16.72845 645.0 - Lennartz LE-3Dlite Guralp 19.10.2016
HVA 65.728217 -16.842483 541.0 - Lennartz LE-3D5s Reftek 30.08.2013
HYD 65.722317 -16.693730 634.0 - Lennartz LE-3D5s Guralp 04.09.2013
SHN 65.700410 -16.862990 527.0 - Lennartz LE-3D5s Guralp 28.08.2013
BEINI 65.622630 -16.861340 312.0 - Lennartz LE-3Dlite Reftek 16.05.2014
DALFJ 65.669410 -16.830260 472.0 - Lennartz LE-3Dlite Reftek 12.06.2014
HSPHO 65.623340 -16.807500 372.0 - Lennartz LE-3Dlite Reftek 06.06.2014
THORF 65.837300 -16.889590 447.0 - Lennartz LE-3Dlite Reftek 01.09.2014
THEIG 65.903270 -16.957630 400.0 - Lennartz LE-3D5s Reftek 16.10.2014
GAESK 65.844840 -17.000070 400.0 - Lennartz LE-3D5s Reftek 05.09.2014
DIM (IMO) 65.96151 -16.93192 266.0 - Lennartz LE-3D5s Guralp 19.11.2008
GHA (IMO) 65.84346 -16.66291 396.0 - Lennartz LE-3D5s Guralp 19.03.2008
KVO (IMO) 65.71392 -16.8813 572.0 - Lennartz LE-3D5s Guralp 23.06.2002
MEL (IMO) 65.57002 -16.65725 370.0 - GUREESPB G24h 01.10.2009
REN (IMO) 65.64699 -16.90591 338.0 - Lennartz LE-3D5s G24e 03.11.1996
SKI (IMO) 65.86982 -17.02696 316.0 - Lennartz LE-3D5s Guralp 19.11.2008

- 9 -
Figure 1. Seismic network for monitoring Krafla, Þeistareykir and Námafjall geothermal areas.
Red triangles stand for the locations of stations run by Landsvirkjun and ÍSOR. The
green triangles show the locations of seismic stations run by the IMO which ÍSOR has
access to. Both locations of stations HDH and HDHA are plotted.
- 10 -
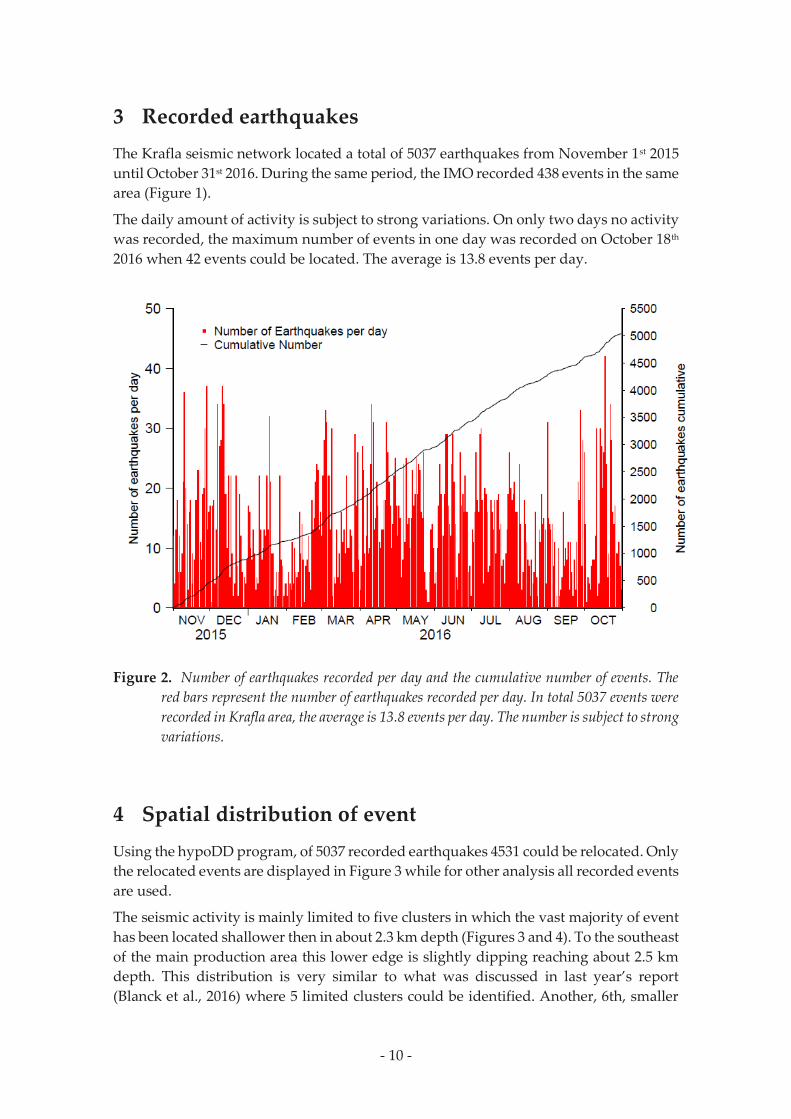
3 Recorded earthquakes
The Krafla seismic network located a total of 5037 earthquakes from November 1st 2015
until October 31st 2016. During the same period, the IMO recorded 438 events in the same
area (Figure 1).
The daily amount of activity is subject to strong variations. On only two days no activity
was recorded, the maximum number of events in one day was recorded on October 18th
2016 when 42 events could be located. The average is 13.8 events per day.
Figure 2. Number of earthquakes recorded per day and the cumulative number of events. The
red bars represent the number of earthquakes recorded per day. In total 5037 events were
recorded in Krafla area, the average is 13.8 events per day. The number is subject to strong
variations.
4 Spatial distribution of event
Using the hypoDD program, of 5037 recorded earthquakes 4531 could be relocated. Only
the relocated events are displayed in Figure 3 while for other analysis all recorded events
are used.
The seismic activity is mainly limited to five clusters in which the vast majority of event
has been located shallower then in about 2.3 km depth (Figures 3 and 4). To the southeast
of the main production area this lower edge is slightly dipping reaching about 2.5 km
depth. This distribution is very similar to what was discussed in last year’s report
(Blanck et al., 2016) where 5 limited clusters could be identified. Another, 6th, smaller

- 11 -
and deeper cluster south of which already showed up in last year’s data is becoming
more and more visible (Ágústsson and Guðnason, 2016) due to the increased number of
seismic stations installed in Námafjall area. It is located the west of the main production
area and south of Leirhnjúkur. Events here are typically between 2.5 and 4 km deep. This
deeper cluster indicates deepening of the brittle-ductile boundary and could mark the
south western edge of the shallow heat source or magma chamber.
Figure 3. Spatial distribution of earthquakes in surface projection and E-W and N-S sections.
- 12 -
Taking a closer look at the magnitudes of the located epicentres of events, the magnitude
distribution appears rather random and no patterns become clearly visible. There is
possibly a clustering of bigger events in the southeast corner of the activity but with
regard to the small number of big events this could also be coincidental. If we look at the
depth distribution, however, the larger events (Ml > 1.0) are more or less clustered within
a ~ 200 m thick horizontal layer centred at ~2 km depth.
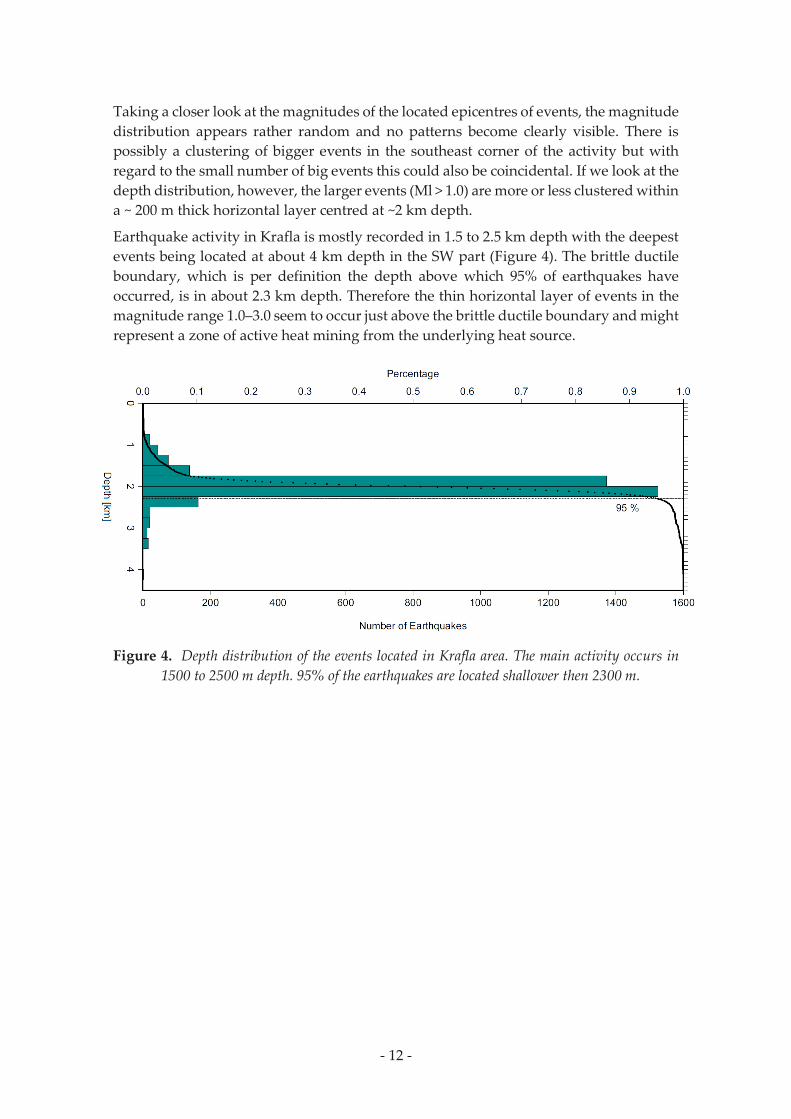
Earthquake activity in Krafla is mostly recorded in 1.5 to 2.5 km depth with the deepest
events being located at about 4 km depth in the SW part (Figure 4). The brittle ductile
boundary, which is per definition the depth above which 95% of earthquakes have
occurred, is in about 2.3 km depth. Therefore the thin horizontal layer of events in the
magnitude range 1.0–3.0 seem to occur just above the brittle ductile boundary and might
represent a zone of active heat mining from the underlying heat source.
Figure 4. Depth distribution of the events located in Krafla area. The main activity occurs in
1500 to 2500 m depth. 95% of the earthquakes are located shallower then 2300 m.

- 13 -
5 Magnitude distribution
The frequency-magnitude relation, also called the Gutenberg-Richter relation (Guten-
berg and Richter, 1956), describes the observation that small earthquakes are more
common than those of bigger magnitude. This relation is described with a straight line
determined by constants a and b:
log𝑁 = 𝑎 − 𝑏 ∗ 𝑀
where N is the number of earthquakes of a given magnitude M and larger. While the
intercept a is depending on the number of earthquake in the time and area chosen, the
slope b is typically about 1 for normal crust. This relation has shown to be valid for global
earthquakes catalogues as well as for smaller seismically active areas. Deviations from
the slope being b = 1 are typically found for very small events which are not all recorded
by both global and local networks, this is the so-called „roll-off“.
In Krafla magnitudes from -0.53 to 3.36 have been measured (Figure 5). The b value is
about 1 for events of magnitude 1.5 and bigger. For smaller events (magnitude 0 to 1.5)
the b value appears to be slightly increased, a relatively high number of small earth-
quakes has been recorded. This points to a local weaker crust in which stress cannot
build up to high levels but instead is released early by numerous small earthquakes. For
events of magnitude smaller than 0 the earthquake catalogue is incomplete due to the
limited sensitivity of the seismic network. A similar magnitude frequency distribution
is observed in Námafjall where the seismogenic crust is considerably thicker than in
Krafla (Ágústsson and Guðnason, 2016).

- 14 -
Figure 5. Magnitude-frequency relation. Measured magnitudes vary from -0.53 to 3.36. Green
bars represent the absolute number and the red stars the cumulative number of
earthquakes. For earthquakes with magnitude > 1.5 the b value is about 1, for earthquake
of magnitude 0 to 1.5 the b value is increased.

- 15 -
6 Vp/Vs ratio
The Vp/Vs ratio provides us with information on rock properties and phase changes of
fluids present in the rock. Compared to 1.73 which is the Vp/Vs ratio in a perfect elastic
medium, in Icelandic crust velocity ratios are typically slightly increased (between 1.75
and 1.79) as studies suggest (e.g. Brandsdóttir and Menke, 2008; Tryggvason et al., 2001).
For this year’s analysis the total of 5037 events where used to estimate the Vp/Vs ratio in
Krafla area (including seismic stations and earthquakes in Þeistareykir and Námafjall)
using a classical Wadati approach (Wadati, 1928). All the events located within the area
represented in Figure 1 have been used for the calculation resulting in a value that
averages along all ray paths (Figure 6b).
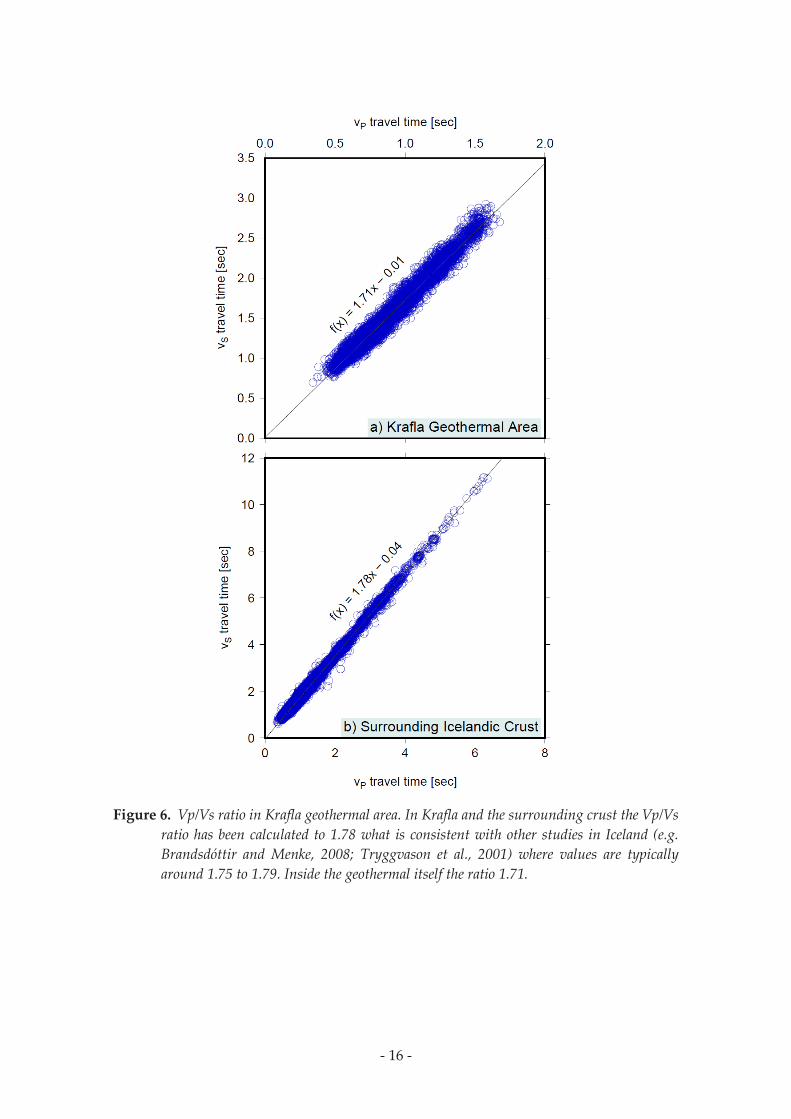
In Figure 6a only earthquakes in Krafla geothermal area and close stations were used in
the Wadati diagram. Here the Vp/Vs ratio is with 1.71 slightly decreased.
Relatively low Vp/Vs ratio indicates lowering of P-wave velocity compared to S-wave
velocity. In case of temperature approaching partial melt the shear strength of the rock
is reduced and the S-wave velocity would drop drastically while the P-wave velocity is
only weakly affected as it depends on the compressional strength. In the case of gas or
steam in the pores in the compressional strength lowers compared to rock fluid filled
pores while the shear strength is not affected. Therefore, a steam zone in a part of the
reservoir is a likely explanation of the slightly reduced Vp/Vs ration within the Krafla
geothermal area. Further analysis of the spatial distribution of Vp/Vs ratio might help to
locate further the steam zone within the reservoir.
- 16 -
Figure 6. Vp/Vs ratio in Krafla geothermal area. In Krafla and the surrounding crust the Vp/Vs
ratio has been calculated to 1.78 what is consistent with other studies in Iceland (e.g.
Brandsdóttir and Menke, 2008; Tryggvason et al., 2001) where values are typically
around 1.75 to 1.79. Inside the geothermal itself the ratio 1.71.

- 17 -
7 Focal mechanism
A focal mechanism analysis of eight selected earthquakes was carried out using the
FPFIT software. The FPFIT software is calculating the faulting mechanisms based on
manual polarisation picks. A high number of picked polarisations can typically be
achieved for events with higher magnitudes. Events were also chosen based on their
location so that we get information from different clusters and subareas inside Krafla
geothermal field.
Three of the biggest events (ML > 2.0) are located in the southeast corner of the main
production field (Figure 7). They show all normal faulting mechanisms with the faults
being oriented about perpendicular to the rift zone. The event in the cluster north of
Leirhnjúkur is also a pure normal fault but with a steep fault plane that is oriented in
NE-SW direction. The events in the cluster south of Leirhnjúkur peak (the analysed event
is actually east of the peak), in the Námafjall cluster and the cluster in-between
Leirhnjúkur and the main production area have oblique faulting mechanisms and the
event in the cluster around the IDDP-1 borehole is a strike-slip event.
The different focal mechanism indicate a stress regime dominated by extensional forces
(7 out of 8 events occur partly on normal faults) but the directions of the fault planes are
variable. No regional trend can be identified based on this small number of mechanisms.
Figure 7. Focal mechanisms of selected earthquakes in Krafla area. The eight analysed events
show primary normal faulting with portions of strike-slip. Only one event (close to the
IDDP1 borehole) is almost pure strike-slip.
- 18 -
8 Seasonal variations
In the annual report on seismic activity in Krafla for the year 2014 the possibility of semi-
annual variation was mentioned but could not be verified due to the limited time span
covered. If seasonal variations exist with over 3 years of data collected by now, they
should show more clearly now.
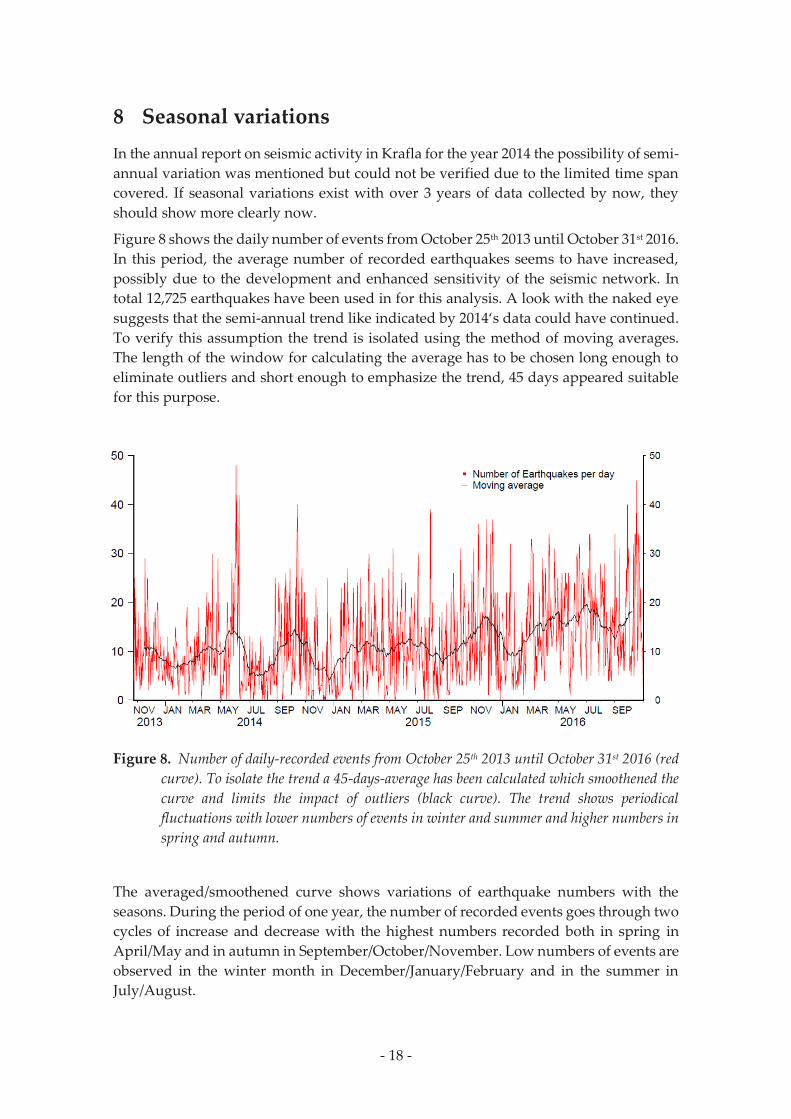
Figure 8 shows the daily number of events from October 25th 2013 until October 31st 2016.
In this period, the average number of recorded earthquakes seems to have increased,
possibly due to the development and enhanced sensitivity of the seismic network. In
total 12,725 earthquakes have been used in for this analysis. A look with the naked eye
suggests that the semi-annual trend like indicated by 2014‘s data could have continued.
To verify this assumption the trend is isolated using the method of moving averages.
The length of the window for calculating the average has to be chosen long enough to
eliminate outliers and short enough to emphasize the trend, 45 days appeared suitable
for this purpose.
Figure 8. Number of daily-recorded events from October 25th 2013 until October 31st 2016 (red
curve). To isolate the trend a 45-days-average has been calculated which smoothened the
curve and limits the impact of outliers (black curve). The trend shows periodical
fluctuations with lower numbers of events in winter and summer and higher numbers in
spring and autumn.
The averaged/smoothened curve shows variations of earthquake numbers with the
seasons. During the period of one year, the number of recorded events goes through two
cycles of increase and decrease with the highest numbers recorded both in spring in
April/May and in autumn in September/October/November. Low numbers of events are
observed in the winter month in December/January/February and in the summer in
July/August.
- 19 -
At first sight, it seems that the phases of higher number of events have different shapes
in spring and autumn. In autumn, the slopes of the peak are steeper while in spring the
peak appears wider and flatter with no clearly articulated tip.
Possible reasons for these seasonal changes are numerous and at this stage, we can only
speculate. One reason to debate are changing noise levels caused by wind and weather
or variations in injection rate in injection boreholes. Tests were conducted where only
bigger events (magnitude > 0.5) where used for calculating the average. The recordings
of these events should be less sensitive to weather generated changes in noise level.
Therefore, if those were the main reason for the oscillations, the number of bigger events
should be fairly stable. However, we see the seasonal changes also in these events what
excludes noise as an only reason.
Another possible cause of this behaviour is seasonal variations in groundwater level
where a slight elevation in the groundwater table increases the pore pressure and
thereby reduces the strength of the rock. In the spring, the water level should rise due to
snow melting, and again the autumn is usually rainier that the summer, explaining the
peak in the fall. During the high winter, all precipitation is in the form of snow limiting
the recharge of the groundwater system. This hypothesis has not been investigated by
comparison with climate data but should be looked later when more annual cycles are
collected.
9 Summary
From November 1st 2015 until October 31st 2016 only one seismic stations was relocated
to improve its performance and no further changes were made. A total of 5037 earth-
quakes were located inside the seismic network in Krafla geothermal area. The spatial
and depth distribution of those earthquake activity is similar to what we saw in last
year’s report. Earthquakes are mostly located in a few locally limited clusters typically
shallower then 2.3 km with the exception of the cluster in the southwest, which is more
prominent than it was in the past and where events are up to 4 km deep.
Earthquakes vary from -0.53 to 3.36 in magnitude. The magnitude-frequency relation
shows an abundance of small events (magnitude 0 to 1.0) suggesting a weak crust where
stress cannot build up to high levels but is released early in many small events. Vp/Vs
ratios are consistent with earlier studies on the Icelandic crust. Slightly lower ratio inside
the production field compared to the surrounding areas might indicate presence of
steam in the porous rock at reservoir depth.
A comparison between injection rate and the number of earthquakes close to the injec-
tion wells could not be carried out because no injection rate data was made available to
us. A tomography of the area could not be completed in time due to unsolved problems
with the tomoDD software.
Focal mechanism analysis of selected earthquake indicated a primary extensive stress
regime with strike-slip portions. The direction of fault planes is variable not showing a
consistent regional trend.
- 20 -
The number of recorded events per day since October 2013 indicates semi-annual
variations with high numbers of events in spring and autumn. We will follow up on this
in next year‘s report to see if the cycle is repeating itself.
10 References
Ágústsson, K. and Guðnason, E.Á. (2016). Jarðskjálftavirkni við Námafjall 2014 til 2016.
Iceland GeoSurvey, ÍSOR-2016/085, LV-2016-128.
Blanck, H., Ágústsson, K. and Gunnarsson, K. (2016). Seismic monitoring in Krafla.
November 2014 to October 2015. Iceland GeoSurvey, ÍSOR-2016/002, LV-2016-008.
Brandsdóttir, B., and W. Menke (2008). The seismic structure of Iceland. Jökull, 58, 17–34.
Gutenberg, B. and Richter, C. F. (1956). Magnitude and Energy of Earthquakes. Annali di
Geofisica, 9, 1–15.
Tryggvason, A., Rögnvaldsson, S.Th. and Flóvenz, Ó. G. (2001). Three-dimensional
imaging of the P- and S-wave velocity structure and earthquake locations beneath
Southwest Iceland. Geophys. J. Int. 151, 848–866.
