seismic interpretation software - · pdf filepowerful 2d and 3d seismic interpretation system...
TRANSCRIPT
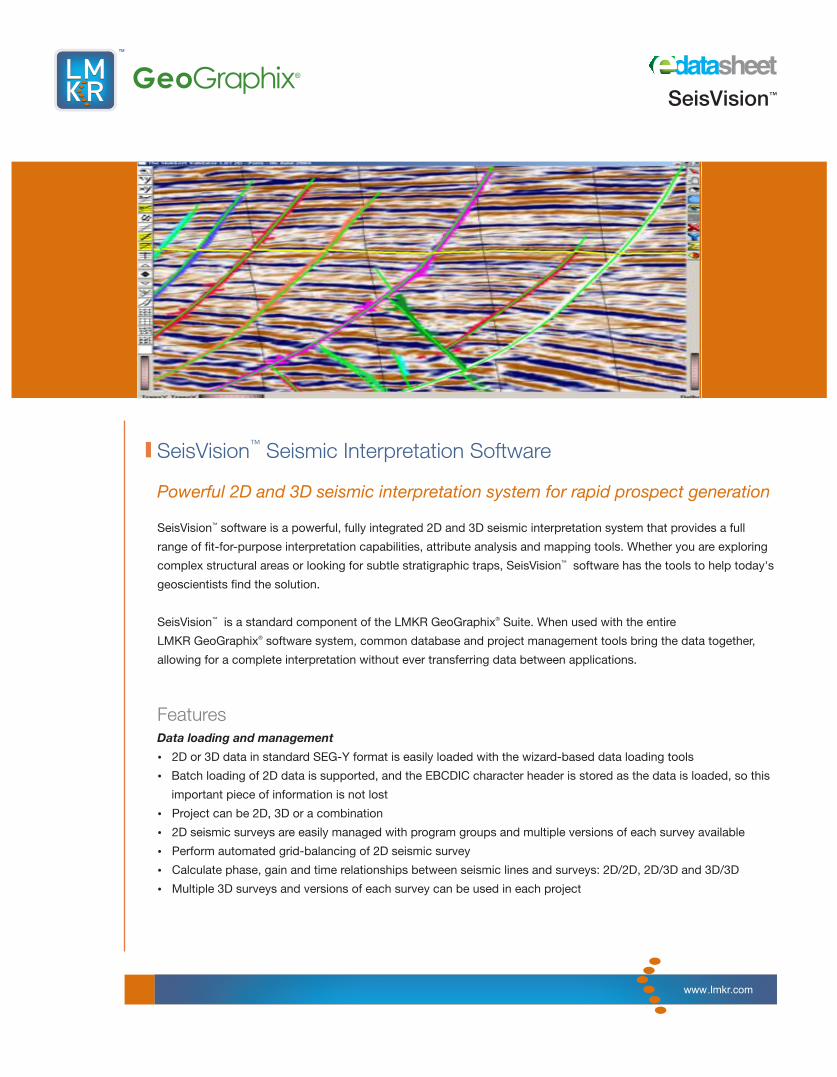
SeisVision software is a powerful, fully integrated 2D and 3D seismic interpretation system that provides a full
range of fit-for-purpose interpretation capabilities, attribute analysis and mapping tools. Whether you are exploring ™complex structural areas or looking for subtle stratigraphic traps, SeisVision software has the tools to help today's
geoscientists find the solution.
™ ®SeisVision is a standard component of the LMKR GeoGraphix Suite. When used with the entire ®LMKR GeoGraphix software system, common database and project management tools bring the data together,
allowing for a complete interpretation without ever transferring data between applications.
Data loading and management
2D or 3D data in standard SEG-Y format is easily loaded with the wizard-based data loading tools
Batch loading of 2D data is supported, and the EBCDIC character header is stored as the data is loaded, so this
important piece of information is not lost
Project can be 2D, 3D or a combination
2D seismic surveys are easily managed with program groups and multiple versions of each survey available
Perform automated grid-balancing of 2D seismic survey
Calculate phase, gain and time relationships between seismic lines and surveys: 2D/2D, 2D/3D and 3D/3D
Multiple 3D surveys and versions of each survey can be used in each project
™
Features
Ÿ
Ÿ
Ÿ
Ÿ
Ÿ
Ÿ
Ÿ
datasheeteSeisVision™
Geo ®GraphixTM
™SeisVision Seismic Interpretation Software
Powerful 2D and 3D seismic interpretation system for rapid prospect generation
www.lmkr.com
Horizon interpretation
Ÿ All standard picking methods are supported: manual, 2D auto-pick, polygon picking or drag-picking modes
Ÿ 3D auto-track using correlation auto-pick or interpolation-based auto-tracking
Ÿ Multi-Z horizons for interpreting thrust-faulted areas are supported with 2D data
Ÿ Full set of horizon operations including copy, smooth, snap, merge and dip/azimuth calculation
Fault Interpretation
Ÿ Interpret faults on vertical views including arbitrary lines or time slices, or in 3D
Ÿ Interpolate fault surfaces automatically
Ÿ Correlate- and assign-fault segments can be done on vertical view, time slice, map view or in 3D
Ÿ Automatic fault heave calculation with the fault polygons created automatically as heaves are calculated
Mapping
Ÿ Multiple base maps supported; each can have a unique set of display parameters and a unique color palette
Ÿ Contour maps or color density maps of time, depth, velocity or seismic attribute
Ÿ Gridding and contouring accomplished with minimum curvature gridding or inverse distance algorithm for quick
maps of the geophysical interpretation™ ®
Ÿ Easy access to the full set of gridding operations with GeoAtlas and IsoMap software when integrating
geophysics and geology for mapping all the data
Ÿ Planimeter and linear distance tools available on the map view
Time-to-depth conversion
Ÿ Time-to-depth workflows are straightforward and accurate, using the unique three-component horizons. Each
horizon file consists of a time, velocity and depth component
Ÿ Time-to-depth can be accomplished from one of five options designed to fit the needs of the problem - average
velocity, interval velocity, velocity surveys, Vo + KZ using a geological datum
Ÿ Velocities automatically calculated at the well locations using formation depth/horizon time relationships
Ÿ Interwell velocity interpolation control enables the user to control how velocities are interpolated
Ÿ Velocity QC functions with graph of the velocities surveys, including overlay of surveys
Attribute and surface calculations
Ÿ User-friendly attribute and surface calculator includes 21 attribute options
Ÿ Attribute calculated between time windows, between horizons or about a selected horizon
Ÿ Attributes derived from the seismic data can be extracted at the well locations and integrated with rock ™properties using ZoneManager
Ÿ Horizon-to-horizon or surface-to-surface calculations supported for both 2D and 3D
Increased efficiency and confidence
Real-time sharing of geologic interpretation and geophysical interpretation makes the entire asset team more
efficient and increases confidence in their decisions.
Ease of use®Intuitive and familiar Windows -based look and feel, including the use of right-button mouse operations and hot
keys to reduce the need for training.
Benefits
www.lmkr.com

RequirementsHardware (MINIMUM)
2.4GHz 32-bit Intel class or better
2GB RAM
1,024 x 768 graphics resolution
CD-ROM drive
19-inch monitor
Ÿ
Ÿ
Ÿ
Ÿ
Ÿ
Softwares®Ÿ Microsoft .NET 3.5 SP1
®Ÿ Microsoft DirectX 10 or greater for ™Discovery 3D
Operating System(s)®Windows XP Professional 64 Sp2
®Windows 7 x64 Enterprise,
Professional, or Ultimate
Ÿ
Ÿ
Hardware (RECOMMENDED)
Dual 2.4GHz 64-bit Intel class or ®better (required for GeoGraphix
3D)
8GB RAM or greater
NVIDIA GeForce or Quadro - 1GB
video RAM
DVD-RW drive
Dual 21-inch monitors
Ÿ
Ÿ
Ÿ
Ÿ
Ÿ
Optional Add-on Modules®pStaX Post-stack Processing Software
Perform post-stack processing flows directly from the desktop.®pStaX software eliminates the need to send seismic data back to the processor
for reprocessing. Instead, your geoscientists can perform post-stack processing ®flows directly from the desktop. pStaX can be used as a standalone application
supporting SEG-Y formatted seismic data. Or the input and output can be ™accomplished using the SeisVision bricked formats thus eliminating the need to
™reformat the data when used with SeisVision .
The standard post-stack processing functions, such as amplitude scaling, correlations, convolution, filtering, and
phase rotation, are available to create the ultimate desktop environment for evaluating the effects of new processing
flows quickly and easily.
™SCAN ™ SCAN software is a horizon attribute-focused add-on to the seismic
®processing module pStaX . ™SCAN calculates nine different curvature attributes, along with over 20 other
horizon-based attributes. The geoscientist can specify a calculation window
about a horizon, between horizons, or a time or depth window.
™With SCAN , the geoscientist can readily identify subtle discontinuities in the
seismic data that may be related to geological features. This tool provides a
cost-effective alternative to outsourcing these types of projects.
Features:
Ÿ Easier identification of linear features such as faults, fractures, reefs and channels
Ÿ Interpreting subtle discontinuities in seismic data
Ÿ Identification of subtle stratigraphic changes, such as channel thickening
www.lmkr.com
®GeoGraphix is a registered trademark of Landmark Graphics Corporation. LMKR is a trademark of LMKR Holdings. ®Windows is a registered trademark of Microsoft Corporation in the United States and other countries.
All other trademarks belong to their respective owners.