seismic imaging of gas conduits beneath seafloor seep sites in a
TRANSCRIPT

�������� ����� ��
Seismic imaging of gas conduits beneath seafloor seep sites in a shallowmarine gas hydrate province, Hikurangi Margin, New Zealand
Gareth J. Crutchley, Ingo A. Pecher, Andrew R. Gorman, Stuart A. Henrys,Jens Greinert
PII: S0025-3227(09)00063-2DOI: doi: 10.1016/j.margeo.2009.03.007Reference: MARGO 4320
To appear in: Marine Geology
Received date: 21 July 2008Revised date: 3 November 2008Accepted date: 8 March 2009
Please cite this article as: Crutchley, Gareth J., Pecher, Ingo A., Gorman, Andrew R.,Henrys, Stuart A., Greinert, Jens, Seismic imaging of gas conduits beneath seafloor seepsites in a shallow marine gas hydrate province, Hikurangi Margin, New Zealand, MarineGeology (2009), doi: 10.1016/j.margeo.2009.03.007
This is a PDF file of an unedited manuscript that has been accepted for publication.As a service to our customers we are providing this early version of the manuscript.The manuscript will undergo copyediting, typesetting, and review of the resulting proofbefore it is published in its final form. Please note that during the production processerrors may be discovered which could affect the content, and all legal disclaimers thatapply to the journal pertain.

ACC
EPTE
D M
ANU
SCR
IPT
ACCEPTED MANUSCRIPT
Special Issue of Marine Geology - (resubmission – November 2008) Seismic imaging of gas conduits beneath seafloor seep sites in a shallow marine
gas hydrate province, Hikurangi Margin, New Zealand Gareth J. Crutchley1*; Ingo A. Pecher2; Andrew R. Gorman1; Stuart A. Henrys3; Jens Greinert45
1Department of Geology, University of Otago, PO Box 56, Dunedin 9054, New Zealand 2Institute of Petroleum Engineering, Heriot-Watt University, Edinburgh EH14 4AS, UK 3GNS Science, PO Box 30368, Lower Hutt 5040, New Zealand 4Renard Centre of Marine Geology, University of Gent, Belgium 5Royal Netherlands Institute for Sea Research (NIOZ), P.O. Box 59, 1790 AB, Den Burg (Texel), The Netherlands *corresponding author: Ph: +64 21 207 0080 Email: [email protected]
Abstract
We present recently-acquired high-resolution seismic data and older lower-resolution seismic
data from Rock Garden, a shallow marine gas hydrate province on New Zealand’s Hikurangi
Margin. The seismic data reveal plumbing systems that supply gas to three general sites
where seeps have been observed on the Rock Garden seafloor: the ‘LM3’ sites (including
LM3 and LM3-A), the ‘Weka’ sites (including Weka-A, Weka-B, and Weka-C), and the
‘Faure’ sites (including Faure-A, Faure-B, and Rock Garden Knoll). At the LM3 sites,
seismic data reveal gas migration from beneath the bottom simulating reflection (BSR),
through the gas hydrate stability zone (GHSZ), to two separate seafloor seeps (LM3 and
LM3-A). Gas migration through the deeper parts of GHSZ below the LM3 seeps appears to
be influenced by faulting in the hanging wall of a major thrust fault. Closer to the seafloor,
the dominant migration pathways appear to occupy vertical chimneys. At the Weka sites, on

ACC
EPTE
D M
ANU
SCR
IPT
ACCEPTED MANUSCRIPT 2
the central part of the ridge, seismic data reveal a very shallow BSR. A distinct convergence
of the BSR with the seafloor is observed at the exit point of one of the Weka seep locations
(Weka-A). Gas supply to this seep is predicted to be focused along the underside of a
permeability contrast at the BGHS caused by overlying gas hydrates. The Faure sites are
associated with a prominent arcuate slump feature. At Faure-A, high-amplitude reflections,
extending from a shallow BSR towards the seafloor, are interpreted as preferred gas
migration pathways that exploit relatively-high-permeability sedimentary layers. At Faure-B,
we interpret gas migration to be channelled to the seep along the underside of the BGHS –
the same scenario interpreted for the Weka-A site. At Rock Garden Knoll, gas occupies
shallow sediments within the GHSZ, and is interpreted to migrate up-dip along relatively
high-permeability layers to the area of seafloor seepage. We predict that faulting, in response
to uplift and flexural extension of the ridge, may be an important mechanism in creating fluid
flow conduits that link the reservoir of free gas beneath the BGHS with the shallow
accumulations of gas imaged beneath Rock Garden Knoll. From a more regional perspective,
much of the gas beneath Rock Garden is focused along a northwest-dipping fabric, probably
associated with subduction-related deformation of the margin.
Keywords: gas seep; gas migration; gas hydrate; marine seismic reflection
1. Introduction
Gas hydrates are solid structures consisting of gas molecules (usually methane)
enclosed by rigid cages of water molecules. The stability of natural gas hydrates is affected
mainly by temperature, pressure and pore water salinity (Sloan, 1998), and regional marine
ACC
EPTE
D M
ANU
SCR
IPT
ACCEPTED MANUSCRIPT 3
gas hydrate provinces are usually defined by identification of a seismic phenomenon known
as a bottom simulating reflection (BSR). The BSR marks the base of gas hydrate stability
(BGHS), above which conditions are generally favourable for gas hydrate formation, and
below which they are not. The BSR is the response to a decrease in seismic velocity and/or
density, which is usually attributed to free gas underlying gas hydrate (e.g. Bangs et al.,
1993).
Free gas associated with the gas hydrate system can potentially intersect the seafloor
at BSR pinch-outs, where the BGHS coincides with the seafloor. Also, in deeper parts of a
gas hydrate province, where the BGHS is significantly deeper than the seafloor, free gas can
occupy fluid flow conduits and ascend through the regional gas hydrate stability zone
(GHSZ) (e.g., at south Hydrate Ridge on the Cascadia subduction margin – Tréhu et al.,
2004). A limitation in the availability of water when gas supply exceeds its proportion in
hydrate, advection of warm fluids, and the production of hyper-saline pore water by hydrate
formation, are possible scenarios allowing migration of free gas through the GHSZ
(Ginsburg and Soloviev, 1997; Liu and Flemings, 2006; Wood et al., 2002). The emergence
of methane gas at seafloor seep sites can be evidenced in numerous ways, for example:
higher dissolved methane concentrations in the water column, flares imaged in echograms,
video observations of rising gas bubbles, the development of chemosynthetic faunal
communities, positive-relief authigenic carbonate mounds, and negative relief pockmarks
(e.g. Baco-Taylor et al., this issue; Faure et al., 2006; Faure et al., this issue; Gay et al., 2007;
Greinert et al., this issue; Hovland and Svensen, 2006; Jones et al., this issue; Lewis and
Marshall, 1996; Naudts et al., this issue).

ACC
EPTE
D M
ANU
SCR
IPT
ACCEPTED MANUSCRIPT 4
The localised accumulation of free gas in marine sediments often yields anomalous
seismic signatures, making seismic methods a useful tool for identification and
characterisation of the sub-seafloor ‘plumbing’ beneath seep sites. Gas can manifest itself as
both amplitude enhancement and amplitude suppression (e.g. Gay et al., 2007; Judd and
Hovland, 1992; Netzeband et al., this issue), as well as through a disruption of reflections
often referred to as “acoustic turbidity” (e.g. Gay et al., 2007; Jones et al., this issue; Judd
and Hovland, 1992; Mathys et al., 2005; Schroot and Schüttenhelm, 2003; Schroot et al.,
2005) or in different cases as “disturbed zones” (Schroot and Schüttenhelm, 2003).
Amplitude enhancement of sedimentary or structural features (i.e. “bright spots”) can
occur when gas preferentially accumulates in high porosity layers or structural voids such as
faults (e.g. Taylor et al., 2000; Tréhu et al., 2004). The result is a marked decrease in acoustic
velocity and density (Domenico, 1977), which can yield increased impedance contrasts with
adjacent media where gas is not focused and velocity and density remain relatively high.
Amplitude suppression can occur due to physical disruption of sedimentary layering
by migrating, gas-charged pore fluids (e.g. Davis, 1992; Gorman et al., 2002), or by highly-
reflective overlying interfaces that significantly reduce the transmission of energy (e.g.
Garcia-Gil et al., 2002; Judd and Hovland, 1992; Sager et al., 2003). Such highly-reflective
overlying interfaces could arise from localised gas accumulations (as mentioned above), or
could be due to very hard carbonate formations or concentrated hydrate deposits for example
(Behrens, 1988; Reilly et al., 1996; Rollet et al., 2006). Alternatively, amplitude suppression
can be caused by absorption and/or scattering of acoustic energy by zones of significant gas
concentration (e.g. Judd and Hovland, 1992; Schroot et al., 2005). The term “gas chimney” is
widely used to refer to vertical/sub-vertical regions of suppressed reflectivity (e.g. Gorman et

ACC
EPTE
D M
ANU
SCR
IPT
ACCEPTED MANUSCRIPT 5
al., 2002; Haacke et al., 2008a) or enhanced reflectivity (e.g. Gay et al., 2007; Schroot and
Schüttenhelm, 2003) caused by gas. It is also noted, that significant amplitude suppression
can be caused by gas hydrates, as preferential growth of hydrate in relatively high porosity
sediments can potentially cause amplitude blanking (Dillon et al., 1993; Lee and Dillon,
2001). The chimneys modelled by Liu and Flemings (2007) for example, are predicted to
comprise mostly hydrate, with only a few percent of coexisting gas focussed in the centres.
Acoustic turbidity (Hovland and Judd, 1988) refers to a pattern of chaotic reflectivity
caused by a scattering of acoustic energy by gas. Judd and Hovland (1992) showed examples
from deep-towed boomer data where dark smears in the section obliterate other reflections.
Schroot et al (2005) and Schroot and Schüttenhelm (2003) have correlated regions of
acoustic turbidity with zones of amplitude blanking caused by gas, and have also referred to
shallow regions of “disturbed reflectivity” that they attribute to the failure of seismic
processing to properly image localised areas with anomalously low seismic velocities. Gay et
al (2007) present recent examples of reflection disruption (which they again refer to as
acoustic turbidity) that are associated with gas chimneys, bright spots and zones of
suppressed reflectivity.
Seep sites are often associated with anomalous seafloor reflectivity (e.g. Anderson
and Bryant, 1990; Gay et al., 2007; Reilly et al., 1996; Sager et al., 2003). Free gas in
seafloor sediments can significantly reduce density and velocity (Domenico, 1977), resulting
in one of two seismic manifestations: 1) a suppressed positive reflection coefficient (when
seafloor impedance is decreased but remains higher than that of the water column), or 2) a
negative reflection coefficient (when seafloor impedance is lower than that of the water
column) (Reilly et al., 1996; Sager et al., 2003). Scenario 2, an extreme case, is more likely
ACC
EPTE
D M
ANU
SCR
IPT
ACCEPTED MANUSCRIPT 6
to occur in areas of unconsolidated sediments (lower density) and more uniform gas
distribution (greater effect on velocity suppression). Strong positive reflection coefficients
can arise from hard layers of hydrate or carbonate existing over sufficiently continuous areas
of the seafloor (Reilly et al., 1996; Sager et al., 2003).
In this study we present two seismic datasets that reveal gas distribution within the
GHSZ of a shallow gas hydrate province known as Rock Garden, part of New Zealand’s
greater Hikurangi Margin Gas Hydrate Province (Figure 1). The purpose of the study is to
characterise gas migration beneath known seep sites that have been discovered on Rock
Garden during extensive research campaigns recently conducted on the Hikurangi Margin
(see Greinert et al., this issue). In regions where we have seismic data intersecting seep sites,
we are confidently able to characterise gas migration. In areas where we do not have seismic
data coverage, gas migration patterns are estimated from interpretation of the closest lines.
We attempt to characterise fluid flow patterns on a regional scale (i.e. beneath the greater
Rock Garden ridge area) as well as on a local scale beneath individual seep sites. The first
area of seepage we discuss was first documented as ‘Site 3’ by Lewis and Marshall (1996).
The second area, ‘Weka’, was discovered during the series of ‘New Vents’ research cruises
aboard F/S Sonne in 2007 (Bialas et al., 2007). The third area is in the vicinity of a large
arcuate slump feature that was correlated with high methane concentrations in the water
column (Faure et al., 2006). Gas flares and chemosynthetic communities have since been
observed in the area now known as the ‘Faure Site’ (Bialas et al., 2007; Pecher et al., 2007).
The three general sites are highlighted on Figure 1C. The Faure Site covers a large area that
we have subdivided into three different regions of seafloor seepage: Faure-A, Faure-B, and
Rock Garden Knoll. The LM3 Site is also sub-divided into LM3 and LM3-A, on the basis of

ACC
EPTE
D M
ANU
SCR
IPT
ACCEPTED MANUSCRIPT 7
distinguishable flares that have been observed there on echograms (Pecher et al., 2007). Due
to the significant spacing between recorded seep locations at the Weka Site (~400 m –
Greinert et al., this issue), we sub-divide this site into Weka-A, Weka-B, and Weka-C.
Our sub-seafloor characterisation of the Faure and LM3 seep sites is complemented
by detailed video observations of bubbling flares and associated seafloor morphology
(Greinert et al., this issue; Naudts et al., this issue), and by measurement of elevated methane
concentrations in the water column (Faure et al., this issue).
2. Geologic Setting
The Hikurangi Margin is characterised by oblique subduction of the Pacific Plate on
the east beneath the Australian Plate on the west (Figure 1A). The anomalously-thick (10 –
15 km) volcanic Hikurangi Plateau is the section of oceanic Pacific Plate subducted at the
margin (Wood and Davy, 1994). The initiation of subduction most likely occurred between
24 Ma and 30 Ma (Kamp, 1999; Rait et al., 1991; Stern et al., 2005). Present day
convergence rates vary between 38 mm/year, at the southern end of the margin, to 45
mm/year at the northern end of the margin (De Mets et al., 1994).
Rock Garden is the eastern bathymetric high in Figure 1C, separated by a trough from
the steep-sided northern part of the Paoanui Ridge (see Barnes et al., this issue). The broad,
elevated ridge of Rock Garden, which owes its existence to uplift by subduction of a
seamount (Barnes et al., this issue; Pecher et al., 2005), is displaced by a major northeast-
striking – northwest-dipping thrust fault system which may or may not still be active (Barnes
et al., this issue). Numerous smaller-scale, cross-cutting faults have formed on the ridge top
in response to uplift, doming and flexural extension (Barnes et al., this issue; Faure et al.,

ACC
EPTE
D M
ANU
SCR
IPT
ACCEPTED MANUSCRIPT 8
2006; Pecher et al., 2005). The trace of the major thrust fault system on the seafloor is shown
in Figure 1C, but the reader is referred to Barnes et al. (this issue) (their Figure 6A, B) for a
full account of the smaller-scale faults.
Dredge samples recovered fractured mudstones from the Rock Garden ridge, which
are likely representative of the “country rock” (Pecher et al., 2008). These samples suggest
that primary porosity in consolidated sediments may be very low, and that migrating fluids
likely exploit relatively high secondary porosity in the form of fractures.
3. Data
3.1 CHARMNZ seismic data
Seismic data were acquired during the first cruise dedicated to gas hydrate research in
New Zealand waters (CHARMNZ: CH4 Hydrates on the Accretionary Margins of New
Zealand) aboard the R/V Tangaroa in June and July of 2006 (Pecher et al., 2007). Ten high-
resolution lines were acquired over Rock Garden. In this paper, the lines are labelled T1-T10
(Figure 1C) – the prefix ‘T’ denotes acquisition from R/V Tangaroa, distinguishing them
from lines P1 and P2 (older lines acquired from the R/VIB N. B. Palmer – discussed in the
next section). Eight lines (T1-T8) trend perpendicular to the ridge strike directions, and two
(T9 and T10 - perpendicular to the first 8) run along strike of Rock Garden. The lines were
acquired using a 150 cu-in GI airgun deployed in front of a 500 m long streamer comprising
40 channels spaced 12.5 m apart. However, due to hydrophone malfunctions, the number of
active channels was reduced to 32 for lines T1 and T2 and to 24 for lines T3-T10.
Shot-domain quality control was required to remove consistently noisy traces and
random spikes from the data. Following this, regular marine geometry was applied to the shot

ACC
EPTE
D M
ANU
SCR
IPT
ACCEPTED MANUSCRIPT 9
gathers (under a natural common midpoint (CMP) spacing of 6.25 m) and they were sorted
into the CMP domain. CMPs were then stacked following a correction for normal move-out
with a constant velocity of 1500 m/s. The resulting stacked sections were used to locate noisy
CMPs, which were then re-analysed for noisy traces and edited accordingly. The cleaned
CMPs were then corrected for spherical divergence effects (assuming a constant velocity of
1500 m/s) and broad-bandpass filtered using a Butterworth-design filter with corner
frequencies of 15, 40, 500, and 650 Hz. The CMPs were then re-stacked and time-migrated
with a finite-difference algorithm utilising a constant velocity of 1500 m/s.
3.2 Palmer seismic data
To supplement the CHARMNZ dataset, we re-processed seismic data acquired in the
Rock Garden area during seismic sea trials of the R/VIB N. B. Palmer in 2003 (Henrys,
2003). These data were acquired with a six-generator/injector-airgun array and a 1.2-km-long
streamer. Line P1 and Line P2 (Figure 1C) are lower-resolution and deeper-penetration than
the CHARMNZ lines, and they provide good comparison to Line T9 and Line T10,
respectively.
A simple processing sequence was applied, similar to the sequence applied to the
CHARMNZ dataset. Trace editing was done entirely in the CMP domain, following
application of regular marine geometry and sorting (under a natural CMP spacing of 12.5 m).
CMPs were then broad-bandpass filtered with a Butterworth-design filter with corner
frequencies of 5, 20, 100, and 120 Hz. The larger offsets present in these data allowed (and
required) definition of root-mean-square (RMS) velocity models that were used for normal
move-out corrections and spherical divergence corrections. Smooth interval velocity models,

ACC
EPTE
D M
ANU
SCR
IPT
ACCEPTED MANUSCRIPT 1
created by Dix conversion of the RMS models, were used for FD-migration of the stacked
sections.
3.3 Post-processing of seismic datasets for 3D visualisation
Slight adjustments, through bulk amplitude scalars, were made to each line such that
seafloor amplitudes over similar sections of the ridge were approximately equivalent. For 3D
viewing of the sections with bathymetry data, the lines were subsequently converted to
‘pseudo-depth’ by assuming a constant velocity of 1500 m/s. This process matched the
seismic seafloor reflections with bathymetry, but the absolute depths of deeper reflections
were simply resolved through this linear conversion from two-way time.
3.4 Additional data
In addition to seismic data, we incorporate: multibeam bathymetry data, point data of
seep locations, and some echogram imagery where flares were captured with the ship’s
single-beam echo-sounder operating at 38 kHz (Greinert et al., this issue). Visual
observations and anomalous water column methane concentrations confirmed that flares
(hydro-acoustic manifestations of bubbles) at the Faure and LM3 sites were indeed caused by
methane bubbles (Faure et al., 2006; Faure et al., this issue; Naudts et al., this issue; Pecher et
al., 2007). The bathymetry data and echograms were acquired during the 'CHARMNZ'
campaign, whereas the point locations of seep sites are incorporated from three recent
research campaigns: 'CHARMNZ', 'New Zeeps 06' (New Zealand Seeps 2006) aboard R/V
Tangaroa in 2006, and 'New Vents' aboard F/S Sonne in 2007.

ACC
EPTE
D M
ANU
SCR
IPT
ACCEPTED MANUSCRIPT 1
4. Regional characterisation of Rock Garden
4.1 Observations
The Rock Garden data reveal BSRs on the ridge flanks that shallow up-dip towards
the ridge top, where they either pinch out or merge very closely with the seafloor (e.g.
Figures 2 and 3). Occasional shallow BSRs are observed beneath the ridge top, and in
addition, many highly reflective zones are imaged that (in general) exhibit reasonably well-
defined upper limits that mimic the bathymetric profile in the same way as the BSRs. BSR
depths generally coincide with the upper limit of highly reflective zones (Figures 2C and
3C). In the ridge perpendicular lines (T1-T8), the high-amplitude zones highlight pervasive
reflections exhibiting an apparent northwest dip (broken black lines, Figures 2C and 3C).
Strong reflectivity is noticeably absent in the vicinity of the regional thrust fault system,
except beneath the LM3 sites, where the fault steps eastward, into line with a prominent,
northeast-trending zone of strong reflectivity (highlighted by the vertical broken white line in
Figure 3C).
4.2 Interpretations
Preferential distribution of free gas into relatively high porosity layers in
heterogeneous sediments is interpreted as the cause for the high amplitude zones (Taylor et
al., 2000; Tréhu et al., 2004). The approximate upper limit of strong reflectivity is therefore
interpreted as the upper limit of free gas. This means that BSRs are not our sole indicators of
the top of free gas (Holbrook et al., 1996; Netzeband et al., this issue). For simplicity, the
term BSR in this paper is used collectively to refer to both conventional BSRs and the upper
limit of strong reflectivity where conventional BSRs are absent. We assume this depth as the

ACC
EPTE
D M
ANU
SCR
IPT
ACCEPTED MANUSCRIPT 1
seismically-observed BGHS, and we do not calculate it from phase boundary relationships as
we do not have good control on long-term ocean bottom temperatures (Pecher et al., 2008).
The broken white lines in both Figure 2C and Figure 3C represent the approximate BGHS
visually predicted from BSRs. Figure 4 displays an enlarged section of part of the ridge top
to give an example of our BSR picking.
Gas pockets are revealed beneath much of the ridge top (e.g. Figures 2C and 3C), but
perhaps the most noticeable accumulations occur in a well-defined, ridge-parallel lineament
~1 km southeast of the most elevated part of the ridge (highlighted by the broken white line
in Figure 3C). The consistently northwest-dipping reflections (Figures 2C and 3C) revealed
by the gas accumulations seem to represent tilted sediments associated with subduction-
related deformation of the ridge. It is likely that gas migration beneath the BGHS is
controlled to some degree by this fabric (Pecher et al., 2004). Barnes et al. (this issue)
establish a clear relationship between major fault zones and fluid migration from the deep,
inner parts of the Hikurangi Margin thrust wedge. Although the thrust fault breaking through
Rock Garden is likely to be a conduit for deep, margin-scale, fluid migration from within the
wedge, we suggest that at shallow levels (i.e. within 500 m of the seafloor) it is not well-
correlated with gas migration – evidenced by the absence of anomalous reflectivity
surrounding it (Figure 3C). Gas may siphon off the fault at depth, into relatively permeable
sedimentary sequences that appear to control shallower (within 500 m of the seafloor) fluid
flow.
5. LM3 Site
5.1 Observations

ACC
EPTE
D M
ANU
SCR
IPT
ACCEPTED MANUSCRIPT 1
Two separately distinguishable flares were imaged at the LM3 Site (Site 3 - Lewis
and Marshall, 1996) during the CHARMNZ cruise (Greinert et al., this issue; Pecher et al.,
2007) and they can each be linked to Line T8 (Figures 5 and 6). We have overlain an
echogram showing the flares on seismic data by matching the seafloor reflections in each
dataset (Figure 6A).The larger flare to the southeast is the main LM3 site (e.g. Greinert et al.,
this issue; Naudts et al., this issue), and we refer to the smaller flare to the northeast as
LM3-A. Seafloor traces of major thrust faults to the east of the LM3 sites are shown in
Figure 5B (after Barnes et al., this issue).
The approximate depth of the BSR beneath the LM3 sites (Figure 5C) is partly
controlled by interpolation between conspicuous BSRs further to the northwest and southeast
(e.g. Figure 3C). Line T8 reveals anomalous and discontinuous reflectivity extending from
beneath the BSR, through the GHSZ, towards the seafloor (Figure 5C). A northwest-dipping
band of reflections extends from below the BSR into the GHSZ (highlighted by the sparsely
dotted lines, Figure 5C). Above the BSR, in the hanging wall of the major thrust fault
(Barnes et al., this volume), this band of reflections is weak in comparison to the zone
extending more vertically towards the seafloor (highlighted by the densely dotted lines,
Figure 5C). The strongly reflective region is relatively narrow and constrained over the first
third of the distance between the BSR and the seafloor. Shallower than this, it broadens as it
approaches the seafloor. LM3 and LM3-A occur above the south-eastern and north-western
sides of the zone, respectively (Figures 5C and 6A). Flare activity was not recorded between
these two sites. A marked suppression of seafloor reflectivity beneath both LM3 and LM3-A
is highlighted in Figure 6B. Reflectivity immediately below the areas of suppressed seafloor
amplitudes is locally down-warped, especially beneath LM3-A (Figure 6A – insets 1 and 2).

ACC
EPTE
D M
ANU
SCR
IPT
ACCEPTED MANUSCRIPT 1
Additionally, vertical zones of suppressed reflectivity exist below the down-warped
reflections. This amplitude reduction is most pronounced at LM3-A, where a well-defined
zone approximately 50 m across extends from a thrust fault (~950 mbsl assuming our 1500
m/s-derived conversion) upwards towards the seafloor (Figure 6A).
5.2 Interpretations
We interpret the high reflectivity, both beneath the BSR and above it, as the seismic
response to non-uniform gas saturation in heterogeneous sediments, resulting in enhanced
impedance contrasts between layers (Taylor et al., 2000; Tréhu et al., 2004).
The sections of low reflectivity we observe at the emanations of the LM3 flares
indicate that significant gas in the seafloor pore space is likely related to the suppressed
amplitudes. Also potentially relevant though, are the observations of varying seafloor
lithology in the LM3 area made by Naudts et al. (this issue). The regions of reduced
reflectivity (Figure 6B) are correlated with parts of the seafloor comprising soft sediments, in
contrast to the harder sediments that are more widespread in the surrounding areas (Naudts et
al., this issue – their Figure 3A). If these soft sediments extend to significant depths (i.e. at
least 5 m – a depth range great enough to affect our seismic wavelengths) then they may have
contributed to lower reflectivity, due to the associated reduction in seismic impedance.
Scattering of energy incident upon rough seafloor morphology (caused by boulders and
carbonate blocks – e.g. Naudts et al., this issue) may also have been important in contributing
to the lower reflectivity.
The down-warped reflectivity immediately below the seafloor may be related to the
presence of focused and concentrated gas. These phenomena, referred to as velocity ‘pull-

ACC
EPTE
D M
ANU
SCR
IPT
ACCEPTED MANUSCRIPT 1
downs’, are often attributed to strong, gas-induced velocity perturbations (Anderson and
Bryant, 1990; Gay et al., 2007).
The suppressed amplitudes in the vertical zones closer to the seafloor display
similarities to wipe-out zones that have been imaged elsewhere around gas expulsion sites
(e.g. Rollet et al., 2006; Tréhu et al., 2004). They could be caused by several different
mechanisms related to gas or gas hydrate. The destruction of sedimentary fabric by focused,
gas-charged fluid migration, or the scattering and attenuation of acoustic energy by gas, are
two plausible gas-related mechanisms. Of these mechanisms, we would prefer the former to
the latter, due to the existence of strong reflections beneath the wipe-out zones that indicate
that acoustic energy did not deteriorate significantly during its passage through the wipe-out
zones. It is also feasible that gas hydrate is responsible for the amplitude suppression,
through the amplitude blanking mechanism (Dillon et al., 1993; Lee and Dillon, 2001).
Additional data, such as velocity information that may help to discriminate between free gas
and gas hydrate (e.g. Haacke et al., 2008a), would be needed to evaluate the relative
importance of these different proposed scenarios.
Following our interpretations that gas has caused enhancement of reflections, and that
gas or hydrate (or a combination of both) has contributed to localised amplitude suppression,
we can predict gas migration patterns to the seep sites. Gas migration beneath the BGHS
appears to be focused along northwest-dipping sediments that are approximately aligned with
the regional thrust fault (Figure 5C). Above the BGHS, gas migration seems to focus around
smaller scale faults in the hanging wall of the major thrust (relatively permeable damage
zones around faults can act as conduits to fluid flow - e.g. Caine et al., 1996). For most of
these faults, a reverse sense of motion is predicted from offset reflections, but for others the

ACC
EPTE
D M
ANU
SCR
IPT
ACCEPTED MANUSCRIPT 1
sense of shear is not obvious. Back-thrusts like these are a common feature in the hanging
walls of thrust faults on the Hikurangi Margin (P. Barnes, pers. comm., 5/2008). We
alternatively note however, that it is possible that the faults have been inverted to
accommodate normal motion, in response to uplift, doming and flexural extension of Rock
Garden. In that case, the apparent reverse sense of shear would exist simply due to
overprinting by earlier reverse motion of greater magnitude (i.e. a net reverse offset, but a
present day normal sense of shear). We predict primary gas migration pathways to be
channelled along damage zones of these faults. The strong reflectivity around the faults is
interpreted as the result of gas being siphoned off into adjacent layers. Closer to the seafloor,
gas ascent seems to be focused into vertical zones (or chimneys) delineated by the suppressed
reflectivity (Figure 6A, insets 1 and 2). We propose that: 1) the vertical wipe-out zones and
2) the regions of reduced seafloor reflectivity and possible velocity pull-downs, reveal the
major pathways for gas ascent close to the seafloor and the major exit points to the water
column, respectively. The softer (and presumably weaker) seafloor sediments observed in the
vicinity of the flare exit points (Naudts et al., this issue) are likely exploited as a path of least
resistance by migrating gas that approaches the seafloor. A feedback mechanism may have
been important in establishing these shallow conduits, whereby channelled gas migration
weakened sediments and encouraged continual focusing of subsequent fluid flow.
From a more regional perspective, the CHARMNZ dataset support the interpretation
of Pecher et al. (2004) that the amplitude anomaly beneath the ridge crest on the NIGHT line
(acquired in the same position at Line T3 – see Figure 3C) is the southward continuation of
the gas conduit that ‘feeds’ the LM3 seep site. The changing nature of the feature between
Line T8 and Line T3 is shown in the oblique 3D view of Figure 3C (along the broken white
ACC
EPTE
D M
ANU
SCR
IPT
ACCEPTED MANUSCRIPT 1
line). The reason for observation of seepage only at LM3, and not further south where gas
zones are also imaged along this northeast-trending lineament (Lines T3 – T7), may be
related to the eastward deflection of the major thrust fault system (Barnes et al., this issue) in
the vicinity of LM3 (e.g. Figure 3): The LM3 sites, and the predicted GHSZ beneath them,
lie in the hanging wall of the fault, whereas the GHSZ above the gas zones further south lies
in the footwall (Figure 3C). We suggest therefore, that faulting in the hanging wall (Figure
3C) may provide the link between gas hosted in northwest-dipping sediments beneath the
BGHS, and the seafloor seep sites. Of course it also plausible that there are other seeps south
of LM3 above this northeast-trending lineament, but they are simply yet to be discovered due
to periods of seep quiescence or simply because research vessels did not pass directly over
them.
6. Weka Site
6.1 Observations
The Weka Site was observed near the centre of the Rock Garden ridge (Figure 7A).
Three different localities, ~400 m apart, have been recorded to mark seepage at the site
(Greinert et al., this issue). We herein refer to these locations as Weka-A, Weka-B, and
Weka-C (Figure 7B). The sections of Lines T10 and T6, displayed in Figure 7C, and the
section of Line P2 displayed in Figure 7D, are highlighted white on Figure 7B. The oblique,
southward-directed view of Figure 7C reveals the sub-seafloor character in Lines T10 and
T6, in the vicinity of the Weka sites. The seismic lines reveal a shallow BSR beneath this
part of the ridge (marked by the broken black line in Figures 7C and 7D) that locally
converges with the seafloor at one of the recorded seep locations (Weka-A, recorded on Line

ACC
EPTE
D M
ANU
SCR
IPT
ACCEPTED MANUSCRIPT 1
T10). Weka-B and Weka-C do not plot on nearby seismic lines. The closest line to Weka-B
is Line P2, about 80 m to the northwest. A vertical section of Line P2, corresponding to the
section of seafloor highlighted by the solid white line in Figure 7C, is shown in Figure 7D.
The projection of Weka-B to Line P2 is close to the convergence of the BSR with the
seafloor (the BSR is ~30 m below the seafloor) (Figure 7D). Weka-C, ~170 m from Line P2,
projects to Line P2 at a point where the BSR is ~60 m below the seafloor.
6.2 Interpretations
The most conclusive interpretations of gas migration that can be made for the Weka
Site are at Weka-A, where the particular location lies on seismic Line T10. The convergence
of the BSR with the seafloor at this location indicates that the local BGHS exists at the
seafloor depth. Therefore, gas migration to this seep site does not have to penetrate gas
hydrate-bearing sediments. We suggest that local-scale gas migration may be focused
upwards along the underside of the BGHS to the Weka-A site, from surrounding areas where
the BGHS is deeper. A permeability contrast at the BGHS caused by overlying gas hydrates
(Dillon and Max, 2000; White, 1979) would provide favourable conditions for this scenario.
Interpretation of regional-scale gas migration to the Weka sites is assisted by cross
lines (T5 and T6, to the southwest and northeast of the sites, respectively - see Figure 3C).
The Weka seep locations occur on the most elevated region of the ridge between Line T5 and
Line T6 (see Figure 3B and 3C). Significantly large gas pockets imaged beneath this region
highlight the apparent north-west dipping attitude of strata (Figure 3C). Regional gas
migration to the ridge top is predicted to be channelled upwards from the west along
relatively permeable layers in this sedimentary fabric.
ACC
EPTE
D M
ANU
SCR
IPT
ACCEPTED MANUSCRIPT 1
7. Faure Site
7.1 Observations
Seepage at the Faure Site was observed at three main locations, herein referred to as
Faure-A, Faure-B, and Rock Garden Knoll (Figure 8). Ship positions recorded during seep
observations are shown by white dots in Figure 8B. The largest cluster of points, recorded on
and behind the northern section of the arcuate headwall slump scar (slump scar delineated by
the broken black line, Figure 8B), is Faure-A. We refer to the solitary northern location,
~1 km up-dip (northeast) of Faure-A, as Faure-B. Rock Garden Knoll is located ~1.5 km
down-dip (southwest) of Faure-A, and is located on and behind the south-western section of
the head wall scarp.
The sub-seafloor character of the Faure-A site is revealed by seismic lines T2 and T9,
in Figure 8C. Figure 8C is an oblique 3D view of the headwall scarp looking towards the
north. The BSR is easily distinguished on Line T2 (shot just behind the headwall on the
northeast side), but has to be approximated on Line T9 where it is not well imaged. The
intersection of the two lines controls the approximation of the BSR depth on Line T9 below
the headwall (e.g. in Figure 9A). An echogram showing flares at Faure-A and Faure-B is
displayed in Figure 9A, where it has been overlain on a vertical section of Line T9 by
matching the seafloor reflections. The vertical section in Figure 9A (Line T9) shows two
high amplitude reflections beneath the Faure-A flare that extend from the approximate BSR
position (controlled partly by the data of Line T2) towards the seafloor. The reflections are of
opposite polarity to the seafloor and exhibit similar intensity over much of their extent (inset,
Figure 9A). Figure 9B, a vertical section looking northeast at Line T2, shows a greater part of

ACC
EPTE
D M
ANU
SCR
IPT
ACCEPTED MANUSCRIPT 2
the strong BSR than is able to be seen in Figure 8C. Line T2 also provides a view,
perpendicular to that of Line T9, of one of the high amplitude reflections between the BSR
and the seafloor observed in Line T9 (the up-dip one of the two) (Figure 9B, inset). Ship
locations recorded to mark seep activity are projected to Line T2, and are again shown by
vertical black lines (Figure 9B).
With respect to Faure-B, an up-dip extrapolation of the BSR depth on Figure 9A
indicates that it probably converges with the seafloor in the vicinity of the flare.
To characterise the Rock Garden Knoll sites, we look at the data of Line T1 and Line
P1. One of the recorded seep locations lies on Line P1, and the others lie ~100 – 200 m
northwest of the line. Line T1 is located ~300 m to the southwest of the Rock Garden Knoll
sites. Figure 10 is an oblique view looking north at the intersection of Line T1 and Line P1
beneath Rock Garden Knoll. Line T1 reveals strong reflectivity immediately beneath the
ridge top, exposed as discontinuous layers that are folded semi-conformably with the seafloor
(Figure 10A, B). In a northeast direction up-dip from Line T1 (towards the seep sites), the
highly-reflective layers are observed to converge towards the seafloor (Figure 10A, C). On
Line P1, they can be seen to converge in the vicinity of the seep location that plots on the
named line (Figure 10C).
7.2 Interpretations
The high amplitude BSR revealed beneath the headwall scarp at the Faure-A site (see
Line T2, Figure 9B) suggests that significant concentrations of free gas are pooling beneath
the BGHS in this area. The pooling of gas is likely due to a permeability contrast at the
BGHS caused by overlying gas hydrates (Dillon and Max, 2000; White, 1979) combined

ACC
EPTE
D M
ANU
SCR
IPT
ACCEPTED MANUSCRIPT 2
with dipping permeable strata and the localised bathymetric doming in the area (see Lines T9
and T2, and the bathymetry data – Figures 8 and 9). The build up of overpressure in this way
may have been a loading mechanism for the slump failure (Faure et al., 2006). The high gas
concentrations and associated high pressures would provide the source and driving force,
respectively, for gas penetration through the GHSZ to the seafloor seep sites. The reverse
polarity of the high amplitude reflections beneath the Faure-A site (likely to be caused by a
velocity decrease due to free gas partial saturation, e.g. Domenico, 1977), their proximity to
the seafloor seepage, and their initiation at the BSR, collectively indicate that these
reflections likely represent preferred gas migration pathways through the GHSZ along
relatively permeable sediment layers (e.g. Figure 9A).
For the case of the Faure-B seep site, we predict that gas does not have to penetrate
the GHSZ, due to a convergence of the BSR with the seafloor (Figure 9A) – the same
scenario interpreted for the Weka-A site. Again, we suggest that a permeability contrast
caused by overlying gas hydrates may focus gas migration beneath the BGHS, upwards to its
predicted convergence with the seafloor.
At Rock Garden Knoll, the zone of strong reflectivity beneath the ridge top (imaged
in Line T1, Figure 10A, B) is interpreted to be due to significant concentrations of gas
preferentially distributed into relatively high-porosity layers (Taylor et al., 2000; Tréhu et al.,
2004). We predict that local-scale gas migration beneath the Rock Garden Knoll sites is
channelled upwards along these dipping layers. The apparent convergence of strong
reflections in the vicinity of the Rock Garden Knoll sites (Figure 10C) suggests that these
layers ultimately ‘feed’ the seep sites. The BGHS is considerably deeper at the Rock Garden
Knoll site than it is at Faure-A and Faure-B. The way gas migrates from beneath the BGHS

ACC
EPTE
D M
ANU
SCR
IPT
ACCEPTED MANUSCRIPT 2
into the GHSZ (where we observe it beneath the ridge top) is more difficult to determine.
However, high angle faults interpreted on Line T1, from offset reflections and bathymetric
disruptions, may provide insight. The multiply displaced seafloor on the ridge top (see Figure
10B) and the orientation of interpreted faults (Figure 10A, B) suggests that deformation
occurs principally by normal faulting, probably in response to flexural extension during uplift
of the ridge. Faulting is likely to play an important role in providing fluid flow conduits that
link the gas reservoir beneath the BGHS with the gas-charged sediments imaged close to the
seafloor in the GHSZ. The shallow gas accumulations may therefore be the result of fluids
being siphoned off faults into adjacent sedimentary layering. Seismic evidence for gas
migration from the depth of the BGHS to the shallow gas-charged sediments, such as
anomalous reflectivity like is observed at the LM3 site, is however absent. Increased seismic
data coverage across the Rock Garden Knoll sites would be necessary to provide better
insight into this interpreted fluid flow mechanism.
As with the LM3 and Weka sites, we correlate regional scale fluid flow to the Faure sites
with northwest-dipping strata. Figure 2C highlights dipping strata beneath the bathymetric
high that the Faure sites sit atop (i.e. imaged on Lines T1, T2 and T3). We envisage that gas
migrates to the bathymetric high from the west by exploiting relatively permeable layers in
the dipping strata.
8. Discussion
The data presented in this study yield important observations of gas migration
patterns beneath seep sites and the factors that influence fluid flow. In Figure 11, we
schematically represent local gas migration patterns predicted beneath seep sites on Rock

ACC
EPTE
D M
ANU
SCR
IPT
ACCEPTED MANUSCRIPT 2
Garden. For the case of the Weka sites, we represent only Weka-A, as the other locations plot
too far from seismic lines for sound interpretations to be drawn. The scenario depicted for
Weka-A also applies to Faure-B, which is not separately drawn. To summarise, we observe
seeps in shallow regions where the BGHS is predicted to crop out at the seafloor (at Weka-A
and Faure-B – Figure 11B and 11B’), and also in deeper regions where gas must penetrate
the GHSZ in order to reach the seafloor (at LM3, Faure-A and Rock Garden Knoll – Figures
11A, 11A’; 11C, 11C’; and 11D, 11D’). For the case of the deeper seep sites, we predict two
mechanisms for gas penetration through the BGHS – 1) along faults (at LM3 and Rock
Garden Knoll – Figures 11A, 11A’; 11D, 11D’), and 2) along relatively permeable
sedimentary layers (at Faure-A – 11C and 11C’). Once inside the GHSZ, gas usually
manifests itself as strong reflections that we interpret as preferential distribution of gas into
relatively permeable strata. Beneath Faure-A and Rock Garden Knoll, these strong
reflections represent primary migration pathways along sedimentary layers that ultimately
‘feed’ the seep sites. In contrast, beneath the LM3 sites, they seem to represent localised
siphoning of fluids off faults into adjacent strata. The faults themselves are interpreted as the
primary fluid migration pathways beneath LM3 (similar to observations at the Blake Ridge
diapir and at Hydrate Ridge – e.g. Taylor et al., 2000; Tyron et al., 2002), except closer to the
seafloor where gas appears to be focused into vertical chimneys that supply the seeps (e.g.
Figure 11A’).
Recent studies of the formation and stability of free gas zones beneath the BGHS are
pertinent to processes acting beneath the Rock Garden ridge. Simulations carried out by
Haacke et al. (2007; 2008b) indicate that the free gas zones can be unstable and highly
dependent on a balance between fluid flux (driving depletion of the free gas zone) and

ACC
EPTE
D M
ANU
SCR
IPT
ACCEPTED MANUSCRIPT 2
hydrate recycling (driving formation of free gas). Relatively high fluid flux is expected in the
Rock Garden area due to the regional convergent tectonics of the Hikurangi subduction
margin (Barnes et al., this issue; Townend, 1997). Additionally, predicted structural failure of
the ridge top (e.g. by hydro-fracturing – Ellis et al., this issue; Pecher et al., 2005; Pecher et
al., 2008) may lead to even higher localised fluid flux close to the seafloor in association with
increased structural permeability. The seismic observations of widespread gas beneath the
BGHS may therefore suggest that sufficiently rapid ridge uplift is important in preserving
these free gas zones. It is noted however, that the Haacke et al. (2007; 2008b) simulations are
based on the movement of gas-rich liquids and they neglect mobile gas – they are applied to
regional properties of the free gas zone, which have been indicated in numerous studies
(Haacke et al., 2008b and references therein) as comprising low concentrations of immobile
gas. In localised regions, free gas can exceed a critical saturation where it will form an
interconnected column and become mobile (Liu and Flemings, 2006; Schowalter, 1979).
Many of our observations at Rock Garden suggest that this is the case (i.e. much of the free
gas is mobile), and therefore the stability of these free gas zones would require consideration
beyond (but also including) the models of Haacke et al (2007; 2008b). The nature of fluid
permeation through the relatively-consolidated, fractured mudrocks of Rock Garden
(possibly highly-dependent on secondary porosity) would further complicate the problem of
porous medium modelling. The influence of gas hydrates on permeability (and vice versa)
and the deflection of fluid flow pathways appears to be very important at Rock Garden. This
is particularly evident where seeps exist at BSR pinchouts (the Weka and Faure B sites),
suggesting that mobile gas is channelled along a significant permeability contrast at the
BGHS. These observations further underscore differences in gas migration mechanisms

ACC
EPTE
D M
ANU
SCR
IPT
ACCEPTED MANUSCRIPT 2
predicted for low flux versus high flux settings (e.g. Haacke et al., 2007; Haacke et al.,
2008b; Liu and Flemings, 2006).
9. Conclusions
We have shown relationships between seismic signatures of sub-seafloor gas
distribution at three general sites where seafloor seeps were observed on Rock Garden – the
LM3 Site (LM3 and LM3-A), the Weka Site (Weka-A, Weka-B, and Weka-C), and the Faure
Site (Faure-A, Faure-B, and Rock Garden Knoll). At each site, seepage is associated with the
gas hydrate system. At two of the sites (the LM3 Site and the Faure Site), gas is imaged both
beneath and within the GHSZ. The CHARMNZ and Palmer seismic datasets, point locations
of seeps, echogram imagery, and bathymetry data, provide more evidence for gas migration
pathways beneath Rock Garden (c.f., Pecher et al., 2004).
On a regional scale, much of the gas imaged beneath the Rock Garden ridge is
focused along a northwest dipping fabric of sedimentary layering. Upward migration of gas
to the BGHS probably exploits highly permeable layers within the dipping strata (Pecher et
al., 2004).
At the LM3 site, where two separate seeps were observed, gas migration from the
BGHS is channelled upwards along a zone that broadens as it approaches the seafloor. Gas
migration seems to be related to faulting within the GHSZ and at shallower levels appears to
be focused into vertical chimneys that ultimately feed the seeps. Suppression of seafloor
reflectivity at the seeps is likely related to partial gas saturation of seafloor sediments and
possibly a softer, less-reflective lithology.

ACC
EPTE
D M
ANU
SCR
IPT
ACCEPTED MANUSCRIPT 2
The Weka sites (Weka-A, Weka-B, and Weka-C), located near the centre of the ridge,
occur where the BGHS is very close to the seafloor. Weka-A occurs at a point where the
BGHS crops out on the seafloor. We predict that gas migrates upwards along the underside
of the BGHS, to the point where it converges with the seafloor and seepage occurs.
Three separate seep areas were observed at the Faure Site. Around the arcuate
headwall scarp, where the slump initiated and the Faure-A seep was observed, it is likely that
a build up of overpressure is facilitating gas injection into the GHSZ along relatively
permeable layers that extend towards the seafloor. Further up-dip, at Faure-B, seepage is
probably due to migration of gas along the underside of the BGHS up to the point where it
converges with the seafloor (the same scenario interpreted for Weka-A). At Rock Garden
Knoll, ~1.5 km southwest of Faure-A, strongly reflective layers imaged beneath the ridge top
that converge towards the seafloor are interpreted to channel gas to the seep sites. Migration
of gas from beneath the BGHS, to the strongly reflective layers near the seafloor, may benefit
from extensional faulting in response to uplift and flexure of the steep-sided ridge that the
seep sites sit atop.
The seismic observations beneath seep sites indicate that gas penetrates the GHSZ at
some parts of the ridge (assisted by faults or relatively permeable strata), whereas at others it
benefits from a convergence of the BGHS with the seafloor. Thus, fluid migration patterns
appear to respond to a range of geological phenomena, including structural deformation,
sedimentary fabrics, and the gas hydrate phase boundary.
10. Acknowledgements

ACC
EPTE
D M
ANU
SCR
IPT
ACCEPTED MANUSCRIPT 2
We thank Phil Barnes, Christian Berndt and an anonymous reviewer for their
constructive reviews of the manuscript. Phil also provided valuable assistance with some
structural interpretations. Thanks to Steve Wilkox, Peter Gerring and John Mitchell for the
acquisition of CHARMNZ seismic and bathymetry data, and to Miko Fohrmann, Kim Senger
and Jeremy Kilner for their assistance with shipboard processing of seismic data - that served
as a basis for post-cruise processing. The excellent efforts made by captains and crews of R/V
Tangaroa and F/S Sonne during Hikurangi Margin research campaigns are gratefully
acknowledged. Seismic processing was carried out with an academic license to the Globe
Claritas seismic processing software. This research was funded through a Royal Society of
New Zealand Marsden Grant, contract number GNS0403.
11. Figure Captions
Figure 1. Location Map, showing: (A) the tectonic setting of New Zealand, (B) the area
offshore of the North Island’s East Coast, and (C) the Rock Garden area – delineated by the
broken black lines. The approximate extent of the gas hydrate province in (B) is after Pecher
and Henrys (2003). The eastern extent represents the approximate position of the Hikurangi
Subduction Margin. The positions of the seismic lines discussed in this study are shown in
(C), as well as the general areas of seafloor seepage (Faure Site, Weka Site, and LM3 Site).
Seafloor traces of major thrust faults, including a system that has displaced the Rock Garden
ridge top, are also annotated (toothed white lines, after Barnes et al., this volume).
Figure 2. Oblique fence-diagram view looking down on the southern and central reaches of
Rock Garden. (A): Reference to the location map given in Figure 1C, showing the

ACC
EPTE
D M
ANU
SCR
IPT
ACCEPTED MANUSCRIPT 2
approximate areal extent of the views in (B) and (C) – outlined by the black box. (B):
Oblique view with the seafloor reflections of Lines T1-T6 and T9-T10 (white lines) overlain
on bathymetry. Also marked is the seafloor trace of the major thrust fault system that breaks
through Rock Garden (broken white line). Darkened squares cover the parts of the view that
are obscured in the main figure (C) by sub-figures (A) and (B). (C): The main figure
displaying seismic images from the lines shown in (B) by stripping away the bathymetry
surface and just leaving its contours. The field of view is the same as in (B). The clinometer
and the 3D arrow (showing the direction to north), both at the bottom of the figure, describe
the orientation of the view. For ease of viewing, seafloor reflections have been highlighted
white and the seismically-interpreted BGHS (picked from BSRs) is marked by broken white
lines. The northwest-dipping attitude of reflections revealed by gas accumulations is
highlighted by the broken black lines. The Faure sites and the Weka sites are also annotated.
Figure 3. Oblique fence-diagram view looking down on the central and northern reaches of
Rock Garden. (A): Reference to the location map given in Figure 1C, showing the
approximate areal extent of the views in (B) and (C) – outlined by the black box. (B):
Oblique view with the seafloor reflections of Line T3 and Lines T5-T8 (white lines) overlain
on bathymetry. Also shown are seafloor traces of the major Rock Garden thrust fault system
(broken white line) and the locations of the LM3 and Weka seep sites (white dots). The
darkened squares cover the parts of the view that are obscured in the main figure (C) by sub-
figures (A) and (B). (C): The main figure displaying seismic images from the lines shown in
(B) by stripping away the bathymetry surface and just leaving its contours. The field of view
is the same as in (B). The clinometer and 3D arrow describe the orientation of the view. The
ACC
EPTE
D M
ANU
SCR
IPT
ACCEPTED MANUSCRIPT 2
seafloor is highlighted white and the seismically-interpreted BGHS (picked from BSRs) is
marked by the broken white lines. The vertical dotted white line highlights a well-defined,
ridge-parallel lineament of gas zones between Line T3 in the south and Line T8 in the north
(at the LM3 Site). The Weka and LM3 seep sites are plotted as white dots on the bathymetry
contours. The northwest-dipping attitude of reflections revealed by gas accumulations is
highlighted by the broken black lines. The major thrust fault system is also annotated, with
an approximated dip.
Figure 4. Example part of a seismic section highlighting BSR picking. (A) Un-interpreted,
variable-density display of migrated data. (B) Interpretations overlain on the section given in
(A). A coherent BSR exists to the west, whereas further east the BSR is picked from the
upper limit of strong reflectivity in the absence of a conventional BSR.
Figure 5. The LM3 Site. (A): Reference to Figure 1C showing the location of the field of
view in (B). (B): Map view of the LM3 area showing: locations of seismic lines (T6, T7, T8
and T10), the section of Line T8 displayed in (C) (highlighted white), ship locations recorded
to mark seep observations (white dots), and seafloor traces of the major Rock Garden thrust
fault system (broken white lines). (C): Oblique view of Line T8 with various annotations: 1)
approximate extents of the flares taken from the echogram shown in Figure 6A (hatched area
above the seafloor), 2) faults and their apparent sense of shear (black lines with single sided
arrows), 3) the approximate BSR depth (broken black line), 4) sparsely dotted lines
highlighting the northwest-dipping band of reflections that is most conspicuous below the
BSR, and 5) densely dotted lines highlighting the strongly reflective zone extending from the

ACC
EPTE
D M
ANU
SCR
IPT
ACCEPTED MANUSCRIPT 3
BSR upwards towards the seafloor. The clinometer and 3D arrow describe the orientation of
the view. The heavy black box in the top part of the figure outlines the field of view in Figure
6A.
Figure 6. The LM3 Site. (A): Enlarged vertical section of Line T8 from Figure 5C, with the
echogram showing flares at LM3 and LM3-A overlain. Interpreted faults are annotated like
in Figure 5C. Enlarged views, ‘inset 1’ and ‘inset 2’, show vertical regions of suppressed
reflectivity, delineated by the broken vertical lines. Also highlighted are down-warped
reflections immediately beneath the sections of suppressed seafloor reflectivity – the upper
black line in each inset delineates the seafloor reflection and the lower black-and-white-
dotted lines delineate underlying down-warped reflectivity. Vertical bold white lines
annotated to the seafloor show the range covered by the seafloor wiggle plot in (B). (B):
Wiggle plot of the seafloor reflection between the two bold white lines shown in (A). The
zones of suppressed amplitudes are shown – they occur above the vertical regions of
suppressed reflectivity (chimneys).
Figure 7. The Weka Site. (A): Reference to Figure 1C showing the location of the field of
view in (B). (B): Map view of the site showing: 1) locations of seismic lines (T3-T7, T9-T10,
P2), 2) ship locations recorded to mark observations of seeps (white dots), and 3) seafloor
traces of the major Rock Garden thrust fault system (broken white lines). The relevant
sections of Lines T6 and T10 (displayed in (C)), and P2 (displayed in (D)), are highlighted
white. (C): Oblique fence-diagram view into the ridge top beneath the Weka sites, showing
the intersection of Lines T10 and T6, with bathymetry. The clinometer and 3D arrow

ACC
EPTE
D M
ANU
SCR
IPT
ACCEPTED MANUSCRIPT 3
describe the orientation of the view. The BSR depth is annotated (broken black line), as well
as the locations of Weka-A, Weka-B, and Weka-C (white dots on the ends of vertical black
lines). The section of Line P2 displayed in (D) is shown by the white line. The enlarged view
labelled ‘inset’ displays a small section of the seafloor and BSR with an overlain wiggle trace
to highlight the reversed polarity of the BSR. (D): The section of Line P2 highlighted by the
white line in (C). A wiggle trace is again overlain to highlight the reversed polarity of the
BSR. The three Weka sites are projected onto the section and the BSR is annotated by the
broken black line.
Figure 8. The Faure Site (overview and Faure-A). (A): Reference to Figure 1C showing the
location of the field of view in (B). (B): Map view of the slump area showing: 1) locations of
seismic lines (T1, T2, T9, T10, P1 and P2), 2) ship locations recorded to mark observations
of seeps (white dots), 3) the seafloor trace of the major Rock Garden thrust fault system
(toothed white lines), and 4) the headwall scarp (broken black line). The dots in the vicinity
of the headwall scarp represent the Faure-A site. The single dot, ~1 km to the northeast,
represents Faure-B. The cluster of dots ~1.5 km southwest of Faure-A represents Rock
Garden Knoll (label abbreviated to “RG Knoll”). The large, circled cluster represents the
flare at Faure-A shown in the echogram of Figure 9A. Relevant sections of Lines T1, T2, T9,
and P1, used to characterise seeps in the greater ‘Faure’ region, are highlighted white. The
white sections of Lines T2 and T9 are displayed together in (C), and also separately in Figure
9A (Line T9) and 9B (Line T2). The white sections of Lines T1 and P1 are displayed
together in Figure 10A. (C): Oblique fence-diagram view into the headwall of the scarp
beneath the Faure-A seep site, showing the intersection of Lines T2 and T9, with bathymetry.

ACC
EPTE
D M
ANU
SCR
IPT
ACCEPTED MANUSCRIPT 3
The clinometer and 3D arrow describe the orientation of the view. The approximate BSR
depth is annotated to Line T9 and is shown more precisely on Line T2 (broken black line).
Ship locations recorded to mark observations of seeps are marked by white dots on the ends
of vertical black lines. The enlarged view labelled ‘inset’ highlights the BSR and a high
amplitude reflection extending from the BSR towards the seafloor, interpreted as a gas-
charged layer within the GHSZ.
Figure 9. The Faure Site (Faure-A and Faure-B). (A): Line T9 with the echogram showing
flares at Faure-A and Faure-B overlain. The approximate BSR level is annotated by the
broken black line. The predicted convergence (pinching out) of the BSR in the vicinity of the
Faure-B flare is shown. The enlarged view labelled ‘inset’ shows the two high-amplitude
reflections (interpreted as gas-charged layers within the GHSZ) extending from the
approximate BSR level towards the seafloor. The south-western (down-dip) reflection is the
one that is also imaged in Figure 8C. The north-eastern (up-dip) reflection can not be traced
all the way to the seafloor. Wiggle traces from specific locations intersecting the two
reflections display their reversed polarity with respect to the seafloor reflection. (B): Line T2
with the BSR depth annotated. The vertical black lines above the seafloor are projections of
the Faure-A seep locations (shown in Figure 8B) to this line. The enlarged view ‘inset’ shows
three reflections of similar strength: the ‘normal’ polarity seafloor, reverse polarity BSR, and
another reverse polarity reflection midway between the BSR and the seafloor (interpreted as
a gas-charged layer within the GHSZ). The latter is the up-dip one of the two high-amplitude
reflections imaged in (A).

ACC
EPTE
D M
ANU
SCR
IPT
ACCEPTED MANUSCRIPT 3
Figure 10. The Faure Site (Rock Garden Knoll). (A): Oblique fence-diagram view into the
ridge top beneath Rock Garden Knoll, showing the intersection of Lines T1 and P1, with
bathymetry. The clinometer and 3D arrow describe the orientation of the view. The BSR
depth is annotated (broken black line), as well as ship locations recorded to mark
observations of seeps (white dots on the ends of vertical black lines). Numerous high-angle
faults are interpreted on Line T1 to account for disrupted reflectivity and seafloor
topography. Gas pockets are highlighted beneath the BSR and also beneath the ridge top. The
black rectangles around near-surface regions of Lines T1 and P1 outline the sections
displayed in (B) and (C), respectively. (B): An enlarged section from the rectangle on Line
T1, revealing strong reflectivity beneath the ridge top, that, like the seafloor itself, is multiply
offset by faulting. We predict predominantly normal motion on the faults, from the seafloor
offsets. The strong reflectivity is interpreted as gas-charged sediments. (C): An enlarged
section from the rectangle on Line P1, revealing the same strong reflections (this time
imaged perpendicularly) converging towards the seafloor in the direction of the seep sites.
The seep location shown is the one that plots on Line P1.
Figure 11. Schematic interpretations of gas migration beneath seep sites on Rock Garden,
based on the most relevant seismic lines to particular seep sites – Line T8 (for the LM3 sites),
Line T10 (for Weka-A), Line T9 (for Faure-A), and Line P1 (for Rock Garden Knoll). The
insets of each sub-figure (A’ – D’, not drawn to scale) are enlarged sketches of gas migration
that complement the main, 1:1 scale schematics by giving a 3D perspective. (A): LM3 sites –
interpreted faults delineated by solid lines; gas chimney extents shown by vertical broken
black lines; arrows indicate gas migration directions beneath the BGHS (along layers) and
ACC
EPTE
D M
ANU
SCR
IPT
ACCEPTED MANUSCRIPT 3
also within the GHSZ (along faults). (A’): Enlarged 3D sketch from (A) (see boxed region)
depicting shallow gas migration beneath LM3-A, as an example. Closest to the seafloor the
chimney represents the primary migration pathway. Beneath the chimney, faults channel the
gas, but some is siphoned off into adjacent strata. (B): Weka-A – arrows indicate gas
migration along the underside of the BGHS (this scenario also applies to Faure-B). (B’):
Enlarged 3D sketch from (B) (see boxed region) around the convergence of the BGHS with
the seafloor. (C): Faure-A – arrows indicate gas migration and pooling beneath the BGHS, as
well as through the GHSZ along high-permeability layers. (C’): Enlarged 3D sketch from (C)
(see boxed region) showing the intersection of the bottom layer with the BGHS. (D): Rock
Garden Knoll – arrows close to the seafloor indicate gas migration along sedimentary
layering towards the seep site. Dotted vertical arrows represent migration of gas from
beneath the BGHS into the GHSZ (depicted in D’). (D’): Enlarged 3D sketch from (D) (see
boxed region – oblique to main section) depicting gas migration from beneath the BGHS to
the seep site. Gas exploits faults to penetrate the BGHS and ascend towards shallow
sedimentary layering. Gas then siphons off the faults into adjacent layers and migrates up-dip
to the seep sites.
12. References
Anderson, A.L. and Bryant, W.R., 1990. Gassy sediment occurrence and properties -
northern Gulf of Mexico. Geo-Marine Letters, 10(209-220).
Baco-Taylor, A., Rowden, A.A., Levin, L.A., Smith, C.R. and Bowden, D., this issue. Initial
Characterization of Cold Seep Faunal Communities on the New Zealand Margin.
Marine Geology, this issue.

ACC
EPTE
D M
ANU
SCR
IPT
ACCEPTED MANUSCRIPT 3
Bangs, N.L.B., Sawyer, D.S. and Golovchenko, X., 1993. Free gas at the base of the gas
hydrate zone in the vicinity of the Chile triple junction. Geology, 21: 905-908.
Barnes, P.M. et al., this issue. Tectonic and Geological Framework for Gas Hydrates and
Cold Seeps on the Hikurangi Subduction Margin, New Zealand. Marine Geology, this
issue.
Behrens, E.W., 1988. Geology of a continental slope oil seep, northern Gulf of Mexico.
American Association of Petroleum Geologists Bulletin, 72: 105-114.
Bialas, J., Greinert, J., Linke, P. and Pfannkuche, O., 2007. FS Sonne Fahrtbericht / Cruise
Report SO 191 New Vents, IFM-GEOMAR, Leibniz-Institut für
Meereswissenschaften, Kiel, Germany.
Caine, J.S., Evans, J.P. and Forster, C.B., 1996. Fault zone architecture and permeability
structure. Geology, 24(11): 1025-1028.
Davis, A.M., 1992. Shallow gas: an overview. Continental Shelf Research, 12(10): 1077-
1079.
De Mets, G., Gordon, R.G., Argus, D.F. and Stein, S., 1994. Effect of recent revisions to the
geomagnetic time scale on estimates of current plate motions. Geophysical Research
Letters, 21: 2191-2194.
Dillon, W.P., Lee, M.W., Fehlhaber, K. and Coleman, D.F., 1993. Gas Hydrates on the
Atlantic Continental Margin of the United States – Controls on Concentration. In:
D.G. Howell (Editor), The Future of Energy Gases: U.S. Geological Survey
Professional Paper 1570. U.S. Gov. Printing Office, Washington D.C., pp. 313-330.
ACC
EPTE
D M
ANU
SCR
IPT
ACCEPTED MANUSCRIPT 3
Dillon, W.P. and Max, M.D., 2000. Oceanic Gas Hydrate. In: M.D. Max (Editor), Natural
Gas Hydrate in Oceanic and Permafrost Environments. Kluwer Academic Publishers,
Dordrecht, The Netherlands.
Domenico, S.N., 1977. Elastic properties of unconsolidated porous sand reservoirs.
Geophysics, 42(7): 1339-1368.
Ellis, S. et al., this issue. Testing proposed mechanisms for seafloor weakening at the top of
gas hydrate stability, Rock Garden, New Zealand. Marine Geology, this issue.
Faure, K. et al., 2006. Methane seepage and its relation to slumping and gas hydrate at the
Hikurangi margin, New Zealand. New Zealand Journal of Geology and Geophysics,
49: 503-516.
Faure, K. et al., this issue. Massive and pervasive methane anomalies along the Hikurangi
Margin of New Zealand: geochemical and physical properties of the water column.
Marine Geology, this issue.
Garcia-Gil, S., Vilas, F. and Garcia-Garcia, A., 2002. Shallow gas features in incised-valley
fills (R!ıa de Vigo, NW Spain): a case study. Continental Shelf Research, 22: 2303-
2315.
Gay, A., Lopez, M., Berndt, C. and Séranne, M., 2007. Geological controls on focused fluid
flow associated with seafloor seeps in the Lower Congo Basin. Marine Geology,
244(1-4): 68-92.
Ginsburg, G.D. and Soloviev, V.A., 1997. Methane migration within the submarine gas-
hydrate stability zone under deep-water conditions. Marine Geology, 137: 49-57.
Gorman, A.R. et al., 2002. Migration of methane gas through the hydrate stability zone in a
low-flux hydrate province. Geology, 30(4): 327-330.

ACC
EPTE
D M
ANU
SCR
IPT
ACCEPTED MANUSCRIPT 3
Greinert, J., Bialas, J., Lewis, K.B. and Suess, E., this issue. Methane seeps and gas hydrates
offshore New Zealand's North Island: Compiling results from three cruises in 2006
and 2007. Marine Geology, this issue.
Haacke, R.R., Park, K.-P., Stoian, I., Hyndman, R.D. and Schmidt, U., 2008a. High-flux gas
venting in the East Sea, Korea, from analysis of 2D seismic reflection data, 6th
International Conference on Gas Hydrates (ICGH 2008), Vancouver, British
Columbia, Canada.
Haacke, R.R., Westbrook, G.K. and Hyndman, R.D., 2007. Gas hydrate, fluid flow and free
gas: Formation of the bottom-simulating reflector. Earth and Planetary Science
Letters, 261: 407-420.
Haacke, R.R., Westbrook, G.K. and Riley, M.S., 2008b. Controls on the formation and
stability of gas hydrate-related bottom-simulating reflectors (BSRs): A case study
from the west Svalbard continental slope. Journal of Geophysical Research,
113(B05104): 1-17.
Henrys, S.A., 2003. NBP03-04D (9-14 October) sea-trial seismic report., Institute of
Geological and Nuclear Sciences Science Report, Lower Hutt, New Zealand.
Holbrook, W.S. et al., 1996. Methane hydrate and free gas on the Blake Ridge from vertical
seismic profiling. Science, 273(5283): 1840-1843.
Hovland, M. and Judd, A.G., 1988. Seabed Pockmarks and Seepages; Impact on Geology,
Biology, and Marine Environment. Graham and Trotman, London.
Hovland, M. and Svensen, H., 2006. Submarine pingoes: Indicators of shallow gas hydrates
in a pockmark at Nyegga, Norwegian Sea. Marine Geology, 228: 15-23.

ACC
EPTE
D M
ANU
SCR
IPT
ACCEPTED MANUSCRIPT 3
Jones, A.T. et al., this issue. Acoustic and visual characterisation of methane-rich seabed
seeps at Omakere Ridge on the Hikurangi Margin, New Zealand. Marine Geology,
this issue.
Judd, A.G. and Hovland, M., 1992. The evidence of shallow gas in marine sediments.
Continental Shelf Research, 12: 1081-1095.
Kamp, P.J.J., 1999. Tracking crustal processes by FT thermochronology in a forearc high
(Hikurangi margin, New Zealand) involving Cretaceous subduction termination and
mid-Cenozoic subduction initiation. Tectonophysics, 307: 313-343.
Lee, M.W. and Dillon, W.P., 2001. Amplitude blanking related to the pore-filling of gas
hydrate in sediments. Marine Geophysical Researches, 22(2): 101-109.
Lewis, K.B. and Marshall, B.A., 1996. Seep faunas and other indicators of methane-rich
dewatering on New Zealand convergent margins. New Zealand Journal of Geology
and Geophysics, 39: 181-200.
Liu, X. and Flemings, P.B., 2006. Passing gas through the hydrate stability zone at southern
Hydrate Ridge, offshore Oregon. Earth and Planetary Science Letters, 241(1-2): 211-
226.
Liu, X. and Flemings, P.B., 2007. Dynamic multiphase flow model of hydrate formation in
marine sediments. Journal of Geophysical Research, 112(B03101).
Mathys, M., Thießen, O., Theilen, F. and Schmidt, M., 2005. Seismic characterisation of gas-
rich near surface sediments in the Arkona Basin, Baltic Sea. Marine Geophysical
Researches, 26: 207-224.

ACC
EPTE
D M
ANU
SCR
IPT
ACCEPTED MANUSCRIPT 3
Naudts, L. et al., this issue. Active venting seep sites on the gas-hydrate-bearing Hikurangi
Margin, Off New Zealand: Visual observations and measurements. Marine Geology,
this issue.
Netzeband, G. et al., this issue. Seeps and the structures underneath - seismic evidence from
the Wairarapa area. Marine Geology, this issue.
Pecher, I., Coffin, R., Henrys, S. and CHARMNZ Working Group, 2007. Tangaroa
TAN0607 Cruise Report: gas hydrate exploration on the East Coast, North Island,
New Zealand, GNS Science Report, Lower Hutt, New Zealand.
Pecher, I.A. and Henrys, S.A., 2003. Potential gas reserves in gas hydrate sweet spots on the
Hikurangi Margin, New Zealand, Institute of Geological and Nuclear Sciences
Science Report, Lower Hutt, New Zealand.
Pecher, I.A., Henrys, S.A., Ellis, S., Chiswell, S.M. and Kukowski, N., 2005. Erosion of the
seafloor at the top of the gas hydrate stability zone on the Hikurangi Margin, New
Zealand. Geophysical Research Letters, 32(L24603).
Pecher, I.A. et al., 2008. Erosion of seafloor ridges at the top of the gas hydrate stability
zone, Hikurangi Margin, New Zealand - New insights from research cruises between
2005 and 2007, 6th International Conference on Gas Hydrates, Vancouver, British
Columbia, Canada.
Pecher, I.A., Henrys, S.A. and Zhu, H., 2004. Seismic images of gas conduits beneath vents
and gas hydrates on Ritchie Ridge, Hikurangi Margin, New Zealand. New Zealand
Journal of Geology and Geophysics, 47(2): 275-279.
Rait, G., Chanier, F. and Waters, D.W., 1991. Landward- and seaward-directed thrusting
accompanying the onset of subduction beneath New Zealand. Geology, 19: 230-233.

ACC
EPTE
D M
ANU
SCR
IPT
ACCEPTED MANUSCRIPT 4
Reilly, J.F., MacDonald, I.R., Biegert, E.K. and Brooks, J.M., 1996. Geologic controls on the
distribution of chemosynthetic communities in the Gulf of Mexico. In: D.
Schumacher and M.A. Abrams (Editors), Hydrocarbon Migration and its Near-
surface Expression, Memoir 66. American Association of Petroleum Geologists,
Tulsa, OK, pp. 39-62.
Rollet, N. et al., 2006. Characterisation and correlation of active hydrocarbon seepage using
geophysical data sets: An example from the tropical, carbonate Yampi Shelf,
Northwest Australia. Marine and Petroleum Geology, 23: 145-164.
Sager, W.W., MacDonald, I.R. and Hou, R., 2003. Geophysical signatures of mud mounds at
hydrocarbon seeps on the Louisiana continental slope, northern Gulf of Mexico.
Marine Geology, 198: 97-132.
Schowalter, T.T., 1979. Mechanics of secondary hydrocarbon migration trapping. American
Association of Petroleum Geologists Bulletin, 63(723–760).
Schroot and Schüttenhelm, 2003. Expressions of shallow gas in the Netherlands North Sea.
Netherlands Journal of Geosciences, 82(1): 91-105.
Schroot, B.M., Klaver, G.T. and Schüttenhelm, R.T.E., 2005. Surface and subsurface
expressions of gas seepage to the seabed—examples from the Southern North Sea.
Marine and Petroleum Geology, 22(4): 499-515.
Sloan, E.D.J., 1998. Clathrate Hydrates of Natural Gases. Marcel Dekker, New York, 705 pp.
Stern, T.A., Stratford, W.R. and Salmon, M.L., 2005. Subduction evolution and mantle
dynamics at a continental margin: central North Island, New Zealand. Reviews of
Geophysics, 44(RG4002): 1-36.

ACC
EPTE
D M
ANU
SCR
IPT
ACCEPTED MANUSCRIPT 4
Taylor, M.H., Dillon, W.P. and Pecher, I.A., 2000. Trapping and migration of methane
associated with the gas hydrate stability zone at the Blake Ridge Diapir: New insights
from seismic data. Marine Geology, 164: 79-89.
Townend, J., 1997. Subducting a sponge: minimum estimates of the fluid budget of the
Hikurangi Margin accretionary prism. Geological Society of New Zealand
Newsletter, 112(14-16).
Tréhu, A.M. et al., 2004. Feeding methane vents and gas hydrate deposits at south Hydrate
Ridge. Geophysical Research Letters, 31(L23310): 1-4.
White, R.S., 1979. Gas hydrate layers trapping free gas in the Gulf of Oman. Earth and
Planetary Science Letters, 42: 114-120.
Wood, R. and Davy, B., 1994. The Hikurangi Plateau. Marine Geology, 118: 153-173.
Wood, W.T., Gettrust, J.F., Chapman, N.R., Spence, G.D. and Hyndman, R.D., 2002.
Decreased stability of methane hydrates in marine sediments owing to phase-
boundary roughness. Nature, 420: 656-660.

ACC
EPTE
D M
ANU
SCR
IPT
ACCEPTED MANUSCRIPT 4

ACC
EPTE
D M
ANU
SCR
IPT
ACCEPTED MANUSCRIPT 4

ACC
EPTE
D M
ANU
SCR
IPT
ACCEPTED MANUSCRIPT 4
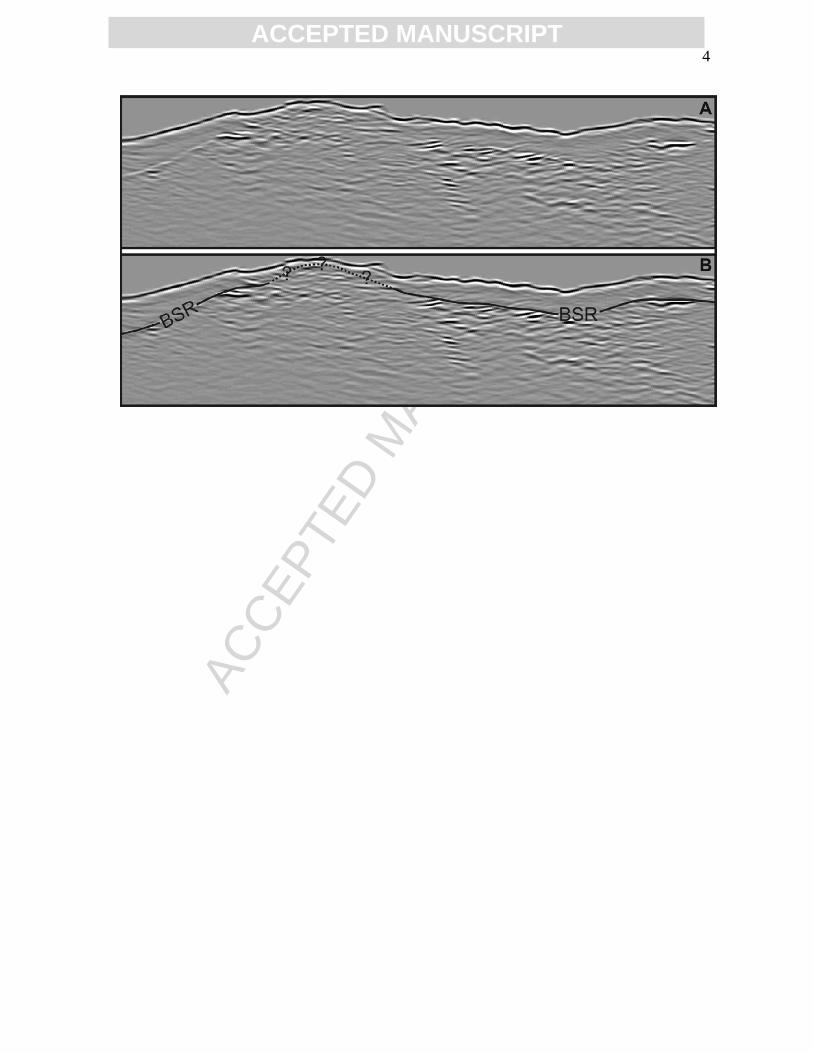
ACC
EPTE
D M
ANU
SCR
IPT
ACCEPTED MANUSCRIPT 4

ACC
EPTE
D M
ANU
SCR
IPT
ACCEPTED MANUSCRIPT 4

ACC
EPTE
D M
ANU
SCR
IPT
ACCEPTED MANUSCRIPT 4

ACC
EPTE
D M
ANU
SCR
IPT
ACCEPTED MANUSCRIPT 4

ACC
EPTE
D M
ANU
SCR
IPT
ACCEPTED MANUSCRIPT 4

ACC
EPTE
D M
ANU
SCR
IPT
ACCEPTED MANUSCRIPT 5

ACC
EPTE
D M
ANU
SCR
IPT
ACCEPTED MANUSCRIPT 5

ACC
EPTE
D M
ANU
SCR
IPT
ACCEPTED MANUSCRIPT 5