seismic evidence for dilatational source deformations ... · 2008 and the gps station showing its...
TRANSCRIPT

Seismic evidence for dilatational source deformations accompanying
the 2004–2008 Yellowstone accelerated uplift episode
T. Taira,1,2 R. B. Smith,1 and W.-L. Chang1,3
Received 31 December 2008; revised 26 June 2009; accepted 14 August 2009; published 2 February 2010.
[1] Dilatational source deformations associated with two unusual M 3+ earthquakes in thearea of the 2004–2008 Yellowstone, WY, accelerated uplift episode were identifiedthrough detailed analysis of moment tensor inversions. Pressurized hydrothermal fluidsare suggested to be associated with the dilatational source processes of these unusualearthquakes, which is consistent with the mechanism of the GPS-InSAR deriveddeformation signal of the uplift modeled as intrusion of a near horizontal magmatic sillat �10 km depth beneath the Yellowstone caldera. One unusual earthquake, the5 November 2007 Mw 3.3 earthquake, occurred in a volume of expected crustalexpansion above the inflating magmatic sill. A notable 60% isotropic expansioncomponent was determined for this earthquake with a 3.2 cm opening across an area of0.12 km2. We propose that the inflation of the magmatic sill activates a high-pressurizedfluid migration upward which in turn triggers dilatational deformation inducing thisearthquake. Another dilatational deformation earthquake, the 9 January 2008 Mw 3.8earthquake, occurred on the northern rim of the caldera. The moment tensor solution forthis earthquake shows that the source mechanism had a 30% of the energy associated withtensile dislocation corresponding to a 3.3 cm opening crack over an area of 0.58 km2. Wesuggest that stress changes produced by a collocated Mw 3.4 earthquake may haveincreased the fracture permeability promoting fluid migration and thus encouraging thedilatational dislocation. These dilatational source earthquakes are the first non–doublecouple earthquakes to be documented unambiguously in the 35 year recording period of theYellowstone seismic network.
Citation: Taira, T., R. B. Smith, and W.-L. Chang (2010), Seismic evidence for dilatational source deformations accompanying the
2004–2008 Yellowstone accelerated uplift episode, J. Geophys. Res., 115, B02301, doi:10.1029/2008JB006281.
1. Introduction
[2] The Yellowstone caldera is one of the world’s largestactive silicic calderas and is characterized by the 40 kmwide by 60 km long caldera formed by the most recenteruption at 0.64 Ma ago [Christiansen, 2001]. Geodeticmeasurements beginning in 1923 have revealed that theYellowstone caldera has experienced multiple episodes ofcaldera-wide deformation of both uplift and subsidence,with deformation rates averaging 1–2 cm/a [Pelton andSmith, 1979; Dzurisin et al., 1994; Wicks et al., 1998, 2006;Puskas et al., 2007; Vasco et al., 2007]. Continuous GlobalPositioning System (GPS) and Interferometric SyntheticAperture Radar (InSAR) measurements recently revealedan episode of rapid ground deformation of the calderabeginning in the middle of 2004 with unexpected high rates
of up to �7 cm/a (corresponding to over 20 cm uplift) in thecaldera and concomitant subsidence of the Norris Geyserbasin area of �2 cm/a [Chang et al., 2007].[3] The Yellowstone Plateau Volcanic Field [Christiansen,
2001, Figure 1] is one of the most seismically active parts ofthe 1300 km long Intermountain Seismic Belt extendingfrom Montana to Arizona [Smith and Sbar, 1974; Smith andArabasz, 1991]. Over 20,000 earthquakes have been locatedin Yellowstone National Park since 1973 [Husen and Smith,2004], averaging 1000–3000 earthquakes per year. Thelargest historic earthquake of the entire Intermountain regionwas the 1959MS 7.5 Hebgen Lake earthquake [Doser, 1985]that occurred on the northwest rim of the Yellowstonecaldera. The 1975 ML 6.1 Norris Junction earthquake hasbeen the largest inner caldera earthquake in historic time [Pittet al., 1979].[4] Seismicity within the Yellowstone caldera is charac-
terized by small shallow earthquakes (M < 3) with focaldepths generally less than 5 km [Husen and Smith, 2004;Farrell et al., 2009] compared to deeper seismicity of up to�20 km depth outside the caldera. The shallow seismicity isinferred to reflect brittle failure above a crystallizing magmasystem located �6 to 15 km beneath the caldera that waselucidated by crustal seismic traveltime tomography [Miller
JOURNAL OF GEOPHYSICAL RESEARCH, VOL. 115, B02301, doi:10.1029/2008JB006281, 2010ClickHere
for
FullArticle
1Department of Geology and Geophysics, University of Utah, Salt LakeCity, Utah, USA.
2Now at Berkeley Seismological Laboratory, University of California,Berkeley, California, USA.
3Now at Department of Earth Sciences, National Central University,Jhongli City, Taiwan.
Copyright 2010 by the American Geophysical Union.0148-0227/10/2008JB006281$09.00
B02301 1 of 16

and Smith, 1999]. Local seismic tomographic studies im-aged this crystallizing magma body as a �5% reduction inP wave velocity with up to �15% partial melt [Benz andSmith, 1984; Miller and Smith, 1999; Husen et al., 2004a].The crystallizing magma is also considered to be responsi-ble for the extraordinarily high heat flow flux of the calderaof �2000 mW/m2 [Morgan et al., 1977; Fournier, 1989].Recent teleseismic tomographic studies also reveal north-west dipping low P (1.0%) and S (2.5%) wave velocities inthe upper mantle from 80 km to at least �660 km depth thathave been interpreted as a plume [Yuan and Dueker, 2005;Waite et al., 2006; Smith et al., 2009].[5] The Yellowstone caldera began to inflate at rates up to
7 cm/a in the middle of 2004 [Chang et al., 2007] and hascontinued moving upward at similar to slightly lower ratesthroughout 2008. This uplift episode has been accompaniedby a reduction in seismic activity [Chang et al., 2007]. Yet,the physical mechanism of earthquakes in and around theYellowstone caldera during this period of unusually highdeformation is unclear. Yellowstone earthquakes generallyresult from tectonic and magmatic sources and interactionsbetween these features [e.g., Smith and Sbar, 1974; Waiteand Smith, 2002]. For example, Waite and Smith [2002]proposed that a migration of hydrothermal fluids radiallyoutward from the Yellowstone caldera triggered the largest
historic earthquake swarm in Yellowstone National Park,the autumn 1985 earthquake swarm located across thenorthwest rim of the Yellowstone caldera.[6] In this study, we use moment tensor inversions to
examine the seismic source processes of five well-recordedM 3+ Yellowstone earthquakes that occurred during the2004–2008 accelerated uplift, so as to further evaluatethe possibility of magmatic-tectonic interactions duringthe 2004–2008 unrest at the Yellowstone caldera. By usingrecently installed high-quality broadband seismometers, weidentified two unusual Yellowstone earthquakes that werecharacterized by significant source volume increases. Wepropose that pressurized hydrothermal fluids in the uppercrustal magma system triggered the two non–double coupleearthquakes. Notably they represent the first dilatationalsource earthquakes reliably recorded in the Yellowstonehydrothermal system.
2. Data and Methodology
[7] The seismic data used in this study were recorded bymultiple networks of broadband seismometers (Figure 1)operated by the University of Utah, U.S. Geological Sur-vey, and EarthScope’s USArray program. The deploymentof University of Utah broadband seismometers near the
Figure 1. Map of Yellowstone National Park showing the locations of broadband seismometers(triangles) and the five M 3+ Yellowstone earthquakes (gray stars) examined in this study. Broadbandseismometers of the EarthScope Transportable Array and other networks are shown in open and graytriangles, respectively. Dots and open squares are locations of Yellowstone earthquakes during 2003–2008 and the GPS station showing its vertical displacement in Figure 2. Gray square indicates the area ofbackground seismicity used for examining the depth of brittle-ductile transition zone. The 0.64 millionyear Yellowstone caldera boundary is outlined with a solid line, and the Sour Creek (SC) and MallardLake (ML) resurgent domes with dashed lines. Also shown are boundaries of Yellowstone National Park(black line) and state (thin lines). Inset map shows locations of broadband seismometers aroundYellowstone National Park (Wyoming, Idaho, and Montana).
B02301 TAIRA ET AL.: DILATATIONAL SOURCE DEFORMATIONS
2 of 16
B02301

Yellowstone caldera began in 1995, with five broadbandseismometers installed by late 2003. USArray deployed 10broadband seismometers around Yellowstone National Park(Wyoming, Idaho, and Montana) in late 2007. These newlydeployed seismometers significantly improved the resolv-ing power of our moment tensor solutions. Ten M 3+Yellowstone earthquakes were observed in 2004–2008(Figure 2) where data from at least five broadband seis-mometers were available. For the first five M 3+ earth-quakes, however, only a few broadband seismograms withhigh signal-to-noise ratio are available. The latter five M 3+earthquakes (Table 1), however, were well recorded by �10broadband seismometers with good azimuthal distribution.[8] The objective of this study was to characterize the
source properties of these M 3+ Yellowstone earthquakes toevaluate how earthquake activity may reflect the interactionof the geodetically imaged inflating magma source of the2004–2008 Yellowstone caldera uplift episode [Chang etal., 2007] with faults and fluid pathways associated with theYellowstone hydrothermal system. As shown in Figure 1,two of the five M 3+ earthquakes occurred inside theYellowstone caldera while the others were located 10–20 km from the caldera. To gain insight into the physicalmechanisms of the earthquakes, moment tensor inversionswith five different source models were performed: (1) shearfaulting, (2) shear faulting + CLVD (compensated linearvector dipole), (3) shear faulting + CLVD + isotropiccomponent, (4) shear faulting + isotropic component, and(5) shear faulting + tensile crack (Appendix A). Momenttensor inversions using the first three source models arereferred to as double-couple, deviatoric, and full momenttensor inversions, respectively, and have been widely usedfor examining source processes of earthquakes occurring inthe upper crust to the lower mantle [e.g., Lay and Wallace,1995].
[9] Employing full moment tensor inversions, severalstudies have identified unusual earthquakes with notablenon–double couple (i.e., isotropic) components in volcanicand geothermal areas such as the Geysers, California [e.g.,Ross et al., 1996], Hengill-Grensdalur, Iceland [Miller et al.,1998], and the Long Valley caldera, California [e.g., Dregeret al., 2000; Foulger et al., 2004]. The presence of avolumetric component can be a direct evidence for fluidinvolvement in earthquake source process [Julian and Sipkin,1985; Kanamori et al., 1993]. For example, Dreger et al.[2000] identified four M 4+ earthquakes with 30–40%volumetric components accompanying the unrest at the LongValley caldera in late 1997–early 1998. During this unrest, ananomalous 10 day compressional strain transient (�0.3microstrain) was also observed [Hill et al., 2003; Roeloffset al., 2003]. Dufumier and Rivera [1997], however, showedthat spurious volumetric source components may result fromtrade-offs among tensor elements with poor data quality. Inaddition, estimating multiple compensating volumetric com-ponents requires unphysical or highly complicated earth-quake source process. Moreover, full moment tensordecompositions are nonunique [e.g., Julian et al., 1998].[10] To evaluate the presence of volumetric component,
we therefore considered two source models that are shearfaulting with an isotropic or tensile crack component, asnoted above. Both source models yield volumetric compo-nents in the earthquake source process. To compute Green’sfunctions for moment tensor inversions, a three-dimensionalfinite difference method [Ohminato and Chouet, 1997] wasused for the broadband seismic data recorded inside theYellowstone caldera where inhomogeneous velocity struc-tures with topographic effects should be considered. Thegrid spacing was set to be 100 m. P and S wave velocity anddensity structures were constrained by the three-dimension-al local seismic traveltime tomography [Husen et al., 2004a]and gravity data [DeNosaquo et al., 2009] in the Yellow-stone caldera. Values of attenuation were assumed to be 600and 300 for P and S waves, although a P wave attenuationmodel has been estimated in the Yellowstone caldera[Clawson et al., 1989] that suggests a high attenuationvalue (�30) in the surface layer within the caldera. How-ever, we found that variations in the attenuation modelslightly changed estimated scalar seismic moments but didnot change percentages of non–double couple componentssignificantly. The surface topography data was interpolatedfrom available U.S. Geological Survey topographic data.For seismic data recorded outside the caldera, we used afrequency wave number method [Bouchon and Aki, 1977].We used the one-dimensional velocity model (Table 2) thatis used for routinely determining Yellowstone earthquakelocations by the University of Utah Seismograph Stations.The attenuation model was the same as for the inside of thecaldera.
Figure 2. Magnitude-time plot for M 3+ Yellowstoneearthquakes (crosses) during 2004–2008. Also shown arevertical Yellowstone ground motions (gray circles) observedat Yellowstone Lake, GPS station LKWY shown in Figure 1.
Table 1. Five M 3+ Yellowstone Earthquakes Examined in This Study
Earthquake Date Origin Time (UTC) Latitude (�N) Longitude (�E) Depth (km) Local Magnitude
Sour Creek Dome 2007/08/03 06:25:35.47 44.660 �110.463 4.0 3.1West Thumb 2007/11/05 05:43:54.22 44.406 �110.615 4.0 3.1Maple Creek A 2007/12/31 03:29:20.78 44.778 �110.940 9.9 3.6Maple Creek B 2008/01/09 21:37:36.97 44.776 �110.937 9.3 3.7Parker Peak 2008/03/25 11:59:36.91 44.680 �110.041 4.9 4.1
B02301 TAIRA ET AL.: DILATATIONAL SOURCE DEFORMATIONS
3 of 16
B02301

[11] The locations of the five M 3+ Yellowstone earth-quakes were well determined by the probabilistic earth-quake location algorithm NonLinLoc [Lomax et al., 2001]and the three-dimensional seismic velocity model of Husenet al. [2004a]. The uncertainties (standard deviation) inlocations of the earthquakes in this study are less than 0.4km and 1.0 km in horizontal and in vertical directions,respectively, except for a vertical uncertainty of 3 km for the3 August 2007 Mw 3.1 Sour Creek Dome earthquake. Tocompute Green’s functions, the source locations were fixed.[12] We first applied a deviatoric moment tensor inver-
sion [Dreger et al., 2000] for the five earthquakes andcalculated their variance reductions (VR) for individualstations defined as [e.g., Templeton and Dreger, 2006]
VR ¼ 1�XT
t¼1 uo tð Þ � us tð Þð Þ2=XT
t¼1 uo tð Þð Þ2� �
� 100;
ð1Þ
where uo(t) and us(t) are observed and synthetic data atthe tth data point and T is the total number of samples. Avariance reduction of 100% indicates a perfect fit of theobserved data to synthetic data. We did not use seismic datafrom earthquake station pairs with negative VR for furtheranalysis. Evaluated negative values of VR appear to be dueto low signal-to-noise levels for those seismic data.[13] Band-pass filterers were initially set to be 10–50 s
and 5–15 s periods for Nanometrics (Trillium 240) andGuralp (CMG-40T and CMG-3ESP) instruments, respec-tively, based on their limitations of long-period response.These passbands are similar to those for previous studiesthat successfully estimated moment tensor components forM 4 earthquakes [e.g., Dreger et al., 2000]. We then slightlymodified passbands for individual station-earthquake pairsso that the average VR values were maximized. We notethat estimated moment tensor components did not signifi-cantly change due to the choice of passbands. The timewindow lengths were set to be 128 s and 60 s for seismo-grams of M � 4 and M < 4 earthquakes, respectively, and a30 s time window length was used for seismograms band-pass filtered between 5 s and 15 s. Following Ford et al.[2009], the maximum value of time shift for synthetic datawas set to be 3 s. This maximum value would be expectedto correct errors in earthquake locations and uncertainties invelocity models and also avoid phase cycle skips.
3. Results
[14] We examined source mechanisms for the five M 3+Yellowstone earthquakes listed in Table 1 by using fivedifferent source models described above. We used a linear
inversion procedure from Dreger et al. [2000] for deviatoricand full moment tensor inversions, and a grid search approachfor other three source models (shear faulting, shear faulting +isotropic component, and shear faulting + tensile crack)because the estimations in moment tensor solution for thesemodels are a nonlinear problem [Minson et al., 2007]. Thegrid search tested all possible combinations for strike, dip,and rake in increments of five degrees, for double-couple andtotal (e.g., double-couple + tensile crack components) scalarseismic moments in increments of 0.1 seismic momentmagnitude (Mw), and for percentage of isotropic and tensilecrack seismic moments in increments of 10% of total scalarseismic moment.[15] We used F test statistics to assess the statistical
significance of CLVD, isotropic, and tensile crack compo-nents, with the double-couple moment tensor solution asreference [Dreger et al., 2000; Templeton and Dreger,2006]. As similar to Templeton and Dreger [2006], thevariance for the F test statistics can be expressed as
s2 ¼XN
i¼1
XT
t¼1 uoi tð Þ � usi tð Þ� �
= Ki �Mð Þ� �
; ð2Þ
where Ki is the uncorrelated data point for the ith station, Mis the model parameter, and N is the number of analyzedstations. K can be formed from K = 2fhTw where fh and Tware a band-pass high corner in hertz and a time windowlength, respectively [e.g., Silver and Chan, 1991]. For thedouble-couple moment tensor inversion, the model para-meter is four (strike, dip, rake, and double-couple moment)while M = 5 for source modes constituting of shear faulting+ one non–double couple component and M = 6 for the fullmoment tensor inversion. The F test statistic is defined asthe ratio of the variances comparing the double-couplesolution, sDC
2 , to other variances, s2; that is F = sDC2 /s2.
Given the degrees of freedom n = K � M � 1 [Menke,1989], where K is the sum of uncorrelated data points foranalyzed stations, confidence levels for the F test statisticswere estimated. We used the 90% confidence level toidentify non–double couple components such as tensilecracks [e.g., Dreger et al., 2000]. If the largest F teststatistic value fell below the 90% confidence level, then weassigned the double-couple source model to be the bestfitting source model. We evaluated uncertainties inestimated parameters (e.g., percentage of non–doublecouple components and principal stress directions) by usinga bootstrap technique [Efron and Tibshirani, 1993] with1000 subsample data sets.[16] As shown in Table 3, we found that two of five M
3+ Yellowstone earthquakes had statistically significantvolumetric components (i.e., shear faulting + isotropic
Table 2. Velocity, Density, and Attenuation Structures Used for Calculating Green’s Functions for Broadband Seismometers Outside the
Yellowstone Caldera
Thickness(km)
P WaveVelocity (km/s)
S WaveVelocity (km/s)
Density(kg/m3)
Attenuationof P Wave
Attenuationof S Wave
1.9 3.90 2.30 2.50 600 3006.1 5.67 3.37 2.50 600 30013.0 6.02 3.59 2.67 600 30019.0 6.70 3.94 3.00 600 30040.0 7.90 4.62 3.30 600 300
B02301 TAIRA ET AL.: DILATATIONAL SOURCE DEFORMATIONS
4 of 16
B02301

Table 3. Results of F Test Statistics for Five Different Source Models and Moment Tensor Solutions for Best Fitting Source Modelsa
Earthquake FCLVD FI FTC FF F90
M0
(1014 N m) Mw VR (%) Best Fitting Source Model
Sour Creek Dome 1.00 1.05 1.03 1.01 1.37 0.56 3.1 (±0.14)b 37 Shear faultingWest Thumb 1.00 1.37 (1.30–1.51)c 1.34 1.33 1.29 1.11 3.3 (±0.06)b 33 Shear faulting + isotropicMaple Creek A 1.02 1.07 1.08 1.03 1.27 1.57 3.4 (±0.09)b 46 Shear faultingMaple Creek B 1.15 1.30 1.54 (1.33–1.82)c 1.50 1.23 6.24 3.8 (±0.07)b 65 Shear faulting + tensile crackParker Peak 1.00 1.01 1.01 1.14 1.25 24.83 4.2 (±0.04)b 68 Shear faulting
aFCLVD, FI, FTC, and FF are F test statistics comparing the shear-faulting source model to shear-faulting + CLVD, shear-faulting + isotropic, shear-faulting + tensile crack, and shear-faulting + CLVD + isotropic source models, respectively. F90 is the threshold value of F test statistic for the 90%confidence level and is determined based on the number of available stations and applied band-pass filters. Seismic moment (M0), moment magnitude(Mw), and variance reduction (VR) were estimated by using the best fitting source model.
bStandard deviations are determined by using bootstrap approaches.cConfidence intervals of 90% are evaluated by using jackknife tests.
Figure 3. Results of moment tensor inversion for the West Thumb earthquake employing shear faulting+ isotropic component source model. (a) The best fitting source mechanism with the used broadbandseismometers (circles). Reverse triangle and square are P and T axes, respectively. (b) Observed (blacklines) and synthetic (dashed gray lines) data based on the best fitting source mechanism. Also shown areearthquake station distances (D) in km and azimuths (Az) in degree from north.
B02301 TAIRA ET AL.: DILATATIONAL SOURCE DEFORMATIONS
5 of 16
B02301
component or shear faulting + tensile crack). One of the M3+ earthquakes with a notable volumetric component wasthe 5 November 2007 West Thumb earthquake (Figure 3).A shear faulting + isotropic component source model is thebest fitting source mechanism for the West Thumb earth-quake (Table 3). The value of F test statistic for the bestfitting source model is 1.37, which is the almost same asthe 95% confidence level, F95 = 1.38. Our moment tensoranalysis suggests that the volumetric component of theWest Thumb earthquake can be characterized by an iso-tropic component rather than tensile crack, although thereduction in variance for a shear faulting + tensile cracksource model is statistically significant above 90% level.We estimate a 60% volumetric expansion component witha standard deviation of ±16%. The scalar seismic moment(M0) is estimated to be 1.11 � 1014 N m (Mw = 3.3). Usingthe scalar seismic moment of isotropic component MI, achange in source volume DV can be determined from theequation MI = [l + (2/3)m]DV, where l and m are the Lameconstants [Aki and Richards, 1980]. As similar to Gottsmannet al. [2006] and Jonsson [2009], we assumed l and m tobe 10 GPa throughout this study. The estimated value ofDV for the West Thumb earthquake is 4.0 � 103 m3
(Table 4).[17] The VR of the best fitting model for the West Thumb
earthquake is 33% (Table 3), which is relatively low com-pared with those for previous studies [e.g., Minson et al.,2007]. However, previous studies have modeled sourcemechanisms for mainly Mw > 5 moderate earthquakes withhigher signal-to-noise ratios than we found for the Mw 3.3West Thumb earthquake in the 10–50 s period range.[18] We thus further tested the stability of our moment
tensor solution by using a jackknife test [e.g., Efron,1982] to access the possibility that the determined isotro-pic component is due to specific stations [e.g., Dreger etal., 2000; Ichinose et al., 2003; Templeton and Dreger,2006]. We performed the jackknife test which involvedrepeating moment tensor inversions with two differentsource models: (1) shear faulting and (2) shear faulting +isotropic component, by using 6 station subsets obtainedby deleting 3 stations (corresponding to one-third of thetotal number of stations) and calculated the values of Ftest statistic for individual subsets. We considered thesubsets with VR higher than 30% for their preferredsource models (i.e., shear faulting or shear faulting +isotopic component source model) that yield the highestVR, in order to suppress apparent non–double couplecomponents due to poor data quality [Dufumier andRivera, 1997], which we seek to avoid. Our jackknifetest shows that the F test statistic value rages from 1.30 to1.51 for the 90% confidence interval and indicates thatthe lower bound is larger than the 90% confidence level,F90 = 1.29 that was used to identify non–double couplecomponent for the West Thumb earthquake.
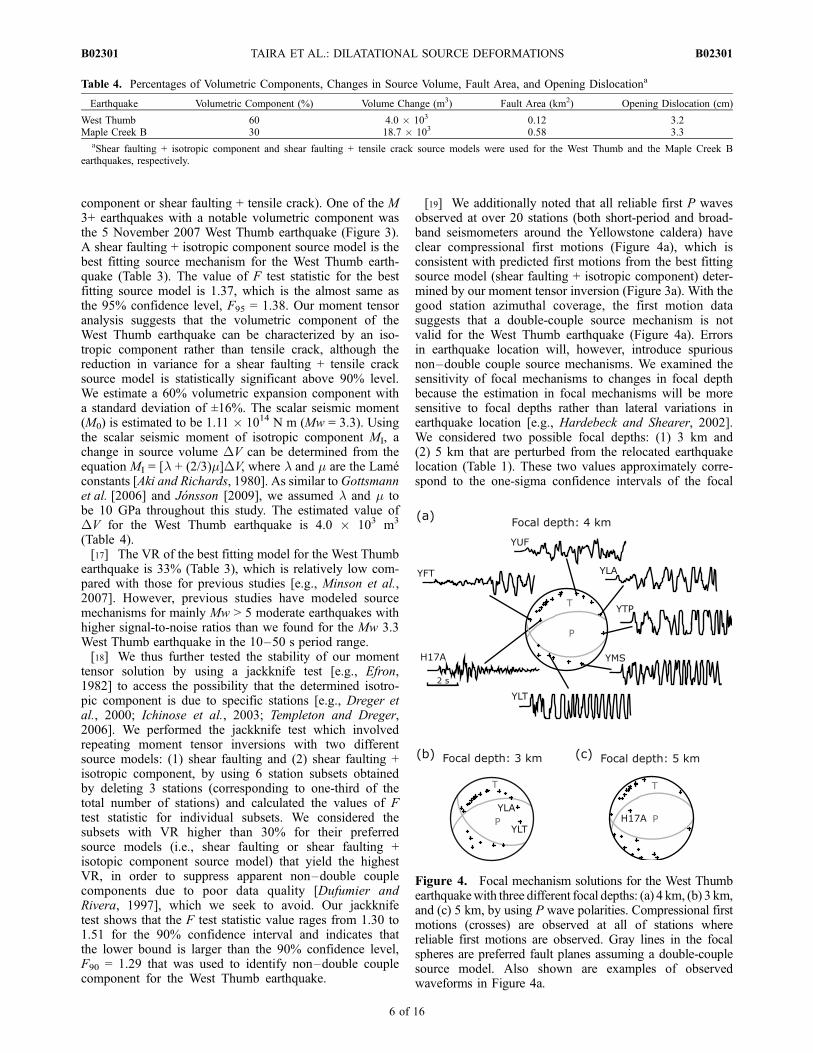
[19] We additionally noted that all reliable first P wavesobserved at over 20 stations (both short-period and broad-band seismometers around the Yellowstone caldera) haveclear compressional first motions (Figure 4a), which isconsistent with predicted first motions from the best fittingsource model (shear faulting + isotropic component) deter-mined by our moment tensor inversion (Figure 3a). With thegood station azimuthal coverage, the first motion datasuggests that a double-couple source mechanism is notvalid for the West Thumb earthquake (Figure 4a). Errorsin earthquake location will, however, introduce spuriousnon–double couple source mechanisms. We examined thesensitivity of focal mechanisms to changes in focal depthbecause the estimation in focal mechanisms will be moresensitive to focal depths rather than lateral variations inearthquake location [e.g., Hardebeck and Shearer, 2002].We considered two possible focal depths: (1) 3 km and(2) 5 km that are perturbed from the relocated earthquakelocation (Table 1). These two values approximately corre-spond to the one-sigma confidence intervals of the focal
Table 4. Percentages of Volumetric Components, Changes in Source Volume, Fault Area, and Opening Dislocationa
Earthquake Volumetric Component (%) Volume Change (m3) Fault Area (km2) Opening Dislocation (cm)
West Thumb 60 4.0 � 103 0.12 3.2Maple Creek B 30 18.7 � 103 0.58 3.3
aShear faulting + isotropic component and shear faulting + tensile crack source models were used for the West Thumb and the Maple Creek Bearthquakes, respectively.
Figure 4. Focal mechanism solutions for the West Thumbearthquakewith three different focal depths: (a) 4 km, (b) 3 km,and (c) 5 km, by using P wave polarities. Compressional firstmotions (crosses) are observed at all of stations wherereliable first motions are observed. Gray lines in the focalspheres are preferred fault planes assuming a double-couplesource model. Also shown are examples of observedwaveforms in Figure 4a.
B02301 TAIRA ET AL.: DILATATIONAL SOURCE DEFORMATIONS
6 of 16
B02301

depth (4 km) for the West Thumb earthquake. We found thatneither the shallow or deep focal depth solution is consistentwith double-couple source mechanisms (Figures 4b and 4c),which supports the non–double couple source model (i.e.,shear faulting + isotropic component) inferred from ourmoment tensor inversion.[20] The other earthquake with a significant volumetric
component occurred on 9 January 2008 referred to here asthe Maple Creek B earthquake, located in the northerncaldera rim area (Figure 5). For this earthquake, a shear
faulting + tensile crack is the best fitting source model(Table 3). The best fitting source model satisfies the F teststatistic for significance above 99% level, F99 = 1.47. Assimilar to the West Thumb earthquake, we assessed thestability of the moment tensor solution by using a jackknifetest with 9 station subsets where 4 stations (approximatelyone-third of the total station number) are deleted. Thejackknife test revealed the value of F statistic ranging from1.33 through 1.82 for the 90% confidence interval. Thecalculated lower bound is larger than the 90% confidence
Figure 5. Same as Figure 3 except for the Maple Creek B earthquake employing shear faulting + tensilecrack source model.
B02301 TAIRA ET AL.: DILATATIONAL SOURCE DEFORMATIONS
7 of 16
B02301

level, F90 = 1.23 that was used to detect non–doublecouple component for the Maple Creek B earthquake. Wefound a 30% (with a standard deviation of ±8%) openingcrack component for the Maple Creek B earthquake with atotal the estimated seismic moment of 6.24 � 1014 N m(Mw 3.8). The volumetric change associated with theMaple Creek B earthquake can be determined throughthe equation MTC = lDV, where MTC is the scalar seismic
moment of the tensile crack component, assuming aPoisson solid (i.e., l = m) [e.g., Chouet, 1996]. Assumingl = 10 GPa, the estimated value of DV for this earthquakeis 18.7 � 103 m3 (Table 4).[21] We found that the remaining three M 3+ Yellowstone
earthquakes could be fitted by source models with non–double couple components, but these did not satisfy F teststatistics for significance above the 90% level (Table 3).
Figure 6. Same as Figure 3 except for the Parker Peak earthquake employing shear faulting source model.
B02301 TAIRA ET AL.: DILATATIONAL SOURCE DEFORMATIONS
8 of 16
B02301

Therefore we interpret these three earthquakes to be typicaltectonic earthquakes. For example, our moment tensorinversion with shear faulting with one volumetric compo-nent source model yields a pure double-couple solution forthe 25 March 2008 Mw 4.2 Parker Peak earthquake, whichstrongly suggested that the Parker Peak earthquake resultedin shear faulting process. Indeed, a shear-faulting sourcemodel explains the observed data well (Figure 6). Anotherimportant result is that CLVD components are unnecessaryfor source mechanisms of all five M 3+ Yellowstone earth-quakes that we examined.
4. Discussion
[22] Using broadband seismic data, we evaluated earth-quake source processes for five M 3+ Yellowstone earth-quakes occurring in the 2004–2008 Yellowstone accelerateduplift episode (Figure 7). As listed in Table 3, our moment
tensor analysis shows that the source mechanisms for two ofthese earthquakes are characterized by significant volumetriccomponents. Principal stress directions for the five M 3+Yellowstone earthquakes examined in this study wereextrapolated from their best fitting source models (Table 5).The uncertainties (one sigma) in principal stress directionsrange from 5 to 30 degrees for the five Yellowstone earth-quakes. A similar northeast-southwest direction of T axis(the maximum extensional stress) was estimated for theMaple Creek A and B earthquakes. The estimated T axisdirections for the five M 3+ Yellowstone earthquakes aregenerally consistent with those for background Yellowstoneseismicity inferred from first-motion focal mechanisms[Waite and Smith, 2004]. Additionally, the T axis directionsdetermined from the moment tensor inversions appear tofollow the long-term strain rotation induced by regionaltectonics [e.g., Zoback and Zoback, 1989; Christiansen,2001] that is northeast-southwest direction in the north rim
Figure 7. Observed Yellowstone accelerated uplift and subsidence during 2004–2006 inferred from theGPS and InSAR data [Chang et al., 2007]. Colors indicate interpolated the satellite line-of-sight (LOS)velocity. Also shown are the estimated best fitting source mechanisms of the M 3+ Yellowstoneearthquakes that we examined. Red and gray stars indicate earthquakes accompanying dilatationaldislocations and tectonic earthquakes (i.e., pure shear dislocation), respectively. White circles are thelocations of microearthquakes that have been interpreted as triggered earthquakes by the inflation of themagmatic sill accompanying the 2004–2008 Yellowstone uplift episode [Chang et al., 2007].
Table 5. Principal Stress Axes With Their Eigenvalues for the Best Fitting Source Modelsa
Earthquake
T Axis I Axis P Axis
Value Trend Plunge Value Trend Plunge Value Trend Plunge
Sour Creek Dome 0.6 229.6 13.1 0 131.5 31.3 �0.6 339.3 55.5West Thumb 1.1 137.1 9.5 0.7 45.8 8.2 0.2 275.6 77.4Maple Creek A 1.6 21.6 14.1 0 143.3 64.5 �1.6 286.1 20.8Maple Creek B 8.8 209.1 6.6 3.5 300.6 12.7 �1.8 92.3 75.7Parker Peak 24.8 41.3 42.1 0 257.8 41.6 �24.8 149.7 19.2
aExtension is positive for stresses. Eigenvalues are given in 1014 N m. Trends and plunges are given in degrees clockwise from north and degrees belowhorizontal, respectively.
B02301 TAIRA ET AL.: DILATATIONAL SOURCE DEFORMATIONS
9 of 16
B02301
of the Yellowstone caldera (i.e., the Maple Creek A and Bearthquakes) to east-west direction in the central part of thecaldera (i.e., the Sour Creek Dome and West Thumb earth-quakes). Regardless of the presence of coseismic volumetricchanges, the fault slip directions for the M 3+ Yellowstoneearthquakes in this study seem to be controlled by regionaltectonic processes rather than local hydrothermal processes.[23] One of the unusual earthquakes with a notable volu-
metric component is the 5 November 2007 Mw 3.3 WestThumb earthquake whose volumetric change is estimated tobe 60%. The amount of volumetric component is a similar toone for a Mw 5.3 earthquake that has been hypothesized tobe related to the eruption process of Miyakejima, Japan,2000 [Minson et al., 2007]. The best fitting source model forthe West Thumb earthquake is a shear faulting + isotropiccomponent; it is therefore possible to estimate the size of theopening dislocation D?, across the fault area by utilizingscalar seismic moments of shear dislocation and isotropiccomponent. The characteristic rupture dimension ~L can beexpressed as [e.g., Lay and Wallace, 1995]
~L � MDC=Dsð Þ1=3; ð3Þ
where MDC and Ds are a scalar seismic moment of double-couple component and a static stress drop, respectively.Following Prejean and Ellsworth [2001] and Ide et al.[2003], we assumed Ds to be 1 MPa throughout this study.The estimated value of ~L is �350 m and D? is thenevaluated to be 3.2 cm based on the equation, D? = DV/~L2
[Dreger et al., 2000] given a change in source volume (DV)of 4.0 � 103 m3 (Table 4), and the fault area (~L2) iscalculated to be 0.12 km2 for the West Thumb earthquake.[24] The West Thumb earthquake was located on the
south side of the deformation area accompanying the2004–2008 Yellowstone uplift episode and was also closeto the West Thumb Geyser basin (Figure 7). The observedrapid deformation signals measured by GPS and InSARwere modeled as an inflating 60 km by 35 km sill located ata depth of 10 km beneath the Yellowstone caldera [Chang etal., 2007] and coincident with the top of the tomographi-cally imaged crustal magma chamber proposed by Husen etal. [2004a]. Geochemical studies indicated that hydrother-mal reservoirs may exist around the focal depth (4 km) of
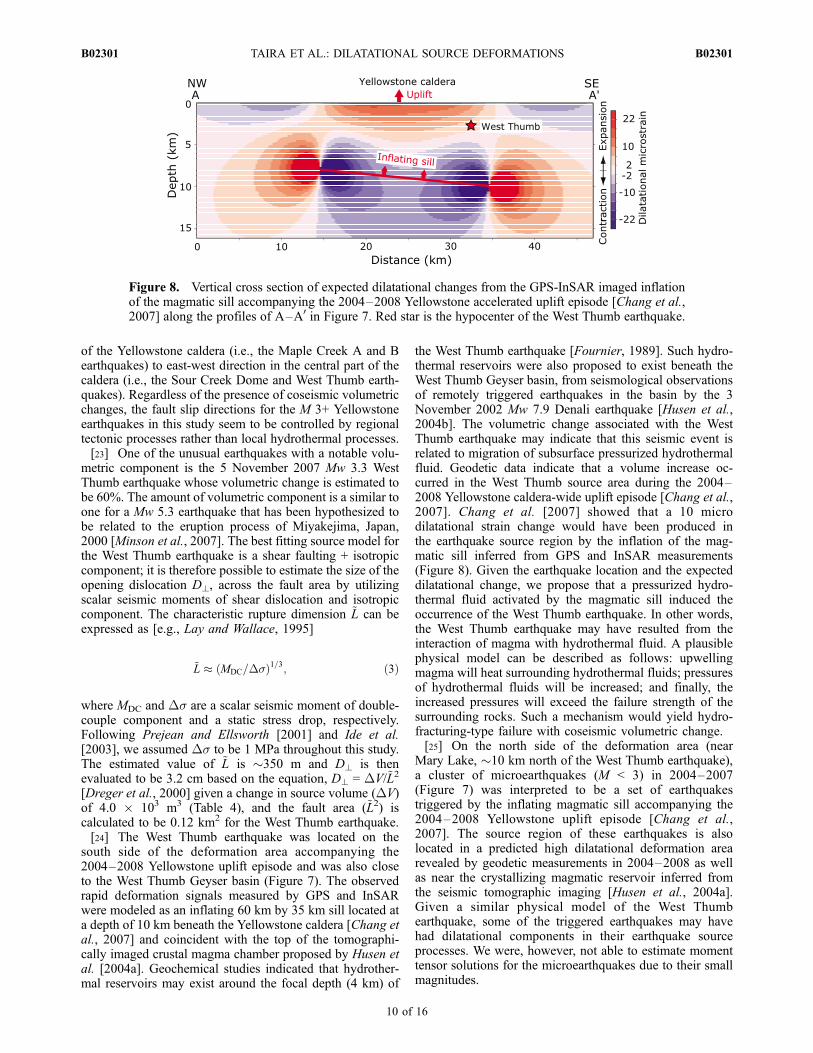
the West Thumb earthquake [Fournier, 1989]. Such hydro-thermal reservoirs were also proposed to exist beneath theWest Thumb Geyser basin, from seismological observationsof remotely triggered earthquakes in the basin by the 3November 2002 Mw 7.9 Denali earthquake [Husen et al.,2004b]. The volumetric change associated with the WestThumb earthquake may indicate that this seismic event isrelated to migration of subsurface pressurized hydrothermalfluid. Geodetic data indicate that a volume increase oc-curred in the West Thumb source area during the 2004–2008 Yellowstone caldera-wide uplift episode [Chang et al.,2007]. Chang et al. [2007] showed that a 10 microdilatational strain change would have been produced inthe earthquake source region by the inflation of the mag-matic sill inferred from GPS and InSAR measurements(Figure 8). Given the earthquake location and the expecteddilatational change, we propose that a pressurized hydro-thermal fluid activated by the magmatic sill induced theoccurrence of the West Thumb earthquake. In other words,the West Thumb earthquake may have resulted from theinteraction of magma with hydrothermal fluid. A plausiblephysical model can be described as follows: upwellingmagma will heat surrounding hydrothermal fluids; pressuresof hydrothermal fluids will be increased; and finally, theincreased pressures will exceed the failure strength of thesurrounding rocks. Such a mechanism would yield hydro-fracturing-type failure with coseismic volumetric change.[25] On the north side of the deformation area (near
Mary Lake, �10 km north of the West Thumb earthquake),a cluster of microearthquakes (M < 3) in 2004–2007(Figure 7) was interpreted to be a set of earthquakestriggered by the inflating magmatic sill accompanying the2004–2008 Yellowstone uplift episode [Chang et al.,2007]. The source region of these earthquakes is alsolocated in a predicted high dilatational deformation arearevealed by geodetic measurements in 2004–2008 as wellas near the crystallizing magmatic reservoir inferred fromthe seismic tomographic imaging [Husen et al., 2004a].Given a similar physical model of the West Thumbearthquake, some of the triggered earthquakes may havehad dilatational components in their earthquake sourceprocesses. We were, however, not able to estimate momenttensor solutions for the microearthquakes due to their smallmagnitudes.
Figure 8. Vertical cross section of expected dilatational changes from the GPS-InSAR imaged inflationof the magmatic sill accompanying the 2004–2008 Yellowstone accelerated uplift episode [Chang et al.,2007] along the profiles of A–A0 in Figure 7. Red star is the hypocenter of the West Thumb earthquake.
B02301 TAIRA ET AL.: DILATATIONAL SOURCE DEFORMATIONS
10 of 16
B02301

[26] Similar to the West Thumb earthquake, the estimated30% of opening crack component for the 9 January 2008Mw 3.8 Maple Creek B earthquake suggests pressurizationof a fluid-saturated fault [e.g., Dreger et al., 2000]. Theestimated source mechanism for the Maple Creek B earth-quake is 70% of normal faulting (dip of 65 degrees) and30% opening tensile crake (Figure 9). For a shear faulting +tensile crack source model, a fault slips with one shear andone tensile dislocations (Appendix A). We are therefore ableto estimate the value of tensile dislocation (i.e., slip normalto the shear plane) by making use of scalar seismic momentsof shear and tensile dislocations. Using equation (3), thecharacteristic rupture dimension ~L, was estimated to be760 m with a static stress drop of 1 MPa. Given m =10 GPa, the slip parallel to the fault plane D//, is thenevaluated to be 7.6 cm, through the equation, MDC = m~L2D//
(equation (A7) in Appendix A). The opening dislocation(tensile displacement) D?, is estimated to be 3.3 cm basedon MTC = l~L2D? (equation (A8) in Appendix A), assumingl = 10 GPa. Our moment tensor inversion indicates a 3.3 cmopening tensile dislocation over the fault area (~L2) of0.58 km2 accompanying the Maple Creek B earthquake(Table 4).[27] The Maple Creek B earthquake occurred in a se-
quence of over 150 earthquakes with M > 1 that occurredover approximately three weeks from 25 December 2007through 15 January 2008 (Figure 10), with most earthquakeoccurring in a 2 km radius volume. The 31 December 2007Mw 3.4 earthquake, named the Maple Creek A earthquake,occurred a week before the Maple Creek B earthquake. Asshown in Table 3, the best fitting source model for theMaple Creek A earthquake is determined to be purely shearfaulting (i.e., tectonic earthquake), in contrast to the shearfaulting + tensile crack source model for the Maple Creek Bearthquake. Both earthquakes appear to have a northerly
striking nodal plane based on the northwest-southeastalignment of the seismicity of the earthquake sequence(Figure 11a).[28] Focal mechanisms for 11 other M 2+ earthquakes in
this earthquake sequence were determined from P wave firstmotions (Figure 10) using the computer program HASH[Hardebeck and Shearer, 2002] where a double-couplesource model is assumed. The source mechanisms of thelatter eight M 2+ are similar to the estimated double-couplecomponent of the Maple Creek B earthquake. Given thissimilarity, these eight earthquakes could have a similarvolumetric component (opening crack) to that was identi-fied in the source mechanism of the Maple Creek Bearthquake.[29] The estimated focal depths of the Maple Creek A
and B earthquakes are 9.9 km and 9.3 km, respectively(Figure 11b). These focal depths are relatively deeper thanthose for background seismicity (�5 km focal depth) in andaround the Yellowstone caldera [Husen and Smith, 2004].We estimated the depth of the brittle-ductile transition usingfocal depths of background seismicity. We determined thetransition depth by two thresholds: the depth above which80%, h80% and 95%, h95%, of earthquakes occur. h80% hasbeen used for estimating the transition depth for around theYellowstone caldera [Smith and Bruhn, 1984] while h95%for active fault zones [e.g., Rolandone et al., 2004]. Weestimated the depths of h80% and h95% from �2000 earth-quakes that occurred during 2003–2008 in a 20 km x 20km area (Figure 1) centered on the epicenter of the MapleCreek B earthquake. The estimated depths of the brittle-ductile transition are 8.7 km and 9.4 km for h80% and h95%,respectively (Figure 11b), after applying an earthquakerelocation procedure similar to those for the analyzed M3+ Yellowstone earthquakes. Given these depths, the focaldepths of the Maple Creek A and B earthquakes appear to
Figure 9. Schematic views of the modeled source mechanism of the Maple Creek B earthquake.(a) Normal faulting, (b) opening tensile crack, and (c) the best fitting source model combining normalfaulting and opening tensile crack with their expected focal mechanisms. Solid and broken arrows are slipvectors for shear failure and opening tensile components, respectively.
B02301 TAIRA ET AL.: DILATATIONAL SOURCE DEFORMATIONS
11 of 16
B02301

be near the brittle-ductile transition zone around the sourceregion. In the transition zone of brittle-ductile deformation,a temperature is estimated to be �400�C in and around theYellowstone caldera [Smith and Bruhn, 1984; Smith et al.,2009] where hydrothermal fluid should play an importantrole in the nucleation process of earthquakes.[30] The source region of the Maple Creek A and B
earthquakes also appears to be marked by a low P wavevelocity (�1.0%) [Husen et al., 2004a], although the depthof the low P wave velocity anomaly was not well con-strained. Jung and Green [2004] proposed through labora-tory experiments that a low seismic velocity anomaly areawith high temperature can be explained by a spatial clus-tering of microcracks that makes fluid flow more likely.Although other explanations for the low P wave velocityanomaly are possible, our preferred interpretation is that thelow P wave velocity anomaly around the source regionrepresents a region of concentrated microcracks in a similarmanner to Jung and Green [2004]. Jung and Green [2004]also found seismic events in samples whose nucleationprocess induces a shear faulting + tensile cracking, whichis consistent with the best fitting source model for the MapleCreek B earthquake determined by our moment tensorinversion (Figure 9).[31] We further infer that the absence of a coseismic
volumetric change for the Maple Creek A earthquake isrelated to a temporal change in fracture permeability in thecountry rock surrounding the source region. In the laterstage of the earthquake sequence, the fracture permeabilitycould have been greater than in the first stage. We examinedthe predicted coseismic static stress change (Coulombfailure stress change) DsCFF induced by the Maple Creek
A earthquake. Following King et al. [1994] and Harris[1998], DsCFF can be expressed as
DsCFF ¼ Dts þ mf Dsn �B
3Dskk
� �; ð4Þ
where Dts andDsn are the shear and the fault normal stresschanges, respectively. mf is the frictional coefficient and B isthe Skempton coefficient. Dskk is the volumetric stresschange. We assumed mf = 0.75 and B = 0.5 [e.g., Roeloffs,1996]. To calculate Dts and Dsn, we used an elastic half-space model [Okada, 1992] with the characteristic rupturedimension ~L, and the slip on the fault, D = M0/m~L2 [Aki andRichards, 1980]. Given Ds = 1 MPa, the estimated value of~L for the Maple Creek A earthquake is 540 m usingequation (3), and D is then estimated to be 5.4 cm, assumingm = 10 GPa. We find that DsCFF is as large as 0.05 MPa forsites several kilometers distant from the rupture area of theMaple Creek A earthquake. Elkhoury et al. [2006] showedthat stress on the order of 0.01–0.1 MPa can cause changesin permeability of fractured rock. We hypothesize that theMaple Creek A earthquake created new microfractures nearthe source region, which in turn encouraged the tensiledislocation for the Maple Creek B earthquake.[32] As noted above, a high-pressurized fluid injection
should be needed to trigger an earthquake with coseismicvolumetric change such as the Maple Creek B earthquake.The pressure gradient induced by the inflation of themagmatic sill, accompanying the 2004–2008 accelerateduplift episode, beneath the Yellowstone caldera could havecaused subsurface fluid migrations outward to the Yellow-
Figure 10. Magnitude-time plot for the earthquake sequence including the Maple Creek A and Bearthquakes. Also shown are double-couple source mechanisms for elevenM 2+ (gray focal mechanisms)derived from HASH and the best fitting source mechanisms for the Maple Creek A and B earthquakes(black focal mechanisms) determined by our moment tensor inversion.
B02301 TAIRA ET AL.: DILATATIONAL SOURCE DEFORMATIONS
12 of 16
B02301

stone caldera. For example, the largest historic earthquakeswarm in Yellowstone National Park (the autumn 1985earthquake swarm), occurred at 5–10 km south of thesource region of the Maple Creek A and B earthquakes,was interpreted as induced by a migration of hydrothermalfluid outward from the Yellowstone caldera, based on theobserved rate of migration of seismicity and the associationwith a change in caldera deformation from uplift to subsi-
dence [Waite and Smith, 2002]. The estimated average rateof volumetric change accompanying the 2004–2008 calde-ra-wide crustal deformation was �0.1 km3/a [Chang et al.,2007], which is nearly an order of magnitude greater thanthose for earlier episodes of caldera deformation [e.g., Wickset al., 2006]. Given this high rate, it is reasonable make asimilar inference to the autumn 1985 earthquake swarm thatpressure changes resultant from an inflating magma sillwere sufficient to drive pressurized hydrothermal fluidsfrom beneath the caldera into the source region.[33] We show that the West Thumb and Maple Creek B
earthquakes are the first dilatational source earthquakes tobe identified in Yellowstone National Park since the mon-itoring of Yellowstone seismicity began in 1973. The lack ofa high-quality broadband seismic network prior to the 2000sprevented assessments of moment tensors prior to this study.The subsurface dilatational deformations that we detectedare important for hazard mitigation of Yellowstone NationalPark because dilatational source earthquakes may eventuallybe related and lead to hydrothermal explosions that areconsidered to be a serious hazard. If appropriate broadbandseismic data are available, the moment tensor inversionswith variable different source models that we used wouldhelp in the evaluation in dilatational dislocation componentsin earthquake source processes and may thus be useful formonitoring subsurface dilatational deformations and volca-nic hazard assessment.
5. Conclusions
[34] We examined five M 3+ earthquakes in YellowstoneNational Park during the 2004–2008 period of accelerateduplift using moment tensor inversion. With the benefit ofhigh-quality broadband seismic data, our inversion resultsrevealed that the 5 November 2007 Mw 3.3 West Thumband the 9 January 2008 Mw 3.8 Maple Creek B earthquakesexperienced notable coseismic volumetric changes, suggest-ing injections of high-pressurized fluid in their earthquakesource processes. The fluid migrations were likely inducedby the inflation of the magmatic sill beneath the Yellow-stone caldera that was modeled by GPS and InSAR meas-urements [Chang et al., 2007].[35] For the Mw 3.3 West Thumb earthquake, a notable
60% isotropic expansion component was estimated with a3.2 cm opening dislocation across the fault area of 0.12 km2.The location of the Mw 3.3 West Thumb earthquake is in anarea of expected dilatational change (�10 microstrain)induced by the magmatic sill, which is consistent with theestimated isotropic expansion component in the sourcemechanism of the West Thumb earthquake. We suggestthat the inflation of a magmatic sill which activated a porepressure change (or a fluid migration) that encouraged theMw 3.3 West Thumb dilatational source earthquake.[36] The estimated source mechanism for the Mw 3.8
Maple Creek B earthquake is a combination of 70% normalfaulting and 30% opening tensile component. The amountof the tensile (dilatational) dislocation is equivalent to a 3.3cm opening crack over the fault area of 0.58 km2. Wepropose that the coseismic stress change (�0.05 MPa)resultant from the preceding Mw 3.4 Maple Creek Aearthquake created new microfractures that increased frac-ture permeability, coupled with pressurized fluids, induced a
Figure 11. (a) Map view of the earthquake sequenceincluding the Maple Creek A and B earthquakes during thetime period of December 25, 2007 through January 15,2008. Dots and triangles are the locations of earthquakesand seismometers (both short-period and broadband sta-tions), respectively. Also shown are the 0.64 million yearYellowstone caldera boundary (solid black line) and theQuaternary faults (gray lines). (b) X–X0 vertical crosssection of the area shown by black rectangle in Figure 11a.Dashed black and gray lines are the depth of the brittle-ductile transition inferred from h80% and h95% (see text),respectively.
B02301 TAIRA ET AL.: DILATATIONAL SOURCE DEFORMATIONS
13 of 16
B02301

dilatational dislocation accompanying the Mw 3.8 MapleCreek B earthquake.
Appendix A: Shear-Faulting and Tensile CrackSource Model
[37] Following Dufumier and Rivera [1997] and Minsonet al. [2007], we here describe moment tensor elements for ashear faulting + tensile crack source model. This sourcemodel is represented by a combination of one shear dislo-cation and one tensile dislocation. In the source model, thedirection of tensile dislocation is normal to the shear plane(Figure A1). A slip vector of the source model s, can beexpressed by
s ¼ cosanþ sinat; ðA1Þ
where n and t are the normal vector to the shear plane andthe slip vector of a shear dislocation, respectively; a is theangle of s from n (Figure A1). For a = 90�, a sourcemechanism becomes a pure double couple while a puretensile crack for a = 0� (opening crack) or a = 180� (closingcrack). The seismic moment tensor M, with a fault area S,and a slip D, is given by [Aki and Richards, 1980]
M ¼ SD l s � nð ÞIþ m nsT þ snT� ��
; ðA2Þ
where the superscript T represents the vector transpose andthe dot in the numerator denotes the dot product; I is theidentity matrix; l and m are the Lame constants,respectively. In a principal axes coordinate system, M canbe expressed by
M ¼ SD
l cosaþ m cosa� 1ð Þ 0 0
0 l cosa 0
0 0 l cosaþ m cosaþ 1ð Þ
24
35:ðA3Þ
[38] The moment tensor decomposition of M can bewritten as
M ¼ MDC þMTC; ðA4Þ
where MDC and MTC are the moment tensors of shear andtensile dislocations, respectively. Using the fault orientationparameters: strike (f) and dip (d) of Aki and Richards[1980] with a Poisson solid (i.e., l = m), moment tensorelements for MTC in Cartesian coordinates:
MTC ¼MTC
xx MTCxy MTC
xz
MTCxy MTC
yy MTCyz
MTCxz MTC
yz MTCzz
264
375; ðA5Þ
where
MTCxx ¼ 1þ 2 sin2 d sin2 f
� �MTC;
MTCxy ¼ � sin2 d sin 2f
� �MTC;
MTCyy ¼ 1þ 2 sin2 d cos2 f
� �MTC;
MTCxz ¼ sin 2d sinfð ÞMTC;
MTCyz ¼ � sin 2d cosfð ÞMTC;
MTCzz ¼ 1þ 2 cos2 d
� �MTC: ðA6Þ
Those for MDC can be seen in the work of Aki and Richards[1980] or Lay and Wallace [1995].[39] From equation (A3), scalar seismic moments for
double-couple MDC (a = 90�) and tensile crack MTC (a =0� or a = 180�) components can be defined as
MDC ¼ mSD==; ðA7Þ
MTC ¼ lSD?; ðA8Þ
where D// and D? are the fault parallel and the normal slipcomponents of D, respectively.
[40] Acknowledgments. We thank the staff of the University of Utahseismograph stations for routinely picking arrival times of the Yellowstoneearthquake catalog. The National Park Service cooperated in operating theYellowstone seismic network. G. P. Waite provided a constructive review ofan early draft of this manuscript. We would like to thank B. A. Chouet forproviding us with the three-dimensional finite difference code and J. M.Farrell and J. C. Pechmann for discussions. Careful reviews by S. D.Malone and an anonymous reviewer greatly improved this manuscript.A software package, Generic Mapping Tools (GMT) [Wessel and Smith,1998], was used for plotting figures. The present study was supported bythe National Science Foundation Continental Dynamics Program undergrant EAR-0314237 and The Brinson Foundation.
ReferencesAki, K., and P. G. Richards (1980), Quantitative Seismology, Freeman, NewYork.
Benz, H. M., and R. B. Smith (1984), Simultaneous inversion for lateralvelocity variations and hypocenters in the Yellowstone region usingearthquake and refraction data, J. Geophys. Res., 89, 1208 –1220,doi:10.1029/JB089iB02p01208.
Bouchon, M., and K. Aki (1977), Discrete wave-number representation ofseismic-source wave fields, Bull. Seismol. Soc. Am., 67, 259–277.
Chang, W.-L., R. B. Smith, C. Wicks, J. M. Farrell, and C. M. Puskas(2007), Accelerated uplift and magmatic intrusion of the Yellowstonecaldera, 2004 to 2006, Science, 318, 952 – 956, doi:10.1126/science.1146842.
Figure A1. A schematic view of shear faulting + tensilecrack source model; t is the slip vector of shear dislocation(arrow); n is the normal vector to the shear plane (dashedarrow); s is the slip vector of the described source model(solid arrow). The slip of tensile crack dislocation is parallelto the normal vector.
B02301 TAIRA ET AL.: DILATATIONAL SOURCE DEFORMATIONS
14 of 16
B02301

Chouet, B. A. (1996), New methods and future trends in seismologicalvolcano monitoring, in Monitoring and Mitigation of Volcano Hazards,edited by R. Scarpa and R. Tilling, pp. 23–97, Springer, New York.
Christiansen, R. L. (2001), The Quaternary and Pliocene YellowstonePlateau volcanic field of Wyoming, Idaho, and Montana, U.S. Geol. Surv.Prof. Pap. 729-G, 1–145.
Clawson, S. R., R. B. Smith, and H. M. Benz (1989), P wave attenuation ofthe Yellowstone caldera from three-dimensional inversion of spectraldecay using explosion source seismic data, J. Geophys. Res., 94(B6),7205–7222, doi:10.1029/JB094iB06p07205.
DeNosaquo, K. R., R. B. Smith, and A. R. Lowry (2009), Density andlithospheric strength models of the Yellowstone-Snake River Plain volcanicsystem from gravity and heat flow data, J. Volcanol. Geotherm. Res., 188,108–127, doi:10.1016/j.jvolgeores.2009.08.006.
Doser, D. I. (1985), Source parameters and faulting processes of the 1959Hebgen Lake, Montana, earthquake sequence, J. Geophys. Res., 90(B6),4537–4556, doi:10.1029/JB090iB06p04537.
Dreger, D. S., H. Tkalcic, and M. Johnston (2000), Dilatational processesaccompanying earthquakes in the Long Valley caldera, Science, 288,122–125, doi:10.1126/science.288.5463.122.
Dufumier, H., and L. Rivera (1997), On the resolution of the isotropiccomponent in moment tensor inversion, Geophys. J. Int., 131, 595–606, doi:10.1111/j.1365-246X.1997.tb06601.x.
Dzurisin, D., K. M. Yamashita, and J. W. Kleinman (1994), Mechanisms ofcrustal uplift and subsidence at the Yellowstone caldera, Wyoming, Bull.Volcanol., 56, 261–270, doi:10.1007/BF00302079.
Efron, B. (1982), The Jackknife, the Bootstrap and Other ResamplingPlans, Soc. for Ind. and Appl. Math., Philadelphia, Pa.
Efron, B., and R. J. Tibshirani (1993), An Introduction to the Bootstrap,Monogr. Stat. Appl. Probab, vol. 57, Chapman and Hall, New York.
Elkhoury, J. E., E. E. Brodsky, and D. C. Agnew (2006), Seismicwaves increase permeability, Nature, 441, 1135–1138, doi:10.1038/nature04798.
Farrell, J., S. Husen, and R. B. Smith (2009), Earthquake swarm and b-valuecharacterization of the Yellowstone volcano-tectonic system, J. Volcanol.Geotherm. Res., 188, 260–276, doi:10.1016/j.jvolgeores.2009.08.008.
Ford, S. R., D. S. Dreger, and W. R. Walter (2009), Identifying isotropicevents using a regional moment tensor inversion, J. Geophys. Res., 114,B01306, doi:10.1029/2008JB005743.
Foulger, G. E., B. R. Julian, D. P. Hill, A. M. Pitt, P. E. Malin, andE. Shalev (2004), Non-double-couple microearthquakes at Long Valleycaldera, California, provide evidence for hydraulic fracturing, J. Volcanol.Geotherm. Res., 132, 45–71, doi:10.1016/S0377-0273(03)00420-7.
Fournier, R. O. (1989), Geochemistry and dynamics of the YellowstoneNational Park hydrothermal system, Annu. Rev. Earth Planet. Sci., 17,13–53, doi:10.1146/annurev.ea.17.050189.000305.
Gottsmann, J., A. G. Camacho, K. F. Tiampo, and J. Fernandez (2006),Spatiotemporal variations in vertical gravity gradients at the CampiFlegrei caldera (Italy): A case for source multiplicity during unrest?,Geophys. J. Int., 167, 1089–1096, doi:10.1111/j.1365-246X.2006.03157.x.
Hardebeck, J. L., and P. M. Shearer (2002), A new method for determiningfirst-motion focal mechanisms, Bull. Seismol. Soc. Am., 92, 2264–2276,doi:10.1785/0120010200.
Harris, R. A. (1998), Introduction to special section: Stress triggers, stressshadows, and implications for seismic hazard, J. Geophys. Res.,103(B10), 24,347–24,358, doi:10.1029/98JB01576.
Hill, D. P., J. O. Langbein, and S. Prejean (2003), Relations betweenseismicity and deformation during unrest in Long Valley caldera,California, from 1995 through 1999, J. Volcanol. Geotherm. Res., 127,175–193, doi:10.1016/S0377-0273(03)00169-0.
Husen, S., and R. B. Smith (2004), Probabilistic earthquake relocation inthree-dimensional velocity models for the Yellowstone National Parkregion, Wyoming, Bull. Seismol. Soc. Am., 94, 880–896, doi:10.1785/0120030170.
Husen, S., R. B. Smith, and G. P. Waite (2004a), Evidence for gas andmagmatic sources beneath the Yellowstone volcanic field from seismictomographic imaging, J. Volcanol. Geotherm. Res., 131, 397 –410,doi:10.1016/S0377-0273(03)00416-5.
Husen, S., S. Wiemer, and R. B. Smith (2004b), Remotely triggered seis-micity in the Yellowstone National Park region by the 2002 Mw 7.9Denali fault earthquake, Alaska, Bull. Seismol. Soc. Am., 94, S317–S331, doi:10.1785/0120040617.
Ichinose, G. A., J. G. Anderson, K. D. Smith, and Y. Zeng (2003), Sourceparameters of eastern California and western Nevada earthquakes fromregional moment tensor inversion, Bull. Seismol. Soc. Am., 93, 61–84,doi:10.1785/0120020063.
Ide, S., G. C. Beroza, S. G. Prejean, and W. L. Ellsworth (2003), Apparentbreak in earthquake scaling due to path and site effects on deep boreholerecordings, J. Geophys. Res., 108(B5), 2271, doi:10.1029/2001JB001617.
Jonsson, S. (2009), Stress interaction between magma accumulation andtrapdoor faulting on Sierra Negra volcano, Galapagos, Tectonophysics,471, 36–44, doi:10.1016/j.tecto.2008.08.005.
Julian, B. R., and S. A. Sipkin (1985), Earthquake processes in the LongValley caldera area, California, J. Geophys. Res., 90(B13), 11,155–11,169, doi:10.1029/JB090iB13p11155.
Julian, B. R., A. D. Miller, and G. R. Foulger (1998), Non-double-coupleearthquakes: 1. Theory, Rev. Geophys., 36, 525 –549, doi:10.1029/98RG00716.
Jung, H., and H. W. Green (2004), Experimental faulting of serpentiniteduring dehydration: Implications for earthquakes, seismic low-velocityzones, and anomalous hypocenter distributions in subduction zones, Int.Geol. Rev., 46, 1089–1102, doi:10.2747/0020-6814.46.12.1089.
Kanamori, H., G. Ekstrom, A. Dziewonski, J. S. Barker, and S. A. Sipkin(1993), Seismic radiation by magma injection: An anomalous seismicevent near Tori Shima, Japan, J. Geophys. Res., 98(B4), 6511–6522,doi:10.1029/92JB02867.
King, G. C. P., R. S. Stein, and J. Lin (1994), Static stress changes and thetriggering of earthquakes, Bull. Seismol. Soc. Am., 84, 935–953.
Lay, T., and T. C. Wallace (1995), Modern Global Seismology, Academic,London.
Lomax, A., A. Zollo, P. Capuano, and J. Virieux (2001), Precise, absoluteearthquake location under Somma-Vesuvius volcano using a new 3Dvelocity model, Geophys. J. Int., 146, 313–331, doi:10.1046/j.0956-540x.2001.01444.x.
Menke, W. (1989), Geophysical Data Analysis: Discrete Inverse Theory,Academic, San Diego, Calif.
Miller, A. D., B. R. Julian, and G. R. Foulger (1998), Three-dimensionalseismic structure and moment tensors of non-double-couple earthquakesat the Hengill-Grensdalur volcanic complex, Iceland, Geophys. J. Int.,133, 309–325, doi:10.1046/j.1365-246X.1998.00492.x.
Miller, D. S., and R. B. Smith (1999), P and S velocity structure of theYellowstone volcanic field from local earthquake and controlled-sourcetomography, J. Geophys. Res., 104(B7), 15,105–15,121, doi:10.1029/1998JB900095.
Minson, S. E., D. S. Dreger, R. Burgmann, H. Kanamori, and K. M. Larson(2007), Seismically and geodetically determined nondouble-couplesource mechanisms from the 2000 Miyakejima volcanic earthquakeswarm, J. Geophys. Res., 112, B10308, doi:10.1029/2006JB004847.
Morgan, P., D. D. Blackwell, R. E. Spafford, and R. B. Smith (1977), Heatflow measurements in Yellowstone Lake and the thermal structure of theYellowstone caldera, J. Geophys. Res., 82(26), 3719–3732, doi:10.1029/JB082i026p03719.
Ohminato, T., and B. A. Chouet (1997), A free-surface boundary conditionfor including 3D topography in the finite difference method, Bull. Seis-mol. Soc. Am., 87, 494–515.
Okada, Y. (1992), Internal deformation due to shear and tensile faults in ahalf-space, Bull. Seismol. Soc. Am., 82, 1018–1040.
Pelton, J. R., and R. B. Smith (1979), Recent crustal uplift recent crustaluplift in Yellowstone National Park, Science, 206, 1179 – 1182,doi:10.1126/science.206.4423.1179.
Pitt, A. M., C. S. Weaver, and W. Spence (1979), The Yellowstone Parkearthquake of June 30, 1975, Bull. Seismol. Soc. Am., 69, 187–205.
Prejean, S. G., and W. L. Ellsworth (2001), Observations of earthquakesource parameters at 2 km depth in the Long Valley caldera, easternCalifornia, Bull. Seismol. Soc. Am., 91, 165 – 177, doi:10.1785/0120000079.
Puskas, C. M., R. B. Smith, C. M. Meertens, and W. L. Chang (2007),Crustal deformation of the Yellowstone –Snake River Plain volcano-tectonic system: Campaign and continuous GPS observations, 1987–2004, J. Geophys. Res., 112, B03401, doi:10.1029/2006JB004325.
Roeloffs, E. (1996), Poroelastic techniques in the study of earthquake-related hydrological phenomena, Adv. Geophys., 37, 135–195.
Roeloffs, E., M. Sneed, D. L. Galloway, M. L. Sorey, C. D. Farrar, J. F.Howle, and J. Hughes (2003), Water-level changes induced by local anddistant earthquakes at Long Valley caldera, California, J. Volcanol.Geotherm. Res., 127, 269–303, doi:10.1016/S0377-0273(03)00173-2.
Rolandone, F., R. Burgmann, and R. M. Nadeau (2004), The evolution ofthe seismic-aseismic transition during the earthquake cycle: Constraintsfrom the time-dependent depth distribution of aftershocks, Geophys. Res.Lett., 31, L23610, doi:10.1029/2004GL021379.
Ross, A., G. R. Foulger, and B. R. Julian (1996), Non-double-couple earth-quake mechanisms at the Geysers geothermal area, California, Geophys.Res. Lett., 23, 877–880, doi:10.1029/96GL00590.
Silver, P. G., and W. W. Chan (1991), Shear wave splitting and subconti-nental mantle deformation, J. Geophys. Res., 96(B10), 16,429–16,454,doi:10.1029/91JB00899.
Smith, R. B., and W. J. Arabasz (1991), Seismicity of the intermountainseismic belt, in Neotectonics of North America, Decade Map, vol. 1,
B02301 TAIRA ET AL.: DILATATIONAL SOURCE DEFORMATIONS
15 of 16
B02301

edited by D. B. Slemmons et al., pp. 185–228, Geol. Soc. of Am.,Boulder, Colo.
Smith, R. B., and R. L. Bruhn (1984), Intraplate extensional tectonics of theEastern Basin-Range: Inferences on structural style from seismic reflec-tion data, regional tectonics, and thermal-mechanical models of brittle-ductile deformation, J. Geophys. Res., 89(B7), 5733–5762, doi:10.1029/JB089iB07p05733.
Smith, R. B., and M. Sbar (1974), Contemporary tectonics and seismicity ofthe western United States with emphasis on the Intermountain SeismicBelt, Bull. Seismol. Soc. Am., 85, 1205–1218.
Smith, R. B., M. Jordan, B. Steinberger, C. M. Puskas, J. Farrell,G. P. Waite, S. Husen, W.-L. Chang, and R. O’Connell (2009), Geo-dynamics of the Yellowstone hotspot and mantle plume: Seismic andGPS imaging, kinematics, and mantle flow, J. Volcanol. Geotherm.Res., 188, 26–56, doi:10.1016/j.jvolgeores.2009.08.020.
Templeton, D. C., and D. S. Dreger (2006), Non-double-couple earthquakesin the Long Valley volcanic region, Bull. Seismol. Soc. Am., 96, 69–79,doi:10.1785/0120040206.
Vasco, D. W., C. M. Puskas, R. B. Smith, and C. M. Meertens (2007),Crustal deformation and source models of the Yellowstone volcanic fieldfrom geodetic data, J. Geophys. Res., 112, B07402, doi:10.1029/2006JB004641.
Waite, G. P., and R. B. Smith (2002), Seismic evidence for fluid migrationaccompanying subsidence of the Yellowstone caldera, J. Geophys. Res.,107(B9), 2177, doi:10.1029/2001JB000586.
Waite, G. P., and R. B. Smith (2004), Seismotectonics and stress field of theYellowstone volcanic plateau from earthquake first-motion and otherindicators, J. Geophys. Res., 109, B02301, doi:10.1029/2003JB002675.
Waite, G. P., R. B. Smith, and R. M. Allen (2006), VP and VS structure ofthe Yellowstone hot spot from teleseismic tomography: Evidence for an
upper mantle plume, J. Geophys. Res., 111, B04303, doi:10.1029/2005JB003867.
Wessel, P., and W. H. F. Smith (1998), New, improved version of genericmapping tools released, Eos Trans. AGU, 79(47), 579, doi:10.1029/98EO00426.
Wicks, C., W. Thatcher, and D. Dzurisin (1998), Migration of fluids be-neath Yellowstone caldera inferred from satellite radar interferometry,Science, 282, 458–462, doi:10.1126/science.282.5388.458.
Wicks, C., W. Thatcher, D. Dzurisin, and J. Svarc (2006), Uplift, thermalunrest, and magma intrusion at Yellowstone caldera, Nature, 440, 72–75,doi:10.1038/nature04507.
Yuan, H., and K. Dueker (2005), Teleseismic P wave tomogram of theYellowstone plume, Geophys. Res. Lett., 32, L07304, doi:10.1029/2004GL022056.
Zoback, M. L., and M. D. Zoback (1989), Tectonic stress field of theconterminous United States, in Geophysical Framework of the Continen-tal United States, edited by L. C. Pakiser and W. D. Mooney, Mem. Geol.Soc. Am., 172, 523–539.
�����������������������W.-L. Chang, Department of Earth Sciences, National Central University,
300 Jhongda Rd., Jhongli City, Taoyuan 32001, Taiwan. ([email protected])R. B. Smith, Department of Geology and Geophysics, University of Utah,
135 South 1460 East, Salt Lake City, UT 84112, USA. ([email protected])T. Taira, Berkeley Seismological Laboratory, University of California,
215 McCone Hall, Berkeley, CA 94720, USA. ([email protected])
B02301 TAIRA ET AL.: DILATATIONAL SOURCE DEFORMATIONS
16 of 16
B02301