seismic evaluation of an elevated highway bridge in a...
TRANSCRIPT
72 The Open Civil Engineering Journal, 2010, 4, 72-87
1874-1495/10 2010 Bentham Open
Open Access
Seismic Evaluation of an Elevated Highway Bridge in a Low Seismic Region – a Case Study
Ali M. Memari1,*, Harry G. Harris
2, Ahmad A. Hamid
2 and Andrew Scanlon
3
1Department of Architectural Engineering, Penn State University, 104 Engineering Unit A, University Park, PA 16802, USA
2Department of Civil, Architectural and Environmental Engineering, Drexel University, Philadelphia, PA, USA
3Department of Civil and Environmental Engineering, Penn State University, University Park, PA, USA
Abstract: This paper presents the results of the seismic evaluation of an elevated seven-span bridge with tall piers in
western Pennsylvania. The bridge was modeled using the SEISAB software, and the analysis used modal superposition
method. Various modeling strategies related to piers, abutments, expansion joints, fixed joints, rocker bearings, and
hanger supports were studied. Several modeling options were made to capture different behavior responses under seismic
loading conditions. The force and displacement demands are compared, and an assessment is made with respect to the
potential for damage based on the analysis results. The result of the study shows that for the level of earthquakes expected
in the region, columns will not be overstressed. Furthermore, the analysis results show that displacements of the
superstructure should not be of concern in light of the fact that there is sufficient bearing seat width and that concrete
pedestals have been added in front of the bearing supports to presumably prevent the walking off of the bearing from
the support. The study concludes that considering the low level of earthquakes expected in PA, the potential for collapse
of the superstructure due to bearing support failure is negligible. The paper contributes to better understanding of the
behavior of tall and elevated highway bridges in low seismic regions. The results of the study reinforce the view that
decisions on seismic retrofit of such bridges in low seismic regions should not be based on column tie spacing.
Keywords: Seismic evaluation, modal analysis, low seismicity, elevated highway bridge.
INTRODUCTION
In general, bridges in low seismic regions are not ex-pected to sustain serious damage when an earthquake with a magnitude consistent with the seismicity of the region oc-curs. Nonetheless, the damaging earthquakes of the 1990’s in California caused concern about the vulnerability of bridges in states with low to moderate seismicity. In response to such awareness and concern, many Departments of Transportation (DOTs) conducted studies to evaluate the conditions of their bridge stocks. One such state is Pennsylvania where a few years ago PennDOT was interested to study some of its bridges for code conformance evaluation of detailing along with determination of the potential for overstress under code level seismic lateral loads. The ultimate goal was to deter-mine whether seismic retrofit based on insufficient column tie spacing was justified. One of the bridges chosen for the study is an elevated highway bridge in western PA and is the subject of the case study presented in this paper. The study of this bridge is of particular interest because of the unusu-ally tall piers along with the length of the bridge.
Although the issue of changes in AASHTO detailing requirements for column confinement reinforcement was the main motivation for the study [1], the subject of interest in
*Address correspondence to this author at the Department of Architectural
Engineering, Penn State University, 104 Engineering Unit A, University
Park, PA 16802, USA; Tel: 814-865-3367; Fax: 814-863-4789;
E-mail: [email protected], [email protected]
this case study paper is the modeling strategy used for ana-lytical seismic evaluation. The modeling methodology and parametric studies are the emphasis of the presentation. The approach used can also be applied to similar bridge struc-tures in higher seismicity regions.
One common concern with respect to the seismic safety of bridges in eastern U.S. is the condition of abutment bear-ings and girder seats [2]. More specifically, the concern is that the bearing length of the support may be insufficient since longitudinal movement of the bridge deck, beyond that required for temperature expansion/contraction, has not been considered in non-seismically designed eastern U.S. bridges. In particular, for bridges with tall piers, this problem could be critical. While there are several seismic evaluation studies on normal height highway bridges [3-8], very few studies can be found on unusually tall pier highway bridges. Be-cause of the critical aspects of longitudinal and lateral movement of tall bridges and lack of sufficient past model-ing experiences, the main emphasis of this paper is on mod-eling strategies, in particular, with respect to bearing sup-ports, expansion hinges, etc. For this reason, the study em-phasizes parametric study through modeling variation. A recent work that also discusses various modeling strategies is presented by Abeysinghe et al. [9].
The objective of the analytical study discussed herein is to compare the force and displacement demands with avail-able capacities according to the AASHTO [10, 11] pre-scribed analytical method of multimodal spectral approach.

Seismic Evaluation of an Elevated Highway Bridge in a Low Seismic Region The Open Civil Engineering Journal, 2010, Volume 4 73
The seismic design ground acceleration corresponding to the geographic location of the bridge is 0.05g. Although at the time of the study the 16
th Edition of AASHTO [10] was
used, the provisions considered have not been changed in the current 17
th Edition of AASHTO [11], and therefore, the
seismic coefficient used still holds according to the current AASHTO as well. The paper contributes to a better under-standing of the seismic response of highway bridges with very tall piers. The results of the study can impact the deci-sion making with respect to the need for seismic retrofit of such bridges in low seismic regions. In particular, the major finding of the study is that for such bridges in low seismic regions with column tie spacing larger than the current AASHTO requirements, decisions on seismic retrofit should not be based only on the spacing deficiency.
The paper initially describes the bridge based on the drawings and site visit. The finite element modeling of the bridge is then discussed followed by the multi-modal analy-sis of the model. The evaluation consists of comparison of the existing column reinforcement details with reinforcement requirements contained in the current AASHTO specifica-tions. Details of the analysis performed using SEISAB com-puter program [12] are presented. Several modeling assump-tions are made to evaluate the effect of different parameters on the response. In particular, the effects of various assump-tions for the behavior of bearing supports, expansion joints, sliding joints, foundations, and structural properties are in-vestigated. Calculated force demands in the columns are compared with calculated capacities considering biaxial re-sponse. Comparison is also made between the longitudinal and transverse deck displacements due to the structures re-sponse with the potential capacities and tolerances.
Fig. (1). A Photograph of the bridge.
BRIDGE DESCRIPTION
The structure is a 422.15 m long seven-span steel girder bridge. Constructed in 1968, the bridge is straight, with a
grade of 0.57 %, and span lengths of 54.56 m, 63.40 m, 63.40 m, 59.44 m, 63.40 m, 63.40 m and 54.56 m. A photo-graph of the bridge is shown in Fig. (1). Fig. (2) shows a perspective drawing of the bridge along with dimensions. The superstructure consists of a 216 mm concrete deck slab supported on 533 mm deep wide flange longitudinal steel stringers at approximately 2440 mm centers. Total deck width is 25.60 m. The stringers are supported on 1524 mm deep steel floor beams, approximately 7.01 m on centers, and the floor beams are supported on two main longitudinal steel girders 3810 mm deep and 13.72 m apart. Cross-bracing is provided between the bottom flanges of the longi-tudinal girders. A typical cross-section is shown in Fig. (3), and Fig. (4) shows a photograph of the underside of the superstructure.
Fig. (2). Perspective view of the bridge.
Fixed bearings are located on top of each pier, while ex-pansion bearings are used on the abutments. Photographs of

74 The Open Civil Engineering Journal, 2010, Volume 4 Memari et al.
the fixed and expansion bearings are shown in Figs. (5 and 6), respectively. Expansion joints are located at 8.82 m left of Pier 3 (Bent 3 in Fig. 2) centerline in Span 3 and right of Pier 4 centerline in Span 5. These expansion joints were originally designed as hanger connections on the main gird-
ers. In 1990, the bridge was retrofitted with a support beam and bearing arrangement to provide an auxiliary support sys-tem at the expansion joints. A photograph of the retrofit ar-rangement is shown in Fig. (7). A support beam is attached to the underside of the cantilever girder on one side of the expansion joint. Load from the adjacent girder is transferred through a bearing to the support beam. A schematic view of the expansion joint arrangement is shown in Fig. (8) and a photograph of the hanger in Fig. (9).
Bridge piers consist of two-column bents. Fig. (10) shows the details of Piers 1, 2, and 5, which are approxi-mately 49.38 m high and framed at the top with a 15.54 m long by 2.44 m deep by 1.22 m wide cap beam. Column cross-sections are square in shape and are reduced in size from 3.66 m by 3.66 m at the base to 1.83 m by 1.83 m at the top as shown in Fig. (10). Column reinforcement consists of # 11 (35 mm) longitudinal along with bars #4 (13 mm) ties spaced at 305 mm on centers. Piers 3 and 4 have the same cross-sections as above with heights of 50.90 m and 45.11 m, respectively. Pier 6 is 18.59 m in height with column di-mensions of 2.29 m by 2.29 m at the base and 1.83 m by 1.83 m. Columns are supported on spread footings, which vary in size, 6.40 m x 6.40 m, 4.57 m x 5.18 m, or 4.27 m x 4.27 m. Soil borings indicate variations of brown sandy clay, with and without gravel and boulders, at the surface, with
Fig. (3). Typical cross section of the bridge.
Fig. (4). Underside of the bridge showing the superstructure com-
ponents.
Fig. (5). Close-up view of the fixed bearing on top of cap beam.
Fig. (6). Rocker bearing at the abutment.
12.04 m 12.04 m
25.00 m
13.72 m
C/L BRIDGE
MEDIAN
1.51 m WEB
3.81 m WEBINSPECTION
PLATFORM
TYPICAL CROSS SECTION

Seismic Evaluation of an Elevated Highway Bridge in a Low Seismic Region The Open Civil Engineering Journal, 2010, Volume 4 75
grey sandstone at depth. Abutments at each end of the bridge are of cast-in-place concrete on spread footings.
AASHTO SEISMIC PROVISIONS AND ANALYSIS APPROACH
In this section, the existing condition of the bridge is evaluated based on the requirements in seismic provisions of Division I-A in AASHTO Specifications [10], which were the current edition at the time of the study [1]. The provi-sions discussed here have not changed in the 17
th Edition of
AASHTO [11]. The acceleration coefficient according to AASHTO seismicity maps is 0.05g for the location of the bridge. The seismic load resulting from this acceleration coefficient has a 10% probability of being exceeded in 50 years, which corresponds to a return period of approximately 475 years.
One of the most crucial parameters that can influence the level of evaluation is the “Importance Classification”, which can be used to determine Seismic Performance Category (SPC). Although AASHTO requires assignment of such a classification only for bridges in areas with acceleration co-efficients greater than 0.29, an FHWA report [13] recom-
mends assigning Importance Classification regardless of the acceleration coefficient value. To be conservative at this crucial step, the FHWA recommendation was followed in the study, and the bridge was classified as “Essential”. This classification is justified on the basis of giving consideration to several factors including the following: a) the bridge pro-vides access to local emergency services; b) loss/closure of the bridge creates a major economic impact; and c) the bridge provides a critical link in the security/defense road-way network.
With such a classification, the SPC for the bridge is de-termined to be “B”, whereas if AASHTO provisions were followed, the SPC would be “A”. Regular bridges (less than seven spans) classified as SPC A do not require a detailed seismic analysis. However, when the classification is SPC B,
Fig. (7). View of the auxiliary support beam.
Fig. (8). A schematic view of the new expansion joint arrangement.
Fig. (9). View of the new hanger, bearing, and support beam.
NEW STAINLESS STEEL HANGER
NEW BEARING
NEW AUXILIARY SUPPORT BEAM

76 The Open Civil Engineering Journal, 2010, Volume 4 Memari et al.
Procedure 3 or Multimodal Spectral Analysis Method must be used to evaluate the performance of this bridge. More information about this analysis method is given subse-quently.
The effect of the underlying soil deposit on the response of the bridge is reflected through the Site Coefficient, whose value depends on Soil Profile Type. Soil Profile Type I is
defined as a profile with either 1) rock of any characteristic, either shale-like or crystalline in nature, or 2) stiff soil condi-tions where the soil depth is less than 60.96 m and the soil types overlying rock are stable deposits of sand, gravel, or stiff clay. The composition of the underlying soil at bridge site includes sandy clay, sandstone boulders, light grey sand-stone, hard grey sandstone, and medium hard dark red shale down to a depth of approximately 9.14 m. Therefore, the
Fig. (10). Column details at Piers 1, 2, and 5.
Seismic Evaluation of an Elevated Highway Bridge in a Low Seismic Region The Open Civil Engineering Journal, 2010, Volume 4 77
underlying soil can be clearly defined as Soil Type I, to which AASHTO gives a Site Coefficient value of 1.0
The response of bridges in past earthquakes has demon-strated that the longitudinal horizontal movement of the bridge superstructure is a critical response parameter [3, 4, 5, 7]. AASHTO Division I-A suggests that seismic design dis-placements shall be the maximum of that resulting from analysis and that specified as minimum bearing seat support-ing the expansion ends of girders given as N = (8 + 0.02L + 0.08H)(1 + 0.000125S
2) in inches. In this relation, L is the
length in feet of the bridge deck to the adjacent expansion joint, or to the end of the bridge deck, S is the angle of skew of support in degrees, measured from a line normal to the span, and H is the average height in feet of columns support-ing the bridge deck to the next expansion joint. In other words, AASHTO requires that the bearing seats supporting the expansion ends shall have a minimum support length (N) or the displacement value from analysis if it is larger. The computer analysis results will be discussed subsequently. However, in this section, the actual bearing length are evalu-ated.
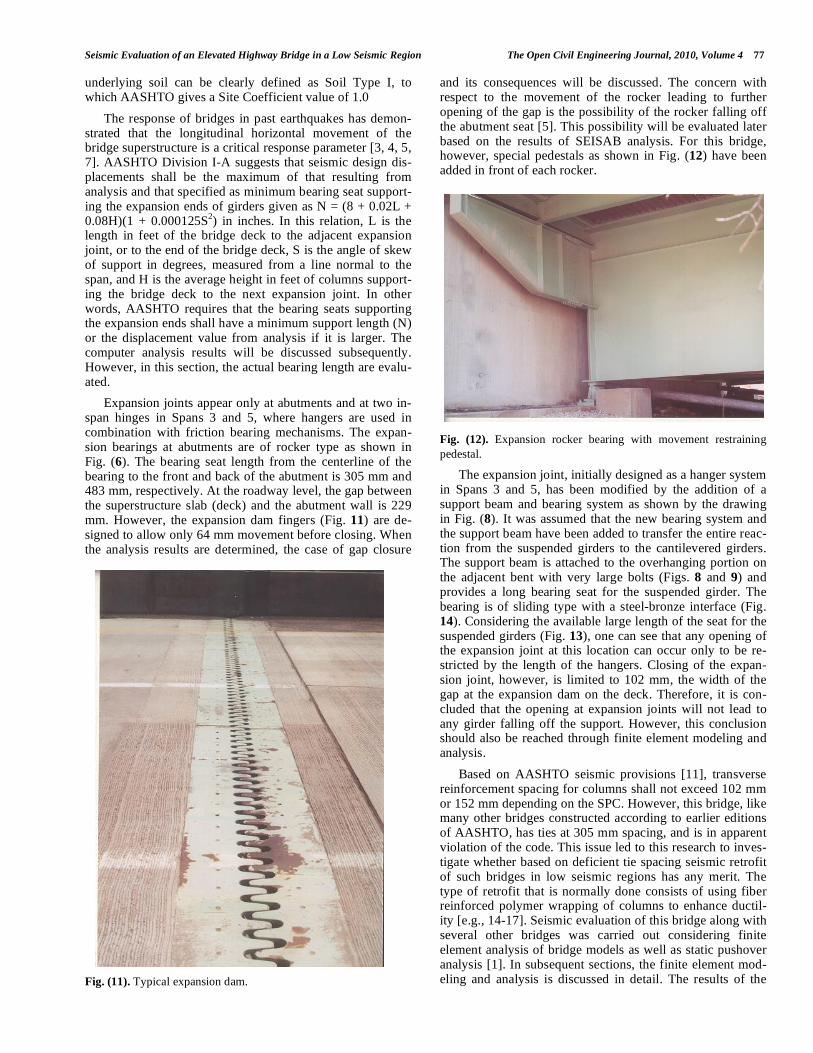
Expansion joints appear only at abutments and at two in-span hinges in Spans 3 and 5, where hangers are used in combination with friction bearing mechanisms. The expan-sion bearings at abutments are of rocker type as shown in Fig. (6). The bearing seat length from the centerline of the bearing to the front and back of the abutment is 305 mm and 483 mm, respectively. At the roadway level, the gap between the superstructure slab (deck) and the abutment wall is 229 mm. However, the expansion dam fingers (Fig. 11) are de-signed to allow only 64 mm movement before closing. When the analysis results are determined, the case of gap closure
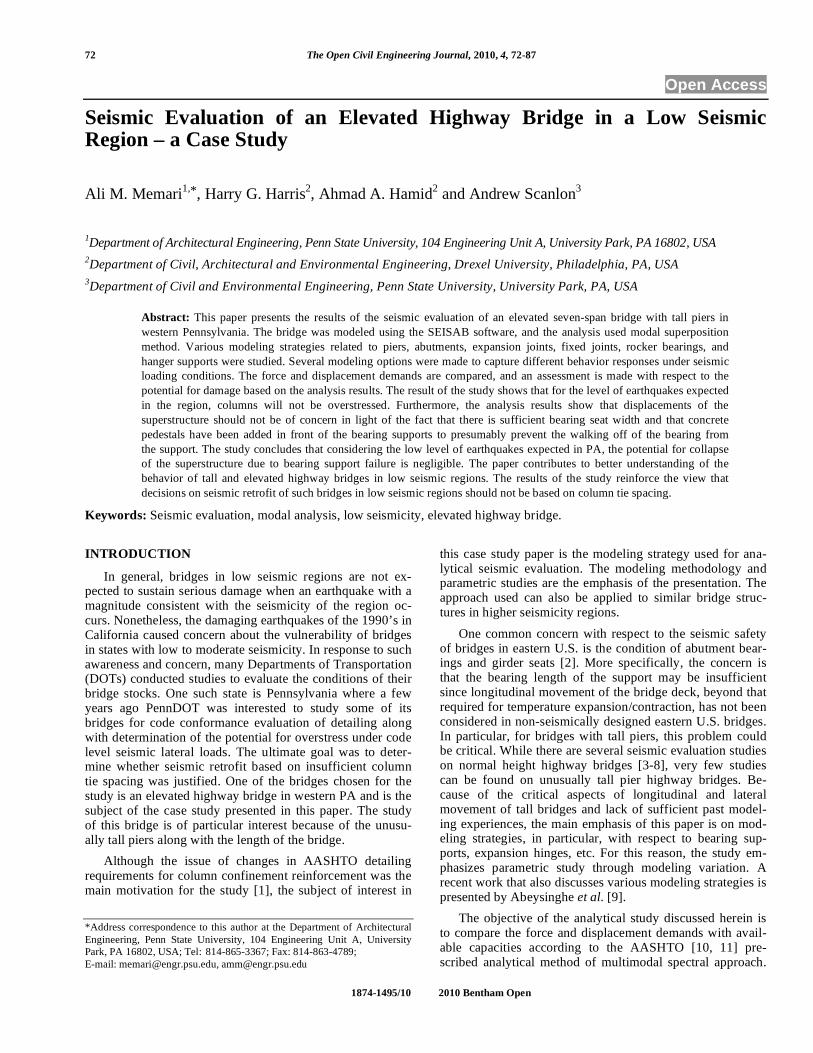
and its consequences will be discussed. The concern with respect to the movement of the rocker leading to further opening of the gap is the possibility of the rocker falling off the abutment seat [5]. This possibility will be evaluated later based on the results of SEISAB analysis. For this bridge, however, special pedestals as shown in Fig. (12) have been added in front of each rocker.
Fig. (12). Expansion rocker bearing with movement restraining
pedestal.
The expansion joint, initially designed as a hanger system in Spans 3 and 5, has been modified by the addition of a support beam and bearing system as shown by the drawing in Fig. (8). It was assumed that the new bearing system and the support beam have been added to transfer the entire reac-tion from the suspended girders to the cantilevered girders. The support beam is attached to the overhanging portion on the adjacent bent with very large bolts (Figs. 8 and 9) and provides a long bearing seat for the suspended girder. The bearing is of sliding type with a steel-bronze interface (Fig. 14). Considering the available large length of the seat for the suspended girders (Fig. 13), one can see that any opening of the expansion joint at this location can occur only to be re-stricted by the length of the hangers. Closing of the expan-sion joint, however, is limited to 102 mm, the width of the gap at the expansion dam on the deck. Therefore, it is con-cluded that the opening at expansion joints will not lead to any girder falling off the support. However, this conclusion should also be reached through finite element modeling and analysis.
Based on AASHTO seismic provisions [11], transverse reinforcement spacing for columns shall not exceed 102 mm or 152 mm depending on the SPC. However, this bridge, like many other bridges constructed according to earlier editions of AASHTO, has ties at 305 mm spacing, and is in apparent violation of the code. This issue led to this research to inves-tigate whether based on deficient tie spacing seismic retrofit of such bridges in low seismic regions has any merit. The type of retrofit that is normally done consists of using fiber reinforced polymer wrapping of columns to enhance ductil-ity [e.g., 14-17]. Seismic evaluation of this bridge along with several other bridges was carried out considering finite element analysis of bridge models as well as static pushover analysis [1]. In subsequent sections, the finite element mod-eling and analysis is discussed in detail. The results of the
Fig. (11). Typical expansion dam.

78 The Open Civil Engineering Journal, 2010, Volume 4 Memari et al.
pushover analysis to determine a measure of available ductil-ity is also discussed briefly at the end. For the analysis that is described next, a response modification factor R of 1.0 is assumed since the column tie spacing violates the AASHTO requirements, and according to AASHTO, values of R higher than 1.0 cannot be used.
MODELING STRATEGIES
Priestley et al. [14] present a discussion on the compari-son of modeling a bridge globally and modeling it segment by segment, where a segment is a continuous portion of the superstructure between movement joints. Accordingly, global models of the entire bridge are more useful for seis-mic demand quantification based on linear elastic modal response spectrum analysis to verify response quantities ob-tained from individual frame models. The significance of individual frame models of bridge segments, however, stems from the fact that dynamic response characteristics of an individual or stand-alone frame can be determined with rea-sonable accuracy not only for elastic analysis, but more im-portantly for inelastic response.
Such segment by segment analysis can provide not only
upper bound response values, but also a better understanding
of each segment’s dynamic characteristics without the influ-
ence of the interaction with other parts that have their own
dynamic response. Therefore, in order to compare and verify
the important seismic response characteristics, in addition to modeling and analysis of the bridge as a whole, three distinct
segments of the bridge (each bounded by two movement
joints) were also studied individually. The characteristic of each segment considered as a frame is primarily governed by
its tributary portion of the superstructure, the supporting
bents that provide lateral stiffness, boundary condition at expansion joints, and foundation flexibility.
Several different modeling assumptions were made to
test the sensitivity of the segment response with respect to some parameters, including the flexibility of abutments and
footings, torsional stiffness of the superstructure, stiffness of
the columns, and friction coefficient at bearings. The various models developed for the analysis of this bridge using the
SEISAB software [12] are listed in Table 1 and shown
schematically in Fig. (15). In Table 1, Model 11 represents simply the dead load analysis for all other models. In the
following, the input data is discussed with an explanation of
the attributes of each model. The order of discussion follows the order of input data preparation for SEISAB analysis,
where initially, the basic components of the bridge including
the superstructure, columns, cap beams, bearing elements, and abutments/footings are defined, and then their locations
within the structure are described.
ASSUMPTIONS FOR MODELS 1-3
Model 1 considers the bridge as a whole (global model).
The analysis type is specified as Response Spectrum. Three intermediate joints for each span and two intermediate joints
for each column are defined. The superstructure is made up
of reinforced concrete slab on steel girders. Since the origi-nal drawings did not show any shear studs, the section was
assumed to be noncomposite. For torsion, two conditions of
closed section (Model 2) and open section (Model 1) were studied. The closed section assumption has some merit be-
cause of the stiffening effect of horizontal bracing, although
in most cases, such an effect is conservatively neglected. The section properties calculated (using SEISAB notation) and
other needed data are shown in Table 1. The density of steel,
modulus of elasticity, and Poisson’s ratio were, respectively, specified as 77.0 kN/m
3, 200x10
6 kPa, and 0.15. The weight
per unit length of the superstructure turns out to be 194.8
kN/m if one takes into account the concrete deck, steel gird-ers, steel floor beams, steel stringers, steel cross bracings,
and a 1.44 kPa for future wearing surface as is noted on the
original drawings.
Since columns have varying cross-sectional dimensions
(stepped) over the height, they were defined as a series of
prismatic segments, the first being the bottom-most segment. This segment was specified with a zero length so that the
program can adjust its position to fit the elevation difference
at the bent. All other segments above this segment were specified with actual lengths. Two different cases were con-
sidered: Model 1 using the gross section properties, and
Model 3 using effective section properties. For typical axial load values, the charts suggested by Priestley et al. [14] give
the effective moment of inertia to be 30% of the gross. The
use of gross section properties can be justified in this study
Fig. (13). Available length of sliding.
Fig. (14). Close-up view of the sliding bearing.

Seismic Evaluation of an Elevated Highway Bridge in a Low Seismic Region The Open Civil Engineering Journal, 2010, Volume 4 79
because of the relatively low level of seismic input. Effective
section properties are used for comparison purposes. A spe-
cial Cap element was used in SEISAB to model the cap beam (bent cap), which connects the centerline of the super-
structure and column tops. Again, two sets of values were
calculated, gross section properties (for Model 1) and effec-tive section properties (for Model 3). The difference in the
response will be discussed subsequently when analysis re-
sults are presented.
One option in SEISAB to model a bearing element is to identify an appropriate keyword for the type of superstruc-ture to abutment/bent connection. Available predefined key-word connections are FIX, PIN, FREE, TRANSVERSE, and LONGITUDINAL. These keywords specify a single point connection between the superstructure end span and the
abutment/bent at the centerline of the support. For all these cases, vertical shear and torsion are both fixed, i.e., transfer of force occurs for vertical shear and torsion. Moreover, the moment about the horizontal axis of the abutment and the vertical axis through the connection point are free (except for FIX type keyword). A TRANSVERSE type connection means that longitudinal shear is free, but transverse shear is fixed.
For Models 1-3, TRANSVERSE type keyword was specified at abutments. This type of connection is equivalent to a roller type support and thus longitudinal forces will not be transmitted to the abutment. Modified support type with the use of bearing element would be needed to capture any transfer of longitudinal force. Since the actual supports at the abutments are of rocker bearing type (Fig. 12), the assump-
Fig. (15). SEISAB models for Runs 1-5.

80 The Open Civil Engineering Journal, 2010, Volume 4 Memari et al.
tion of roller is justified, although there is some friction in-volved. Because of the response spectrum analysis (all posi-tive quantities), the program could not determine the direc-tion of movement (i.e., opening or closing of an expansion joint) of the superstructure with respect to the abutment. Therefore, modified modeling considering displacements and forces at abutment had to be used to study important possible modes of response. All columns in a bent are rigidly (monolithically) attached to the cap beam and footings. Therefore, the default condition of FIX was used in BENT Data Block for top and bottom of each column. Because of the continuity of the superstructure over the bent through physical hinges on top of cap beam (Fig. 5), the keyword PIN was specified.
To study the behavior of this bridge in the longitudinal direction, an additional effort for modeling effort was
needed, primarily because of the special construction of a
hanger rod and bearing system assembly. The original design
had only hanger rods, which provided minimal resistance to
longitudinal movement at the hinge. The repair in 1990 in-
cluded the replacement of hanger rods with better quality stainless steel hanger rods and the addition of an expansion
bearing plate system that is supported by an auxiliary beam
attached to the underside of the cantilever segment. It was not quite apparent whether both the hanger rod and bearing
plate system contribute to carrying the reaction of the sus-
pended segment under normal conditions, and if they both participate, their relative contribution was not clear. For this
reason, several possibilities had to be modeled in the study.
For Models 1, 2, & 3, it was assumed that the occurrence of sliding between steel plate and bronze plates at their inter-
face was possible. Therefore, the hinge was defined so as to
have LONGITUDINAL FREE SHEAR type bearing. In the models that are described subsequently (Models 4 and 10),
the effect of friction at the interface of bearing plates was
taken into account.
Fig. (15). (Continued). SEISAB models for Runs 6-9.
Seismic Evaluation of an Elevated Highway Bridge in a Low Seismic Region The Open Civil Engineering Journal, 2010, Volume 4 81
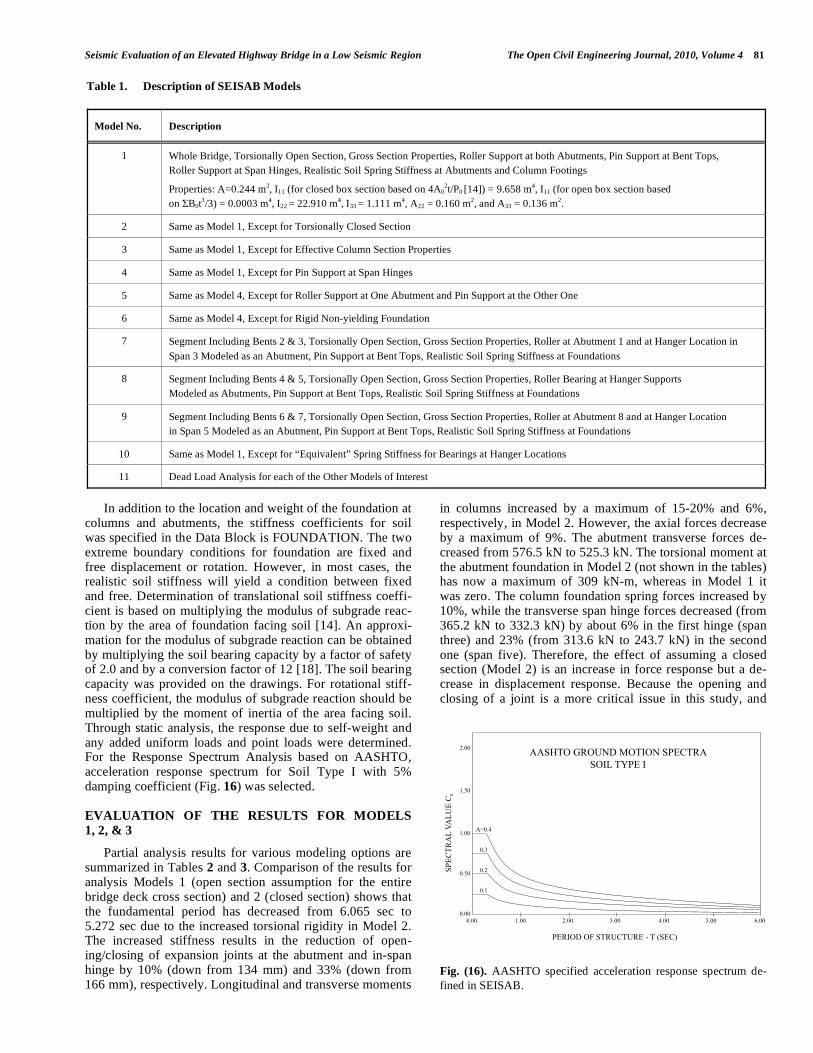
In addition to the location and weight of the foundation at columns and abutments, the stiffness coefficients for soil was specified in the Data Block is FOUNDATION. The two extreme boundary conditions for foundation are fixed and free displacement or rotation. However, in most cases, the realistic soil stiffness will yield a condition between fixed and free. Determination of translational soil stiffness coeffi-cient is based on multiplying the modulus of subgrade reac-tion by the area of foundation facing soil [14]. An approxi-mation for the modulus of subgrade reaction can be obtained by multiplying the soil bearing capacity by a factor of safety of 2.0 and by a conversion factor of 12 [18]. The soil bearing capacity was provided on the drawings. For rotational stiff-ness coefficient, the modulus of subgrade reaction should be multiplied by the moment of inertia of the area facing soil. Through static analysis, the response due to self-weight and any added uniform loads and point loads were determined. For the Response Spectrum Analysis based on AASHTO, acceleration response spectrum for Soil Type I with 5% damping coefficient (Fig. 16) was selected.
EVALUATION OF THE RESULTS FOR MODELS
1, 2, & 3
Partial analysis results for various modeling options are summarized in Tables 2 and 3. Comparison of the results for analysis Models 1 (open section assumption for the entire bridge deck cross section) and 2 (closed section) shows that the fundamental period has decreased from 6.065 sec to 5.272 sec due to the increased torsional rigidity in Model 2. The increased stiffness results in the reduction of open-ing/closing of expansion joints at the abutment and in-span hinge by 10% (down from 134 mm) and 33% (down from 166 mm), respectively. Longitudinal and transverse moments
in columns increased by a maximum of 15-20% and 6%, respectively, in Model 2. However, the axial forces decrease by a maximum of 9%. The abutment transverse forces de-creased from 576.5 kN to 525.3 kN. The torsional moment at the abutment foundation in Model 2 (not shown in the tables) has now a maximum of 309 kN-m, whereas in Model 1 it was zero. The column foundation spring forces increased by 10%, while the transverse span hinge forces decreased (from 365.2 kN to 332.3 kN) by about 6% in the first hinge (span three) and 23% (from 313.6 kN to 243.7 kN) in the second one (span five). Therefore, the effect of assuming a closed section (Model 2) is an increase in force response but a de-crease in displacement response. Because the opening and closing of a joint is a more critical issue in this study, and
Table 1. Description of SEISAB Models
Model No. Description
1 Whole Bridge, Torsionally Open Section, Gross Section Properties, Roller Support at both Abutments, Pin Support at Bent Tops,
Roller Support at Span Hinges, Realistic Soil Spring Stiffness at Abutments and Column Footings
Properties: A=0.244 m2, I11 (for closed box section based on 4A02t/P0 [14]) = 9.658 m4, I11 (for open box section based
on B0t3/3) = 0.0003 m4, I22
= 22.910 m4, I33 = 1.111 m4, A22 = 0.160 m2, and A33 = 0.136 m2.
2 Same as Model 1, Except for Torsionally Closed Section
3 Same as Model 1, Except for Effective Column Section Properties
4 Same as Model 1, Except for Pin Support at Span Hinges
5 Same as Model 4, Except for Roller Support at One Abutment and Pin Support at the Other One
6 Same as Model 4, Except for Rigid Non-yielding Foundation
7 Segment Including Bents 2 & 3, Torsionally Open Section, Gross Section Properties, Roller at Abutment 1 and at Hanger Location in
Span 3 Modeled as an Abutment, Pin Support at Bent Tops, Realistic Soil Spring Stiffness at Foundations
8 Segment Including Bents 4 & 5, Torsionally Open Section, Gross Section Properties, Roller Bearing at Hanger Supports
Modeled as Abutments, Pin Support at Bent Tops, Realistic Soil Spring Stiffness at Foundations
9 Segment Including Bents 6 & 7, Torsionally Open Section, Gross Section Properties, Roller at Abutment 8 and at Hanger Location
in Span 5 Modeled as an Abutment, Pin Support at Bent Tops, Realistic Soil Spring Stiffness at Foundations
10 Same as Model 1, Except for “Equivalent” Spring Stiffness for Bearings at Hanger Locations
11 Dead Load Analysis for each of the Other Models of Interest
Fig. (16). AASHTO specified acceleration response spectrum de-
fined in SEISAB.
AASHTO GROUND MOTION SPECTRASOIL TYPE I
A=0.4
0.3
0.2
0.1
SPEC
TRA
L VA
LUE
C S
2.00
1.50
1.00
0.50
0.00
PERIOD OF STRUCTURE - T (SEC)
0.00 1.00 2.00 3.00 4.00 5.00 6.00

82 The Open Civil Engineering Journal, 2010, Volume 4 Memari et al.
also since for this kind of superstructure cross section it is more conventional to assume an open section, the assump-tion of Model 1 was used for all other models studied.
Model 3 was used to compare the influence of effective section properties for columns and cap beams with that of
gross section properties used in Model 1. The assumption of using the effective section properties 30% of the gross values gave rise to additional flexibility of the system resulting in an increase in the fundamental period from 6.065 sec to 8.823 sec. The opening/closing of expansion joints increased
Table 2. Summary of Results – Displacement; Abutments and Hinge Forces; Bent Number Shown in Parenthesis; Spring Stiffness
Direction Shown in Brackets
Run
No.
Fund.
Period Long.
(sec)
Abut.
Displ.
(mm)
Max Long.
Bent Displ.
(mm)
Max Trans.
Bent Displ.
(mm)
Span Hinge
Open/Close
(mm)
Long. Abut.
Force
(kN)
Max. Trans.
Abut. Force
(kN)
Abutment
Spring Force
(kN)
Long. Hinge
Force
(kN)
1 6.065 (1) 134
(8) 114
134 113 (3) 166
(5) 46
0 (1) 576 (kf2) 19
(kf3) 663
0
2 5.272 (1) 121
(8) 110
121 110 (3) 113
(5) 46
0 (1) 525 (kf2) 26
(kf3) 1010
0
3 8.823 (1) 170
(8) 133
171 149 (3) 213
(5) 92
0 (1) 581 (kf2) 7
(kf3) 547
0
4 5.301 (1) 123
(8) 122
121 113 0 0 (1) 518 (kf2) 17
(kf3) 538
437
5 3.41 (1) 5
(8) 30
121 113 0 5004 (1) 541 (kf2) 43
(kf3) 574
3708
6 3.488 (1) 83
(8) 82
82 58 0 0 (1) 429 (kf2) 0
(kf3) 0
0
7 6.06 (1) 134
(4) 134
134 30 0 0 (1) 438 (kf2) 20
(kf3) 987
0
8 4.841 (1) 122
(4) 122
121 122 0 0 (1) 1166 (kf2) 63
(kf3) 1277
0
9 6.707 (1) 141
(4) 141
140 140 0 0 (4) 915 (kf2) 33
(kf3) 1023
0
10 5.39 (1) 136
(8) 112
134 91 (3) 17
(5) 11
0 (1) 485 (kf2) 25
(kf3) 574
205
Table 3. Summary of Results – Forces and Moments in Columns and Bents; Bent Numbers Shown in Parenthesis
Model
No.
Long. Col.
Mom.
(kN-m)
Max. Long.
Col. Mom.
(kN-m)
Max Trans.
Col. Mom.
(kN-m)
Max Col.
Shear
(kN)
Col. Axial
Force
(kN)
Max Long.
Bent Force
(kN)
Max Trans.
Bent Force
(kN)
1 (2) 8712 (4) 6285 (3) 8779 (3) 10725 (3) 383 (2) 431 (4) 894 (7) 458 (3) 538
2 (2) 10485 (4) 6284 (3) 10540 (3) 11422 (3) 360 (2) 396 (4) 925 (7) 431 (3) 534
3 (2) 5565 (4) 4353 (2) 5585 (4) 8372 (4) 302 (2) 316 (4) 583 (7) 360 (7) 391
4 (2) 8046 (4) 6288 (6) 8137 (3) 10722 (3) 369 (2) 431 (4) 947 (7) 489 (3) 529
5 (2) 2485 (4) 2034 (6) 2834 (3) 10763 (3) 382 (2) 440 (4) 934 (4) 200 (3) 534
6 (2) 12038 (4) 11736 (2) 12038 (4)16127 (4) 454 (2) 378 (4) 1041 (7) 818 (4) 640
7 (2) 8703 (3) 8781 (3) 8781 (2) 4662 (3) 249 (2) 280 (3) 271 (3) 307 (2) 178
8 (2) 6286 (3) 6560 (3) 6560 (2) 2772 (2) 236 (2) 556 (3) 334 (3) 236 (2) 627
9 (2) 9309 (3) 4273 (2) 9309 (2) 4435 (2) 205 (2) 302 (3) 173 (2) 365 (3) 169
10 (2) 8833 (4) 6121 (3) 8887 (3) 9869 (3) 365 (2) 440 (4) 756 (7) 454 (3) 476

Seismic Evaluation of an Elevated Highway Bridge in a Low Seismic Region The Open Civil Engineering Journal, 2010, Volume 4 83
to 170 mm (up 26%) at the abutment and to 213 mm (up 28%) at the hinge in span three and to 92.4 mm (up 106%) at the hinge in span five. Consistent with these increases, the bent displacements increased to a maximum of 170 mm lon-gitudinally and 149 mm transversely. Because of the lower column stiffness in this model, column forces dropped by about 20% - 35%, but the abutment forces remained the same. For comparison and parametric study purposes, gross section properties of Model 1 were also used in Models 4-10.
EFFECT OF FRICTION AT THE EXPANSION
BEARINGS
In Model 1, the expansion joint at in-span hinges were considered rollers, which would mean that during the design earthquake the friction force at the interface of bearing plates will be overcome and sliding could take place. This forms one extreme possibility, for which no stiffness at or resis-tance by the expansion bearings at hinge locations is consid-ered during the earthquake. At the other extreme, the expan-sion bearings can be modeled as pins, allowing no sliding and transferring the entire longitudinal force at the bearing. This latter case assumes that during an earthquake bearing plates will not slide at their interface, and the expansion bearing effectively “freezes” during the earthquake. This possibility is considered in Model 4 (described subsequently) by using the keyword connection option of LONGITUDI-NAL PIN SHEAR. Model 4 determines the longitudinal forces in the bearing at hinge locations. The information can then be used to compare with the friction force at the inter-face of bearing plates and determine whether sliding can take place. Before the discussion of the results, however, it is useful to review the mechanism of friction at expansion bearings. The effect of friction at bearings has also been addressed in computer modeling presented by Abeysinge et al. [9].
According to the guidelines in AASHTO specifications, the movement of the superstructure at moveable bearings, e.g., sliding bearings, should not be hindered because of im-proper settings or adjustments of bearings. This “free” movement is presumed to be due to temperature changes, it is reasonable to assume it would depend on the intensity of the earthquake at the site. According to Xanthakos [19], “The presence of a longitudinal force at expansion bearings often causes debate and may lead to inconsistencies in de-sign.” Moreover, he reports that friction coefficients for slid-ing-type expansion bearings vary considerably and that any value for friction coefficient that is recommended is based on the assumption of good maintenance procedure and in-spection. Xanthakos suggests that rusting and freezing of bearings can develop a larger value of friction coefficient. Referring to an ASCE document [20], Xanthakos reports that the friction coefficient for steel bearing on self-lubricating bronze plate (in new construction) can be taken as 0.1.
Performance studies on steel bearings in existing bridges, however, indicates that values larger than the initial design values are more reliable. In a study to evaluate the strength and deformation characteristics of bearings in nonseismically designed bridges, Mander et al. [21] performed an experi-mental field study on a 30-year-old concrete slab on two-span steel girder bridge in Niagara Falls, New York. In addi-tion, for comparison purposes, they performed laboratory
tests on similar bearings taken from another 30-year-old bridge. The results help in studies regarding deck-to-substructure interaction when strong longitudinal and trans-verse ground shakings are applied to the bridge. Such bear-ings are initially designed to accommodate thermal expan-sion. Fixed and expansion bearings were used on abutments and the central bent under steel girders.
To test for friction resistance, Mander et al. [21] loaded the bridge longitudinally and transversely in the field, and the isolated bearings were tested in the laboratory under a variety of longitudinal and transverse horizontal and vertical loads. Laboratory tests on isolated expansion sliding bearing showed that sliding could occur with a friction coefficient of approximately 5 mm in the longitudinal direction and 13 mm in the transverse direction for steel-bronze interface. Field tests on the bridge, however, showed that because of signifi-cant amount of corrosion, which gives rise to additional ad-hesion at the interface, sliding resistance was higher than the breakaway friction observed in the laboratory. One of the conclusions of the in-situ field tests was the following: “be-cause of misalignment and corrosion adhesion in the bear-ings, breakaway of the steel-bronze interfaces may not occur for normal magnitudes of seismic loading.”
Because of such results from previous studies, Model 4 was formed based on the assumption that sliding did not take place. This provided a basis for comparison of the results with Model 1, where sliding was freely permitted. There was a small change in periods (6.065 sec for Model 1 to 5.301 sec for Model 4), and the difference in forces and displace-ments between the two cases was negligible, which slightly affected the column forces (reduced less than 8%). On the other hand, expansion hinge opening/closing at the abutment decreased by 8%, as did bent displacements. In Model 4, as it is expected, the opening/closing at span hinges was zero (“frozen” hinge). Also, there were longitudinal span hinge forces (437 kN) in this case, whereas those forces were zero in Model 1. The span hinge displacements in Model 1 showed a relative longitudinal displacement at the hinge with a value of 166 mm. This indicates the amount of maximum opening or closing of the hinge in span 3. For that same model, the maximum displacement of the left face and the right face at the hinge are reported (in the SEISAB output not shown in the table) 134 mm and 123 mm, respectively, for the longitudinal direction and a value of 124 mm for the transverse direction. For Model 4, the longitudinal and trans-verse values of displacement at the hinge are 123 mm and 124 mm, respectively. From these results, one can conclude that if the bearings behave as frozen during the earthquake, a displacement of approximately 152 mm longitudinally or transversely at the bearing location can be expected. On the other hand, if sliding can take place without resistance, a maximum joint opening or closing of about 166 mm is pos-sible. Of course, the actual size of the gap in the superstruc-ture deck limits such a possibility.
Another result of interest in Model 4 is the force that could be developed at the hinge. The result shows that longi-tudinally a maximum force of 437 kN (Table 2) and trans-versely a force of 330 kN (not shown in Table 2) can be ex-pected. These values can now be compared with the breaka-way friction force at the bearing. The coefficient of friction was assumed to be 0.2, yielding a breakaway friction force

84 The Open Civil Engineering Journal, 2010, Volume 4 Memari et al.
of 1334 kN if we assume the bearing carries the entire reac-tion from the suspended span (and the hanger carries none). Even if the friction coefficient is conservatively taken as 0.1, the friction force would be 667 kN, which is still larger than the largest pin force at the hinge. Therefore, based on this analysis, one can conclude that during the earthquake to be expected at the location of this bridge, the hinge will not open. Nonetheless, in what follows the possibility of opening or closing at the hinge will still be further explored in order to demonstrate this evaluation procedure for similar bridge structures.
EFFECT OF SUPPORT RESTRAINT AT THE ABUT-MENTS
The result of Model 4 shows that the entire bridge super-structure can move to one side closing the expansion joint at one abutment and exerting longitudinal forces there. In order to model this behavior and estimate the reaction forces at the abutment, Model 4 was slightly modified by changing one of the rollers at abutment to a pin type support. The result of restraining one of the abutments longitudinally was a further decrease in period from 5.301 sec (Model 4) to 3.41 sec (Model 5). Although longitudinal displacement became very small (5mm opening/closing at abutment 1 and 30 mm at abutment 8), the transverse displacement did not change (from the results of Model 4). The significant drop in longi-tudinal displacement at bents resulted in column moments to reduce from 8046 kN-m to 2485 kN-m. However, transverse moments and axial forces in the columns did not change.
Model 5 resulted in an abutment longitudinal force of 5004 kN to be transferred to the soil. The reduction in longi-tudinal column moments is accompanied by almost 2/3 re-duction in column foundation spring moment about the bent axis (from 8219 kN-m to 2677 kN-m). The other significant change is an increase in the hinge force (at hanger location) from 437 kN to 3708 kN, which is consistent with the longi-tudinal abutment force in this model. Again, the purpose of this model was to determine the force that will be transferred to the abutment when the expansion gap closes at one abut-ment. The force of 5004 kN can easily be resisted by the soil as the longitudinal bearing capacity (at the vertical interface between abutment and soil) estimated as a passive resistance can be found to be on the order of 44500 kN).
Model 6 was of interest to see how the results change if instead of flexible foundation spring in Model 4, rigid non-yielding foundation was modeled. This stiffening effect re-sulted in a drop in the fundamental period from 5.301 sec to 3.488 sec and drops in longitudinal and transverse displace-ments by 32% and 48%, respectively. The fixity at footings also resulted in an increase in longitudinal column moments by approximately 50%. Other changes include drop in hinge transverse forces, by a maximum of 20%.
INDIVIDUAL SEGMENT RESPONSES
Because of the discontinuities in the superstructure at hinge locations, the segments of the bridge could show indi-vidual characteristic responses in an earthquake. In order to explore such possible responses, segments were modeled individually as frames, as shown in Fig. (15). For Model 7, roller type supports were assumed at the real abutment and also at hinge location, which in the latter case was assumed
to act as a fictitious abutment. In these models, realistic spring constants were used. In this case, the primary lateral force resistance elements are the two bents. The results of running these models should be compared with the results of Model 1 (global model), in which opening/closing of expan-sion joints at abutments and hanger locations was allowed. The fundamental period, longitudinal displacements and forces were comparable to those of Model 1. However, axial forces in columns were 35% smaller (down from 430 kN to 280 kN) and the abutment transverse force decrease from 576 kN to 438 kN.
In this case, the main response of interest was the dis-placement at abutments, which had a maximum value of 134 mm. This was the maximum longitudinal displacement of the segment and is the same as that predicted in global Model 1. The main concern here would be about the safety of the bridge if it experiences such a displacement. Three cases can be considered. In one case, there will be opening of the in-span hinge and one segment (the one under consid-eration) will move away from the other two segments toward the abutment. In this case, the 64 mm gap in the expansion dam above the abutment closes and the superstructure pushes against or slams into the abutment (pounding effect). In such a situation, it is possible that the expansion dam will buckle and fail, and some of the concrete at the interface of the deck and abutment backwall will spall. This is not a crucial failure mode and can be considered a repairable damage. It should be noted that in segmental analysis, the effect of friction has been neglected. If on the other hand, there would be closing of the hinge, the superstructure segment would move away from the abutment and the 102 mm gap in the expansion dam above the hinge would close and pounding would occur between this segment and the adjacent segment. The third possibility is that the two adjacent segments both move away or toward each other. None of these cases shows a critical situation for the bridge, since girders will not fall off their seats because of the stopping blocks constructed in front of the support (Fig. 12).
In Model 8, the middle segment was modeled such that the two in-span hinges were supported on abutments, and the hinges were modeled as rollers. This segment has a smaller mass than the side segment, and as a result, the fundamental period turned out to be 4.841 sec, which is smaller than 6.065 sec for Model 1. The smaller mass induced smaller seismic forces, as evidenced by 64% drop (from 860 kN to 334 kN in bent 3) and by 66% drop (from 8121 to 2772 kN-m in bent 2), respectively, in column axial and transverse forces. This shows that for this portion of the bridge, the forces generated in columns in Model 1 are more critical than those of Model 8.
Model 9 considered the individual response of the third segment, which has one shorter bent and one with a height similar to other bents in segments 1 and 2. The segment had a fundamental period of 6.707 sec, which is slightly larger than 6.065 sec of Model 1. Longitudinal and Transverse dis-placements increased, respectively, from 134 mm to 141 mm and from 113 mm to 141 mm. Column (transverse and axial) forces turned out to be smaller than the results of Model 1. The results of Models 7, 8, and 9 will be considered in the overall evaluation of capacity versus demand.

Seismic Evaluation of an Elevated Highway Bridge in a Low Seismic Region The Open Civil Engineering Journal, 2010, Volume 4 85
The two extreme cases of roller and pin at the internal hinge locations were considered, respectively, in Models 1 and 4. While in Model 1, it was assumed that there was no sliding friction (no resistance to sliding) at the interface of steel-bronze bearing plates (one extreme condition), in Model 4, the friction bearing was assumed to be “frozen”, i.e., no sliding at the interface of plates. In an earthquake strong enough to cause sliding at the interface of steel and bronze plates, friction forces develop during the motion. This resistance to motion modifies the structural characteristics of the bridge during motion. The effect of sliding friction can best be modeled with a Coulomb damping option. However, SEISAB allows only stiffness coefficients at bearing loca-tions. Therefore, to model the influence of friction on the response during earthquake, we can assume that the friction simply increases the stiffness, and thus determine an “equivalent” stiffness (spring) coefficient for the bearing. With the assumption of a linear elastic behavior, this equiva-lent stiffness coefficient can be estimated by dividing the breakaway friction force (1352 kN and 676 kN based, re-spectively, on friction coefficients of 0.2 and 0.1) by the dis-placement (opening/closing) at hinge location, which is 166 mm from Model 1. This gave corresponding stiffness values of 8127 kN/m and 4056 kN/m. The spring coefficient can be assumed to be the average value of 6091 kN/m for the bear-ing element at hinge location for Model 10. The input data for this run is thus similar to that for Model 4, except for the stiffness of bearings at hinge locations. It is noted that the period (5.39 sec) is between 6.065 sec for Model 1 (no fric-tion considered) and 5.301 sec in Model 4 (no movement at the expansion hinge allowed). The displacements in Model 10 are in general comparable to those in Model 1, except for the hinge opening/closing which are much less than those in Model 1 (e.g., 17 mm vs. 166 mm) but higher than zero in Model 4. On the other hand, the forces in Model 10 are com-parable to those of Models 1 and 4. It is, therefore, con-cluded that this model will not result in a more critical situa-tion than the previous model.
EVALUATION OF FORCE DEMAND IN COLUMNS AND COLUMN INTERACTION DIAGRAMS
Comparison of column moments in various models (Ta-ble 3) indicates that Model 6, wherein foundations were as-sumed fixed, results in the largest values. As an example, the maximum moments in bents 2 and 4 in Model 6 are larger by approximately 50% and 87%, respectively, than the corre-sponding values in Model 4, where foundation flexibility was taken into account. This increase in column moments due to stiffening effect of the substructure for fixed founda-tion is, of course, expected. However, to be realistic and not too conservative in this evaluation, the values for cases with foundation flexibility considered will be evaluated subse-quently.
In order to obtain the demand moments and axial forces, we need to combine seismic and dead load effects. The com-bination to use is given in AASHTO [11] Table 3.22.1.A as 1.3(0.75D + E), where D indicates the dead load effect (shear, moment, or axial force) and E represents the seismic load effects. As discussed before, the seismic load effects are partially listed in Tables 2 and 3. In order to obtain the dead load effects, a static analysis can be carried out with each of the data files for various models. In SEISAB modeling pro-
cedure, the program transfers all superstructure bearing points under girders to the midpoint of the cap beam. The same model is also used for dead load analysis. This will create a fictitious dead loading in the sense that it places all the superstructure dead load at a single point on the cap beam. This gives erroneous dead load moments in the cap beam and columns. To avoid such an unrealistic situation, dead load moments were determined by hand calculation, taking into account the P- effect. In other words, consider-ing the longitudinal and transverse deflection resulting from seismic analysis, the moments were magnified following the procedure in AISC-LRFD [22]. This procedure resulted in a maximum of 6.5% increase in seismic moments due to dead loads. It should be noted that in this particular bridge, the girders are supported directly on columns and not on cap beams. Therefore, a pure gravity load analysis should result in zero moment in columns, unless some eccentricity is con-sidered.
Using the values from Table 3 for Model 1, the combined values are as follows: Mlongitudinal = 12142 kN-m, Mtransverse = 14886 kN-m, and Paxial = 14256 kN. These values correspond to the column section at column-footing connection in Bent 2. Column interaction diagrams for uniaxial bending for the four different column sections were generated. Fig. (17) shows one example of these interaction diagrams. Based on such interaction diagrams, it was determined that the values for pairs of Mlongitudinal - Paxial and Mtransverse - Paxial fell in the small M-P value range in the first quadrant with a good mar-gin of safety, as also shown in Fig. 17.
This, however, constitutes uniaxial bending and com-pression force. For biaxial bending and compression, an in-teraction surface can be used. As a more accurate check on the behavior, Bresler’s “load contour” interaction equation shown below and found in Wang and Salmon [23] can be used: (Mnx / M0x)
1 + (Mny / M0y)
2 1.0. In this equation,
Mnx and Mny are nominal strength (factored moments divided by capacity reduction factor) of the section under biaxial bending and compression nominal strength of Pn. M0x is the uniaxial bending capacity of Mnx under compression force of Pn when Mny is zero. Similarly, M0y is the uniaxial bending capacity of Mny under the compression force of Pn when Mnx is zero. The exponents 1 and 2 are functions of the dimen-sions of cross-section, the amount and location of reinforce-ment, concrete strength, steel yield strength, and thickness of concrete cover. Bresler suggests that for practical purposes one can assume 1 = 2 = and use a value of between 1.5 and 2.0. Using a capacity reduction factor of 0.7, we get Mn,longitudinal = Mlongitudinal / 17600 kN-m, Mn,transverse = Mtransverse / 21700 kN-m), and Pn = Paxial / 20450 kN. The value of M0,longitudinal = M0,transverse (for the square section) under Pn = 20450 kN is 71900 kN-m from the uniaxial inter-action diagram. Now, using the two values of = 1.5 and 2.0, the interaction equation gives the corresponding values of 0.28 and 0.15, both smaller than 1.0. The calculations for Model 2 gives the respective ratios of 0.35 and 0.19 and those for Model 5 are 0.28 and 0.14. The next response quantity to check is the shear in columns. The maximum value of shear in all models (except Model 6) is about 383 kN. A shear capacity calculation shows a Vn capacity of 12790 kN. Therefore, the columns are not overstressed with respect to shear effects.

86 The Open Civil Engineering Journal, 2010, Volume 4 Memari et al.
It should be emphasized that the seismic forces have been determined assuming a force reduction factor R of 1.0. If an R-value larger than 1.0 was used, which would indicate hav-ing some ductility capacity, the resulting forces would be even smaller. Therefore, under the AASHTO prescribed ground acceleration for the region and the use of R=1.0, the results show no overstress in the columns. Furthermore, the results of static pushover analysis [1] are also mentioned here to illustrate the measure of ductility that the bridge piers possess. A considerable amount of transverse reinforcement would be necessary for plastic hinges to provide large dis-placement ductility. However, for low seismic regions such requirements are overly conservative. Test results [e.g., 24-29] show that if a column has 13 mm diameter hoops at 305 mm spacing and insufficient lap splice, the column will still have a small amount of ductility on the order of 1.5. How-ever, if the same column has continuous longitudinal rein-forcement, then the column will show displacement ductility on the order of 4 or higher. Based on the approach suggested by Priestley et al. [14], a displacement ductility factor of 2.81 was determined for this bridge [1]. This translates to an R factor of 2.15 according to Equal Energy Principle. If we were to use such an R-value for determination of seismic loads in the finite element analysis, the resulting forces would have been even smaller than what was presented. This reinforces the conclusion already reached that the columns of this bridge will not be overstressed under the prescribed ground acceleration. Therefore, there is no merit in retrofit-ting this bridge because of column tie spacing issue.
SUMMARY AND CONCLUDING REMARKS
In this case study paper, the bridge structure was evalu-ated based on linearly elastic analysis to show that under the AASHTO prescribed ground accelerations the columns will
not be overstressed. Such analysis results were determined to suggest that even if column tie spacing does not satisfy the AASHTO requirements, decision on retrofit of the bridge should not be based on column tie spacing.
This bridge with very tall columns has flexible two-
column bents, which can naturally result in relatively large displacements of the superstructure in even moderate earth-
quakes. The concern about displacement of the superstruc-
ture stems from the possibility of the superstructure falling off the abutments or piers. In this bridge, there is a 305 mm
bearing seat width from the centerline of the bearing to the
edge of the abutment. Moreover, concrete pedestals have been added in front of the bearing supports to prevent the
walking off of the bearings from the support. On the other
hand, the gap between the end of the girders and the back of the abutments is 229 mm, which means that if the super-
structure (as a whole) moves longitudinally toward one
abutment, it can move at most 229 mm, and therefore, there will still be sufficient bearing seat at the other end, i.e., bear-
ing will not cause a concern. In cases where the analysis
shows longitudinal displacements larger than 229 mm, the physical condition of the abutments will prevent excessive
longitudinal displacements. The in-span hinges also have
“catcher” auxiliary girders attached at the bottom of the girders, which prevent any tendency of falling off. There-
fore, considering the level of earthquakes in PA, collapse of
this superstructure due to bearing supports should not be a concern. The only recommendation here would be to add
restrainers (e.g., [30]) that connect girder ends to the abut-
ments if the pedestals that have been added later do not have sufficient anchorage to the abutment. This would provide an
added safety factor.
Fig. (17). Column interaction diagram for the 3.66 m x 3.66 m Sections and critical P-M values at bottom of columns (Note: 1 ft = 304.8
mm, 1 in. = 25.4 mm, 1 k = 4.448 kN).

Seismic Evaluation of an Elevated Highway Bridge in a Low Seismic Region The Open Civil Engineering Journal, 2010, Volume 4 87
As far as the force levels are concerned, the 0.05g earth-quake would not cause overstress in the columns as the in-teraction diagram shows. The comparison of the SEISAB analysis results as expected indicate that there is a linear re-lation between the acceleration input level and the resulting demand forces and moments. The predicted ground accelera-tion at the site of this bridge is 0.05g, but for higher accelera-tion, appropriate scaling of the linearly elastic analysis results would provide a basis for evaluation of the bridge for overload conditions.
Finally, it was mentioned that based on the result of the static pushover analysis, it can be shown that this bridge has a displacement ductility factor of 2.81 and a corresponding force reduction factor of 2.15. The literature review results also shows that bridge piers with deficient column tie spac-ing still have some ductility properties. Therefore, use of an R-value of 1.0 for analysis would be overly conservative.
ACKNOWLEDGEMENTS
Partial funding for this study was provided by PennDOT under Contract Number 359629, Work Order 4 of the Trans-portation Materials Partnership. The support of PennDOT is gratefully acknowledged. In addition, the contribution in cost-sharing for the research effort by Drexel and Penn State Universities is gratefully acknowledged. Finally, the contri-bution of Ali R. Amini, Tzu Hsieh, and Hiroki Baba, who were graduate students at the time of the study, is acknowl-edged.
REFERENCES
[1] A. M. Memari, H. G. Harris, A. A. Hamid, and A. Scanlon, Seismic
Column Reinforcement Study, Final Report No. FHWA-PA-2001-015-96-29 (Vol. 1 and Vol. 2), 2001.
[2] J. B. Mander, F. D. Panthaki, and M. T. Chaudhary, “Evaluation of seismic vulnerability of highway bridges in the eastern United
States,” Proceedings, Technical Council on Lifeline Earthquake Engineering Research, ASCE National Convention, New York,
NY, pp. 72-86, 1992. [3] R. Bolton, C. Sikorsky, S. Park, S. Choi, and N. Stubbs, “Modal
property changes of a seismically damaged concrete bridge,” ASCE Journal of Bridge Engineering, Vol. 10, No. 4, pp. 415-428, 2005.
[4] A. Caner, E. Dogan, P. Zia, and M. Hon, “Seismic performance of mutisimple-span bridges retrofitted with link slabs,” ASCE Journal
of Bridge Engineering, Vol. 7, No. 2, pp. 85-93, 2002. [5] R. DesRoches, E. Choi, R. T. Leon, S. Dyke, and M. Aschheim,
“Seismic response of multiple span steel bridges in central and southeastern United States, I: As Built,” ASCE Journal of Bridge
Engineering, Vol. 9, No. 5, pp. 464-473, 2004. [6] H. Hwang, J. B. Jernigan, and Y.-W. Lin, “Evaluation of seismic
damage to Memphis bridges and highway systems,” ASCE Journal of Bridge Engineering, Vol. 5, No. 4, pp. 322-330, 2000.
[7] A. M. Itani, M. Bruneau, L. Carden, and I. G. Buckle, “Sesimic behavior of steel girder bridge superstructures,” ASCE Journal of
Bridge Engineering, Vol. 9, No. 3, pp. 243-249, 2004. [8] C. P. Pantelides, F. Alameddine, T. Sardo, and R. Imbsen, “Seismic
retrofit of state street bridge on Interstate 80,” ASCE Journal of Bridge Engineering, Vol. 9, No. 4, pp. 333-342, 2004.
[9] R. S. Abeysinghe, E. Gavaise, M. Rosignoli, and T. Tzaveas, “Pushover analysis of inelastic seismic behavior of Greveniotikos
bridge,” ASCE Journal of Bridge Engineering, Vol. 7, No. 2, pp.
115-126, 2002. [10] AASHTO – 1996, Standard Specifications for Highway Bridges,
American Association of State Highway and Transportation Offi-cials (AASHTO). 16th ed., Washington, D.C., 1996.
[11] AASHTO – 2002, Standard Specifications for Highway Bridges, American Association of State Highway and Transportation Offi-
cials (AASHTO). 17th ed., Washington, D.C., 2002. [12] SEISAB, Seismic Analysis of Bridges – user manual, Imbson &
Associates, Inc., Version 4.3, Sacramento, CA, May 1999. [13] FHWA. Seismic Retrofitting Manual for Highway Bridges, Federal
Highway Administration, Publication No. FHWA-RD-94-052, McLean, Virginia, 1995.
[14] M. J. N. Priestly, F. Seible, and G. M. Calvi, Seismic Design and Retrofit of Bridges, John Wiley and Sons, Inc.: New York, NY, 1996.
[15] A. Pavese, D. Bolognini, and S. Peloso, “FRP seismic retrofit of
RC square hollow section bridge piers,” Journal of Earthquake En-gineering, Vol. 8, No. 1, pp. 225-250, 2004.
[16] C. P. Pantelides, L. Cercone, and F. Policelli, “Development of a specification for bridge seismic retrofit with carbon fiber reinforced
polymer composites,” Journal of Composites for Construction, Vol. 8, No. 1, pp. 88-96, 2004.
[17] Y. Xiao, “Applications of FRP composites in concrete columns,” Journal of Advances in Structural Engineering, Vol. 7, No. 4, pp.
335-343, 2009. [18] B. M. Das, Principles of Foundation Engineering, 3rd ed., PWS
Pub. Co.: Boston, 1995. [19] P. P. Xanthakos, Theory and Design of Bridges, John Wiley and
Sons, Inc.: New York, NY, 1994. [20] ASCE – ST 7, “Recommended design loads for bridges,” Commit-
tee on Loads and Forces on Bridges, ASCE Journal of Structural Engineering Division, Vol. 107, No. 7, pp. 1161-1213, 1981.
[21] J. B. Mander, J. H. Kim, and S.S. Chen, “Experimental perform-ance and modeling study of a 30-year-old bridge with steel bear-
ings,” in Transportation Research Record, No. 1393, National Academy Press, Washington, D. C., 1993, pp. 65-74.
[22] AISC-LRFD - 1994, Manual of Steel Construction – Load & Resis-tance Factor Design, 2nd ed., American Institute of Steel Construc-
tion, 1994. [23] C.-K. Wang, and C. G. Salmon, Reinforced Concrete Design, 6th
ed., Addison Wesley, 1998. [24] Y. H. Chai, M. J. N. Priestley, and F. Seible, “Seismic retrofit of
circular columns for enhanced flexural performance,” ACI Struc-tural Journal, Vol. 55, No. 5, pp. 572-584, 1991.
[25] M. J. N. Priestley, F. Seible, Y. Xiao, and R. Verma, “Steel jacket retrofitting of reinforced concrete bridge columns for enhanced
shear strength – Part 2: test results and comparison with theory,” ACI Structural Journal, Vol. 91, No. 5, pp. 537-551, 1994.
[26] H. M. Saadatmanesh, R. Ehsani, and L. Jin, “Seismic strengthening of circular bridge pier models with fiber composites,” ACI Struc-
tural Journal, Vol. 93, No. 6, pp. 639-647, 1996. [27] R. D. Sexsmith, D. Anderson, and D. English, “Cyclic behavior of
concrete bridge bents,” ACI Structural Journal, Vol. 94, No. 2, pp. 103-113, 1997.
[28] F. Seible, M. J. N. Priestley, G. A. Hegemier, and D. Innamorato, “Seismic retrofit of RC columns with continuous carbon fiber jack-
ets,” ASCE Journal of Composites for Construction, Vol. 1, No. 2, pp. 52-62, 1997.
[29] O. A. Jaradat, D. I. McLean, and M. L. Marsh, “Performance of existing bridge columns under cyclic loading – Part 1: experimental
results and observed behavior,” ACI Structural Journal, Vol. 95, No. 6, pp. 695-704, 1998.
[30] R. DesRoches, T. Pfeifer, R. T. Leon, and T. Lam, “Full-Scale Tests of Seismic Cable Restrainer Retrofits for Simply Supported
Bridges,” ASCE Journal of Bridge Engineering, Vol. 8, No. 4, pp. 191-198, 2003.
Received: March 11, 2010 Revised: July 02, 2010 Accepted: July 08, 2010
© Memari et al.; Licensee Bentham Open.
This is an open access article licensed under the terms of the Creative Commons Attribution Non-Commercial License
(http://creativecommons.org/licenses/ by-nc/3.0/) which permits unrestricted, non-commercial use, distribution and reproduction in any medium, provided the work is properly cited.