seismic driven probabilistic classification of reservoir ... · seismic driven probabilistic...
TRANSCRIPT
Geophysical Prospecting, 2013, 61, 613–629 doi: 10.1111/j.1365-2478.2012.01115.x
Seismic driven probabilistic classification of reservoir facies for staticreservoir modelling: a case history in the Barents Sea
Dario Grana1∗, Enrico Paparozzi2, Silvia Mancini3 and Cristiano Tarchiani2
1Eni E&P, San Donato Milanese, Milan, Italy (presently Stanford University, Stanford, CA, USA), 2Eni E&P, San Donato Milanese,Milan, Italy, and 3Eni Norge, Stavanger, Norway (presently Eni E&P, San Donato Milanese, Milan, Italy)
Received November 2011, revision accepted June 2012
ABSTRACTIn this paper we present a case history of seismic reservoir characterization wherewe estimate the probability of facies from seismic data and simulate a set of reser-voir models honouring seismically-derived probabilistic information. In appraisal anddevelopment phases, seismic data have a key role in reservoir characterization andstatic reservoir modelling, as in most of the cases seismic data are the only informa-tion available far away from the wells. However seismic data do not provide anydirect measurements of reservoir properties, which have then to be estimated as asolution of a joint inverse problem. For this reason, we show the application of acomplete workflow for static reservoir modelling where seismic data are integratedto derive probability volumes of facies and reservoir properties to condition reservoirgeostatistical simulations. The studied case is a clastic reservoir in the Barents Sea,where a complete data set of well logs from five wells and a set of partial-stackedseismic data are available. The multi-property workflow is based on seismic inver-sion, petrophysics and rock physics modelling. In particular, log-facies are definedon the basis of sedimentological information, petrophysical properties and also theirelastic response. The link between petrophysical and elastic attributes is preservedby introducing a rock-physics model in the inversion methodology. Finally, the un-certainty in the reservoir model is represented by multiple geostatistical realizations.The main result of this workflow is a set of facies realizations and associated rockproperties that honour, within a fixed tolerance, seismic and well log data and assessthe uncertainty associated with reservoir modelling.
Key words: Modelling, Petrophysics, Reservoir geophysics, Rock physics, Seismic.
INTRODUCTIO N
One of the main goals of reservoir modelling is to describethe complexity and heterogeneity of the reservoir. Usually,in reservoir studies, the only recorded data available awayfrom well positions are seismic amplitudes; however seismicdata do not directly provide any measurements of the reser-
∗E-mail: [email protected]
voir properties (porosity, net-pay, permeability, etc.) but onlygives information related to the elastic contrasts in the sub-surface. The uncertainty of the reservoir properties estimationfrom seismic data is generally quite large, due to the accuracyand resolution of seismic data, physical model approxima-tions and natural variability of the rock. This uncertainty canbe assessed by probabilistic inversion methodologies and canbe represented by means of geostatistical methods, which aresimulation algorithms based on prior information and spa-tial continuity models of the properties. Attributes derived
C© 2012 European Association of Geoscientists & Engineers 613

614 D. Grana et al.
from seismic data can then be used to condition geostatisticalsimulations.
The scope of this work is to show the application to areal study case in the Barents Sea of a workflow for reser-voir characterization that integrates conditioning seismic dataand their uncertainty into traditional reservoir modelling. Thisstep is not trivial, because reservoir properties (facies and rockproperties) must be recovered from elastic attributes (veloc-ities or impedances) commonly derived from seismic ampli-tudes; and the solution of the inverse problem is not unique.In this field application we applied the probabilistic inver-sion methodology published in Grana and Della Rossa (2010)to derive seismic driven facies classification and we showhere the results of the complete reservoir characterizationworkflow.
The geological scenario of this field study is a complex clas-tic reservoir that reflects similar features encountered in thepreviously published literature referring to North Sea fields(Avseth, Mukerji and Mavko 2005). The results of this casehistory are presented step-by-step, first at the selected welllocations and then along 2D sections and horizon maps ex-tracted from the 3D volume.
The workflow we adopt belongs to the category of multi-step inversion approaches, where a 3D volume of facies and/orvolumes of the probability of facies are estimated from partial-stack seismic data through two or more inversion steps as de-scribed in Bosch, Mukerji and Gonzalez 2010. These methodsare generally based on the traditional Bayesian framework andhave been applied to problems related to uncertainty evalua-tion in elastic inversion (Buland and Omre 2003) and litho-fluid prediction from seismic data (Buland et al. 2008). Theso-obtained estimated volumes of the probabilities of reservoirproperties are then used to condition reservoir geostatisticalsimulations (Mukerji et al. 2001 or Grana and Dvorkin 2011).This kind of workflow is particularly suitable in fields in anearly development phase where only a few wells are availableand seismic data are the only information recorded far awayfrom the well. Statistical rock-physics models were also usedin Bachrach et al. (2004) and Spikes et al. (2008) for jointestimation of reservoir parameters.
Another important family of inversion methods is basedon stochastic approaches, including sampling methodologiessuch as Markov chain methods (see Eidsvik et al. 2004; Larsenet al. 2006; Gunning and Glinsky 2007; Ulvmoen, Omre andBuland 2010), or geostatistical methods such as multi-pointgeostatistics (see for example Gonzalez, Mukerji and Mavko2008). These techniques allow us to include prior geologi-cal information and to condition reservoir models to seismic
and well log data, but in many cases the required computa-tional time is very high. Furthermore these methods requirea number of assumptions about prior geological information,such as the training image in multi-point geostatistics and spa-tial transition probabilities in Markov chain approaches. Thelarge computational cost is due to the number of stochastic re-alizations that have to be generated to match the seismic dataset. Several geostatistical methods have been proposed to gen-erate ensembles of reservoir property realizations: two-pointgeostatistics (for example, sequential indicator and sequen-tial Gaussian simulations, or pluri-Gaussian methods, Doyen2007) and multi-point geostatistics methods (Gonzalez,Mukerji and Mavko 2008) are the most common. Someof these methods have been combined with optimizationtechniques (such as simulated annealing, genetic algorithms,gradual deformation, probability perturbation method andensemble Kalman filter) to obtain optimal models of reservoirproperties (see Sams and Saussus 2010a; Sams et al. 2011).These methods have been applied to elastic inversion or si-multaneous inversion of elastic and reservoir properties andfacies (see Sams et al. 1999; Contreras et al. 2005; Merlettiand Torres-Verdin 2006).
The workflow we propose in this paper combines a set ofwell-known techniques such as cluster analysis, Bayes’ theory,seismic inversion and rock physics modelling. Usually, thesemethods are traditionally applied in seismic reservoir char-acterization but they are not always included in a completeworkflow. Bayesian classification techniques, for example, areoften applied to classify facies from inverted seismic attributes(Mukerji et al. 2001; Bachrach et al. 2004; Connolly andKemper 2007; Sams and Saussus 2010b), however log-faciesare typically derived from sedimentological and petrophysi-cal information and they are not necessarily linked to elasticproperties. Similarly the rock-physics model is often used forqualitative and quantitative analysis but in most of the com-mon workflows it is not included in the inversion becausethe solution of the inverse problem associated to the rockphysics estimation is not unique. The application of the com-plete workflow is presented here in three sections: 1) faciesdefinition, which includes a preliminary sensitivity analysisof well log data, formation evaluation analysis, rock physicsmodelling and log-facies classification at the well locations; 2)seismic facies classification, where we estimate the spatial dis-tribution of facies and the associated rock properties, startingfrom partial-stack seismic data; 3) geostatistical simulationsof reservoir properties, where the volumes of the seismic faciesprobabilities are used as secondary information to conditiongeostatistical simulations. The final result is a set of models
C© 2012 European Association of Geoscientists & Engineers, Geophysical Prospecting, 61, 613–629
Seismic driven probabilistic classification of reservoir facies 615
of facies and rock property realizations that are the referencestatic model used for risk analysis and dynamic fluid flowsimulations.
The main advantage of the workflow presented here is thatthe algorithm is very fast because it is based on trace-by-traceinversion. The proposed methodology overcomes the com-mon assumption of Gaussian distribution of rock propertiesby means of more flexible Gaussian mixture models in or-der to describe the multimodality of the data. A Gaussianmixture model is a linear combination of Gaussian distribu-tions. As in many practical applications where Gaussian mix-tures have been used, the clusters of the linear combinationhave a physical meaning: in rock physics and reservoir mod-elling each cluster of the mixture represents a lithological en-vironment (i.e., reservoir facies). In other words the weightsof the linear combination can be identified with the overallproportions of the facies within the reservoir. Moreover theso-obtained seismic facies volumes preserve the link to bothelastic data and petrophysical properties and their reciprocaldiscriminability.
The main limitation of the proposed workflow is the resolu-tion of the models estimated from seismic data, either facies orpetrophysical properties. As a matter of fact the probabilisticinversion does not directly integrate geostatistical techniquesand does not account for the lateral correlation imposed bythe geological features. This issue is the drawback of the trace-by-trace approach. However probabilistic inversion providesnot only the most probable model but also the probabilityvolumes of facies, elastic and petrophysical properties. Seis-mic driven facies and the associated probabilities can be in-tegrated as secondary information to condition geostatisticalsimulations of the reservoir properties, by using two-point ormulti-point geostatistics methods (see for example Dubrule2003; Doyen 2007). In our workflow we integrate the resultsof the inversion with well-known geostatistical methods suchas sequential indicator and sequential Gaussian simulation togenerate high-resolution reservoir models.
F IELD APPLICATION
The studied case history is located in the Barents Sea, off-shore Norway. The field is characterized by a clastic reservoirchannel system within a fluvio-deltaic environment of middle-late Triassic age characterized by very complex heterogeneoussand distributions. The reservoir fluid is oil. The basin, wherethe field is located, has experienced significant subsidence anduplift events. The most recent and important uplift occurredin late Pliocene and was responsible for important erosion
events. The uplift in the area is estimated to be approximately750–1000 m, estimated from vitrinite-reflectance data fromsamples from the exploration well. The Barents Sea fluvio-deltaic system is also characterized by complex structural fea-tures, with high segmentation and a complex set of faults. Thefield was covered by a marine multi-azimuth 3D seismic sur-vey, which was processed for amplitude interpretation (Buiaet al. 2010). A complete well log data set with five wells anda set of partial-stacked seismic volumes are available. Threeangle stacks were computed: the near stack corresponds to acentral angle of 17.5o, the mid stack to 32o and the far stackto 45o.
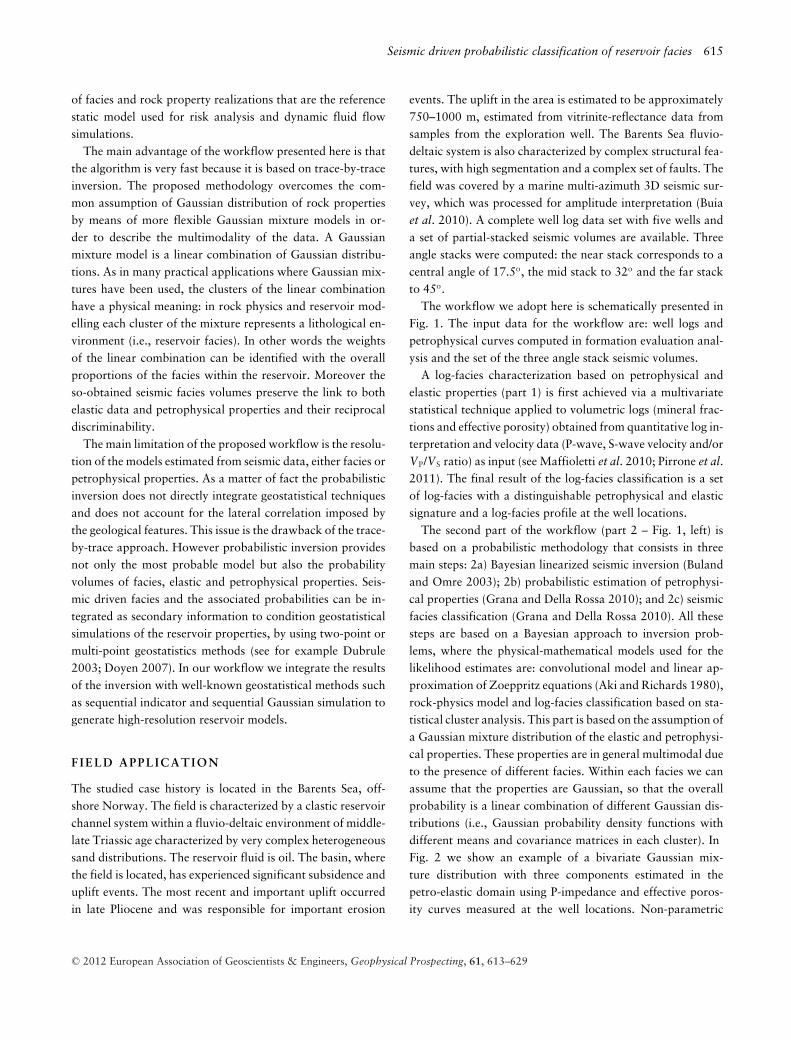
The workflow we adopt here is schematically presented inFig. 1. The input data for the workflow are: well logs andpetrophysical curves computed in formation evaluation anal-ysis and the set of the three angle stack seismic volumes.
A log-facies characterization based on petrophysical andelastic properties (part 1) is first achieved via a multivariatestatistical technique applied to volumetric logs (mineral frac-tions and effective porosity) obtained from quantitative log in-terpretation and velocity data (P-wave, S-wave velocity and/orVP/VS ratio) as input (see Maffioletti et al. 2010; Pirrone et al.2011). The final result of the log-facies classification is a setof log-facies with a distinguishable petrophysical and elasticsignature and a log-facies profile at the well locations.
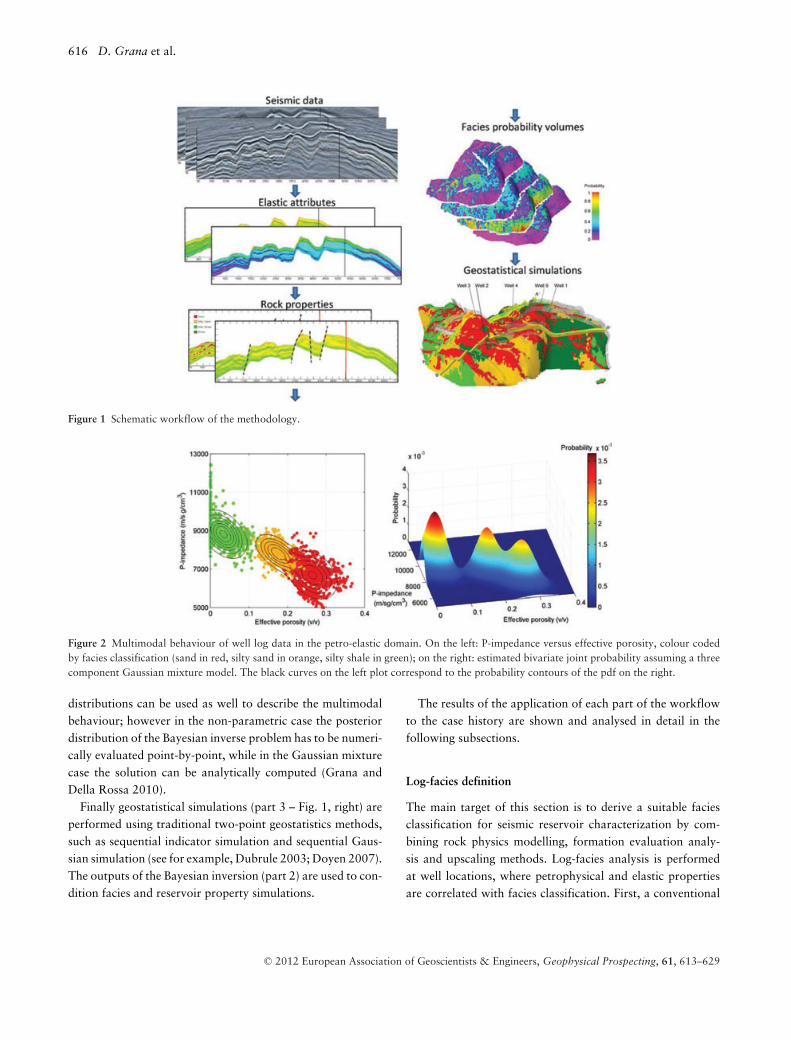
The second part of the workflow (part 2 – Fig. 1, left) isbased on a probabilistic methodology that consists in threemain steps: 2a) Bayesian linearized seismic inversion (Bulandand Omre 2003); 2b) probabilistic estimation of petrophysi-cal properties (Grana and Della Rossa 2010); and 2c) seismicfacies classification (Grana and Della Rossa 2010). All thesesteps are based on a Bayesian approach to inversion prob-lems, where the physical-mathematical models used for thelikelihood estimates are: convolutional model and linear ap-proximation of Zoeppritz equations (Aki and Richards 1980),rock-physics model and log-facies classification based on sta-tistical cluster analysis. This part is based on the assumption ofa Gaussian mixture distribution of the elastic and petrophysi-cal properties. These properties are in general multimodal dueto the presence of different facies. Within each facies we canassume that the properties are Gaussian, so that the overallprobability is a linear combination of different Gaussian dis-tributions (i.e., Gaussian probability density functions withdifferent means and covariance matrices in each cluster). InFig. 2 we show an example of a bivariate Gaussian mix-ture distribution with three components estimated in thepetro-elastic domain using P-impedance and effective poros-ity curves measured at the well locations. Non-parametric
C© 2012 European Association of Geoscientists & Engineers, Geophysical Prospecting, 61, 613–629
616 D. Grana et al.
Figure 1 Schematic workflow of the methodology.
Figure 2 Multimodal behaviour of well log data in the petro-elastic domain. On the left: P-impedance versus effective porosity, colour codedby facies classification (sand in red, silty sand in orange, silty shale in green); on the right: estimated bivariate joint probability assuming a threecomponent Gaussian mixture model. The black curves on the left plot correspond to the probability contours of the pdf on the right.
distributions can be used as well to describe the multimodalbehaviour; however in the non-parametric case the posteriordistribution of the Bayesian inverse problem has to be numeri-cally evaluated point-by-point, while in the Gaussian mixturecase the solution can be analytically computed (Grana andDella Rossa 2010).
Finally geostatistical simulations (part 3 – Fig. 1, right) areperformed using traditional two-point geostatistics methods,such as sequential indicator simulation and sequential Gaus-sian simulation (see for example, Dubrule 2003; Doyen 2007).The outputs of the Bayesian inversion (part 2) are used to con-dition facies and reservoir property simulations.
The results of the application of each part of the workflowto the case history are shown and analysed in detail in thefollowing subsections.
Log-facies definition
The main target of this section is to derive a suitable faciesclassification for seismic reservoir characterization by com-bining rock physics modelling, formation evaluation analy-sis and upscaling methods. Log-facies analysis is performedat well locations, where petrophysical and elastic propertiesare correlated with facies classification. First, a conventional
C© 2012 European Association of Geoscientists & Engineers, Geophysical Prospecting, 61, 613–629
Seismic driven probabilistic classification of reservoir facies 617
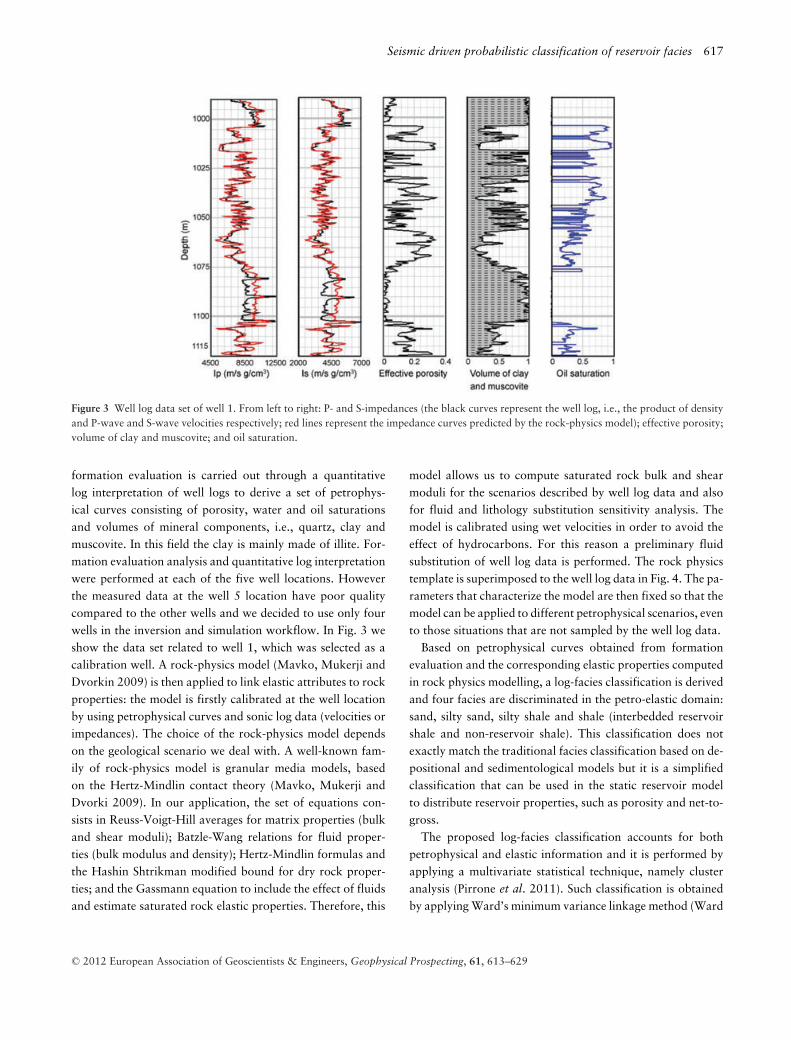
Figure 3 Well log data set of well 1. From left to right: P- and S-impedances (the black curves represent the well log, i.e., the product of densityand P-wave and S-wave velocities respectively; red lines represent the impedance curves predicted by the rock-physics model); effective porosity;volume of clay and muscovite; and oil saturation.
formation evaluation is carried out through a quantitativelog interpretation of well logs to derive a set of petrophys-ical curves consisting of porosity, water and oil saturationsand volumes of mineral components, i.e., quartz, clay andmuscovite. In this field the clay is mainly made of illite. For-mation evaluation analysis and quantitative log interpretationwere performed at each of the five well locations. Howeverthe measured data at the well 5 location have poor qualitycompared to the other wells and we decided to use only fourwells in the inversion and simulation workflow. In Fig. 3 weshow the data set related to well 1, which was selected as acalibration well. A rock-physics model (Mavko, Mukerji andDvorkin 2009) is then applied to link elastic attributes to rockproperties: the model is firstly calibrated at the well locationby using petrophysical curves and sonic log data (velocities orimpedances). The choice of the rock-physics model dependson the geological scenario we deal with. A well-known fam-ily of rock-physics model is granular media models, basedon the Hertz-Mindlin contact theory (Mavko, Mukerji andDvorki 2009). In our application, the set of equations con-sists in Reuss-Voigt-Hill averages for matrix properties (bulkand shear moduli); Batzle-Wang relations for fluid proper-ties (bulk modulus and density); Hertz-Mindlin formulas andthe Hashin Shtrikman modified bound for dry rock proper-ties; and the Gassmann equation to include the effect of fluidsand estimate saturated rock elastic properties. Therefore, this
model allows us to compute saturated rock bulk and shearmoduli for the scenarios described by well log data and alsofor fluid and lithology substitution sensitivity analysis. Themodel is calibrated using wet velocities in order to avoid theeffect of hydrocarbons. For this reason a preliminary fluidsubstitution of well log data is performed. The rock physicstemplate is superimposed to the well log data in Fig. 4. The pa-rameters that characterize the model are then fixed so that themodel can be applied to different petrophysical scenarios, evento those situations that are not sampled by the well log data.
Based on petrophysical curves obtained from formationevaluation and the corresponding elastic properties computedin rock physics modelling, a log-facies classification is derivedand four facies are discriminated in the petro-elastic domain:sand, silty sand, silty shale and shale (interbedded reservoirshale and non-reservoir shale). This classification does notexactly match the traditional facies classification based on de-positional and sedimentological models but it is a simplifiedclassification that can be used in the static reservoir modelto distribute reservoir properties, such as porosity and net-to-gross.
The proposed log-facies classification accounts for bothpetrophysical and elastic information and it is performed byapplying a multivariate statistical technique, namely clusteranalysis (Pirrone et al. 2011). Such classification is obtainedby applying Ward’s minimum variance linkage method (Ward
C© 2012 European Association of Geoscientists & Engineers, Geophysical Prospecting, 61, 613–629
618 D. Grana et al.
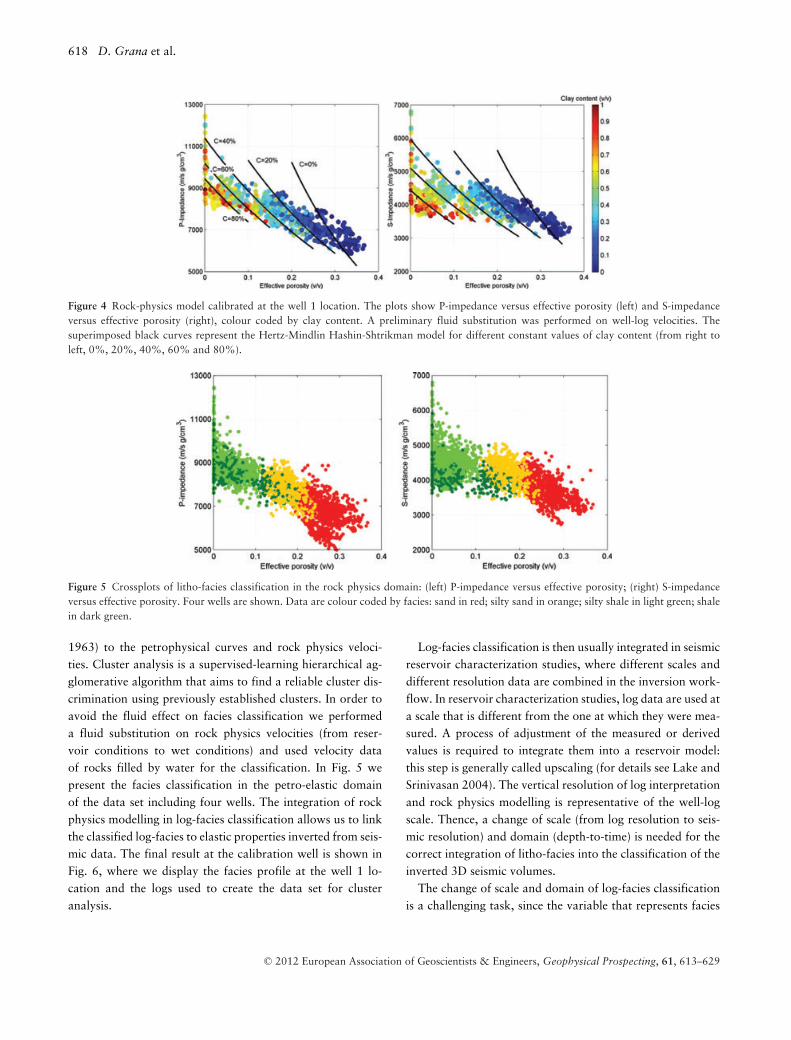
Figure 4 Rock-physics model calibrated at the well 1 location. The plots show P-impedance versus effective porosity (left) and S-impedanceversus effective porosity (right), colour coded by clay content. A preliminary fluid substitution was performed on well-log velocities. Thesuperimposed black curves represent the Hertz-Mindlin Hashin-Shtrikman model for different constant values of clay content (from right toleft, 0%, 20%, 40%, 60% and 80%).
Figure 5 Crossplots of litho-facies classification in the rock physics domain: (left) P-impedance versus effective porosity; (right) S-impedanceversus effective porosity. Four wells are shown. Data are colour coded by facies: sand in red; silty sand in orange; silty shale in light green; shalein dark green.
1963) to the petrophysical curves and rock physics veloci-ties. Cluster analysis is a supervised-learning hierarchical ag-glomerative algorithm that aims to find a reliable cluster dis-crimination using previously established clusters. In order toavoid the fluid effect on facies classification we performeda fluid substitution on rock physics velocities (from reser-voir conditions to wet conditions) and used velocity dataof rocks filled by water for the classification. In Fig. 5 wepresent the facies classification in the petro-elastic domainof the data set including four wells. The integration of rockphysics modelling in log-facies classification allows us to linkthe classified log-facies to elastic properties inverted from seis-mic data. The final result at the calibration well is shown inFig. 6, where we display the facies profile at the well 1 lo-cation and the logs used to create the data set for clusteranalysis.
Log-facies classification is then usually integrated in seismicreservoir characterization studies, where different scales anddifferent resolution data are combined in the inversion work-flow. In reservoir characterization studies, log data are used ata scale that is different from the one at which they were mea-sured. A process of adjustment of the measured or derivedvalues is required to integrate them into a reservoir model:this step is generally called upscaling (for details see Lake andSrinivasan 2004). The vertical resolution of log interpretationand rock physics modelling is representative of the well-logscale. Thence, a change of scale (from log resolution to seis-mic resolution) and domain (depth-to-time) is needed for thecorrect integration of litho-facies into the classification of theinverted 3D seismic volumes.
The change of scale and domain of log-facies classificationis a challenging task, since the variable that represents facies
C© 2012 European Association of Geoscientists & Engineers, Geophysical Prospecting, 61, 613–629
Seismic driven probabilistic classification of reservoir facies 619
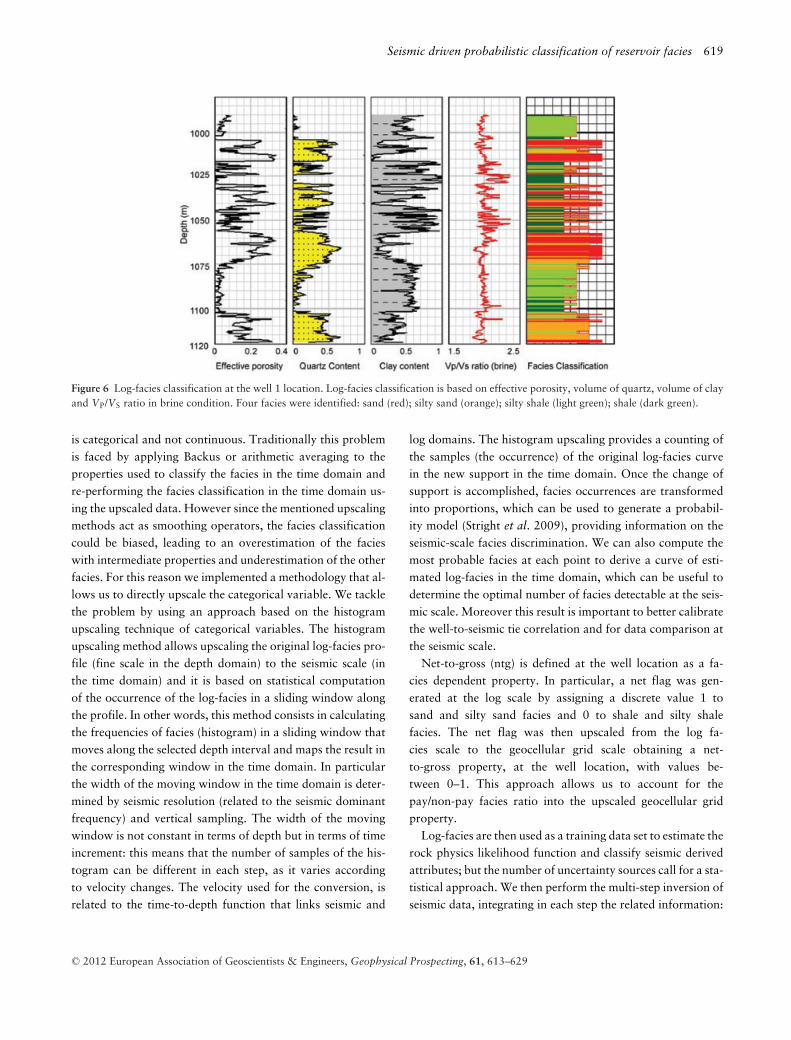
Figure 6 Log-facies classification at the well 1 location. Log-facies classification is based on effective porosity, volume of quartz, volume of clayand VP/VS ratio in brine condition. Four facies were identified: sand (red); silty sand (orange); silty shale (light green); shale (dark green).
is categorical and not continuous. Traditionally this problemis faced by applying Backus or arithmetic averaging to theproperties used to classify the facies in the time domain andre-performing the facies classification in the time domain us-ing the upscaled data. However since the mentioned upscalingmethods act as smoothing operators, the facies classificationcould be biased, leading to an overestimation of the facieswith intermediate properties and underestimation of the otherfacies. For this reason we implemented a methodology that al-lows us to directly upscale the categorical variable. We tacklethe problem by using an approach based on the histogramupscaling technique of categorical variables. The histogramupscaling method allows upscaling the original log-facies pro-file (fine scale in the depth domain) to the seismic scale (inthe time domain) and it is based on statistical computationof the occurrence of the log-facies in a sliding window alongthe profile. In other words, this method consists in calculatingthe frequencies of facies (histogram) in a sliding window thatmoves along the selected depth interval and maps the result inthe corresponding window in the time domain. In particularthe width of the moving window in the time domain is deter-mined by seismic resolution (related to the seismic dominantfrequency) and vertical sampling. The width of the movingwindow is not constant in terms of depth but in terms of timeincrement: this means that the number of samples of the his-togram can be different in each step, as it varies accordingto velocity changes. The velocity used for the conversion, isrelated to the time-to-depth function that links seismic and
log domains. The histogram upscaling provides a counting ofthe samples (the occurrence) of the original log-facies curvein the new support in the time domain. Once the change ofsupport is accomplished, facies occurrences are transformedinto proportions, which can be used to generate a probabil-ity model (Stright et al. 2009), providing information on theseismic-scale facies discrimination. We can also compute themost probable facies at each point to derive a curve of esti-mated log-facies in the time domain, which can be useful todetermine the optimal number of facies detectable at the seis-mic scale. Moreover this result is important to better calibratethe well-to-seismic tie correlation and for data comparison atthe seismic scale.
Net-to-gross (ntg) is defined at the well location as a fa-cies dependent property. In particular, a net flag was gen-erated at the log scale by assigning a discrete value 1 tosand and silty sand facies and 0 to shale and silty shalefacies. The net flag was then upscaled from the log fa-cies scale to the geocellular grid scale obtaining a net-to-gross property, at the well location, with values be-tween 0–1. This approach allows us to account for thepay/non-pay facies ratio into the upscaled geocellular gridproperty.
Log-facies are then used as a training data set to estimate therock physics likelihood function and classify seismic derivedattributes; but the number of uncertainty sources call for a sta-tistical approach. We then perform the multi-step inversion ofseismic data, integrating in each step the related information:
C© 2012 European Association of Geoscientists & Engineers, Geophysical Prospecting, 61, 613–629
620 D. Grana et al.
seismic amplitudes, rock physics predictions, petrophysicalcurves and log-facies.
Seismic facies classification
The petro-elastic properties inversion and facies classificationfrom seismic data are performed by applying three differentsteps.
The first step (step a) of the inversion methodology is aBayesian linearized elastic inversion that allows us to obtaina set of volumes of the probability of elastic properties (veloc-ities or impedances) conditioned by the recorded seismic am-plitudes. From these probability volumes, we infer the prob-ability of petrophysical properties (porosity, clay content andwater saturation) in the whole 3D volume (step b), by intro-ducing the so-called rock physics likelihood function, whichdescribes the conditional probability of petrophysical proper-ties conditioned by elastic attributes. The final step (step c)allows us to classify seismic scale reservoir-facies by using thelog-facies as a training data set for the likelihood and condi-tional probabilities obtained in the previous steps. Each stepof the inversion method is based on a full Bayesian approach.In what follows we describe the details of each step and wesummarize the mathematical formulation.
Bayesian linearized seismic inversion is a well-known tech-nique that was presented by Buland and Omre (2003). Theprobabilistic approach to traditional inversion based on theconvolutional method and linearized approximation of Zoep-pritz equations, allows us to estimate, trace-by-trace, the pos-
terior probabilities of elastic properties conditioned by seis-mic data. The advantage of such a technique compared todeterministic inversion methods is that the Bayesian approachprovides, at each data point, the full distribution of the seis-mic attributes, which means that measures of accuracy can beinferred from pointwise distributions.
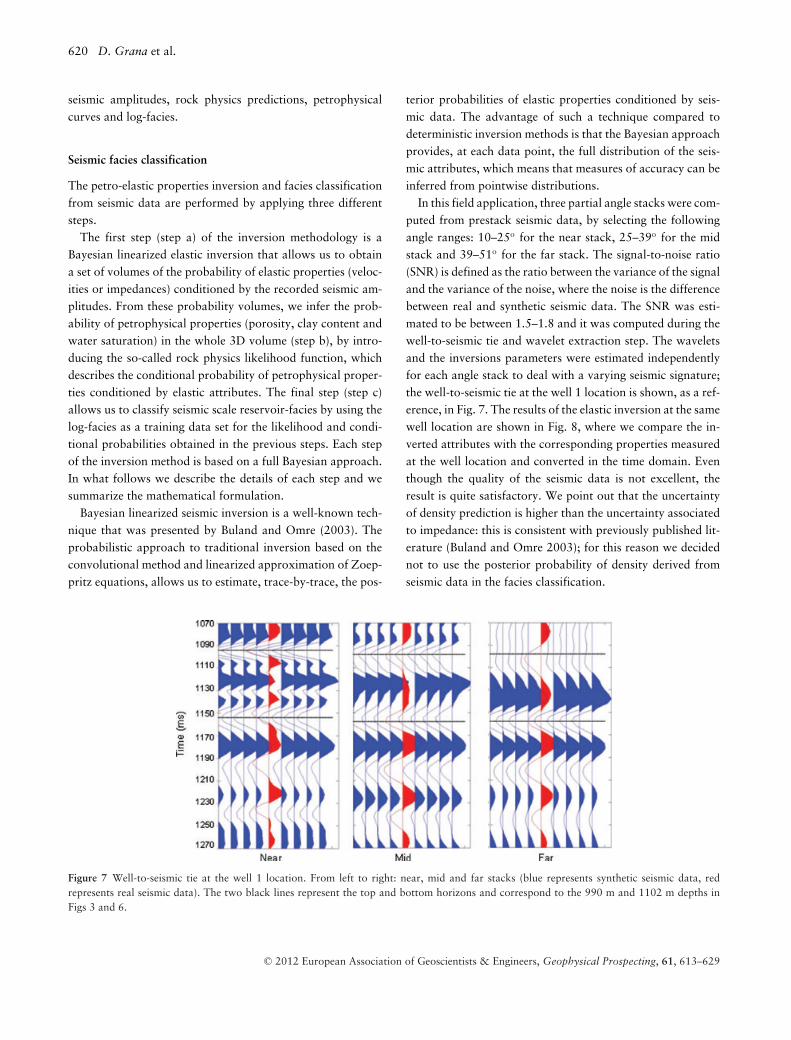
In this field application, three partial angle stacks were com-puted from prestack seismic data, by selecting the followingangle ranges: 10–25o for the near stack, 25–39o for the midstack and 39–51o for the far stack. The signal-to-noise ratio(SNR) is defined as the ratio between the variance of the signaland the variance of the noise, where the noise is the differencebetween real and synthetic seismic data. The SNR was esti-mated to be between 1.5–1.8 and it was computed during thewell-to-seismic tie and wavelet extraction step. The waveletsand the inversions parameters were estimated independentlyfor each angle stack to deal with a varying seismic signature;the well-to-seismic tie at the well 1 location is shown, as a ref-erence, in Fig. 7. The results of the elastic inversion at the samewell location are shown in Fig. 8, where we compare the in-verted attributes with the corresponding properties measuredat the well location and converted in the time domain. Eventhough the quality of the seismic data is not excellent, theresult is quite satisfactory. We point out that the uncertaintyof density prediction is higher than the uncertainty associatedto impedance: this is consistent with previously published lit-erature (Buland and Omre 2003); for this reason we decidednot to use the posterior probability of density derived fromseismic data in the facies classification.
Figure 7 Well-to-seismic tie at the well 1 location. From left to right: near, mid and far stacks (blue represents synthetic seismic data, redrepresents real seismic data). The two black lines represent the top and bottom horizons and correspond to the 990 m and 1102 m depths inFigs 3 and 6.
C© 2012 European Association of Geoscientists & Engineers, Geophysical Prospecting, 61, 613–629

Seismic driven probabilistic classification of reservoir facies 621
Figure 8 Seismic inversion results at the well 1 location. Inverted profiles of P- and S-impedances and density (red) compared to the actual log(blue). The distribution quantiles P25 and P75 are represented by red dashed lines. The prior model (green) is superimposed for completenessof information.
Then, a statistical rock physics approach (Mukerji et al.2001) is adopted to manage the uncertainties relating to lithol-ogy, petrophysics and elastic properties estimated from seis-mic data. In a clastic reservoir, we can assume that the set ofpetrophysical properties is made by porosity, clay content andwater saturation and the set of elastic attributes consists in P-and S-impedances. Typically in the Bayesian approach to rockphysics inverse modelling we have to introduce some assump-tions about the prior distribution of the data. In our method-ology, the prior distribution of the petrophysical variables,as well as the rock physics likelihood function, is modelledusing a multivariate Gaussian mixture distribution instead ofa Gaussian model. The assumption that the joint probabil-ity is distributed according to a Gaussian mixture model andthe analytical derivation of the linear inverse problem in theGaussian mixture case (Grana and Della Rossa 2010) allowus to derive the conditional probability of petrophysical prop-erties conditioned by impedance values. The workflow alsotakes into account the change of scale and domain in theprobabilistic workflow. Thence, the conditional probabilitiesof elastic properties are estimated at a coarse scale after apply-ing the Backus average (Backus 1962) to rock-physics modelpredictions, taking into account the uncertainty associated tothe scale change. This conditional probability is finally com-
bined with the probability of elastic properties obtained fromthe Bayesian inversion to obtain the posterior probability ofpetrophysical properties. Finally the posterior probability offacies is numerically computed.
We summarize here the mathematical formulation to derivethe probability of seismic facies conditioned by partial-stackseismic amplitudes (for a full description we refer the readerto Grana and Della Rossa 2010). First of all we assume aprior distribution of elastic attributes mc (seismic impedances,where the superscript c indicates properties at a coarse/seismicscale) and we compute the posterior distribution conditionedby seismic data S, by assuming a log normal distributionof mc:
P(mc | S) ∝ P(S | mc)P(mc). (1)
The prior model of elastic properties P(mc) is pointwise.In particular the covariance matrix is estimated at the welllocation and it is constant in the whole grid, whereas themean values are obtained from the background low-frequencytrend of elastic attributes. The low-frequency trend can beobtained by using different methods; in our workflow weapplied collocated cokriging (Doyen 2007) using the stackingvelocity volume used for the processing of seismic amplitudes,a density volume obtained by the Gardner relation and sonic
C© 2012 European Association of Geoscientists & Engineers, Geophysical Prospecting, 61, 613–629

622 D. Grana et al.
well-logs filtered at low frequency (12 Hz). Then we estimatethe probability of fine scale elastic attributes mf conditionedby the elastic properties at coarse scale mc, namely P(mf |mc),from impedances of pseudo-log data. We then estimate theprobability of reservoir properties R as:
P(R | S) =∫ ∫
P(R | mf )P(mf | mc)P(mc | S) dmf dmc, (2)
where P(R|mf ) is the rock physics likelihood estimated bystatistical rock physics modelling and it is assumed to be aGaussian mixture model:
R | mf ∼L∑
k=1
λk(mf )N(
R; μkR | m f , �
kR | m f
). (3)
where L is the number of Gaussian components, λk(mf ) arethe conditional weights, N represents the Gaussian probabil-ity density function and μk
R|m f , �kR|m f are respectively the con-
ditional means and covariance matrices of each component.Finally the probability of seismic facies F is obtained as:
P(F | S) =∫
P(F | R)P(R | S) dR (4)
where P(F |R) is the probability of facies given the rock prop-erties.
For simplicity of notation we used scalar variables but theformulation is still valid in the multi-variable case. In our fieldapplication m = [IP, IS] is the vector of elastic properties, i.e.,P- and S-impedances, R = [φ, C, SW] is the vector of rockproperties, i.e., porosity, clay content and water saturationand F are the litho-fluid classes. In particular we estimate theposterior probability of six litho-fluid classes: shale, silty shale,water silty sand, oil silty sand, water sand and oil sand. Theposterior probabilities of water silty sand and oil silty sand aresummed to obtain the probability of silty sand facies. Similarlyprobabilities of water sand and oil sand are summed to obtainthe probability of sand facies.
The prior probabilities of facies were estimated using thefacies classification combined with the saturation log at thewell locations. Sand, silty sand and silty shale have approxi-mately equiprobable distributions, whereas the probability ofshale in the reservoir is lower. The parameters of the Gaus-sian mixture models (weights, means and covariance matri-ces of the Gaussian components) describing the rock-physicslikelihood functions in equations (2) and (4) were estimatedusing petro-elastic property logs at the well locations as well.Since at well locations the shale facies contains only a fewsamples, we extended the training data set by using MonteCarlo simulations and applying the rock-physics model (seefor example Avseth, Mukerji and Mavko 2005). In shale, the
effective porosity is near zero, so the rock-physics model re-duces to the computation of velocities and the density of amatrix made of wet clay, by means of the Voigt-Reuss-Hillaverage and we obtain a good approximation of the velocitiesin shale.
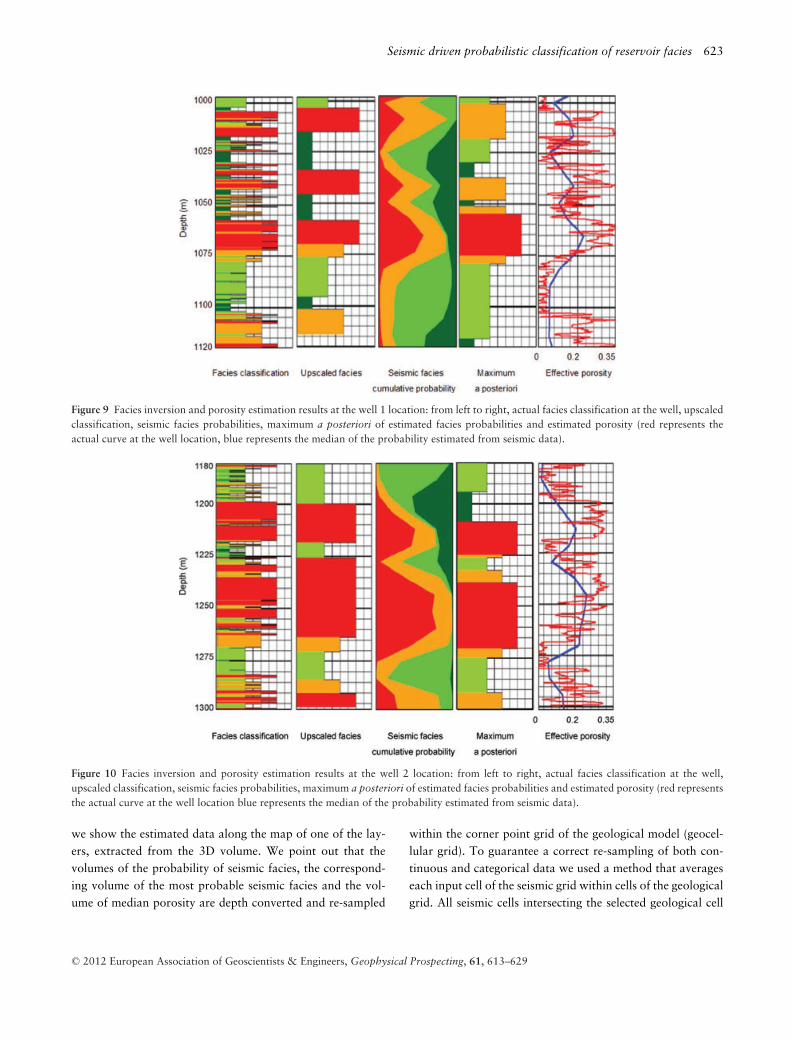
The inversion workflow was first applied at the well loca-tions to verify the results and test the associated assumptions.In Fig. 9 we show the results of the estimation of porosityand facies classification at the calibration well location (well1). The results in terms of facies prediction are not perfect: inparticular there are misclassifications between sand and siltysand and between silty sand and silty shale. These misclassi-fications were partially expected because of the low qualityof the seismic data and the overlap between different faciesobservable in the rock physics templates (Fig. 6). Howeverwe want to point out that the maximum a posteriori of theposterior probability of facies is not an exhaustive estima-tor especially for inverse problems with wide spread posteriordistributions; nevertheless we observe in Fig. 9 that the fluc-tuations of the probability curves estimated from seismic datahave a good match with the upscaled profile. We then per-formed the same inversion to another well data set availablein the field, namely well 2 (Fig. 10): the results are quite satis-factory if we compare the estimated seismic facies profile withthe upscaled facies classification at the well location. Simi-larly we observe that the extracted statistical estimator of theproperty (in our case we chose the mode of facies probabil-ity and the median of porosity distribution) is not exhaustive.However, the methodology also provides the pointwise fullprobability distribution that can be used to describe the localvariability of the property. We recall that in this case historywe have not used the typical Gaussian assumption but weused a linear combination of Gaussian models to describe themultimodality of the data. With multimodal data, traditionalparameter estimators, such as the mean or the median do notprovide exhaustive information; however we notice that themain trend is correctly captured (Figs. 9 and 10).
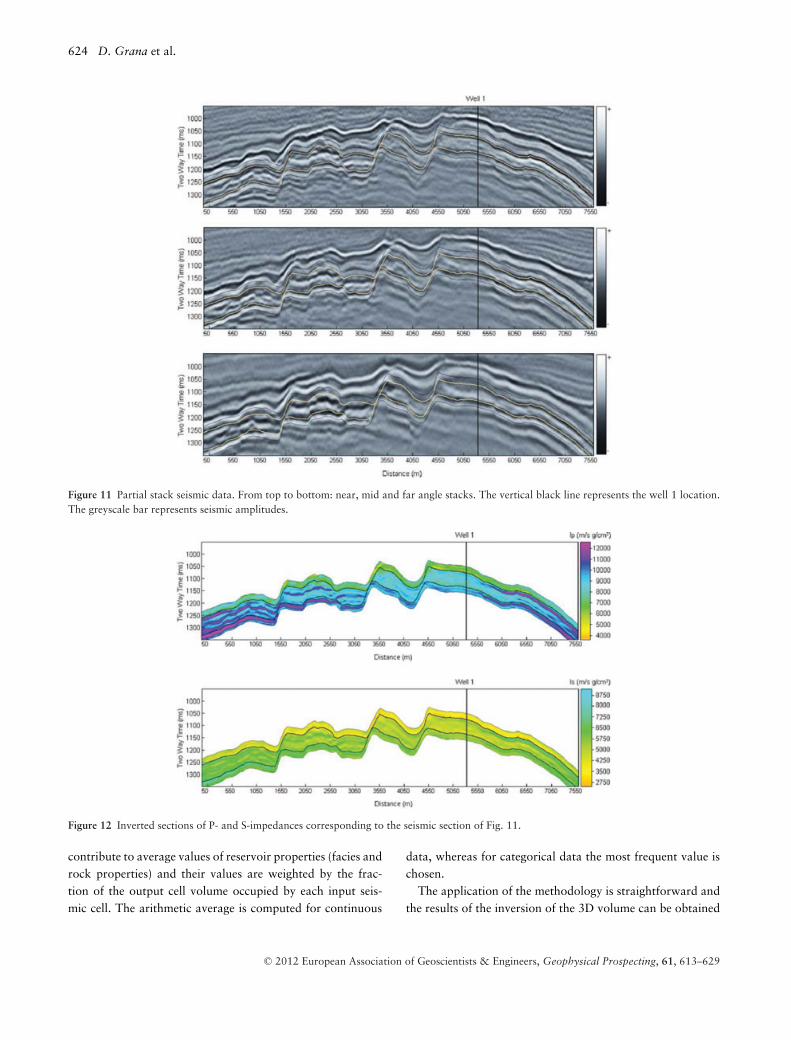
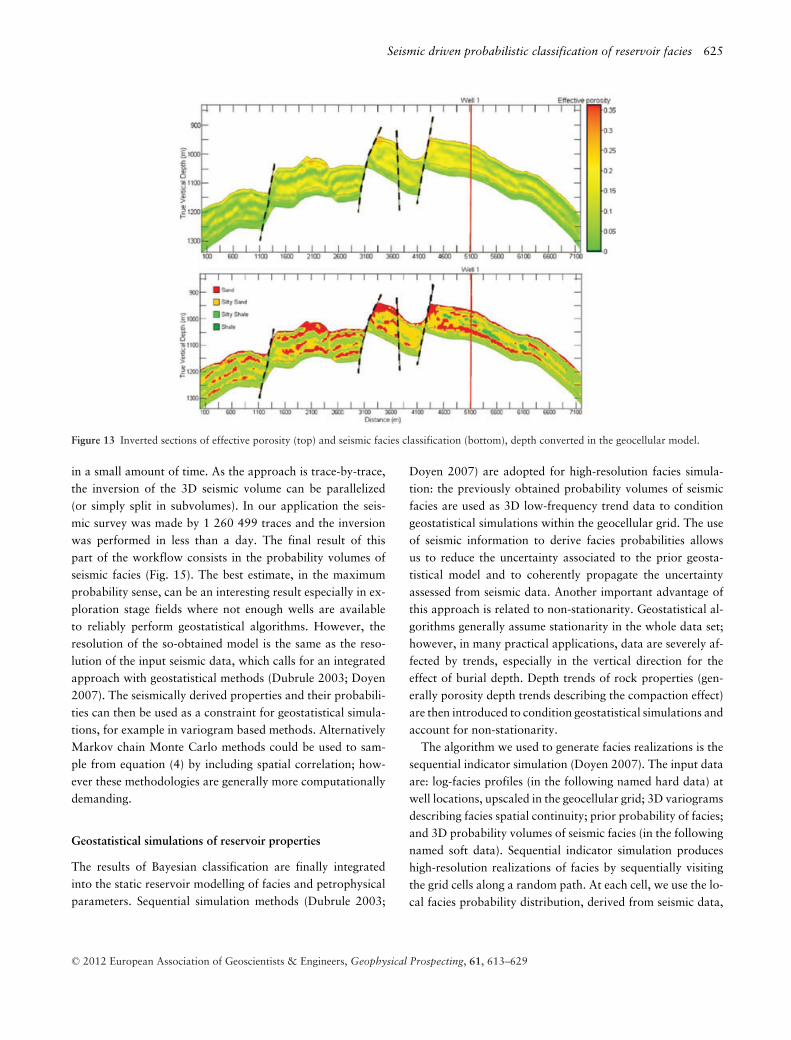
We finally applied the inversion methodology to the wholeseismic survey. A 2D section of the seismic data set is shown inFig. 11. The corresponding inverted sections of elastic proper-ties (P- and S-impedances) are shown in Fig. 12, whereas thepredicted porosity and the classified seismic facies are shownin Fig. 13. Porosity is actually the median of the pointwiseprobability distribution obtained from the probabilistic petro-physical properties estimation; on the other hand, the seismicfacies section was obtained as the maximum of the posteriorprobability of seismic facies (Fig. 14). The final results of theinversion for the reservoir layer are shown in Fig. 15, where
C© 2012 European Association of Geoscientists & Engineers, Geophysical Prospecting, 61, 613–629
Seismic driven probabilistic classification of reservoir facies 623
Figure 9 Facies inversion and porosity estimation results at the well 1 location: from left to right, actual facies classification at the well, upscaledclassification, seismic facies probabilities, maximum a posteriori of estimated facies probabilities and estimated porosity (red represents theactual curve at the well location, blue represents the median of the probability estimated from seismic data).
Figure 10 Facies inversion and porosity estimation results at the well 2 location: from left to right, actual facies classification at the well,upscaled classification, seismic facies probabilities, maximum a posteriori of estimated facies probabilities and estimated porosity (red representsthe actual curve at the well location blue represents the median of the probability estimated from seismic data).
we show the estimated data along the map of one of the lay-ers, extracted from the 3D volume. We point out that thevolumes of the probability of seismic facies, the correspond-ing volume of the most probable seismic facies and the vol-ume of median porosity are depth converted and re-sampled
within the corner point grid of the geological model (geocel-lular grid). To guarantee a correct re-sampling of both con-tinuous and categorical data we used a method that averageseach input cell of the seismic grid within cells of the geologicalgrid. All seismic cells intersecting the selected geological cell
C© 2012 European Association of Geoscientists & Engineers, Geophysical Prospecting, 61, 613–629
624 D. Grana et al.
Figure 11 Partial stack seismic data. From top to bottom: near, mid and far angle stacks. The vertical black line represents the well 1 location.The greyscale bar represents seismic amplitudes.
Figure 12 Inverted sections of P- and S-impedances corresponding to the seismic section of Fig. 11.
contribute to average values of reservoir properties (facies androck properties) and their values are weighted by the frac-tion of the output cell volume occupied by each input seis-mic cell. The arithmetic average is computed for continuous
data, whereas for categorical data the most frequent value ischosen.
The application of the methodology is straightforward andthe results of the inversion of the 3D volume can be obtained
C© 2012 European Association of Geoscientists & Engineers, Geophysical Prospecting, 61, 613–629
Seismic driven probabilistic classification of reservoir facies 625
Figure 13 Inverted sections of effective porosity (top) and seismic facies classification (bottom), depth converted in the geocellular model.
in a small amount of time. As the approach is trace-by-trace,the inversion of the 3D seismic volume can be parallelized(or simply split in subvolumes). In our application the seis-mic survey was made by 1 260 499 traces and the inversionwas performed in less than a day. The final result of thispart of the workflow consists in the probability volumes ofseismic facies (Fig. 15). The best estimate, in the maximumprobability sense, can be an interesting result especially in ex-ploration stage fields where not enough wells are availableto reliably perform geostatistical algorithms. However, theresolution of the so-obtained model is the same as the reso-lution of the input seismic data, which calls for an integratedapproach with geostatistical methods (Dubrule 2003; Doyen2007). The seismically derived properties and their probabili-ties can then be used as a constraint for geostatistical simula-tions, for example in variogram based methods. AlternativelyMarkov chain Monte Carlo methods could be used to sam-ple from equation (4) by including spatial correlation; how-ever these methodologies are generally more computationallydemanding.
Geostatistical simulations of reservoir properties
The results of Bayesian classification are finally integratedinto the static reservoir modelling of facies and petrophysicalparameters. Sequential simulation methods (Dubrule 2003;
Doyen 2007) are adopted for high-resolution facies simula-tion: the previously obtained probability volumes of seismicfacies are used as 3D low-frequency trend data to conditiongeostatistical simulations within the geocellular grid. The useof seismic information to derive facies probabilities allowsus to reduce the uncertainty associated to the prior geosta-tistical model and to coherently propagate the uncertaintyassessed from seismic data. Another important advantage ofthis approach is related to non-stationarity. Geostatistical al-gorithms generally assume stationarity in the whole data set;however, in many practical applications, data are severely af-fected by trends, especially in the vertical direction for theeffect of burial depth. Depth trends of rock properties (gen-erally porosity depth trends describing the compaction effect)are then introduced to condition geostatistical simulations andaccount for non-stationarity.
The algorithm we used to generate facies realizations is thesequential indicator simulation (Doyen 2007). The input dataare: log-facies profiles (in the following named hard data) atwell locations, upscaled in the geocellular grid; 3D variogramsdescribing facies spatial continuity; prior probability of facies;and 3D probability volumes of seismic facies (in the followingnamed soft data). Sequential indicator simulation produceshigh-resolution realizations of facies by sequentially visitingthe grid cells along a random path. At each cell, we use the lo-cal facies probability distribution, derived from seismic data,
C© 2012 European Association of Geoscientists & Engineers, Geophysical Prospecting, 61, 613–629

626 D. Grana et al.
Figure 14 Seismic facies probabilities estimated by Bayesian inversion. From top to bottom: posterior probability of sand, silty sand, silty shaleand shale. The 2D section corresponds to the section shown in Fig. 11.
to condition the simulations. This procedure is repeated forall the cells of the 3D volume. At each cell, the simulated valuedepends on the prior distribution and on the previously sim-ulated cell values in the neighbourhood of the given cell. Thevariograms ensure the control of the facies spatial continuityin the 3D space.
Within each facies, relevant sets of petrophysical propertiesare finally simulated by sequential Gaussian simulation, con-
ditioned by the probabilities of petrophysical properties esti-mated from the seismic volume. Typically, porosity is first sim-ulated through sequential Gaussian simulation (Doyen 2007);then other properties, such as net-to-gross and permeability,can be further co-simulated using facies or porosity realiza-tions as conditioning information.
In our application, the probability volumes are used tocondition the distributions of reservoir parameters according
C© 2012 European Association of Geoscientists & Engineers, Geophysical Prospecting, 61, 613–629

Seismic driven probabilistic classification of reservoir facies 627
Figure 15 3D view of the posterior probability of seismic facies along a layer within the reservoir. From top left to bottom right: sand, siltysand, silty shale and shale.
to sequential indicator and sequential Gaussian simulationsmethods. The simulations we performed are also conditionedby hard data, represented by the collocated facies profile atthe well log locations. To account for non-stationarity, thereservoir was subdivided into 9 sub-layers, corresponding todifferent geological sequences. The sub-layering was estab-lished by correlating the stratigraphic sequences at the welllocations. In each sub-layer different variogram models wereused. We assumed a 3D exponential variogram model, withdifferent parameters in each sub-layer and for each facies. Forexample in the central zone of the reservoir we used the fol-lowing parameters: correlation ranges (10000, 2000, 8) forsand, (3000, 1500, 2) for silty sand, (3500, 2000, 4) for siltyshale and (3500, 3500, 4) for shale (where each set of numbersrepresents the maximum and minimum horizontal range andthe vertical range of the variogram). The vertical ranges wereestimated at the well locations, while the lateral parameterscome from prior geological knowledge of the field and nearbyor analogue field information since there are only five wellsin this field. In particular, the simulation of porosity for eachfacies is performed independently of the simulations for otherfacies; each simulation is performed over the whole 3D grid,then the simulations are re-assembled into the final simulatedporosity realization according to the facies classification.
The integration of geostatistics allowed us to generate aset of 200 stochastic realizations of the reservoir properties,in particular porosity and facies. This ensemble of reservoirmodels is used to represent the geological uncertainties due to
the natural variability and heterogeneity of the rocks withinthe reservoir. Dynamic reservoir properties, such as perme-ability, were also subsequently co-simulated creating differentconnectivity models within the reservoir. For each reservoirmodel we computed the total net-pay and the total oil inplace and the corresponding posterior statistics. The realiza-tion shown in Fig. 16 is the one with a total oil-in-place valuecloser to the ensemble average of the set of realizations. Thisrealization was selected as the reference model (static model)to run dynamic fluid flow simulations within the reservoirsimulator.
This study was crucial to update the original reservoir modelpreviously obtained using a traditional characterization work-flow. In particular, the advanced techniques used in formationevaluation analysis and rock physics modelling and the pro-cessing methods used for seismic data allowed improving thequality and the reliability of the final model. This case historywas performed using a limited amount of wells. The reservoirmodel and all the physical relations used to build the modelcould be eventually updated when new data sets are availablefrom new wells. The rock-physics model used in this study issimilar to the model used for many studies in the North Sea. Ifthe new wells confirm that the described rock-physics modelcan be easily adapted to the reservoir in the Barents Sea, thismodel could also be used in exploration settings. Comparedto previous studies performed on the same area using tradi-tional methods, the so-obtained reservoir model gives similarresults in terms of net-pay and total oil-in-place but shows
C© 2012 European Association of Geoscientists & Engineers, Geophysical Prospecting, 61, 613–629

628 D. Grana et al.
Figure 16 Reservoir model obtained by simulating facies distribution conditioned by the seismic facies probability obtained by the proposedmethodology. The 2D section labelled A shows porosity estimated from seismic data; the 2D section labelled B shows the simulated porosity(obtained by sequential Gaussian simulation).
different features in terms of continuity and connectivity. Inparticular, according to prior geological information, the finalreservoir model better honours the length of the sand geobod-ies and the continuity of the reservoir properties within eachgeobody, which could produce a quite significant differencein the dynamic model results. In future activities, these resultsshould be validated using history matching during produc-tion, by comparing production data at well locations withproduction estimates obtained from the reservoir simulator.
CONCLUSIONS
This paper illustrates the application of a complete workflowto a case history related to a complex clastic reservoir in theBarents Sea characterized by sparse well data. This workflowconsists in the integration of four different disciplines: seismicinversion, rock physics, reservoir facies modelling and geo-statistical simulations and it aims to strengthen the reservoirdescription based on seismic information. The main advantageof the proposed workflow is that it provides reliable proba-bility volumes of petrophysical properties and reservoir fa-cies throughout a straight integration of elastic attributes andpetrophysical parameters. These volumes can be used bothin quantitative seismic interpretation and reservoir modellingsince log-facies estimated at well locations are consistent bothin geological and geophysical domains. In this field applica-tion, we used the set of probability volumes as a low-frequencytrend in geostatistical simulations in order to reduce the un-certainty associated to the prior geostatistical model and tocoherently propagate the uncertainty related to seismic data.
The methodologies applied in the workflow, in particular theprobabilistic inversion of seismic data and the geostatisticalsimulations, are generally very efficient and can be applied tocomplex real field applications.
Our case history shows good results both for the inversion,classification and simulation tasks, in a complex geologicalscenario where the quality of the data, in terms of noise andvertical resolution, is not optimal.
ACKNOWLEDGEMENTS
We acknowledge Eni E&P, Eni Norge and Statoil for permis-sion to publish this paper. We would also like to thank ErnestoDella Rossa (Eni E&P) for helpful comments and suggestions.
REFERENCES
Aki K. and Richards P.G. 1980. Quantitative Seismology: Theory andMethods. Vol. 1. W.H. Freeman and Co.
Avseth P., Mukerji T. and Mavko G. 2005. Quantitative SeismicInterpretation. Cambridge University Press.
Bachrach R., Beller M., Ching Liu C., Perdomo J., Shelander D., DuttaN. and Benabentos M. 2004. Combining rock physics analysis, fullwaveform prestack inversion and high-resolution seismic interpre-tation to map lithology units in deep water: A Gulf of Mexico casestudy. The Leading Edge 23, 378–383.
Backus G.E. 1962. Long-wave elastic anisotropy produced by hor-izontal layering. Journal of Geophysical Research 67, 4427–4440.
Bosch M., Mukerji T. and Gonzalez E.F. 2010. Seismic inversionfor reservoir properties combining statistical rock physics and geo-statistics: A review. Geophysics 74(2), O1–O15.
C© 2012 European Association of Geoscientists & Engineers, Geophysical Prospecting, 61, 613–629

Seismic driven probabilistic classification of reservoir facies 629
Buia M., Cirone C., Leutscher J., Tarran S. and Webb B. 2010.Multi-azimuth 3D survey in the Barents Sea. First Break 28, 65–69.
Buland A., Kolbjørnsen O., Hauge R., Skjæveland O. and Duffaut K.2008. Bayesian lithology and fluid prediction from seismic prestackdata. Geophysics 73 (3), C13–C21.
Buland A. and Omre H. 2003. Bayesian linearized AVO inversion.Geophysics 68 (1), 185–198.
Connolly P. and Kemper M. 2007. Statistical uncertainty ofseismic net pay estimations. The Leading Edge 26, 1284–1289.
Contreras A., Torres-Verdin C., Kvien K., Fasnacht T. and ChestersW. 2005. AVA stochastic inversion of pre-stack seismic data andwell logs for 3D reservoir modeling. 67th EAGE Conference &Exhibition, Expanded Abstracts, F014.
Doyen P. 2007. Seismic Reservoir Characterization. EAGE Publica-tions.
Dubrule O. 2003. Geostatistics for Seismic Data Integration in EarthModels. EAGE Publications.
Eidsvik J., Avseth P., Omre H., Mukerji T. and Mavko G. 2004.Stochastic reservoir characterization using prestack seismic data.Geophysics 69, 978–993.
Gonzalez E.F., Mukerji T. and Mavko G. 2008. Seismic inver-sion combining rock physics and multiple-point geostatistics. Geo-physics 73 (1), R11–R21.
Grana D. and Della Rossa E. 2010. Probabilistic petrophysical prop-erties estimation integrating statistical rock physics with seismicinversion. Geophysics 75 (3), O21–O37.
Grana D. and Dvorkin J. 2011. The link between seismic inversion,rock physics, and geostatistical simulations in seismic reservoircharacterization studies. The Leading Edge 30, 54.
Gunning J. and Glinsky M. 2007. Detection of reservoir quality usingBayesian seismic inversion. Geophysics 72 (3), R37–R49.
Lake L.W. and Srinivasan S. 2004. Statistical scale-up of reservoirproperties: Concepts and applications. Journal of Petroleum Sci-ence & Engineering 44, 27–39.
Larsen A.L., Ulvmoen M., Omre H. and Buland A. 2006. Bayesianlithology/fluid prediction and simulation on the basis of a Markov-chain prior model. Geophysics 71 (5), R69–R78.
Maffioletti F., Bardini S., Grana D., Paparozzi E., Ruvo L., Sala C. andTarchiani C. 2010. Changing scale and domain of a petrophysical
and elastic properties based log-facies classification. SEG ExpandedAbstracts 29, 2406–2410.
Mavko G., Mukerji T. and Dvorkin, J. 2009. The Rock Physics Hand-book. Cambridge University Press.
Merletti G. and Torres-Verdın C. 2006. Accurate detection and spatialdelineation of thin-sand sedimentary sequences via joint stochasticinversion of well logs and 3D pre-stack seismic amplitude data.Society of Petroleum Engineers 102444-PA.
Mukerji T., Jørstad A., Avseth P., Mavko G. and Granli J.R. 2001.Mapping lithofacies and pore-fluid probabilities in a North Seareservoir: Seismic inversions and statistical rock physics. Geo-physics 66, 988–1001.
Pirrone M., Grana D., Maffioletti F. and D’Agosto C. 2011. MonteCarlo Simulation and Uncertainty Evaluation of Log-facies Classi-fication Based on Petroelastic Properties. 73rd EAGE Conference& Exhibition.
Sams M.S., Atkins D., Said N., Parwito E. and van Riel P. 1999.Stochastic inversion for high resolution reservoir characterisation inthe Central Sumatra Basin. Society of Petroleum Engineers 57260.
Sams M.S., Millar I., Satriawan W., Saussus D. and Bhattacharyya S.2011. Integration of geology and geophysics through geostatisticalinversion: A case study. First Break 29 (8), 47–56.
Sams M.S. and Saussus D. 2010a. Comparison of lithology and netpay uncertainty between deterministic and geostatistical inversionworkflows. First Break 28, 35–44.
Sams M.S. and Saussus D. 2010b. Uncertainties in the quantitativeinterpretation of lithology probability volumes. The Leading Edge29, 576–583.
Spikes K., Mukerji T., Dvorkin J. and Mavko G. 2008. Probabilisticseismic inversion based on rock-physics models. Geophysics 72 (5),R87–R97.
Stright L., Bernhardt A., Boucher A. and Mukerji T. 2009. Revisit-ing the use of seismic attributes as soft data for subseismic faciesprediction: Proportion versus probabilities. The Leading Edge 28,1460–1469.
Ulvmoen M., Omre H. and Buland A. 2010. Improved resolution inBayesian lithology/fluid inversion from prestack seismic data andwell observations: Part 2 – Real case study. Geophysics 75 (2),B73–B82.
Ward J.H. Jr. 1963. Hierarchical grouping to optimize an objectivefunction. Journal of American Statistical Association 58, 236–244.
C© 2012 European Association of Geoscientists & Engineers, Geophysical Prospecting, 61, 613–629