seismic design and analysis of multi story reinforced
TRANSCRIPT
ii
SEISMIC DESIGN AND ANALYSIS OF MULTI STORY REINFORCED
CONCRETE BUILDINGS IN MALAYSIA
By
Djibrillah Oumarou Djibrillah
(12269)
FINAL PROJECT REPORT
Submitted to the Department of Civil Engineering
in Partial Fulfilment of the Requirements
for the Degree
Bachelor of Engineering (Hons)
(Civil Engineering)
Universiti Teknologi PETRONAS
Bandar Seri Iskandar
31750 Tronoh
Perak Darul Ridzuan
Copyright 2013
By
Djibrillah Oumarou Djibrillah, 2013

iii
CERTIFICATION OF APPROVAL
SEISMIC DESIGN AND ANALYSIS OF MULTI STORY REINFORCED
CONCRETE BUILDINGS IN MALAYSIA
By
Djibrillah Oumarou Djibrillah
A project dissertation submitted to the
Department of Civil Engineering
Universiti Teknologi PETRONAS
in partial fulfilment of the requirement for the
Bachelor of Engineering (Hons)
(Civil Engineering)
Approved:
__________________________
Assoc. Prof. Dr Narayanan Sambupotty
Project Supervisor
UNIVERSITI TEKNOLOGI PETRONAS
TRONOH, PERAK
June 2013

iv
CERTIFICATION OF ORIGINALITY
This is to certify that I am responsible for the work submitted in this project, that the
original work is my own except as specified in the references and acknowledgements,
and that the original work contained herein have not been undertaken or done by
unspecified sources or persons.
__________________________
Djibrillah Oumarou Djibrillah

v
ABSTRACT
Buildings in Malaysia are usually designed and analysed without provisions and
considerations for earthquake loadings and seismic effects on the structures especially
for high rise structures. This disregard for seismic activities comes from the fact that
Malaysia is not located nearby the Pacific Ring of Fire which is known as a region
where a lot of volcanic eruptions and seismic activities are happening; it is then easily
derived and established in practice that severe earthquakes are unlikely to take place
and minor ones can be discarded or considered to have negligible effects on
compromising the integrity of the structures. Recently however, the occurrences of
several earthquakes in neighbouring countries like Indonesia, and the Philippines,
even though relatively situated far away, have triggered a series of vibrations which
were felt on some of the structures of the high rise buildings. As a measure to prevent
or ensure those buildings from being structurally compromised or from failure by
collapsing, seismic analyses will have to be considered by being incorporated in the
structural design process philosophy of these structures. This paper will involve a
dynamic analysis of existing structures of different heights subjected to the nominal
or Design Basis Earthquake using provisions of the Eurocode 8 or the Indian
Standard IS 1893-1: 2002 Criteria for Earthquake Resistant Design of Structures.
The buildings will also be tested to ground motion records scaled up appropriately.
Suitable recommendations will be made based on the studies.

vi
ACKNOWLEDGEMENTS
First of all, I would like to thank Allah s.w.t for his blessings in making all this
possible and allow me to finish this report in order to complete my undergraduate
studies. I would also like to extend my gratitude to my supervisor, Assoc. Prof. Dr
Narayanan Sambupotty, for all his patience, generous help, encouragement and
guidance throughout this project when encountering difficulties and successfully
completing it.
My parents, family and friends are not to be forgotten as they have continuously
never failed to show their support and encouragement.
Last but not least, I would also like to thank everyone who might have directly or
indirectly helped or supported me in any way throughout my studies.
vii
TABLE OF CONTENTS
LIST OF TABLES ................................................................................................... ix
LIST OF FIGURES .................................................................................................. x
LIST OF ABBREVIATIONS .................................................................................. xi
CHAPTER 1 INTRODUCTION ............................................................................... 1
1.1 BACKGROUND .......................................................................... 1
1.2 PROBLEM STATEMENT............................................................ 1
1.3 OBJECTIVES ............................................................................... 2
1.4 SCOPE OF STUDY ...................................................................... 2
1.5 RELEVANCY & FEASIBILITY OF PROJECT ........................... 2
CHAPTER 2 LITERATURE REVIEW .................................................................... 4
2.1 INTRODUCTION ........................................................................ 4
2.2 EARTHQUAKES EXPERIENCED IN MALAYSIA .................... 4
2.3 TYPES OF EARTHQUAKES ANALYSIS................................... 5
2.3.1 STATIC ANALYSIS ............................................................ 6
2.3.2 TIME HISTORY ANALYSIS .............................................. 6
2.3.3 RESPONSE SPECTRUM ANALYSIS ................................. 7
2.4 DESIGN PHILOSOPHY OF EARTHQUAKES ........................... 8
2.5 STUDIES IN MALAYSIA ........................................................... 9
2.6 SUMMARY .................................................................................10
CHAPTER 3 METHODOLOGY ............................................................................ 12
3.1 INTRODUCTION .......................................................................12
3.2 BUILDING CHARACTERISTICS ..............................................12
3.3 LOADINGS .................................................................................13
3.3.1 DEAD LOAD ......................................................................13
3.3.2 LIVE LOAD ........................................................................14
3.3.3 WIND LOAD ......................................................................14
3.3.4 SEISMIC LOAD..................................................................14
3.4 ETABS SOFTWARE ...................................................................14
3.5 FLOWCHART .............................................................................15
3.6 PROJECTS ACTIVITIES ............................................................16
3.7 MAPPING OUT RESEARCH TIMELINE ..................................18

viii
3.8 TOOLS ........................................................................................20
3.9 SUMMARY .................................................................................20
CHAPTER 4 RESULTS & DISCUSSION .............................................................. 21
4.1 INTRODUCTION .......................................................................21
4.2 RESULTS ....................................................................................21
4.3 INTERPRETATION & DISCUSSIONS ......................................32
CHAPTER 5 CONCLUSION & RECOMMENDATIONS ..................................... 34
REFERENCES ........................................................................................................35

ix
LIST OF TABLES
Table 1 Tabulated Response Spectrum Accelerations ................................................ 8
Table 2 Member Dimension for Modeling ...............................................................13
Table 3 Key Milestones for FYP 1 ...........................................................................18
Table 4 Key Milestones for FYP 2 ...........................................................................19
Table 5 Gantt Chart for FYP 1 .................................................................................19
Table 6 Gantt Chart for FYP 2 .................................................................................20
Table 7 3-Story Building Inter-Story Drift ..............................................................21
Table 8 3-Story Building Periods and Modes ..........................................................22
Table 9 5-Story Building Inter-Story Drift ...............................................................23
Table 10 5-Story Building Periods and Modes .........................................................23
Table 11 10-Story Building Inter-Story Drift............................................................24
Table 12 10-Story Periods and Modes ......................................................................25
Table 13 20-Story Building Inter-Story Drift............................................................27
Table 14 20-Story Building Periods and Modes .......................................................28
Table 15 30-Story Building Inter-Story Drift............................................................29
Table 16 30-Story Building Periods and Modes .......................................................31

x
LIST OF FIGURES
Figure 1 Response Spectrum Accelerations ............................................................... 7
Figure 2 Research Methodology Flow Chart ............................................................15
Figure 3 Project Activities........................................................................................17
Figure 4 Column P-M-M Interaction Ratio of 3-Story Building ...............................22
Figure 5 Column P-M-M Interaction Ratio of 5-Story Building ...............................24
Figure 6 Column P-M-M Interaction Ratio of 10-Story Building..............................26
Figure 7 Column P-M-M Interaction Ration of 20-Story Building ............................29
Figure 8 Column P-M-M Interaction Ratio of 30-Story Building..............................32
Figure 9 Drifts Comparisons ....................................................................................33

xi
LIST OF ABBREVIATIONS
BS: British Standard
IS: Indian Standard
ETABS: Extended Three-Dimensional Analysis of Building System
FYP: Final Year Project
SRSS: Square Roots of the Sum of Squares
CQC: Complete quadratic combination
DL: Dead Load
LL: Live Load
WL: Wind Load
EN: European Norm
RC: Reinforced Concrete

1
CHAPTER 1
INTRODUCTION
1.1 BACKGROUND
Malaysia is considered as a non-seismic zone because of the fact that its location is
relatively far away from the Pacific Ring of Fire which is an active seismic zone.
However, Malaysia has recently begun to experience truly significant tremors
generated by earthquakes from neighbouring countries even though geographically
theses earthquake epicentres are relatively situated far away. In urban area, the effects
were quite felt strongly towards high rise buildings which have caused fear and
panicking to some of the occupants living in them. For instance, on 11th April 2012
in Shah Alam, the earthquake of magnitude 8.9 on the Richter scale that occurred in
Indonesia was strong enough to make the Persanda apartment shake vigorously. Due
to these situations, occupants and designers might begin to question themselves about
the safety of these structures and whether they are deemed fit to resist these
unforeseen and unpredictable events of occurrence since it is beyond human control.
Malaysia which has always been considered immune to earthquakes is now no longer
invulnerable to them. Therefore, there is an urgent and important need to ensure that
the structures provided or yet to be designed to be safe and reliable in order to fulfil
their functions in case of occurrence of a worst case earthquakes scenario.
1.2 PROBLEM STATEMENT
In Malaysia usually, in their design philosophy, consideration are not given to
earthquakes loadings. However recently, frequent tremors of earthquakes from
neighboring countries have been felt on buildings especially high rise in Malaysia.
This situation has increased concerns among people and also designers as most of
2
these existing buildings have been designed with no provision to withstand
earthquake loadings. Consequently, to ensure safety and structural integrity of these
structures, earthquakes need to be taken into account in the design process and their
behavior needs to be investigated as well to determine its effects. To conduct seismic
analysis on structures, various methods are available but not all of them might be
suitable for analysis. Choosing the appropriate method is crucial for a better
estimation and significant evaluation of the effects.
1.3 OBJECTIVES
The objectives of this study are:
- To determine the behaviour of reinforced concrete buildings in Malaysia
under earthquake loadings (to obtain natural frequencies, mode shapes),
- To analyse the structural integrity of these buildings in withstanding nominal
earthquake loadings.
- To determine the inter-story drift of these reinforced concrete buildings and
evaluate these inter-story drifts.
1.4 SCOPE OF STUDY
This study is limited only to the incorporation of seismic analysis into the design
focus of existing buildings reinforced concrete type of structures in Malaysia using
provisions of IS 1893-1: 2002 or the EN 1998-1: 2004. The static analysis, response
spectrum analysis or linear time history analysis will be utilized alongside ETABS to
conduct and facilitate the study.
1.5 RELEVANCY & FEASIBILITY OF PROJECT
Occurrences of earthquakes are quite unknown and unpredictable. As a structural
engineer or an occupant, we need to realize its possibility of occurrences at any time
by taking into consideration earthquake loadings in the design philosophy for new
structures. However, existing structures also need to be taken into consideration as

3
they have a higher unknown level of structural integrity to withstand earthquakes.
Therefore, they must be analysed to estimate their level of integrity and safety.
This project is feasible as it mainly involves the use of software to perform the
structural analysis. The study is divided in two parts (FYP 1 and FYP 2) and 28
weeks period is allocated to conduct the whole study. It might be considered enough
time to complete this project.

4
CHAPTER 2
LITERATURE REVIEW
2.1 INTRODUCTION
Literature review is an important part of the study as it helps into the understanding of
the processes and analysis of the research. The basic intention of our literature review
is to give a comprehensive review of previous works on the area of seismic design
and analysis of reinforced concrete. In this review, we will focus on the experience
from different places around the world but Special consideration will be given to the
Malaysian experience. The literature review will try to establish the link between past
research, work done on this topic and this study to determine its relevancy and
thorough understanding. There are four sections in this review that will help the
readers in giving him an overview of the study. The first section is about earthquakes
that have been experienced in Malaysia along with their magnitude, location and
effects. Then the next section elaborates about types of earthquakes analysis which
can be used to carry out the study. Next, the section discusses the Indian seismic code
and the Eurocode for seismic design. Finally, the section involves past research
conducted in Malaysia on earthquake design.
2.2 EARTHQUAKES EXPERIENCED IN MALAYSIA
Even though in the 1980s, the dam-induced Kenyir earthquake occurred, the first
earthquake with epicentres in Peninsular in Malaysia took place in Bukit Tinggi in
November 2007 and in May 2008. From 1973 to present days, more than forty four
earthquakes have been reported in East Malaysia with Ranau, Kudat and Lahad Datu
being the most active seismic zone with the strongest earthquake ever registered in
Lahad Datu in 1976 with a magnitude of 6.2 (Lat, Che Noorliza, Ibrahim, 2009).

5
Earthquakes that occur in the Sumatran Region often have affected Peninsular
Malaysia in the past by means of vibrations that have been felt on some of the
buildings. In fact, between the year 2002 and year 2003, two earthquakes,
respectively, of intensity Mw = 7.4 and Mw = 5.8 took place near the Sumatran Field
have caused intense vibrations on some of the buildings that has resulted in public
concerns in many cities. In Penang, the first earthquake caused even cracks on some
buildings (Adnan, Hendriyawan, Marto, 2004)
Malaysians were significantly surprised by the Sumatra (Andaman) earthquake in
November 26, 2004. The earthquake generated the most critical and direct impact
with an intensity of 9.15 on the Richter scale. Consequently, a tsunami occurred and
made more damages. Tremors were highly experienced especially by people in high-
rise building in western states of Peninsular Malaysia (Koong, Won, 2005).
2.3 TYPES OF EARTHQUAKES ANALYSIS
There are many types of analysis techniques to take seismic effects into consideration
when analysing and designing structures. And depending on certain parameters such
as number of stories, ground conditions, importance factor and risk and consequences
associated with its construction and failure, many of the codes of practices
incorporate dynamic analyses on top of static analyses for more accurate simulation
and results. Static analysis or equivalent static procedure to compute equivalent
lateral force of the earthquake is easier and require less computation as compared to
the dynamic analyses. Because of this it carries a great amount of uncertainties during
analyses because of so many oversimplifications. However dynamic analyses in
earthquake analyses are divided in parts: time history analysis and response spectrum
analysis. Time history dynamic analysis consist of recording a range of earthquake
accelerations with respect to time in the form of a plot called response history and
evaluate the response of the structure over time. It has the advantage of being utilized
for nonlinear and linear analysis. Additionally for dynamic analyses, there is another
method called response spectrum method which is a plot of peak periods of an
earthquake to accelerations which are used to obtain the acceleration to be applied on
the structure.

6
2.3.1 STATIC ANALYSIS
In this method of seismic analysis, the total base shear is distributed alongside the
height of the building to describe the effects of seismic ground motion on the
structure. The base shear is first computed based on simple formulas which depend on
the codes used alongside some empirical multiplier. It takes into consideration the
seismic weight of the building and the design horizontal seismic coefficient of the
structure which depends on the seismic hazard exposure of that particular zone.
Albeit, it is a static method, somehow it includes some dynamic factors of the
building such as the fundamental period T and the response reduction factor R.
According to the Clause 7.5 of IS 1893 (Part 1): 2002, the design base shear along
any principal direction can be determined by the following formula:
VB = AhW
Where,
Ah = Design horizontal seismic coefficient of the structure
W = Seismic weight of the building
2.3.2 TIME HISTORY ANALYSIS
The Time history analysis involves a time-step by step integration of dynamic
equilibrium equation. The general Equation for a dynamic response of a multi-degree
of-freedom system subjected to ground motion is given by the D’Alembert principle
by the following equation as:
M Ẍ + C Ẋ + KX = F
Where,
C = Damping Matrix
M = Mass matrices
K = Stiffness matrices
Ẍ = Acceleration
Ẋ = Velocity
X = Displacement
F = Inertial force of the earthquake
F = Force vectors
The same equation can be used for response spectrum analyses with the only

7
differences in input as for time history will make use of response history and for
response spectrum analyses will be using response spectra graphs.
2.3.3 RESPONSE SPECTRUM ANALYSIS
This is a very useful method for analysing the performance of structures during
earthquakes. It makes use of the peak period obtained from a dynamic analysis of a
single degree-of-freedom-system. Peak ground accelerations are recorded for
different periods of the structure and then these accelerations are plotted against their
equivalent periods to come up with a graph called dynamic response spectrum. It is
strongly recommended in practices that the curves obtained be smoothened out as
they might be very rough. As per Clause 7.8.4.5 of the IS 1893 (Part 1): 2002, to
obtain the peak story shear force, use of statistical method called modal combination
techniques such as ABS (Sum of the Absolute values) or Maximum Absolute
Response, SRSS (square roots of the sum of squares) and CQC (Complete quadratic
combination).
Here below is a representation of a response spectrum graph:
Figure 1 Response Spectrum Accelerations

8
In order to make this graph above useful and use it for our analysis, values will have
to be extracted and put in a tabulated form as in the table below:
Table 1 Tabulated Response Spectrum Accelerations
Period (s) RSA (g) 0.01 0.2331
0.1271 0.5828 0.6356 0.5828
0.70 0.4500 0.80 0.3938 0.90 0.3500 1.00 0.3150 1.50 0.2100 2.00 0.1575 2.50 0.1260 3.00 0.1050 3.50 0.0900 4.00 0.0788 4.50 0.0700 5.00 0.0630 5.50 0.0573 6.00 0.0525 6.50 0.0485 7.00 0.0450 7.50 0.0420 8.00 0.0394 8.50 0.0371 9.00 0.0350 9.50 0.0332 10.00 0.0315
2.4 DESIGN PHILOSOPHY OF EARTHQUAKES
According to Pankaj A. & Manish S. (2006) the philosophy of seismic design is to
guarantee that the structures possess at least a minimum capacity to withstand without
any damage minor earthquake, Design Basis Earthquake DBE without significant
structural damage and Maximum Considered Earthquake MCE without complete
failure. the IS 1893 (Part 1): 2002 defines the Design Basis Earthquake (DBE) as the
maximum earthquake that is more likely to happen during the design life of the
structure and the Maximum Considered Earthquake (MCE) as the most critical
earthquake effects considered. The MCE is usually the double of the DBE. Since

9
complete protection against earthquakes of all sizes is impossible and uneconomical,
the basic criteria of seismic design should be established on lateral strength,
deformability, ductility and stiffness of the structure.
2.5 STUDIES IN MALAYSIA
Malaysia has always been classified among regions with low or inexistent seismic
activity. As a result, earthquake resisting design philosophy was never taken into
account. Malaysia recognize the possibility and threat of seismic hazard to perpetrate
human casualties and properties damages only after being touched by a series of
earthquake waves which have been materialized by buildings swaying and cracks.
Since less than one per cent of structures in Malaysia are not designed with provisions
to resist earthquakes, a great deal of attention to that matter has begun to rise (Madjid,
2009). But in 2002, when the Gujarat earthquake occurred in India, its waves
travelled more than 600 km from the epicentre and caused damages to several cities;
the MMD (Malaysian Meteorological Department) took that matter to the government
to take measures in adopting Seismic Design philosophy into buildings design as no
law before was adopted to deal with this issue ( Bendick et al., 2001).
Repeated near field earthquakes are generally discarded even though their effects on
reinforced concrete buildings are recognized. An investigation was conducted to
obtain the response of high rise buildings under single near field earthquake and
repeated near field earthquake and derive a comparison between the responses. It was
found out that a repeated near field earthquake has more impacts than a single near
field earthquake (Zulham, Madjid. and Faisal, 2012).
To analyze the performances of a structural and the soil response in the presence of
an earthquake loading, by time history methods, ground motion acceleration of the
earthquake will have to be identified. However, in Malaysia, to produce acceleration
ground motion, Uniform Hazard Spectra (UHS) was carried out in two ways since
there is a lack of data registered. Even though, the ground acceleration for Kuala
Lumpur can be determined through this method, a variation of up to 35% can be
expected from the origin to the surface (Adnan, Hendriyawan, Marto, Irshyam, 2006).
In recent years, Malaysia is more aware of the seismic effect on their structures
10
because of the tremors were repeatedly felt over the centuries from the earthquake
events around Malaysia. Most bridges in Malaysia do not take earthquake loadings
into structural design consideration. A case study conducted by Tan (2002) on the
behaviour of high-rise building under seismic effect for PETRONAS Twin Tower
(KLCC) used Finite Element Analysis. The studies on performance of high rise
buildings in Malaysia with various intensity of earthquake using Finite Element
Modelling have been conducted by Noor Aishah (2002) and Yew (2000). Therefore
the assessment due to seismic is very important in order to recognize the performance
of the buildings. A seismic risk analysis addressed to earthquake emergency
management and protection strategies planning, requires vulnerability and damage
evaluation performed at territorial scale (Giovinazzi, 2005). IDARC-2D dynamic
non-linear analysis software is used to analyse the structures with different intensities
load to know the maximum allowable earthquake load intensity for the buildings.
Suradi (2007) also adopted the performance base seismic engineering in her study.
The intent of earthquake resistance design therefore has become one of attempting to
limit the damage experience by a building to levels, which are considered acceptable
by structural engineers. Historically, damage that would not result in loss of life was
deemed acceptable for most structures (Hamburger, 1996). Performance-based
seismic engineering (PBSE) is defined as the procedure of design and construction of
structures that will resist earthquakes in a predictable manner (Hamburger, 1996). It is
to make owners and designers capable of selecting alternative performance goals or
objective for the design of different structures. Severe earthquakes are relatively
frequent events, which may or may not ever occur within the life of a building.
2.6 SUMMARY
Review of various journals, technical papers and other materials show how important
study of earthquakes and structural integrity to earthquakes loadings are since these
loadings are quite unforeseen and unpredictable. This is to ensure that buildings to
fulfil their primary purpose which is to provide safe and reliable shelter for people.
The literature discussed about codes and method of analysis. This is to ensure that we
understand the basics concepts of design and analysis so that the study can be carried
out effectively. However the model should be simple enough to avoid complex

11
situations but representative enough to include major and important details. To
conclude, all these literature reviews are precious to conduct the study of our project
to its terms.

12
CHAPTER 3
METHODOLOGY
3.1 INTRODUCTION
The methodology that is going to be used to evaluate and complete this study will be
based on the following subsections. First, the design will be conducted as per current
design of code practice (DL + LL + WL) then checked against earthquake loadings.
There are three ways to do that:
- Static Analysis,
- Response Spectrum Analysis and,
- Time Series.
However, only Response Spectrum Analysis will be used for our dynamic analysis to
check against earthquake loading and to find out the dominant frequencies of the
structure and mode shapes.
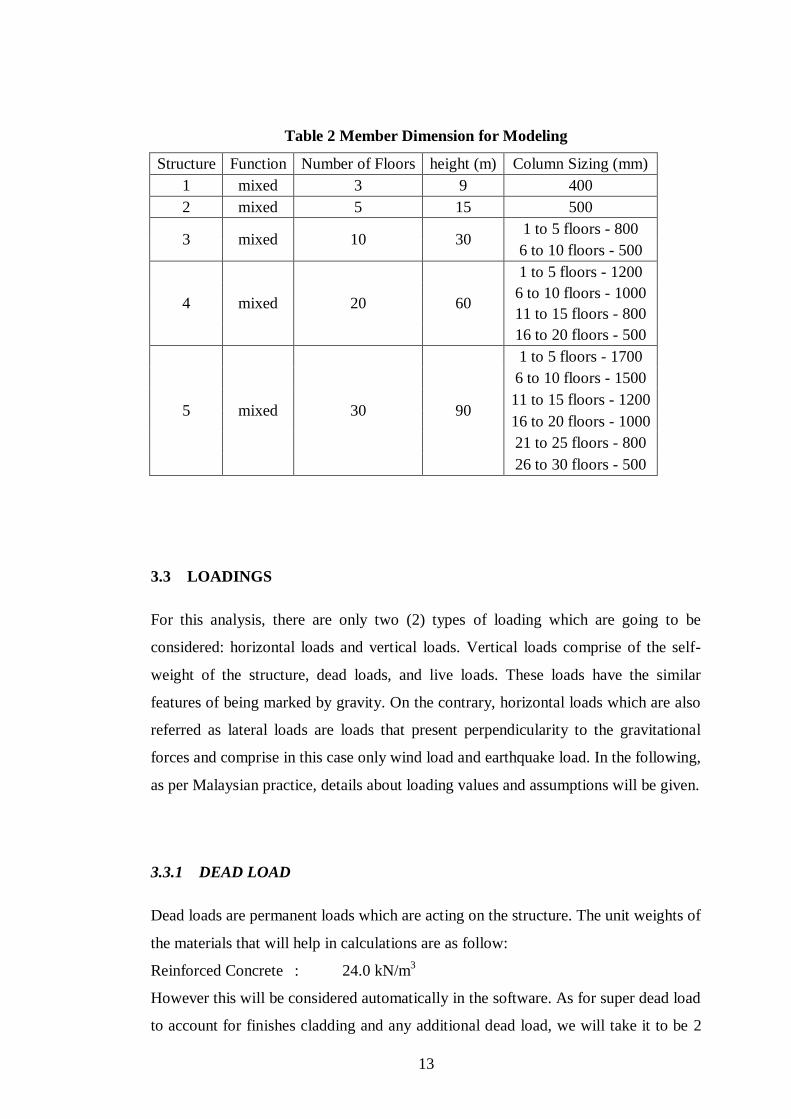
3.2 BUILDING CHARACTERISTICS
For our study purpose structures of 3, 5, 10, 20 and 30 stories level high will be
analyzed. To simplify our study, the parameters and variables such as the base area
of the structures is assumed to be a square and only one different base area is chosen
(24m x 24m). Column to column distance or span is taken 6m and for the beam sizing
it is assumed to be respectively 0.2m and 0.45m for thickness and depth. Slabs are
assumed to have a thickness of 0.15m. However, column sizes will vary due to
height and are summarized in the table below. All columns are assumed to be square
and their sizing is given in the table below. The building is considered as residential
type and story height will be considered as 3m as per Malaysian practice.
13
Table 2 Member Dimension for Modeling
Structure Function Number of Floors height (m) Column Sizing (mm)
1 mixed 3 9 400
2 mixed 5 15 500
3 mixed 10 30 1 to 5 floors - 800
6 to 10 floors - 500
4 mixed 20 60
1 to 5 floors - 1200
6 to 10 floors - 1000
11 to 15 floors - 800
16 to 20 floors - 500
5 mixed 30 90
1 to 5 floors - 1700
6 to 10 floors - 1500
11 to 15 floors - 1200
16 to 20 floors - 1000
21 to 25 floors - 800
26 to 30 floors - 500
3.3 LOADINGS
For this analysis, there are only two (2) types of loading which are going to be
considered: horizontal loads and vertical loads. Vertical loads comprise of the self-
weight of the structure, dead loads, and live loads. These loads have the similar
features of being marked by gravity. On the contrary, horizontal loads which are also
referred as lateral loads are loads that present perpendicularity to the gravitational
forces and comprise in this case only wind load and earthquake load. In the following,
as per Malaysian practice, details about loading values and assumptions will be given.
3.3.1 DEAD LOAD
Dead loads are permanent loads which are acting on the structure. The unit weights of
the materials that will help in calculations are as follow:
Reinforced Concrete : 24.0 kN/m3
However this will be considered automatically in the software. As for super dead load
to account for finishes cladding and any additional dead load, we will take it to be 2

14
kN/m2
and will be the same for all floors throughout.
3.3.2 LIVE LOAD
Live load is the load that accounts for the intended use or occupancy. As per BS6399
and current Malaysian practice, the value of live load shall be taken as 1.5 kN/m2 and
will be the same for all floors from top to bottom.
3.3.3 WIND LOAD
Wind load is part of horizontal loadings acting on the building structure. We suppose
it acts on the wall areas along the side of the building with higher effect as we go up.
The basic wind speed is taken to be 35 m/s.
3.3.4 SEISMIC LOAD
Seismic loads are loads generated and induced by an earthquake in form of
acceleration of the ground motion. From the studies of response spectrum conducted
by Taksiah A. M. (2007) in one of the paragraphs above, the acceleration for the
range of higher peaks is within 0.04g which will be considered for the analyses with
soil class taken as D.
3.4 ETABS SOFTWARE
ETABS software is an integrated building design software developed and released by
Computers and Structures, Inc. to analyze and design building systems. Even though,
it might seem sophisticated, it is very user-friendly. With the capacity of taking care
of the most complex and largest model, it has become software of choice of structural
engineer in the construction industry. However, the advantages of using ETABS are
(Computers & Structures, 2005):
- With ETABS, any building configuration is possible even though most
buildings are straightforward in geometry with horizontal beams and vertical

15
columns. Then, a grid system can be established defined by horizontal floors and
vertical column geometry with almost no effort.
- The similarity of the floor levels in a building can be used to significantly
reduce the time for modelling and designing.
- The structural definition is simple, to the point and representative. The input
and output conventions used correspond to common building terminology. In
ETABS, the definition of the models is done logically floor-by-floor, column-by-
column, bay-by-bay and wall-by-wall.
- ETABS corrects effects on the stiffness of the frame because of large member
dimensions in relation to story heights and bay widths in the formulation of the
member stiffness.
- The results produced by the program does not need additional processing
before being used in structural design it is already in a form that is directly usable as
compared to some general-purpose computer program results which may need
additional processing.
3.5 FLOWCHART
The figure below shows the course of the project, in order words it means the steps
that will be used to evaluate and complete this study.
Figure 2 Research Methodology Flow Chart
Define Parameters
Modeling building
Results
Seismic Static Analysis
Response Spectrum
Analysis
Fail
Fail
Pass
Pass

16
For the First part of the seismic static analysis in ETABS, these steps shall be
followed:
- First establish the structure size and dimensions (such as height of the stories,
distances between columns and overall dimensions)
- Define code(s) to be used alongside material properties (in our case concrete)
- Then we need to define and assign section properties (beams and columns)
and also draw the others elements if applicable (floor, walls, piers and spandrels)
- define and assign all the loads that are applicable (dead, live, and wind) and
set up the load combination of static load cases.
- The last step is to run the analysis and the design to view the outputs
For the second part including response spectrum analysis in ETABS, follow the steps
below:
- First open any of the models which has been previously analysed statistically
in the first part of the analysis
- Next define and assign any response spectrum input
- Finally run the analysis and the design to get the outputs
The above are just outlines which try to give an insight and clarification on how the
study was carried out using ETABS. To be actually done an implemented one needs
to be very familiar with the software through learning by reading and exercising.
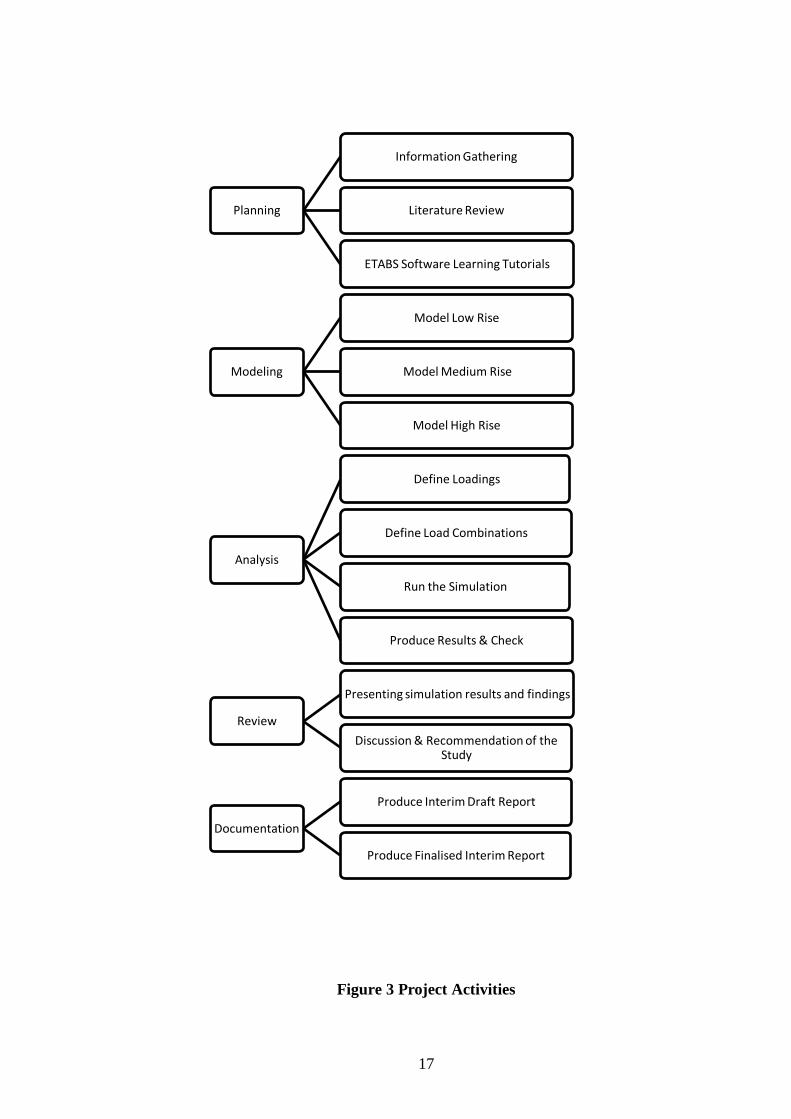
3.6 PROJECTS ACTIVITIES
17
Planning
Information Gathering
Literature Review
ETABS Software Learning Tutorials
Modeling
Model Low Rise
Model Medium Rise
Model High Rise
Analysis
Define Loadings
Define Load Combinations
Run the Simulation
Produce Results & Check
Review
Presenting simulation results and findings
Discussion & Recommendation of the Study
Documentation
Produce Interim Draft Report
Produce Finalised Interim Report
Figure 3 Project Activities

18
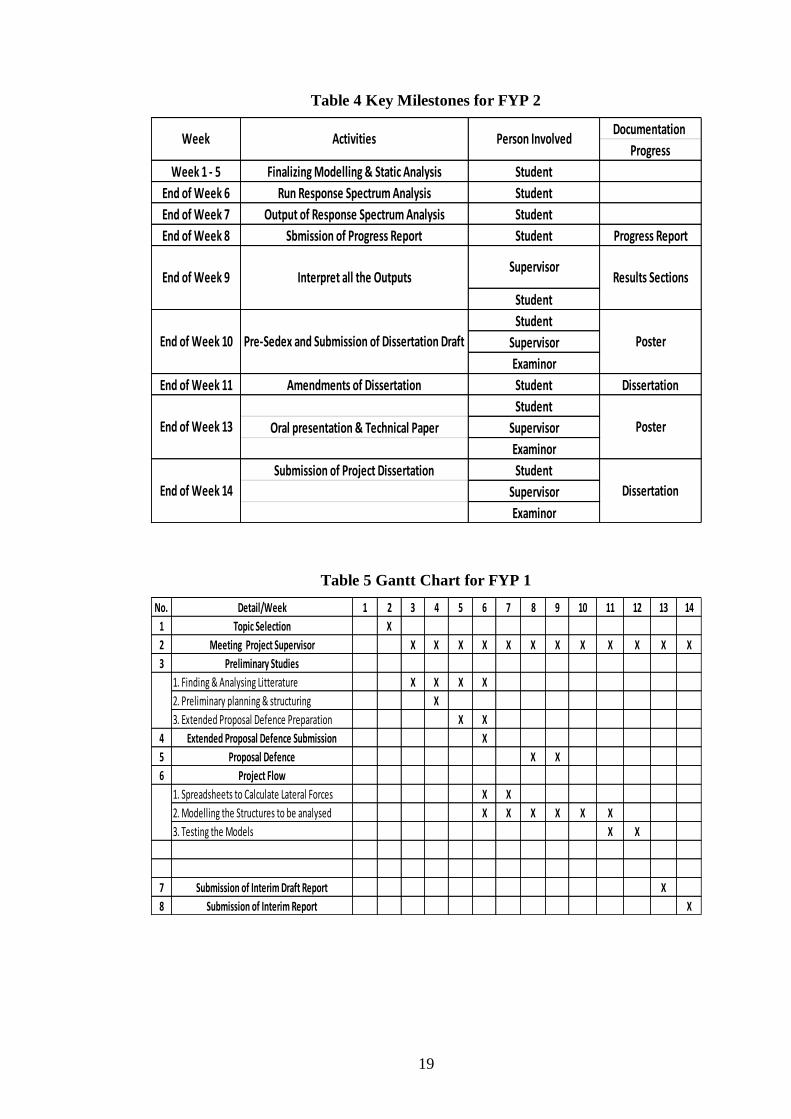
3.7 MAPPING OUT RESEARCH TIMELINE
The following key milestones and Gantt chart present all the activities that are
involved in our project with their framework and timeline as in table 3.1 and table 3.2
respectively.
Table 3 Key Milestones for FYP 1
Documentation
Progress
End of Week 2 Topics To be Selected Student
Supervisor Assignment Coordinator
Topic Confirmation Student
Finding & Analysing Litterature Student Litterature Review
End of Week 4 Planning & Structuring Student Methodology
End of Week 5 Extended Proposal Defence Draft Preparation Student Extended Proposal
To be Checked Supervisor Draft
Student
Supervisor
Coordinator
Student
Supervisor
Examinor
End of Week 11 Spreadsheets & Models Student
End of Week 12 Testing Models Student
Submission of Interim Draft Report Student
Supervisor
Submission of Interim report Student
Supervisor
Examinor
Interim draft Report
Interim Report
Submission of Extended Proposal Defence
Project DefenceEnd of Week 9 Slides
Week Activities Person Involved
Extended Proposal
End of Week 14
End of Week 13
End of Week 6
End of Week 3
19
Table 4 Key Milestones for FYP 2
Table 5 Gantt Chart for FYP 1
Documentation
Progress
Week 1 - 5 Finalizing Modelling & Static Analysis Student
End of Week 6 Run Response Spectrum Analysis Student
End of Week 7 Output of Response Spectrum Analysis Student
End of Week 8 Sbmission of Progress Report Student Progress Report
Student
Student
Supervisor
Examinor
End of Week 11 Amendments of Dissertation Student Dissertation
Student
Oral presentation & Technical Paper Supervisor
Examinor
Submission of Project Dissertation Student
Supervisor
Examinor
End of Week 14 Dissertation
End of Week 13 Poster
End of Week 10 Pre-Sedex and Submission of Dissertation Draft Poster
End of Week 9 Interpret all the OutputsSupervisor
Results Sections
Week Activities Person Involved
No. Detail/Week 1 2 3 4 5 6 7 8 9 10 11 12 13 14
1 Topic Selection X
2 Meeting Project Supervisor X X X X X X X X X X X X
3 Preliminary Studies
1. Finding & Analysing Litterature X X X X
2. Preliminary planning & structuring X
3. Extended Proposal Defence Preparation X X
4 Extended Proposal Defence Submission X
5 Proposal Defence X X
6 Project Flow
1. Spreadsheets to Calculate Lateral Forces X X
2. Modelling the Structures to be analysed X X X X X X
3. Testing the Models X X
7 Submission of Interim Draft Report X
8 Submission of Interim Report X

20
Table 6 Gantt Chart for FYP 2
3.8 TOOLS
• ETABS software
• Excel Spreadsheets
3.9 SUMMARY
There are several steps to follow in order to complete this project within the allocated
timeframe but the very first step to follow will be to acquire an understanding in
depth of the subject matter through literature review and analysis and also by
regularly meeting one’s supervisor. This can be accomplished through extensive
reading of articles, journals, technical papers, web pages from the internet and related
books. It helps in getting background information on the subject as well as in building
technical knowledge which will allow in making the right assumptions and concepts
to be applied to complete the project.
No. Detail/Week 1 2 3 4 5 6 7 8 9 10 11 12 13 14
1 Model Simulations X X X X X
2 Meeting Project Supervisor X X X X X X X X X X
3 Project Continuation
Interpretation X X X
Amendments X X X X X X
Submission of Progress Report X
Pre-Sedex X
Submission of Dissertation Draft X
Submission of Technical Paper X
5 Oral Presentation X
6 Submission of Dissertation X
4

21
CHAPTER 4
RESULTS & DISCUSSION
4.1 INTRODUCTION
This section mostly presents and interprets the results obtained from the software
ETABS after running the analysis and the design check for all the reinforced concrete
building frames subjected to dead, live, wind, earthquake loads and response
spectrum analyses . We will then divide the results into two parts; first all the results
will be tabulated and displayed in a way for simplification and clarification of
presentation purpose. Last the results presented will be discussed in accordance to the
objectives of the study and subjected to various interpretations in accordance with
theories and code of practices.
4.2 RESULTS
All the tables below will summarise the inter-story drifts, periods and modes of each
building which has been analysed and all the figures below show their column P-M-
M interaction ration.
- 3-Story building of height 9m
Table 7 3-Story Building Inter-Story Drift
Story Drift X Drift Y
STORY3 0.00092
STORY3 0.00092
STORY2 0.0018
STORY2 0.0018
22
STORY1 0.00368
STORY1 0.00368
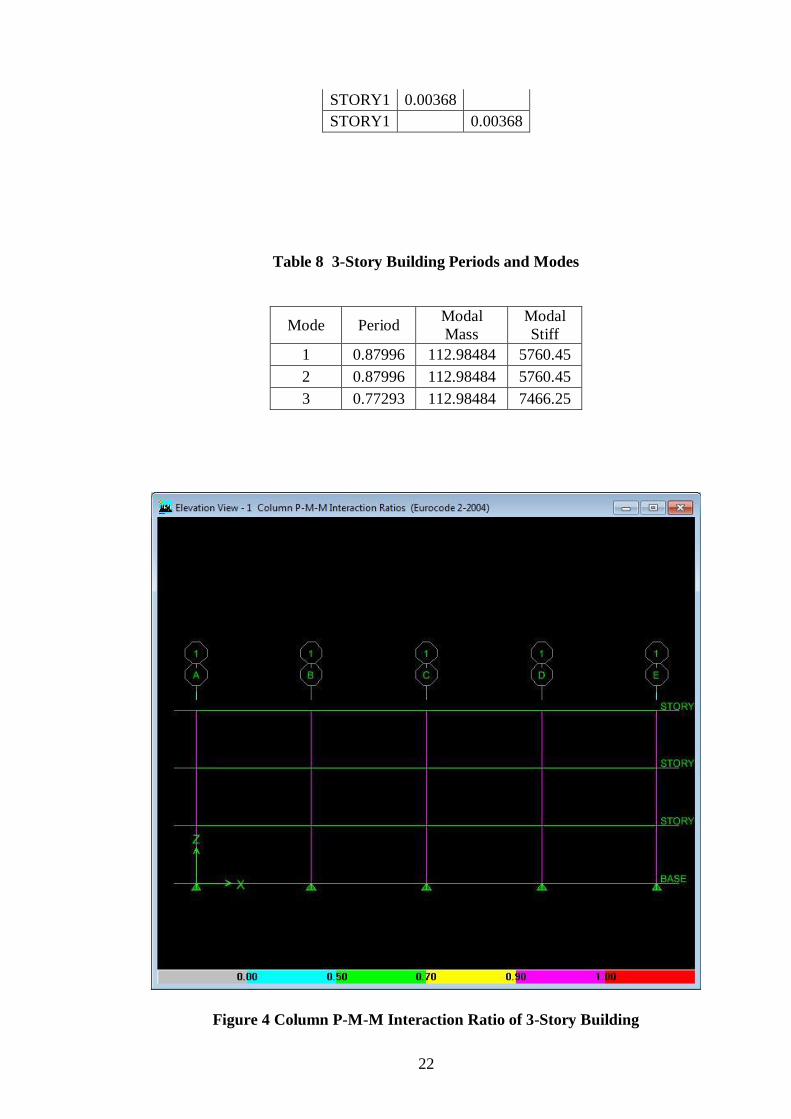
Table 8 3-Story Building Periods and Modes
Mode Period Modal
Mass
Modal
Stiff
1 0.87996 112.98484 5760.45
2 0.87996 112.98484 5760.45
3 0.77293 112.98484 7466.25
Figure 4 Column P-M-M Interaction Ratio of 3-Story Building
23
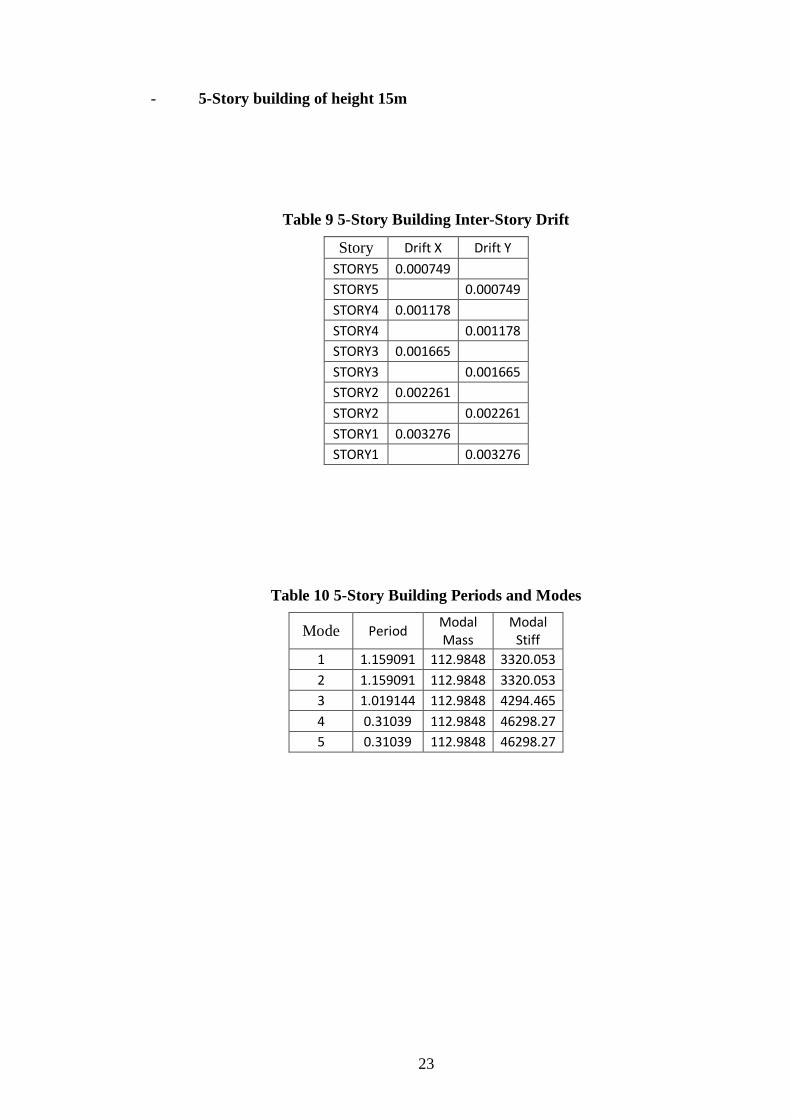
- 5-Story building of height 15m
Table 9 5-Story Building Inter-Story Drift
Story Drift X Drift Y
STORY5 0.000749
STORY5 0.000749
STORY4 0.001178
STORY4 0.001178
STORY3 0.001665
STORY3 0.001665
STORY2 0.002261
STORY2 0.002261
STORY1 0.003276
STORY1 0.003276
Table 10 5-Story Building Periods and Modes
Mode Period Modal Mass
Modal Stiff
1 1.159091 112.9848 3320.053
2 1.159091 112.9848 3320.053
3 1.019144 112.9848 4294.465
4 0.31039 112.9848 46298.27
5 0.31039 112.9848 46298.27
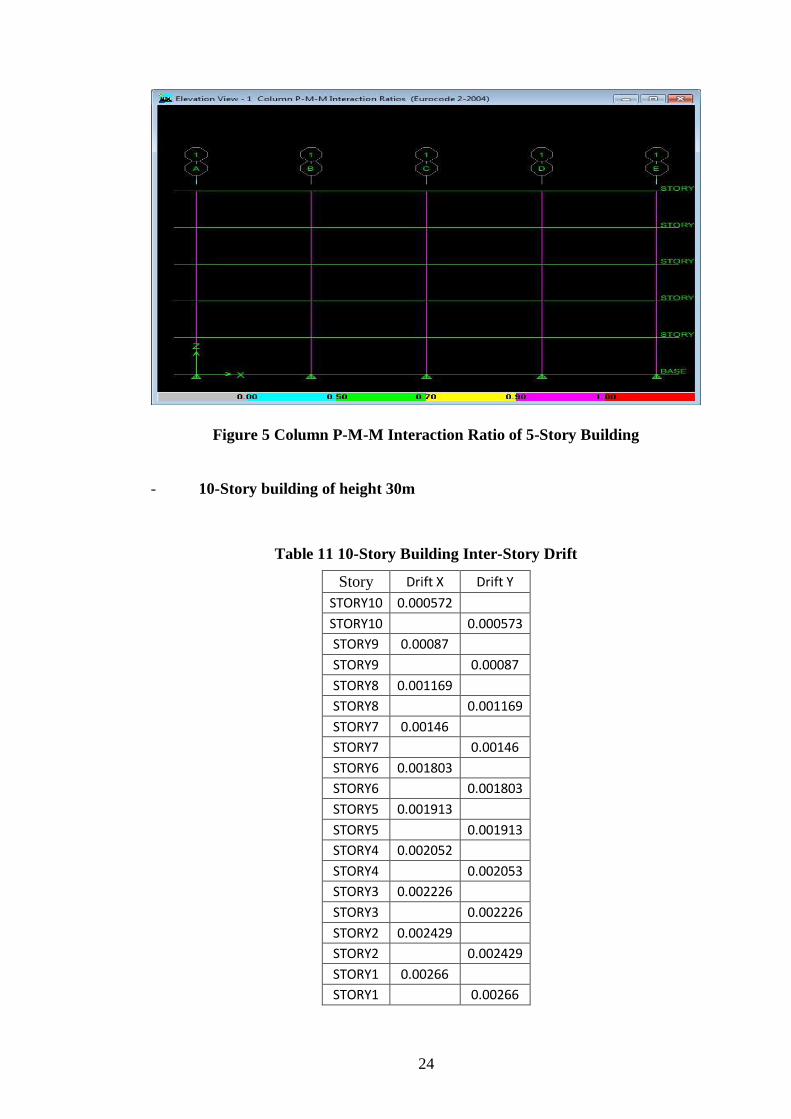
24
Figure 5 Column P-M-M Interaction Ratio of 5-Story Building
- 10-Story building of height 30m
Table 11 10-Story Building Inter-Story Drift
Story Drift X Drift Y
STORY10 0.000572
STORY10 0.000573
STORY9 0.00087
STORY9 0.00087
STORY8 0.001169
STORY8 0.001169
STORY7 0.00146
STORY7 0.00146
STORY6 0.001803
STORY6 0.001803
STORY5 0.001913
STORY5 0.001913
STORY4 0.002052
STORY4 0.002053
STORY3 0.002226
STORY3 0.002226
STORY2 0.002429
STORY2 0.002429
STORY1 0.00266
STORY1 0.00266

25
Table 12 10-Story Periods and Modes
Mode Period Modal Mass
Modal Stiff
1 2.075403 112.9848 1035.559
2 2.075403 112.9848 1035.559
3 1.722495 112.9848 1503.363
4 0.600905 112.9848 12352.88
5 0.600905 112.9848 12352.88
6 0.527975 112.9848 16001.19
7 0.293608 112.9848 51742.2
8 0.293608 112.9848 51742.2
9 0.258643 112.9848 66677.5
10 0.181634 112.9848 135202.7

26
Figure 6 Column P-M-M Interaction Ratio of 10-Story Building
27
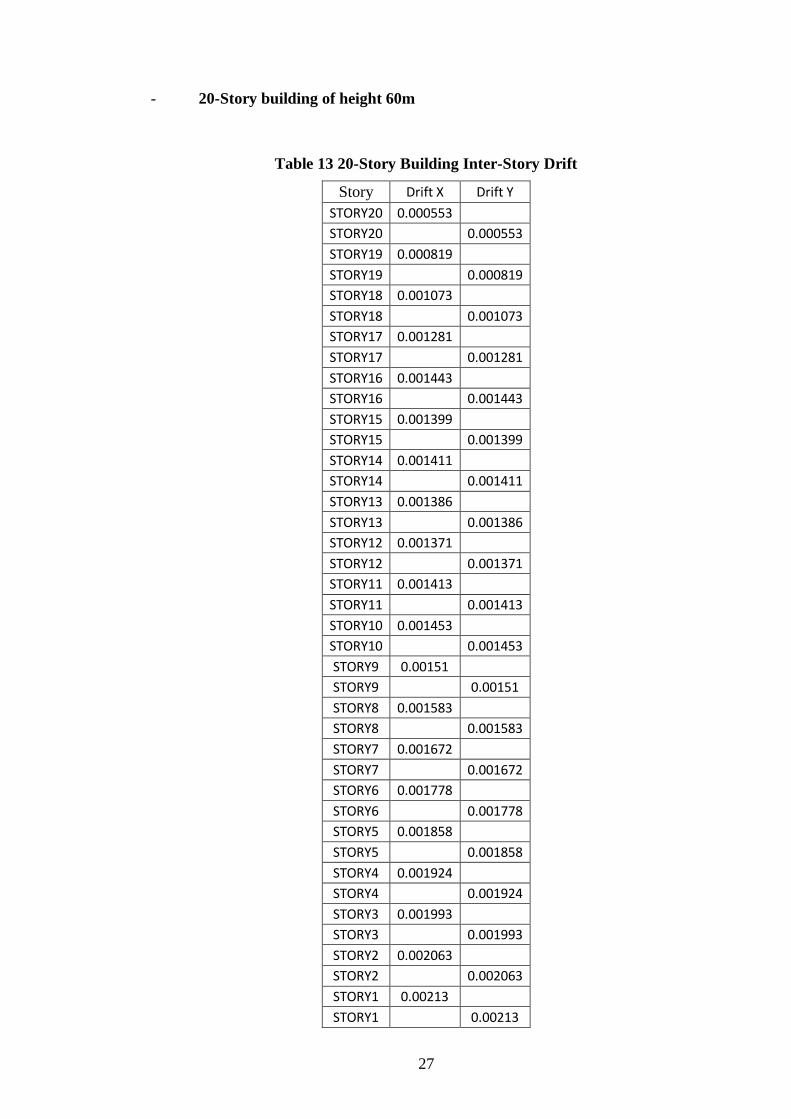
- 20-Story building of height 60m
Table 13 20-Story Building Inter-Story Drift
Story Drift X Drift Y
STORY20 0.000553
STORY20 0.000553
STORY19 0.000819
STORY19 0.000819
STORY18 0.001073
STORY18 0.001073
STORY17 0.001281
STORY17 0.001281
STORY16 0.001443
STORY16 0.001443
STORY15 0.001399
STORY15 0.001399
STORY14 0.001411
STORY14 0.001411
STORY13 0.001386
STORY13 0.001386
STORY12 0.001371
STORY12 0.001371
STORY11 0.001413
STORY11 0.001413
STORY10 0.001453
STORY10 0.001453
STORY9 0.00151
STORY9 0.00151
STORY8 0.001583
STORY8 0.001583
STORY7 0.001672
STORY7 0.001672
STORY6 0.001778
STORY6 0.001778
STORY5 0.001858
STORY5 0.001858
STORY4 0.001924
STORY4 0.001924
STORY3 0.001993
STORY3 0.001993
STORY2 0.002063
STORY2 0.002063
STORY1 0.00213
STORY1 0.00213
28
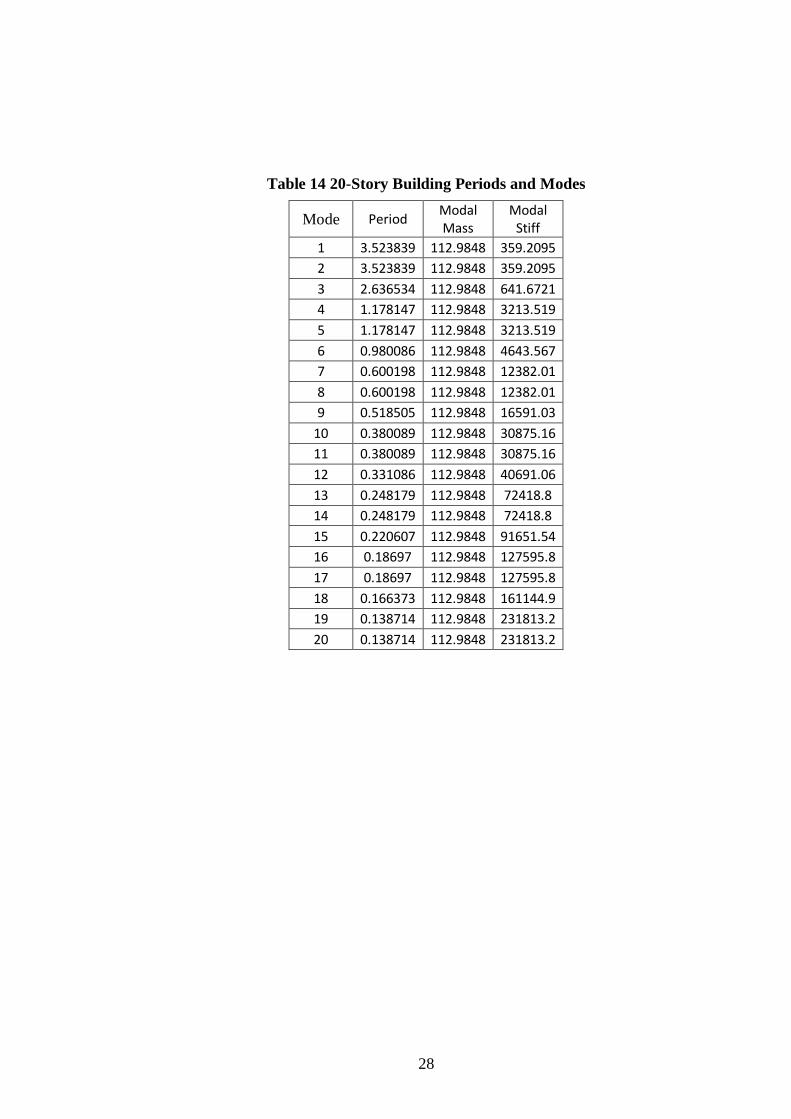
Table 14 20-Story Building Periods and Modes
Mode Period Modal Mass
Modal Stiff
1 3.523839 112.9848 359.2095
2 3.523839 112.9848 359.2095
3 2.636534 112.9848 641.6721
4 1.178147 112.9848 3213.519
5 1.178147 112.9848 3213.519
6 0.980086 112.9848 4643.567
7 0.600198 112.9848 12382.01
8 0.600198 112.9848 12382.01
9 0.518505 112.9848 16591.03
10 0.380089 112.9848 30875.16
11 0.380089 112.9848 30875.16
12 0.331086 112.9848 40691.06
13 0.248179 112.9848 72418.8
14 0.248179 112.9848 72418.8
15 0.220607 112.9848 91651.54
16 0.18697 112.9848 127595.8
17 0.18697 112.9848 127595.8
18 0.166373 112.9848 161144.9
19 0.138714 112.9848 231813.2
20 0.138714 112.9848 231813.2

29
Figure 7 Column P-M-M Interaction Ration of 20-Story Building
- 30-Story Building of height 90m
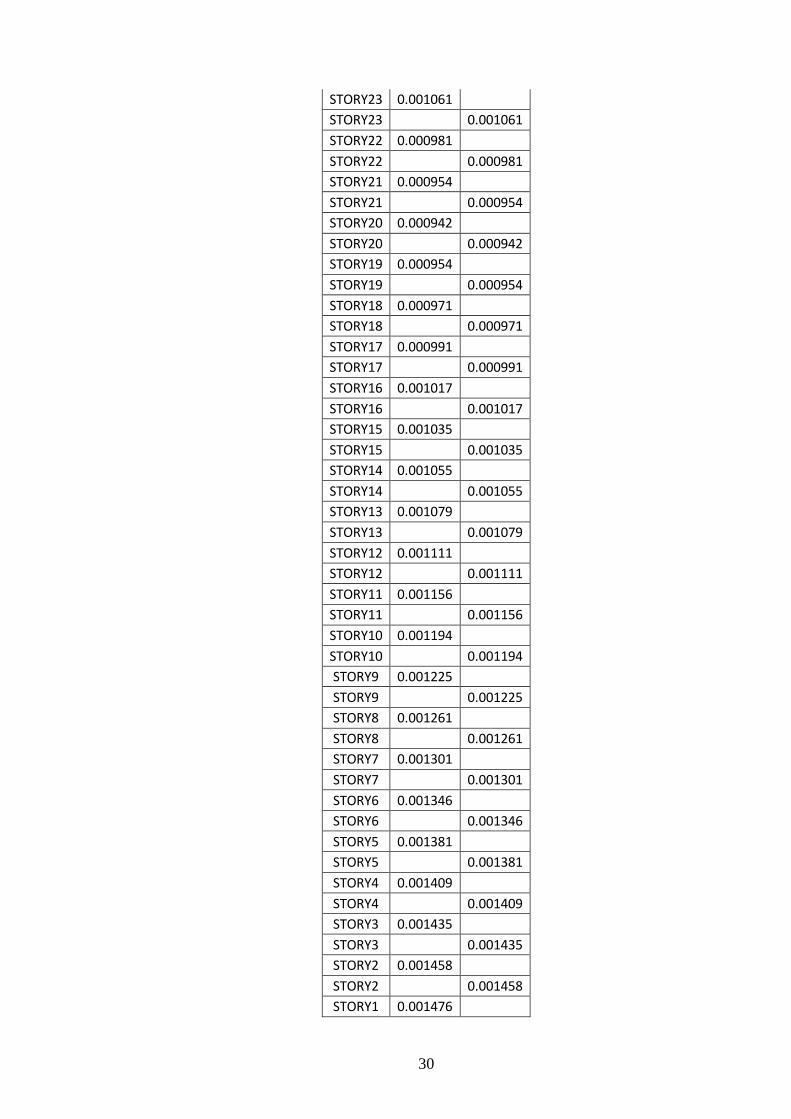
Table 15 30-Story Building Inter-Story Drift
Story Drift X Drift Y
STORY30 0.000565
STORY30 0.000565
STORY29 0.000823
STORY29 0.000823
STORY28 0.001048
STORY28 0.001048
STORY27 0.001206
STORY27 0.001206
STORY26 0.001282
STORY26 0.001282
STORY25 0.001176
STORY25 0.001176
STORY24 0.001144
STORY24 0.001144
30
STORY23 0.001061
STORY23 0.001061
STORY22 0.000981
STORY22 0.000981
STORY21 0.000954
STORY21 0.000954
STORY20 0.000942
STORY20 0.000942
STORY19 0.000954
STORY19 0.000954
STORY18 0.000971
STORY18 0.000971
STORY17 0.000991
STORY17 0.000991
STORY16 0.001017
STORY16 0.001017
STORY15 0.001035
STORY15 0.001035
STORY14 0.001055
STORY14 0.001055
STORY13 0.001079
STORY13 0.001079
STORY12 0.001111
STORY12 0.001111
STORY11 0.001156
STORY11 0.001156
STORY10 0.001194
STORY10 0.001194
STORY9 0.001225
STORY9 0.001225
STORY8 0.001261
STORY8 0.001261
STORY7 0.001301
STORY7 0.001301
STORY6 0.001346
STORY6 0.001346
STORY5 0.001381
STORY5 0.001381
STORY4 0.001409
STORY4 0.001409
STORY3 0.001435
STORY3 0.001435
STORY2 0.001458
STORY2 0.001458
STORY1 0.001476

31
STORY1 0.001476
Table 16 30-Story Building Periods and Modes
Mode Period Modal Mass
Modal Stiff
1 5.188276 112.9848 165.7043
2 5.188276 112.9848 165.7043
3 3.163683 112.9848 445.6501
4 1.694617 112.9848 1553.233
5 1.694617 112.9848 1553.233
6 1.298256 112.9848 2646.422
7 0.9058 112.9848 5436.453
8 0.9058 112.9848 5436.453
9 0.747158 112.9848 7990.149
10 0.553394 112.9848 14565.03
11 0.553394 112.9848 14565.03
12 0.472462 112.9848 19982.3
13 0.390115 112.9848 29308.6
14 0.390115 112.9848 29308.6
15 0.336733 112.9848 39337.56
16 0.279995 112.9848 56895.55
17 0.279995 112.9848 56895.55
18 0.245361 112.9848 74091.36
19 0.216273 112.9848 95362.23
20 0.216273 112.9848 95362.23
21 0.191832 112.9848 121209.6
22 0.167186 112.9848 159580
23 0.167186 112.9848 159580
24 0.150016 112.9848 198200.2
25 0.133944 112.9848 248618.3
26 0.133944 112.9848 248618.3
27 0.120615 112.9848 306605.5
28 0.111776 112.9848 357010.7
29 0.111776 112.9848 357010.7
30 0.100861 112.9848 438464.3
32
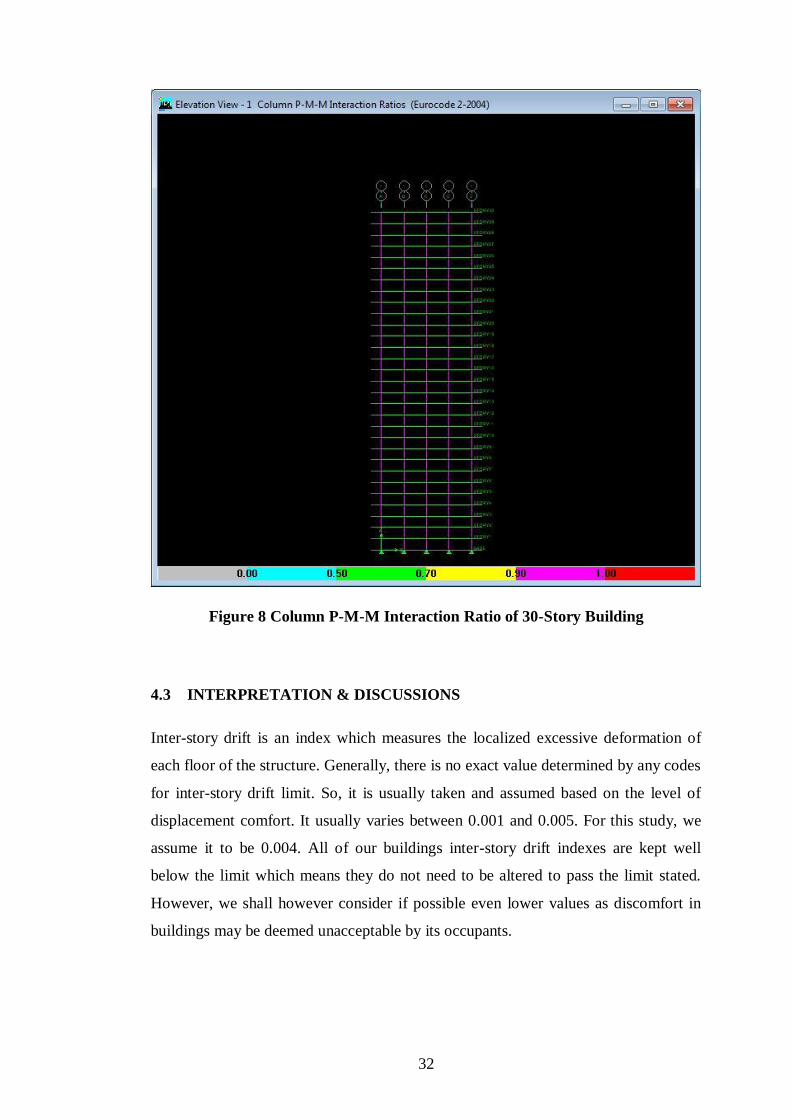
Figure 8 Column P-M-M Interaction Ratio of 30-Story Building
4.3 INTERPRETATION & DISCUSSIONS
Inter-story drift is an index which measures the localized excessive deformation of
each floor of the structure. Generally, there is no exact value determined by any codes
for inter-story drift limit. So, it is usually taken and assumed based on the level of
displacement comfort. It usually varies between 0.001 and 0.005. For this study, we
assume it to be 0.004. All of our buildings inter-story drift indexes are kept well
below the limit which means they do not need to be altered to pass the limit stated.
However, we shall however consider if possible even lower values as discomfort in
buildings may be deemed unacceptable by its occupants.

33
Figure 9 Drifts Comparisons
There are many reasons as why drift limitations has to be restricted. Besides from
causing discomfort to its dwellers or from influencing sensitive equipment, it can be
used to reduce distress in the structure, excessive cracking for serviceability purpose,
loss of stiffness and even P-Δ effects.
In case where it is considered higher, it can be reduced to an acceptable level by
either modifying the geometric configuration of the building, increasing the bending
stiffness of the horizontal members or by inclusion of stiffer wall or core wall or in
critical conditions, it might be indispensable to provide dampers to the structure.
From the columns P-M-M interaction ratios of all the structures analyzed statically
and then through response spectrum method, according to the stress band color, all of
our vertical elements (columns) have their capacity ranging from 0.9 to 1.0. . Since
the capacity ratios values are not superior to 1.0, it means that all the vertical
elements are not overstressed and structurally resistant to the earthquake dynamic
loading. We can easily conclude that our structure is safe for the earthquake design
magnitude. However in terms of reserve strength, we have to be careful as the values
are all approaching 1.0. .

34
CHAPTER 5
CONCLUSION & RECOMMENDATIONS
From our results obtained from the analyses outputs, the elements are in accordance
to our objectives of the study which are:
- By means of response spectrum, frequencies (periods) and mode shapes have
been obtained and tabulated for each type of structure as to show the behaviour of the
reinforced concrete buildings subjected to earthquake loadings
- The inter story drift indexes of all the buildings were determined and their
maximum found to be less than the limit which is 0.004 when evaluated and
compared to the limit value and;
- Analysis of the structural integrity of these buildings in withstanding the design
earthquake loadings was conducted and was judged to be safe from the column P-M-
M Interaction diagrams as for all the buildings columns capacity ratio is below 1.
However their vertical elements appear to not present excessive reserve strength as
their capacity is closer to 1.
The way forward will be to conduct studies on different shapes and geometrical
configurations and to see the variations as the study we conducted only included
regular rectangular shape and symmetrical configuration.
35
REFERENCES
Adnan, A., Hendriyawan, Marto, A. (2004). Lesson Learnt from the effect of Recent
far field Sumatra earthquakes to Peninsular Malaysia. 13th world conference
on earthquake engineering Vancouver, B.C, Canada, August 1-6, 2004, Paper
No. 416.
Adnan, A., Hendriyawan, Marto, A., Irshyam, M., (2006). Development of Synthetic
Time Histories at Bedrock for Kula Lumpur. Proceedings of the 6th Asia-
pacific Structural Engineering and Construction Conference (APSEC 2006),
5-6 September 2006, Kuala Lumpur, Malaysia.
AS1170.4 (1993) Minimum Seismic loads on Structures (known as the SAA loading
code) Part 4: Earthquake loads.
Bendick, R., Bilham, Fielding, R. E., Gaur, V., Hough, S. E., Kier, G., Kulkarni, M.,
Martin, S., and Mukul, M. (2001). January 26, 2001, Bhuj India earthquake.
Seismological research Letters, 72, 3.
Computers and Structures, Inc (2005). Welcome to ETABS. Version 9. November
2005. http://www.comp-engineering.com/manuals.htm
Giovinazzi, S. (2005). “The Vulnerability Assessment and the Damage Scenario in
Seismic Risk Analysis”, PhD Thesis, Technical University Carolo-
Wilhelmina at Braunschweig, Braunschweig, Germany and University of
Florence, Florence, Italy.
Hamburger, R.O. (1996). Implementing performance Based Seismic Design in
Structural Engineering Practice, Proceeding 11th WCEE, Paper No. 1212,
Mexico City, Mexico.
Indian standard criteria for earthquake resistant design of structures, IS 1893: 1984,
Bureau of Indian Standards, New Delhi.
Indian standard criteria for earthquake resistant design of structures, IS 1893: (Part 1)
2002, Part 1 General Provisions and Buildings (Fifth Revision), Bureau of
Indian Standards, New Delhi.
Koong, N. K., Won, K. W. (2005). Earthquake Hazard and Basic Concepts of
Seismic Resistant Design of Structures. Master Builders.
Lat, Che Noorliza, Ibrahim, A. T., (2009). Bukit Tinggi Earthquakes: November
2007 – Januarry 2008. Geology Society of Malaysia, Bulletin 55, November

36
2009
Mohd Zulham, Taksiah A. M., Faisal A., (2012). Effect Of Repeated Near Field
Earthquake To The High Rise Rc Building. Australian Journal of Basic and
Applied Sciences, 6(10): 129-138, 2012. ISSN 1991-8178.
Noor Aishah. (2002). Kelakunan Bangunan di Bawah Beban Gempa Bumi, Tesis
Sarjana Muda: Universiti Teknologi Malaysia.
Pankaj, A. & Manish, S. (2006). Earthquake Resistant Design of Structures. PHI
Learning Pvt. Ltd.
Suradi, S. (2007). Comparison On The Effect Of Earthquake And Wind Loads On
The Performance Of Reinforced Concrete Buildings. Master Degree Thesis:
University of Technology Malaysia.
Taksiah Abdul Madjid (2009). Less than one percent of buildings in Malaysia have
earthquake preventive measures.
http://www.bernama.com.my/bernama/v5/newsi
No 11, pp 619-632.
Taksiah, A. M., Shaharudin, S. Z., Fadzli, M.N., Mohd, R. A. & Izatil, F. M. S.
(2007). Development of Design Response Spectra For Northern Peninsular
Malaysia Based on UBC 97 Code. School of Civil Engineering, Universiti
Sains Malaysia.
Tan, C.W. (2002). Behavior of High Rise Building Under Seismic Effect. Faculty of
Civil Engineering. University of Technology Malaysia. Master Degree Thesis:
University of Technology Malaysia.
Yew M.S.K (2000). Kajian Kelakunan Bangunan Hospital di Bawah Kesan Seismik.
Tesis Sarjana Muda : Universiti Teknologi Malaysia.

37