seismic data processing report - … data processing report for origin energy project: t/18p survey:...
TRANSCRIPT

SEISMIC DATA PROCESSING REPORT
for
ORIGIN ENERGY
Project: T/18P
Survey: Shearwater 2D and 3D
Location: Bass Basin
Date: February 2006
Fugro Seismic Imaging Pty Ltd69 Outram Street
WEST PERTH WA 6005Tel: +61 (0)8 9322 2490Fax: + 61 (0)8 9481 6721
Email: info@fugrofsi.com.au

Table of Contents
1 Introduction........................................................................................................................................................31.1 Personnel.......................................................................................................................................................................31.2 Location Map..................................................................................................................................................................41.3 Tape/Line Listing............................................................................................................................................................5
2 Acquisition Parameters......................................................................................................................................93 Processing Sequence......................................................................................................................................104 Processing Description....................................................................................................................................11
4.1 Transcription................................................................................................................................................................114.2 Filter Delay...................................................................................................................................................................114.3 Gain Recovery.............................................................................................................................................................114.4 Swell Noise Attenuation...............................................................................................................................................114.5 Random Spike Attenuation..........................................................................................................................................124.6 Instrument Dephase and Source Designature.............................................................................................................124.7 Seismic/Navigation Merge...........................................................................................................................................134.8 FXInterpolation............................................................................................................................................................134.9 TauP Linear Transformation (Mute)............................................................................................................................134.10 Surface Related Multiple Elimination (S.R.M.E.)........................................................................................................144.11 TauP Linear Transformation (DBS)..........................................................................................................................144.12 Adjacent Trace Sum...................................................................................................................................................144.13 CMP Gather...............................................................................................................................................................144.14 First Pass Velocity Analysis.......................................................................................................................................144.15 Radon Multiple Attenuation (HIRes).........................................................................................................................154.16 Binning.......................................................................................................................................................................154.17 Tidal Static.................................................................................................................................................................154.18 First Pass Kirchhoff PSTM.........................................................................................................................................164.19 Second Pass Velocity Analysis..................................................................................................................................164.20 Second Pass Kirchhoff PSTM....................................................................................................................................164.21 Third Pass Velocity Analysis......................................................................................................................................164.22 Residual Radon Demultiple (HiRes).........................................................................................................................164.23 NMO Correction.........................................................................................................................................................174.24 Angle Stacks..............................................................................................................................................................174.25 Outer Trace Mute.......................................................................................................................................................174.26 Common Depth Point Stack.......................................................................................................................................174.27 Gun and Cable Statics...............................................................................................................................................174.28 FXY Deconvolution....................................................................................................................................................174.29 QCompensation........................................................................................................................................................17
5 AVO Processing...............................................................................................................................................185.1 Ostrander Mix...............................................................................................................................................................185.2 Band Pass Filter...........................................................................................................................................................185.3 Linear Gain...................................................................................................................................................................185.4 Phase Rotation.............................................................................................................................................................185.5 AVO Analysis...............................................................................................................................................................195.6 Gun and Cable Statics.................................................................................................................................................19
6 Archive.............................................................................................................................................................197 FARFIELD SIGNATURE LISTING..................................................................................................................218 SEGY Header Information...............................................................................................................................22
Shearwater 2D and 3D Processing Report February 2006 Page 2

1 Introduction
The Shearwater 3D survey consisted of a 250 sq. km (or 208 sq km full fold) and 202 sail km 2D lines. The data was acquired by P.G.S. using M/V Orient Explorer towing 4 X 4350 m streamers, 100 m separation and dual gun arrays, of 50 m separation. The data was acquired between 14th November to 9th December 2005.
Processing commenced in January to July 2006. All processing were undertaken at the Fugro Seismic Imaging office in Perth, Western Australia. All testing results were presented in Powerpoint format and delivered with SEGY file when required. All velocity QCs were created on DVDs and sent to Origin's office in Brisbane where a MGIVA system provided by FSI earlier.
1.1 PersonnelFugro Seismic Imaging Pty LtdRobert Fletcher Marine 3D ManagerC.K. Ong Senior Geophysicist
Origin EnergyMike Lonergan Staff GeophysicistRandall Taylor Chief Geophysicist
Shearwater 2D and 3D Processing Report February 2006 Page 3

1.2 Location Map
Figure 1: Shearwater 2D and 3D line location map.
Shearwater 2D and 3D Processing Report February 2006 Page 4

1.3 Tape/Line Listing
Shearwater 2D and 3D Processing Report February 2006 Page 5
Tape No. Line/Seq.No. Seq FFID FSP FGSP LFID LSP LGSP39732 OS2D2007P1001 1 1 840 840 951 9 1339734 OS051180P1003 3 100 2119 2119 1030 1199 119939735 OS051180P1003 3 1031 1198 1198 1352 888 89239736 OS051396P1004 4 100 1001 1001 1030 1920 192039737 OS051396P1004 4 1031 1921 1921 1354 2232 222839738 OS051172P1005 5 100 2119 2119 1030 1199 119939739 OS051172P1005 5 1031 1198 1198 1350 889 89339740 OS051388P1006 6 100 1002 1002 1030 1907 190739741 OS051388P1006 6 1031 1908 1908 1365 2232 222839742 MONTHLY TEST 0 1 0 0 12 0 039743 OS051164P1007 7 100 2119 2119 649 1590 168139744 OS051164P2008 8 100 1690 1690 923 889 89339745 OS051380P1009 9 100 1002 1002 1030 1922 192239746 OS051380P1009 9 1031 1923 1923 1350 2232 222839747 OS051156P1010 10 100 2120 2120 1030 1201 120139748 OS051156P1010 10 1031 1200 1200 1352 889 89339749 OS051380J1011 11 100 1002 1002 1030 1921 192139750 OS051380J1011 11 1031 1922 1922 1351 2232 222839751 OS051148P1012 12 100 2120 2120 1030 1202 120239752 OS051148P1012 12 1031 1201 1201 1352 889 89339753 OS051372P1013 13 100 1002 1002 1030 1922 192239754 OS051372P1013 13 1031 1923 1923 1165 2057 205739755 OS051372P1013 13 1167 2059 2059 1351 2233 222939756 OS051140P1014 14 100 2120 2120 1030 1200 120039757 OS051140P1014 14 1031 1199 1199 1351 890 89439758 OS051364P1015 15 100 1002 1002 237 1129 112939759 OS051364P1015 15 238 1130 1130 1168 2060 206039760 OS051364P1015 15 1169 2061 2061 1352 2233 222939761 OS051132P1016 16 100 2121 2121 1030 1202 120239762 OS051132P1016 16 1031 1201 1201 1352 890 89439763 OS051356P1017 17 100 1003 1003 1030 1921 192139764 OS051356P1017 17 1031 1922 1922 1352 2233 222939765 OS051132J1018 18 101 2121 2121 1030 1202 120239766 OS051132J1018 18 1031 1201 1201 1164 1068 106839767 OS051132J1018 18 1166 1066 1066 1352 890 89439768 OS051356J1019 19 100 1003 1003 1030 1923 192339769 OS051356J1019 19 1031 1924 1924 1350 2233 222939770 OS051124P1020 20 NTBP39771 OS051124P1020 20 100 2121 2121 2919 1213 121339772 OS051124P1020 20 2920 1212 1212 3252 890 89439773 OS051348P1021 21 2000 1003 1003 1022 1914 191439774 OS051348P1021 21 1023 1915 1915 1349 2233 222939775 OS051116P1022 22 100 2121 2121 1030 1203 120339776 OS051116P1022 22 1031 1202 1202 1352 891 89539777 OS051340P1023 23 100 1003 1003 1030 1923 192339778 OS051340P1023 23 1031 1924 1924 1352 2234 223039779 OS051116J1024 24 100 2121 2121 1030 1201 120139780 OS051116J1024 24 1031 1200 1200 1352 891 89539781 OS051332P1025 25 100 1003 1003 236 1129 112939782 OS051332P1025 25 238 1131 1131 1168 2061 206139783 OS051332P1025 25 1169 2062 2062 1354 2234 223039784 OS051108P1026 26 NTBP

Shearwater 2D and 3D Processing Report February 2006 Page 6
Tape No. Line/Seq.No. Seq FFID FSP FGSP LFID LSP LGSP39785 OS051108P2027 27 100 2121 2121 1012 1218 121839786 OS051108P2027 27 1013 1217 1217 1351 891 89539787 OS051332J1028 28 100 1003 1003 1030 1938 193839788 OS051332J1028 28 1031 1939 1939 1336 2234 223039789 OS051100P1029 29 100 2122 2122 534 1711 174339790 OS051332R1030 30 100 1688 1688 265 1831 182639791 OS051100P2031 31 100 1752 1752 981 891 89539792 OS051324P1032 32 100 0 0 116 0 039793 OS051324P1032 32 117 1004 1004 247 1124 112439794 OS051324P1032 32 249 1126 1126 1149 2015 201139795 OS051092P1033 33 100 2122 2122 1030 1201 120139796 OS051092P1033 33 1031 1200 1200 1159 1072 107239797 OS051092P1033 33 1161 1070 1070 1350 891 89539798 OS051092J1034 34 100 2122 2122 2919 1213 121339799 OS051092J1034 34 2920 1212 1212 3251 891 89539800 OS051316P1035 35 100 1004 1004 232 1127 112739801 OS051316P1035 35 234 1129 1129 1025 1920 192039802 OS051316P1035 35 1027 1922 1922 1348 2234 223039803 OS051084P1036 36 100 2122 2122 1030 1203 120339804 OS051084P1036 36 1031 1202 1202 1352 892 89639805 OS051308P1037 37 100 1004 1004 1030 1923 192339806 OS051308P1037 37 1031 1924 1924 1352 2235 223139807 OS051076P1038 38 NTBP39808 OS051076P1038 38 NTBP39809 OS051300P1039 39 100 1004 1004 1030 1922 192239810 OS051300P1039 39 1031 1923 1923 1353 2235 223139811 OS051076P2040 40 100 2122 2122 337 1895 189539812 OS051076P2040 40 338 1894 1894 1268 964 96439813 OS051076P2040 40 1269 963 963 1351 892 89639814 OS051300J1041 41 100 1004 1004 1030 1924 192439815 OS051300J1041 41 1031 1925 1925 1351 2235 223139816 OS051068P1042 42 100 2123 2123 1030 1203 120339817 OS051068P1042 42 1031 1202 1202 1352 892 89639818 OS051292P1043 43 100 1005 1005 859 1754 175439819 OS051292P1043 43 861 1756 1756 1351 2235 223139820 OS051060P1044 44 100 2123 2123 1030 1204 120439821 OS051060P1044 44 1031 1203 1203 1352 892 89639822 OS051284P1045 45 100 1005 1005 1030 1925 192539823 OS051284P1045 45 1031 1926 1926 1350 2235 223139824 OS051060J1046 46 100 2123 2123 1030 1203 120339825 OS051060J1046 46 1031 1202 1202 1351 892 89639826 OS051284J1047 47 100 1005 1005 1030 1922 192239827 OS051284J1047 47 1031 1923 1923 1354 2235 223139828 OS051052P1048 48 100 2123 2123 1030 1203 120339829 OS051052P1048 48 1031 1202 1202 1350 893 89739830 OS051276P1049 49 100 1005 1005 1030 1925 192539831 OS051276P1049 49 1031 1926 1926 1352 2236 223239832 OS051052J1050 50 100 2123 2123 1030 1203 120339833 OS051052J1050 50 1031 1202 1202 1300 933 93339834 OS051052J1050 50 1302 931 931 1355 893 89739835 OS051268P1051 51 100 1006 1006 1030 1926 192639836 OS051268P1051 51 1031 1927 1927 1351 2236 223239837 OS051188P1052 52 NTBP39838 OS051188P1052 52 NTBP

Shearwater 2D and 3D Processing Report February 2006 Page 7
Tape No. Line/Seq.No. Seq FFID FSP FGSP LFID LSP LGSP39839 OS051052J2053 53 100 2123 2123 1030 1203 120339840 OS051052J2053 53 1031 1202 1202 1350 893 89739841 OS051260P1054 54 100 1006 1006 1030 1926 192639842 OS051260P1054 54 1031 1927 1927 1351 2236 223239843 OS051044P1055 55 100 2123 2123 1030 1203 120339844 OS051044P1055 55 1031 1202 1202 1350 893 89739845 OS051260J1056 56 3000 0 0 3009 0 039846 OS051260J1056 56 3010 1006 1006 3940 1936 193639847 OS051260J1056 56 3941 1937 1937 4250 2236 223239848 OS051036P1057 57 100 2124 2124 1030 1204 120439849 OS051036P1057 57 1031 1203 1203 1352 893 89739850 OS051252P1058 58 100 1006 1006 235 1131 113139851 OS051252P1058 58 237 1133 1133 1167 2063 206339852 OS051252P1058 58 1168 2064 2064 1350 2237 223339853 OS051028P1059 59 100 2124 2124 1030 1204 120439854 OS051028P1059 59 1031 1203 1203 1350 897 89739855 OS051244P1060 60 100 1006 1006 1030 1926 192639856 OS051244P1060 60 1031 1927 1927 1351 2237 223339857 OS051028J1061 61 100 2124 2124 237 1998 199839858 OS051028J1061 61 239 1996 1996 1169 1066 106639859 OS051028J1061 61 1170 1065 1065 1352 893 89739860 OS051236P1062 62 100 1007 1007 1030 1927 192739861 OS051236P1062 62 1031 1928 1928 1349 2237 223339862 OS051020P1063 63 100 2124 2124 1030 1204 120439863 OS051020P1063 63 1031 1203 1203 1350 894 89839864 OS051228P1064 64 100 1007 1007 369 1265 126539865 OS051228P1064 64 371 1267 1267 1301 2197 219739866 OS051228P1064 64 1302 2198 2198 1349 2237 223339867 OS051188P2065 65 100 2119 2119 1030 1202 120239868 OS051188P2065 65 1031 1201 1201 1353 888 89239869 OS051228J1066 66 100 1008 1008 1030 1927 192739870 OS051228J1066 66 1031 1928 1928 1356 2237 223339871 OS2D3014P1067 67 2011 1020 1020 2085 946 94639872 OS2D3014P1067 67 2086 945 945 2998 33 3339873 OS2D3014P1067 67 2999 32 32 3018 13 1339874 OS2D3010P1068 68 6000 420 420 529 9 1339875 OS2D3013P1069 69 100 100 100 531 511 50739876 OS2D3009P1070 70 100 420 420 530 9 1339877 OS2D3011P1071 71 100 100 100 531 511 50739878 OS051220P1072 72 100 1007 1007 1030 1926 192639879 OS051220P1072 72 1031 1927 1927 1351 2238 223839880 OS051212P1073 73 100 1007 1007 633 1530 153039881 OS051212P1073 73 635 1532 1532 1351 2238 223439882 OS051012P1074 74 100 2125 2125 1030 1205 120539883 OS051012P1074 74 1031 1204 1204 1350 894 89839884 OS051212J1075 75 100 1007 1007 1030 1927 192739885 OS051212J1075 75 1031 1928 1928 1351 2238 223439886 OS051004P1076 76 100 2125 2125 1030 1204 120439887 OS051004P1076 76 1031 1203 1203 1348 894 89839888 OS051204P1077 77 100 1008 1008 1030 1927 192739889 OS051204P1077 77 1031 1928 1928 1350 2238 223439890 OS051004J1078 78 100 2125 2125 1030 1205 120539891 OS051004J1078 78 1031 1204 1204 1349 894 898

Shearwater 2D and 3D Processing Report February 2006 Page 8
Tape No. Line/Seq.No. Seq FFID FSP FGSP LFID LSP LGSP39892 OS051196P1079 79 100 1008 1008 1030 1927 192739893 OS051196P1079 79 1031 1928 1928 1352 2238 223439894 OS051188J1080 80 100 2119 2119 1030 1199 119939895 OS051188J1080 80 1031 1198 1198 1350 888 89239896 OS051196J1081 81 101 1040 1040 565 1481 147639897 OS051324P2082 82 100 2002 2002 352 2234 223039898 OS2D2006P1083 83 100 101 101 1012 1000 100039899 OS2D2006P1083 83 1013 1001 1001 1373 1351 134739900 OS2D2005P1084 84 100 100 100 532 511 50739901 OS2D3012P1085 85 101 100 100 532 511 50739902 OS2D2003P1086 86 100 100 100 531 511 50739903 OS2D2001P1087 87 100 420 420 230 300 30039904 OS2D2001P1087 87 232 298 298 530 9 1339905 OS2D2004P1088 88 100 100 100 356 346 34639906 OS2D2004P1088 88 358 348 348 531 511 50739907 OS2D2002P1089 89 100 420 420 531 9 1339908 OS2D3008P1090 90 100 420 420 531 9 1339909 MONTHLY TEST 0 1 0 0 12 0 0

2 Acquisition Parameters
DESCRIPTION DETAILSData recorded by : P.G.S.Date recorded : 14th Nov9th Dec 2005Vessel : Orient Explorer
General :Field CMP interval 8 X 6.25 mNominal fold 58Recording format : SEGD 8036
Seismic source :Type Bolt 1500LL / 600B gunsVolume 2 X 2500 cu.inPressure : 1800 psiDepth : 6.0 mShot interval 3D : 37.5 m flipflopShot interval 2D : 25.0 m
Recording system :Instrument : Syntrak / gASRecord length / Sample interval 5120 / 2.0 msecRecording Filter 3/12206/276 Hz/(dB/Oct)Filter Delay 120 msecGain Setting 12 dB
Receivers:Streamer Type : Syntron / Teledyne LDAData Channels : 4 X 348 Streamer depth : 8.0 mNominal near group offset : 96.0 m
Polarity Convention SEG, +ve pressure gives ve no.
Shearwater 2D and 3D Processing Report February 2006 Page 9

3 Processing Sequence
Shearwater 2D and 3D Processing Report February 2006 Page 10
Field Tape Transcription
Filter Delay(120 msec)
Gain Recovery
(Spherical Divergence = Tsqr)
Swell Noise Attenuation
Random Spike Attenuation
Deterministic Designature(Gun + Receiver Ghost)
Navigation Merging
FX Interpolation
Linear TauP ( Mute)
SRME
Linear TauP (Dcon)
Adjacent Trace Sum
CMP Sort
1st Pass Velocity Aalysis
Hires Radon Demultiple
Binning
Tidal Static
Flexing > SEGY(Common Trace interpolation)
First Pass Kirchhoff PSTM
2nd Pass Velocity Analysis
2nd Pass Kirchhoff PSTM
3rd Pass Velocity Analysis
Residual Radon Demultiple > SEGY(NMO)
(Gun+Cable Statics)
NMO
Angle Stacks > SEGY(fxydecon)
Outer Trace Mute
Stack
Gun+Cable Statics > SEGY
(fxydecon)
QCompensation > SEGY(fxydecon)
AVO Attributes > SEGY
(DeltaRP)(Gradient)(Intercept)

4 Processing DescriptionA brief description of each of the processes used in the processing sequence follows:
4.1 TranscriptionField data in SEGD format was converted to Fugro Seismic Imaging internal format for processing. Fugro Seismic Imaging internal format is trace sequential, with samples in 32 bit IEEE floating point. When reading the shot records, strategic header values related to acquisition were reserved (where available).
4.2 Filter DelayA static correction of 120 msec. was applied to compensate for system digital filter delay.
4.3 Gain RecoveryA gain function was applied to the data set to compensate for amplitude decay. The functions applied used a T squared compensation for inelastic attenuation and spherical divergence losses. ( T is the two way travel time in milliseconds).
4.4 Swell Noise AttenuationSwell noise attenuation is achieved by shaping the amplitude spectra of selected "swell noise affected" traces.
Analysis and attenuation are performed in the FX domain, processing one source position at a time. For analysis, the amplitude spectra are normalized, considering only the higher frequency range which is less influenced by swell noise. After normalization the swell noise traces are recognized by their relatively high amplitude, low frequency component. The shallow portion of each shot record is muted before analysis, removing the high amplitude shallow reflections and direct arrivals.
The user nominates a frequency range for analysis, and for spectral scaling. Typically this frequency range is from 0 to 32 Hz. Scalars are calculated to shape the spectra of individual swell noise affected traces to the mean of the non swell noise affected traces. The scalars are fully applied from 0 to one half the defined frequency range, after which the scalars are tapered to zero application at the maximum defined frequency. No modification is made to other traces.
The mechanism of swell noise recognition is not influenced by change in source energy, or by systematic variation in trace amplitude levels. Shots not affected by swell noise will not present any traces for swell noise attenuation.
The swell noise attenuation is monitored by recording the number of channels flagged as being affected by swell noise.
Shearwater 2D and 3D Processing Report February 2006 Page 11

4.5 Random Spike AttenuationDespike was applied to remove any anomalous high energy amplitudes which could be the source of noise in the prestack migration. Amplitudes were measured in a matrix of 45 time windows of 100 ms length. The matrix was composed of seven consecutive time windows across 11 adjacent traces in a shot gather. The amplitude of the centre window is compared to the rest of the matrix and the centre window is defined as containing a spike if the peak to median ratio is greater than 15, or if the centre window median value exhibits more than 8.0 units of standard deviation from the average median. Spike affected windows are scaled to the mean of the matrix.
4.6 Instrument Dephase and Source DesignatureA filter was designed to convert the supplied far field signature to its zero phase equivalent. The effect of applying this filter to the data is to remove the phase rotations caused by the recording instruments, and to collapse the effective source signature. The data was output zerophase.
The modeled source far field signature, full system response with source and receiver ghost is shown below and the listing is include in section 7 of this report.
Figure 2: Modeled Source Signature. Full system response with source and receiver ghost.
Shearwater 2D and 3D Processing Report February 2006 Page 12

4.7 Seismic/Navigation MergeThe seismic trace headers were updated with easting and northing values from the supplied navigation files. The acquisition time in the navigation files and seismic headers were compared to ensure a correct match (with a tolerance of 4 seconds). The water depth (depth at sounder) was updated and the sea floor two way time calculated using a water velocity of 1500m/s. Trace offsets were calculated using the source and receiver coordinates.
CLOCK TIME GMT
GEODETIC DATUM AS SURVEY GDA94 GRS1980 6378137.000 298.2572221
GEODETIC DATUM FOR POST GDA94 GRS1980 6378137.000 298.2572221
PROJECTION 002 UTM SOUTH
ZONE 55S
CENTRAL MERIDIAN 147 0 0.000E
4.8 FXInterpolationTo reduce the potential for aliasing, 2:1 FX interpolation was performed, output trace spacing of 6.25 m, prior to Taup linear transform. The spatial interpolation is based on the forward-backward linear prediction [FBLP] theory (cf., Tufts and Kumaresan, 1982; Spitz, 1991).
4.9 TauP Linear Transformation (Mute)The shot record seismic data was transformed into the Taup domain performed in linear mode. The transform DeltaT ranged from –2000 msec to +4000 msec at offset 4520 meters with increment at 8 msec and output 751 Ptraces.
A spatial Time vs Pvariant mute with a cosine square taper was applied to eliminate linear noise generated within the water column.
Time (msec) Ptrace mute on Ptrace mute off
100 150 200 600 700
250 150 200 410 490
500 150 200 400 470
1000 150 200 390 450
2000 150 200 380 440
5000 150 200 375 440
Shearwater 2D and 3D Processing Report February 2006 Page 13

4.10 Surface Related Multiple Elimination (S.R.M.E.)SRME or Surface Related Multiple Elimination uses the geometry of shot recording to estimate all possible multiples that can be generated by the surface. It was developed by the Delphi Consortium at Tu Delft in the Netherlands. One order of surface related multiples is predicted using autoconvolutions of input data. The predicted multiple energy is then removed from the input gathers by a process of cascaded adaptive subtraction.Prior to forming the multiple estimate, it is necessary to interpolate new shots such that the shotpoint interval is equal to the group interval. The recorded data is then extrapolated to zero offset and regularized before constructing the multiple estimate by a series of convolutions and summation.
4.11 TauP Linear Transformation (DBS)The shot record seismic data was transformed into the Taup domain performed in linear mode. The transform DeltaT ranged from –2000 msec to +4000 msec at offset 4520 meters with increment at 8 msec and output 751 Ptraces.
Predictive deconvolution was utilized to attenuate short period reverberations. A single operator was used. The short period reverberation is more periodic in taup domain than in tx domain
Operator Length (msec) 300
Gap (msec) 32
Design Gate (msec) 0 3500
4.12 Adjacent Trace SumA 2:1 adjacent trace sum was applied to form a 37.5 m/25.0 m shot/group interval geometry. This was applied after NMO correcting the shots with the first pass velocity functions. A trace mix was also applied during the summation process:
4.13 CMP GatherData from each source/cable combination was sorted into the common midpoint domain gathers. With a nominal fold of 58.
4.14 First Pass Velocity AnalysisFirst pass velocities at 1000 X 1000 m grid were determined using Fugro Seismic Imaging Pty Ltd “MGIVA” interactive velocity analysis program on crude gathers (FK filter and DBS applied). Each velocity analysis comprised a semblance display, a CDP stacked panel repeated 14 times with a suite of velocity functions, and a central CDP gather. The suite of functions were generated using 0%, +/5 %, +/10%, +/15%, +/20 %, +/25%, +/30%, and +40% increments from a central velocity function. The central functions were final velocity functions varying according to WBT derived from the previously processed data.
A mild FK multiple attenuation was applied to enhance the primary energy of the data before the analysis using the following percentages of the brute velocity function: 10% at 1000 ms and 15% at 2500 ms. This was applied for the purpose of the analysis only.
Shearwater 2D and 3D Processing Report February 2006 Page 14

The velocity analysis incorporated a map of all velocity locations, and the semblance display included functions from proximate lines. This enabled the velocities to be picked with knowledge of areal velocity trends. Velocity QC can be performed more effectively when discordant velocities can be recognised on the map.
4.15 Radon Multiple Attenuation (HIRes)Radon demultiple was generally applied from WBT plus 400 ms to record lengths. This process was performed in the high resolution parabolic TauP domain using NMO corrected gathers with 1st pass velocity functions.
The TauP transform range was –1000 to 2000 ms and was sampled over 301 p traces. The multiples were modelled from :
Multiple attenuation was accomplished by subtracting modelled multiples from input gathers.
To reduce the potential for aliasing, 2:1 FX interpolation was performed along common offset domain prior to demultiple. After demultiple, interpolated traces were dropped from the processing stream.
A 300 ms AGC was applied before the Radon demultiple, and the scalars preserved for later removal.
4.16 BinningThe data was binned, output onto a 12.50 m inline and 25.00 m crossline grid. No flexing was performed. Missing traces from each offset plane were interpolated using a 3D dip model derived from the full offset stack.
Grid Definition :
Easting Northing Crossline Inline Increment
Grid Origin 351556.18 5578658.54 787 921 1 X 1
Azimuth 20.29 degrees
Line Interval 25.00 m
CMP Interval 12.50 m
Datum GDA94
Central Meridian 147 0 0.000E
Projection Type 002 UTM SOUTHERN HEMISPHERE
Projection Zone 55S
4.17 Tidal StaticTidal Static were computed using measured sea level from Burnie Sea Level Observation in Tasmania. The tidal static were computed with reference to MSL in 6.0 minute interval and applied to the binned gathers.
Shearwater 2D and 3D Processing Report February 2006 Page 15

4.18 First Pass Kirchhoff PSTMFull prestack Kirchhoff time migration was used to migrate data for velocity analysis. FSI's SHIMOGEN migration algorithm was used in straight ray mode, with a 4 km half aperture. The velocity field was constructed by smoothing the first pass velocities. Apertures were muted with a 50% stretch mute to avoid operator aliasing. Migration was performed on all the offset planes. The migration generates fully corrected CDP gathers on each line. The migration velocity field is then used to 'remove' the NMO corrections before velocity analysis.
4.19 Second Pass Velocity AnalysisThe second pass of velocities were picked at 500 X 500 m grid on first pass PSTM gathers using Fugro Seismic Imaging Pty Ltd “MGIVA” interactive velocity analysis program. Each velocity analysis comprised a semblance display, a CDP stacked panel repeated 14 times with a suite of velocity functions, and a central CDP gather. The suite of functions were generated using 0%, +/4%, +/8%, +/12%, +/16%, +/20% , +/24% and +30% increments from a central velocity function. The first pass of velocities were used as the central function for this suite of velocity variant functions.
4.20 Second Pass Kirchhoff PSTMKirchhoff prestack time migration was applied using a maximum half aperture of 4 km. Antialiasing protection was applied by prefiltering the data within the migration scan depending upon the local migration operator dip. Smoothed 100% second pass velocities at 1 km were used in the migration except at the end of the data where velocities were reduced to lessen the migration artefacts. Migration was performed on all offset planes.
4.21 Third Pass Velocity AnalysisThe third pass of velocities were picked on a 250 X 250 m grid on second pass PSTM gathers using Fugro Seismic Imaging Pty Ltd “MGIVA” interactive velocity analysis program. Each velocity analysis comprised a semblance display, a CDP stacked panel repeated 14 times with a suite of velocity functions, and a central CDP gather. The suite of functions were generated using 0%, +/4%, +/8%, +/12%, +/16%, +/20% , +/24% and +30% increments from a central velocity function. The second pass of velocities were used as the central function for this suite of velocity variant functions.
4.22 Residual Radon Demultiple (HiRes)The initial demultiple processing was performed in the knowledge that some multiple energy remained in the data. A conservative approach was necessary until the velocities could be more accurately interpreted on the finer sampled grid, and with the benefit of prestack time migration. This remnant multiple energy could then be addressed with a 'residual' demultiple. Normal moveout corrections were performed using the final velocities, and the prestack time migrated gathers transformed into the parabolic TauP domain. Weighting terms were added to the least squares solution to reduce residual error in the transform – a method known as “high resolution radon”. The segment of the TauP domain corresponding to primary reflections was then muted, leaving the multiple energy to be transformed back into the TX domain and subtracted from the original CDP gather.
The TauP transform range was –500 to 3000 ms and was sampled over 351 p traces. Multiple attenuation was accomplished by subtracting modelled multiples from input gathers.
Shearwater 2D and 3D Processing Report February 2006 Page 16
To reduce the potential for aliasing, 2:1 FX interpolation was performed in CDP domain prior to demultiple. After demultiple, interpolated traces were dropped from the processing stream.
A 300 ms AGC was applied before the Radon demultiple, and the scalars preserved for later removal.
4.23 NMO CorrectionFourth order NMO corrections were applied using the final picked PSTM velocity functions.
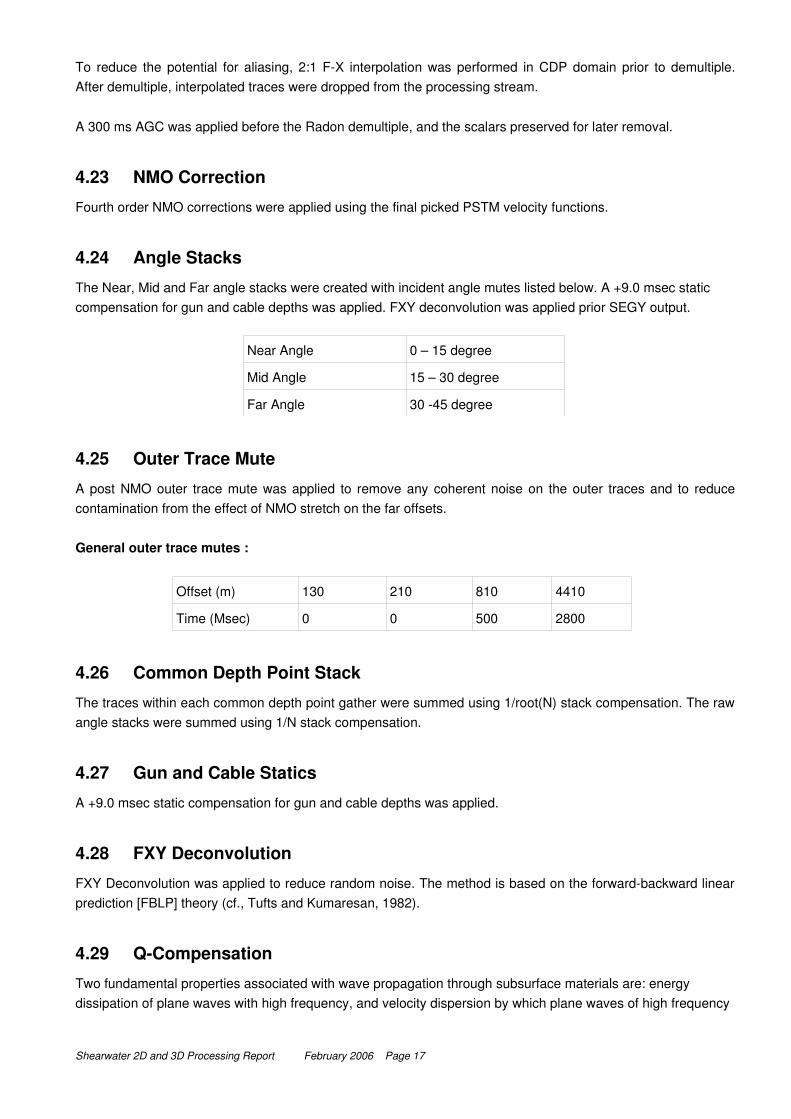
4.24 Angle StacksThe Near, Mid and Far angle stacks were created with incident angle mutes listed below. A +9.0 msec static compensation for gun and cable depths was applied. FXY deconvolution was applied prior SEGY output.
Near Angle 0 – 15 degree
Mid Angle 15 – 30 degree
Far Angle 30 45 degree
4.25 Outer Trace MuteA post NMO outer trace mute was applied to remove any coherent noise on the outer traces and to reduce contamination from the effect of NMO stretch on the far offsets.
General outer trace mutes :
Offset (m) 130 210 810 4410
Time (Msec) 0 0 500 2800
4.26 Common Depth Point StackThe traces within each common depth point gather were summed using 1/root(N) stack compensation. The raw angle stacks were summed using 1/N stack compensation.
4.27 Gun and Cable StaticsA +9.0 msec static compensation for gun and cable depths was applied.
4.28 FXY DeconvolutionFXY Deconvolution was applied to reduce random noise. The method is based on the forwardbackward linear prediction [FBLP] theory (cf., Tufts and Kumaresan, 1982).
4.29 QCompensationTwo fundamental properties associated with wave propagation through subsurface materials are: energy dissipation of plane waves with high frequency, and velocity dispersion by which plane waves of high frequency
Shearwater 2D and 3D Processing Report February 2006 Page 17

travel faster than ones with low frequency. These effects may be represented mathematically as the earth Qfilter, defined in terms of a specified earth Q model.
In seismic data processing where the earth Q model is often assumed to be frequency independent, inverse Qfiltering attempts to compensate recorded seismic signals for these wave propagation effects. A general stabilization scheme (both phase and amplitude) was used. A value of Q = 180 and a Gain Limit of 12 dB were used. FXY deconvolution was applied prior to SEGY output.
5 AVO ProcessingThree Separate AVO products were produced: Intercept(I), Gradient(G), and DeltaRp.The data was processed in an amplitude consistent manor. The good S/N ratio of the data set suggests that AVO analysis should be relatively reliable. The cable length of 4400m gave sufficient angle sampling ie. 40 degrees at a target of 3 seconds.
5.1 Ostrander MixThe PSTM gathers were NMO corrected as per section 5.20 and an Ostrander mix was performed to improve the S/N ratio of the prestack data. An “Ostrander Mix” involves a dual combination of a three trace mix in the commonoffset domain and in the CDP domain.
Ostrander Mix
Trace mix weights: 1,1,1
Apply: Both common offset and common CDP.
5.2 Band Pass Filter
Bandpass Filter Parameters
Time (msec) Frequency trapezoid (Hz)
0 3/6 – 90/105
4000 1/4 – 40/50
5.3 Linear GainInelastic absorption of energy was corrected for by an exponential gain application of 4dB per second.
5.4 Phase RotationThe data was phase shifted 180 degrees to convert it from SEG negative to SEG positive; the convention required for AVO analysis.
Shearwater 2D and 3D Processing Report February 2006 Page 18

5.5 AVO AnalysisThree 3D cubes were produced.
i) Intercept (I)I represents intercept, which is the zero offset reflection coefficient.
ii) Gradient (G)G represents Gradient which is essentially the change in amplitude with offset at any particular time sample within a CDP gather.
iv) Delta RpThis method is based on the concept of cross plotting AVO measurements. Data input to the cross plot are Rp (or Intercept) and the Gradient measurement from the seismic gathers. The algorithm calculates a lithological trend from the Rp and Gradient data. This trend represents the average response of brine filled rocks in the analysis window. Unusual rocks like gasfilled sands are displaced from this wet trend. The Delta Rp calculation is the reflectivity separation between a data point with the anomalous reflectivity and the trend. The top of a class III hydrocarbon saturated sand unit is a negative amplitude anomaly, whereas the base is a positively amplitude anomaly.
5.6 Gun and Cable StaticsA +9.0 msec static compensation for gun and cable depths was applied to the three AVO cubes.
6 ArchiveThe following data sets were archived :
Tape No.
Dataset Inline Range Remark
028MV001DVD MGIVA VA1 Bad
028MV002DVD MGIVA VA1
028MV003DVD MGIVA VA2
028MV004DVD POSTSTACK MIG. (KIRCHHOFF) 10001200
028MV005DVD POSTSTACK MIG. (KIRCHHOFF) 12011400 Bad Destroyed
028MV006DVD POSTSTACK MIG. (KIRCHHOFF) 12011400 Replace 028MV005DVD
028MV007DVD VA3 MGIVA FILES VOLUME 1/4
028MV008DVD VA3 MGIVA FILES VOLUME 2/4
028MV009DVD VA3 MGIVA FILES VOLUME 3/4
028MV010DVD VA3 MGIVA FILES VOLUME 4/4
028MV011DVD PSTM (NO SCAMP) 10001200
Shearwater 2D and 3D Processing Report February 2006 Page 19

Tape No.
Dataset Inline Range Remark
028MV012DVD PSTM (NO SCAMP) 12011400
028MV013DVD PSTM (SCAMP) 10001200
028MV014DVD PSTM (SCAMP) 12011400
028MV015DVD PSTM STACKS (QCOMP) 10001200
028MV016DVD PSTM STACKS (QCOMP) 12011400
028MV017DVD PSTM STACKS 10001200
028MV018DVD PSTM STACKS 12011400
028MV019DVD PSTM STACKS (QCOMP/FXYDECON) 10001200
028MV020DVD PSTM STACKS (QCOMP/FXYDECON) 12011400
028MV021DVD PSTM STACKS (FXYDECON) 10001200
028MV022DVD PSTM STACKS (FXYDECON) 12011400
028MV023DVD NEAR ANGLE STACKS (015 Degree) 10001200
028MV024DVD NEAR ANGLE STACKS (015 Degree) 12011400
028MV025DVD MID ANGLE STACKS (1530 Degree) 10001200 Error Destroyed
028MV026DVD MID ANGLE STACKS (1530 Degree) 12011400 Error Destroyed
028MV027DVD FAR ANGLE STACKS (3045 Degree) 10001200 Error Destroyed
028MV028DVD FAR ANGLE STACKS (3045 Degree) 12011400 Error Destroyed
028MV029DVD NEAR ANGLE STACKS (FXYDECON) 10001200
028MV030DVD NEAR ANGLE STACKS (FXYDECON) 12011400
028MV031DVD MID ANGLE STACKS (FXYDECON) 10001200
028MV032DVD MID ANGLE STACKS (FXYDECON) 12011400
028MV033DVD FAR ANGLE STACK (FXYDECON) 10001200
028MV034DVD FAR ANGLE STACK (FXYDECON) 12011400
028MV035DVD AVO ATTRIBUTE DELTARP 11011200/12011300
028MV036DVD AVO ATTRIBUTE DELTARP 10001100/13011400
028MV037DVD AVO ATTRIBUTE GRADIENT 10001200
028MV038DVD AVO ATTRIBUTE GRADIENT 12011400
028MV039DVD AVO ATTRIBUTE INTERCEPT 10001200
028MV040DVD AVO ATTRIBUTE INTERCEPT 12011400
028MV041USB BINNED GATHERS VOL.1/2 10001289
028MV042USB BINNED GATHERS VOL.2/2 12901400
028MV043USB PSTM GATHERS (NMO) VOL.1/2 10001259
028MV044USB PSTM GATHERS (NMO) VOL.2/2 12601400
Shearwater 2D and 3D Processing Report February 2006 Page 20

Shearwater 2D and 3D Processing Report February 2006 Page 21

7 FARFIELD SIGNATURE LISTINGFull system response with source and receiver ghostArray name : 2500LB_60_1800_100 Total volume : 2500 cu.in.Source depth : 6.00 mStreamer depth : 8.00 mGroup length : 0.00 mAverage pressure : 1800 psiGhost strength : 1.00Seawater temperature : 20.00 CSeawater velocity : 1521.6 m/sFilter : Lowcut frequency : 8.80 Hz Lowcut slope : 18.00 dB/oct Highcut frequency : 206.00 Hz Highcut slope : 276.00 dB/oct Instrument : S24 g6.25 Time of 1st sample: 56.00 msec i.e. index of time zero = 29.0Sample interval : 2.00 msec resampled from 0.5 ms.Farfield position : Distance : 9000.00 m Azimuth : 0.00 deg Angle of vertical : 0.00 deg Amplitudes are in bar mTime is increasing horizontally
0.000 0.000 0.000 0.002 0.004 0.026 0.006 0.019 0.023 0.0510.014 0.018 0.069 0.030 0.130 0.039 0.119 0.085 0.218 0.1350.644 0.624 0.542 0.440 0.468 1.104 2.469 4.496 14.337 36.62815.120 0.925 20.905 53.746 57.064 26.735 3.662 17.700 46.480 31.486 9.306 5.344 1.223 2.344 1.810 0.727 0.466 0.825 0.266 0.4670.818 0.504 0.822 0.784 0.575 0.504 0.342 0.188 0.175 0.0980.098 0.158 0.095 0.168 0.317 0.411 0.687 1.053 1.471 1.8851.856 1.429 0.833 0.159 0.190 0.174 0.041 0.146 0.047 0.291 0.360 0.130 0.415 1.059 1.214 0.965 0.475 0.138 0.370 0.275 0.103 0.105 0.016 0.366 0.807 1.297 1.534 1.405 1.086 0.4690.163 0.517 0.714 0.528 0.062 0.329 0.746 0.985 0.928 0.826 0.565 0.255 0.111 0.054 0.117 0.060 0.116 0.119 0.144 0.2460.183 0.152 0.159 0.021 0.006 0.043 0.028 0.183 0.285 0.3240.473 0.476 0.437 0.437 0.307 0.208 0.092 0.079 0.091 0.082 0.039 0.139 0.227 0.319 0.425 0.329 0.269 0.224 0.035 0.045 0.120 0.234 0.222 0.331 0.467 0.488 0.615 0.636 0.536 0.490 0.299 0.136 0.087 0.067 0.125 0.129 0.235 0.238 0.265 0.3460.277 0.262 0.262 0.161 0.176 0.173 0.132 0.184 0.107 0.015 0.009 0.141 0.177 0.122 0.121 0.025 0.020 0.060 0.072 0.158 0.264 0.237 0.231 0.167 0.057 0.053 0.018 0.010 0.030 0.0000.031
Shearwater 2D and 3D Processing Report February 2006 Page 22

8 SEGY Header Information
Type Offset Description Type Offset DescriptionI32 0 Trace number within line. I32 196 Northing of CDP.I32 4 Trace number within reel. I16 200 Scaler to be applied to SPNO.I32 8 Sequential record number. I16 98 Source static correction.I32 8 Original field record number. I16 100 Receiver static correction.I32 12 Trace number. I16 102 Total static applied.I32 16 Shot point number. I16 108 Delay recording time (ms).I32 20 CDP number. I16 110 Mute time start.I32 24 Trace no. within the CDP. I16 112 Mute time end.I16 28 Trace identification code. I16 114 No. of samples.I16 30 No. of summed traces. I16 116 Samp interval in microseconds.I16 32 Total number of traces in CDP. I16 156 Year of recordingI16 34 Data use 1=production, 2=test. I16 158 Julian day number (1366)I32 36 Trace offset (integer). I16 160 Hour of day (24 hour clock)I32 40 Elevation at receiver. I16 162 Minute of hourI32 44 Elevation at source. I16 164 Second of minuteI32 60 Water depth at source. I16 166 Time base code 1.local,2.gmt,3.?I32 64 Water depth at receiver. I16 180 Seqn record no. (prestack only)I16 68 Scaler to be applied to elevations I32 180 3D Line number.I16 70 Scaler to be applied to coordinates I32 184 CDP no. within 3D line.I32 72 Source easting. I32 188 2D shotpoint number (Maersk)I32 76 Source northing. I32 192 Easting of CDP.I32 80 Receiver easting. I32 196 Northing of CDP.I32 84 Receiver northing. I16 200 Scaler to be applied to SPNO.I16 88 Coordinate units (m/arc)I32 192 Easting of CDP.
Shearwater 2D and 3D Processing Report February 2006 Page 23