seismic crustal structure between the...
TRANSCRIPT
(2007) 1–25www.elsevier.com/locate/tecto
Tectonophysics 430
Seismic crustal structure between the Transylvanian Basinand the Black Sea, Romania
F. Hauser a,1, V. Raileanu b, W. Fielitz c,⁎, C. Dinu d,M. Landes a, A. Bala b, C. Prodehl a
a Geophysical Institute, University of Karlsruhe, Hertzstr. 16, D-76187 Karlsruhe, Germanyb National Institute for Earth Physics, P.O.Box MG-2, RO-077125 Bucuresti-Magurele, Romania
c Geological Institute, University of Karlsruhe, Hertzstr. 16, D-76187 Karlsruhe, Germanyd Faculty of Geology and Geophysics, University of Bucharest, 6, Traian Vuia Street, sector 1, RO-70139 Bucuresti, Romania
Received 11 May 2005; received in revised form 17 October 2006; accepted 19 October 2006Available online 11 December 2006
Abstract
In order to study the lithospheric structure in Romania a 450 km longWNW–ESE trending seismic refraction project was carried outin August/September 2001. It runs from the Transylvanian Basin across the East Carpathian Orogen and the Vrancea seismic region tothe foreland areas with the very deep Neogene Focsani Basin and the North Dobrogea Orogen on the Black Sea. A total of ten shots withcharge sizes 300–1500 kg were recorded by over 700 geophones. The data quality of the experiment was variable, depending primarilyon charge size but also on local geological conditions. The data interpretation indicates amulti-layered structurewith variable thicknessesand velocities. The sedimentary stack comprises up to 7 layers with seismic velocities of 2.0–5.9 km/s. It reaches a maximum thicknessof about 22 km within the Focsani Basin area. The sedimentary succession is composed of (1) the Carpathian nappe pile, (2) the post-collisional Neogene Transylvanian Basin, which covers the local Late Cretaceous to Paleogene Tarnava Basin, (3) the Neogene FocsaniBasin in the foredeep area, which covers autochthonous Mesozoic and Palaeozoic sedimentary rocks as well as a probably Permo-Triassic graben structure of the Moesian Platform, and (4) the Palaeozoic and Mesozoic rocks of the North Dobrogea Orogen. Theunderlying crystalline crust shows considerable thickness variations in total as well as in its individual subdivisions, which correlate wellwith the Tisza-Dacia, Moesian and North Dobrogea crustal blocks. The lateral velocity structure of these blocks along the seismic lineremains constant with about 6.0 km/s along the basement top and 7.0 km/s above theMoho. The Tisza-Dacia block is about 33 to 37 kmthick and shows low velocity zones in its uppermost 15 km, which are presumably due to basement thrusts imbricated with sedimentarysuccessions related to the Carpathian Orogen. The crystalline crust of Moesia does not exceed 25 km and is covered by up to 22 km ofsedimentary rocks. The North Dobrogea crust reaches a thickness of about 44 km and is probably composed of thick Eastern Europeancrust overthrusted by a thin 1–2 km thick wedge of the North Dobrogea Orogen.© 2006 Elsevier B.V. All rights reserved.
Keywords: Seismic refraction; Crustal velocity structure; Vrancea zone; Eastern Carpathians; Moesian Platform; Transylvanian Basin
⁎ Corresponding author. Tel.: +49 721 6082139; fax: +49 7216082138.
E-mail address: [email protected](W. Fielitz).1 Now at Geophysics Section, Dublin Institute for Advanced
Studies, Ireland.
0040-1951/$ - see front matter © 2006 Elsevier B.V. All rights reserved.doi:10.1016/j.tecto.2006.10.005
1. Introduction
This study focuses on a crustal transect in Romaniawith a complex geological history. It crosses from W toE the Transylvanian Basin, the Carpathian Orogen and
2 F. Hauser et al. / Tectonophysics 430 (2007) 1–25
the Carpathian Foredeep with the exceptionally deepFocsani Basin, as well as the stable Moesian Platformand the North Dobrogea Orogen in the foreland (Fig. 1).Several plate or microplate boundaries (Tisza-Dacia inthe W, Moesia in the centre and North Dobrogea in theE) are intersected, which are largely covered by thenappes of the Carpathian Orogen or the Neogenesedimentary basins. Whereas these plates were conso-lidated during complex pre-Mesozoic deformations, theCarpathian Orogen and the younger sedimentary basinsare the result of plate convergence during Mesozoic andNeogene times.
The youngest part of the orogen and basins inRomania show still ongoing neotectonic activity. This ismanifested by near-surface crustal deformation resultingin a very pronounced geomorphology (Fielitz andSeghedi, 2005; Necea et al., 2005), subsidence in theFocsani foreland basin (Tarapoanca et al., 2003;Matenco et al., 2003) and a strong seismicity atintermediate depths, which is concentrated in theVrancea area of the southeastern Carpathian bend(Fig. 1; Fuchs et al., 1979; Oncescu et al., 1998).While the shallow seismic activity scatters widely andhas moderate magnitudes (Mwb5.6), the epicentralregion of the intermediate depth seismicity is confinedto an area of only about 40×80 km2 (Oncescu et al.,1998). The epicenters of these earthquakes lie between60 and 180 km depth within an almost verticallyelongated narrow zone and frequently have largemagnitudes (Mw=6.9–7.4). Several major earthquakesoccurred there in the last century (1940, 1977, 1986 and1990) causing many fatalities and an enormouseconomical damage. In the 1977 earthquake alone,1570 people died and more than 11,300 were injured.
In order to study this seismically high-risk area a jointGerman–Romanian research program was initiated bythe Collaborative Research Center 461 (CRC 461)“Strong Earthquakes — a Challenge for Geosciencesand Civil Engineering” at the University of Karlsruhe(Germany) and the Romanian Group for Vrancea StrongEarthquakes (RGVE) at the Romanian Academy inBucharest (Wenzel, 1997; Wenzel et al., 1998a). Thejoint geoscientific and civil engineering researchactivities of this project seek to better understand thetectonic processes responsible for the strong intermedi-ate-depth seismicity, and to reduce the risk by applyingappropriate techniques from civil engineering (e.g.Wenzel et al., 1998a).
Two major active-source seismic refraction experi-ments were carried out in 1999 and 2001 as acontribution to this research program (Hauser et al.,2001, 2002). They were designed to study the crustal and
uppermost mantle structure to a depth of about 70 kmunderneath the Vrancea epicentral region and werejointly performed by the Geophysical and GeologicalInstitutes of the University of Karlsruhe (Germany), theGeoForschungsZentrum in Potsdam (Germany), theNational Institute for Earth Physics in Bucharest(Romania) and the University of Bucharest (Romania).
The obtained crustal velocity models provide addi-tional important a priori information for passivetomographic studies and help to calibrate the relativevelocity variations which are obtained by teleseismictomography (Wenzel et al., 1998b; Martin et al., 2005,2006). The 1999 seismic refraction experiment waspublished by Hauser et al. (2001). In this paper wepresent the results of the VRANCEA2001 seismicrefraction project, which covers the 450 km longsegment from the town of Aiud in the TransylvanianBasin to the town of Tulcea near the Black Sea (Fig. 1).
2. Geological and tectonic setting
The Eastern Carpathians are part of the Alpine–Carpathian orogenic belt which resulted from theconvergence and collision of several microplates withthe Eurasian plate during the closure of the TethysOcean (Sandulescu, 1984; Stampfli et al., 1998;Neugebauer et al., 2001). In this context several tectonicunits have been accreted in the Carpathian area (Fig. 1).The External (Flysch) Carpathians or Moldavides in theeast originated along the European (Moesian and EastEuropean) margin (Sandulescu, 1988; see Fig. 1 forlocation). Their convergence and the outline of thepresent day geometry occurred mainly during theMiocene (20–11 Ma) and climaxed in the early LateMiocene (11–12 Ma, Sarmatian; Sandulescu, 1988;Matenco and Bertotti, 2000; Matenco et al., 2003).However, the Internal Carpathians further west (i.e.Dacides and Transylvanides of Sandulescu, 1988; seeFig. 1), which are part of the Tisza-Dacia microplate(Csontos, 1995), converged already in mid-Cretaceoustime (Aptian/Albian), were then partially covered bysmaller basins with mid-Cretaceous (Aptian/Albian) toPalaeogene sedimentary strata and were finally trans-ported to their present position during the Sarmatianaccretion of the Moldavides against Europe (Sandu-lescu, 1988; Royden, 1988; Matenco and Bertotti,2000). Their sediments accumulated on a thinnedcontinental (Sandulescu, 1988) or an oceanic domain(Csontos, 1995; Stampfli et al., 1998; Neugebauer et al.,2001) of Jurassic to Early Cretaceous age.
The geodynamic setting of the Sarmatian deforma-tion is inadequately understood, but it appears that
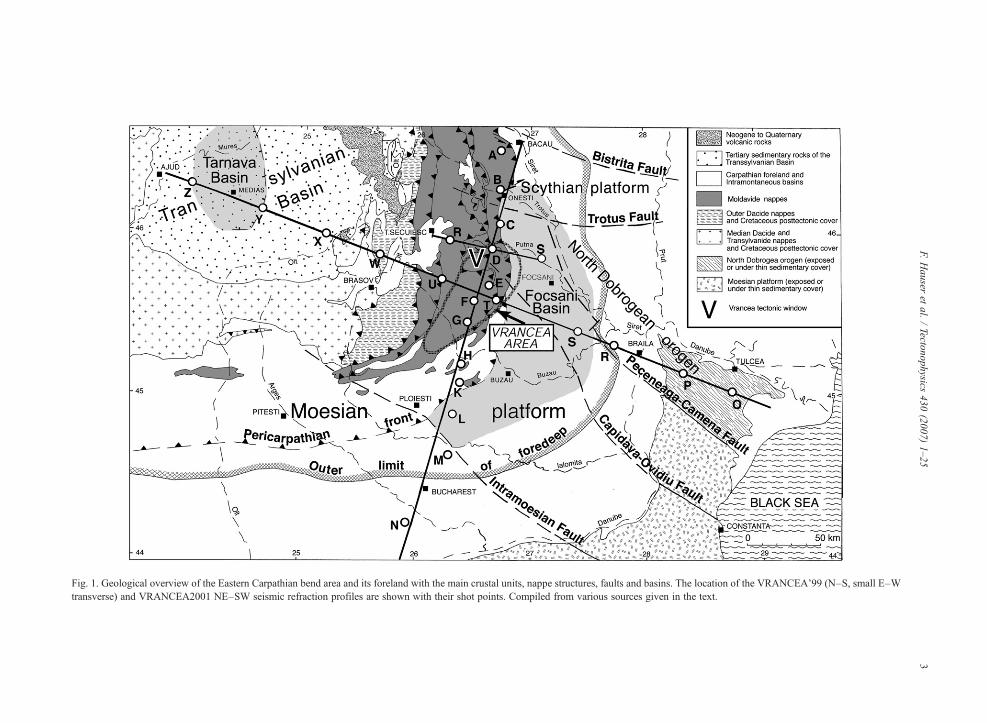
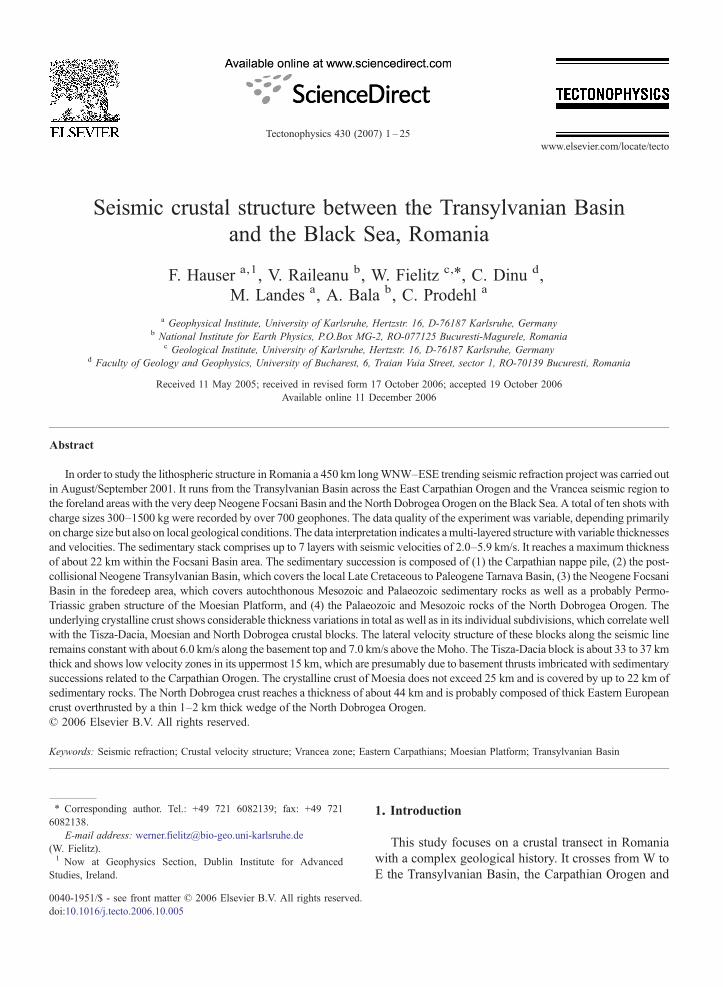
Fig. 1. Geological overview of the Eastern Carpathian bend area and its foreland with the main crustal units, nappe structures, faults and basins. The location of the VRANCEA'99 (N–S, small E–Wtransverse) and VRANCEA2001 NE–SW seismic refraction profiles are shown with their shot points. Compiled from various sources given in the text.
3F.
Hauser
etal.
/Tectonophysics
430(2007)
1–25
4 F. Hauser et al. / Tectonophysics 430 (2007) 1–25
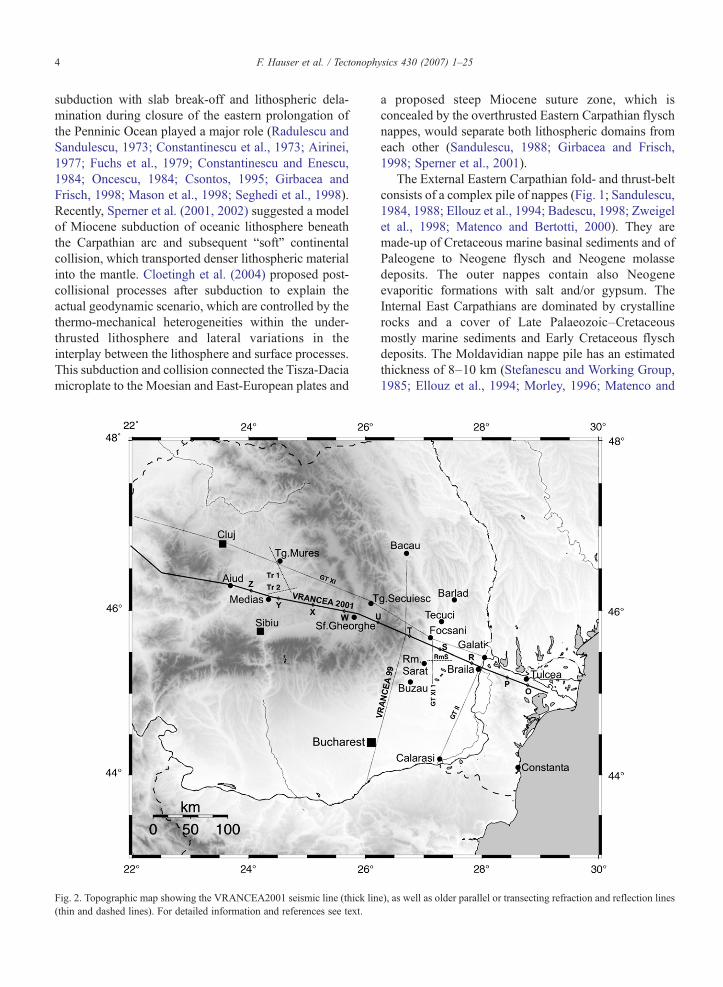
subduction with slab break-off and lithospheric dela-mination during closure of the eastern prolongation ofthe Penninic Ocean played a major role (Radulescu andSandulescu, 1973; Constantinescu et al., 1973; Airinei,1977; Fuchs et al., 1979; Constantinescu and Enescu,1984; Oncescu, 1984; Csontos, 1995; Girbacea andFrisch, 1998; Mason et al., 1998; Seghedi et al., 1998).Recently, Sperner et al. (2001, 2002) suggested a modelof Miocene subduction of oceanic lithosphere beneaththe Carpathian arc and subsequent “soft” continentalcollision, which transported denser lithospheric materialinto the mantle. Cloetingh et al. (2004) proposed post-collisional processes after subduction to explain theactual geodynamic scenario, which are controlled by thethermo-mechanical heterogeneities within the under-thrusted lithosphere and lateral variations in theinterplay between the lithosphere and surface processes.This subduction and collision connected the Tisza-Daciamicroplate to the Moesian and East-European plates and
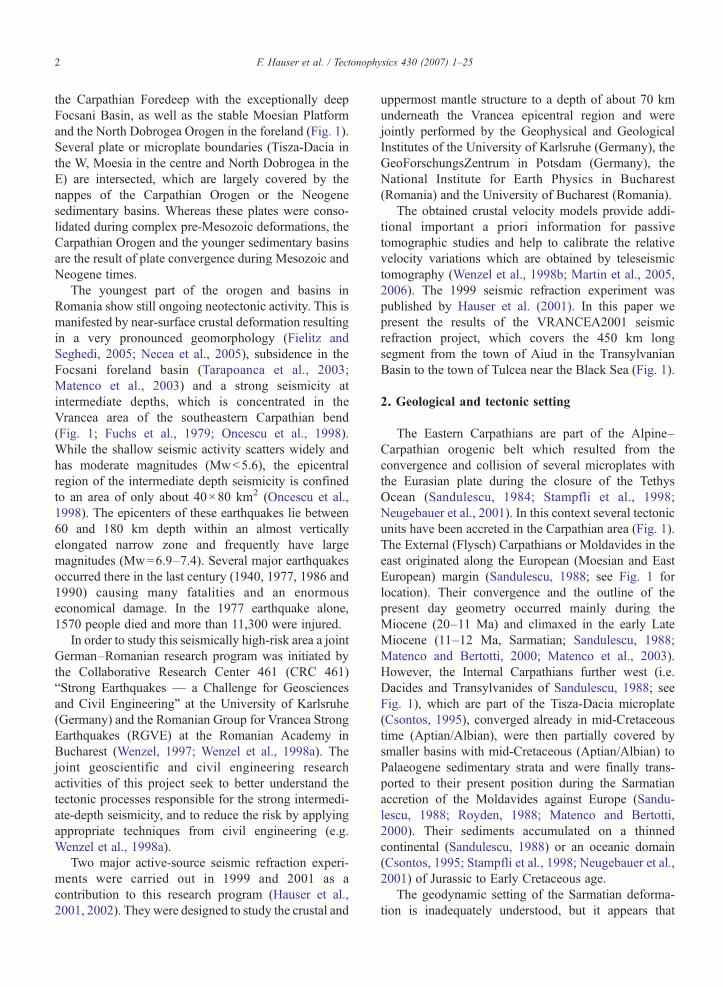
Fig. 2. Topographic map showing the VRANCEA2001 seismic line (thick lin(thin and dashed lines). For detailed information and references see text.
a proposed steep Miocene suture zone, which isconcealed by the overthrusted Eastern Carpathian flyschnappes, would separate both lithospheric domains fromeach other (Sandulescu, 1988; Girbacea and Frisch,1998; Sperner et al., 2001).
The External Eastern Carpathian fold- and thrust-beltconsists of a complex pile of nappes (Fig. 1; Sandulescu,1984, 1988; Ellouz et al., 1994; Badescu, 1998; Zweigelet al., 1998; Matenco and Bertotti, 2000). They aremade-up of Cretaceous marine basinal sediments and ofPaleogene to Neogene flysch and Neogene molassedeposits. The outer nappes contain also Neogeneevaporitic formations with salt and/or gypsum. TheInternal East Carpathians are dominated by crystallinerocks and a cover of Late Palaeozoic–Cretaceousmostly marine sediments and Early Cretaceous flyschdeposits. The Moldavidian nappe pile has an estimatedthickness of 8–10 km (Stefanescu and Working Group,1985; Ellouz et al., 1994; Morley, 1996; Matenco and
e), as well as older parallel or transecting refraction and reflection lines
5F. Hauser et al. / Tectonophysics 430 (2007) 1–25
Bertotti, 2000). This thickness is constrained by surfacegeology, seismic reflection and borehole data, mainlyfrom oil exploration, but for the inner nappes thick-nesses are only estimated through balanced cross-sections. Deeper structures are fairly unknown andeven the International Geotraverse XI (Figs. 2 and 3),which crossed the Carpathians between Focsani andTargu Secuiesc parallel to the VRANCEA2001 line,gave only some vague indications (Radulescu et al.,1976). Magnetotelluric data from Stanica and Stanica(1998) indicate a depth of 8 km for the base of theMoldavidian nappes and a depth of about 14–16 km forthe basement in the same area. Below the more internalparts of the East Carpathians the magnetotelluric datashow the crystalline basement at 16–18 km and north ofthe town of Focsani at approximately 10 km depth. Thecrustal thickness reaches 50 km in both areas.
The Carpathian foreland is underlain by Precambriancrust with a relatively undeformed Palaeozoic–Mesozoicautochthonous platform cover and by deformed rocks ofthe Triassic–Jurassic North Dobrogea Orogen (Fig. 1;Sandulescu, 1984; Visarion et al., 1988; Tari et al., 1997;Seghedi, 1998; Matenco et al., 2003). The crystallinebasement of the Moesian Platform is made-up of meta-morphic and intrusive magmatic rocks, which sometimeshave a weak acoustic contrast to their older sedimentarycover (Raileanu et al., 1994). Near the orogenic front of theCarpathians the platform sediments are partly covered bythe foredeep sediments, which dip slightly towards thecentral part of the foredeep (e.g. Tarapoanca et al., 2003).
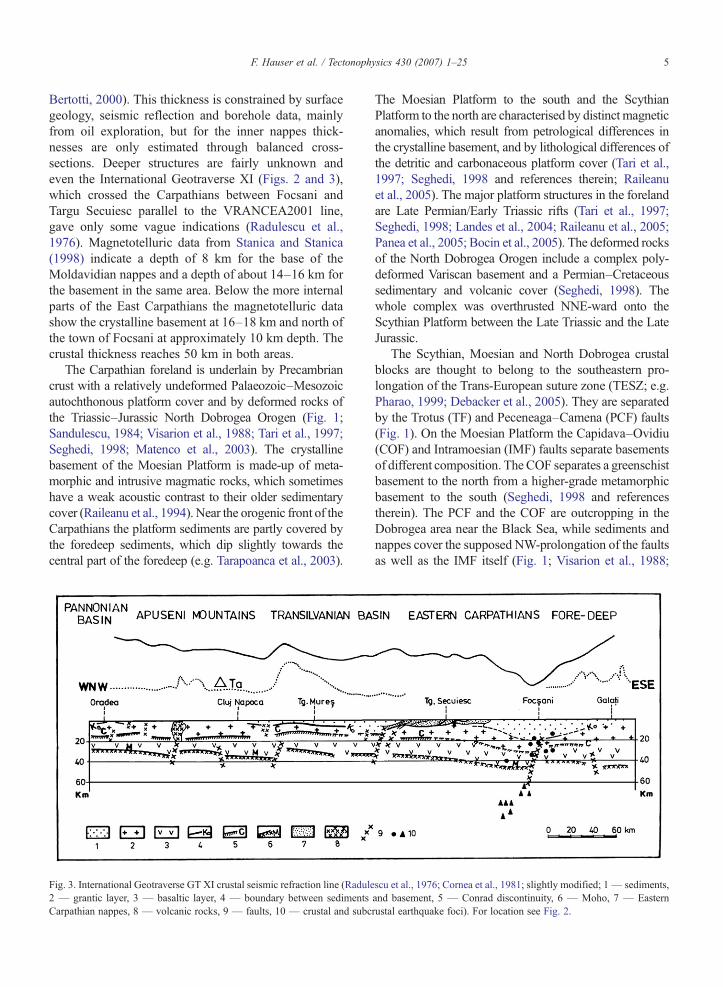
Fig. 3. International Geotraverse GT XI crustal seismic refraction line (Radule2 — grantic layer, 3 — basaltic layer, 4 — boundary between sedimentsCarpathian nappes, 8 — volcanic rocks, 9 — faults, 10 — crustal and subc
The Moesian Platform to the south and the ScythianPlatform to the north are characterised by distinct magneticanomalies, which result from petrological differences inthe crystalline basement, and by lithological differences ofthe detritic and carbonaceous platform cover (Tari et al.,1997; Seghedi, 1998 and references therein; Raileanuet al., 2005). The major platform structures in the forelandare Late Permian/Early Triassic rifts (Tari et al., 1997;Seghedi, 1998; Landes et al., 2004; Raileanu et al., 2005;Panea et al., 2005; Bocin et al., 2005). The deformed rocksof the North Dobrogea Orogen include a complex poly-deformed Variscan basement and a Permian–Cretaceoussedimentary and volcanic cover (Seghedi, 1998). Thewhole complex was overthrusted NNE-ward onto theScythian Platform between the Late Triassic and the LateJurassic.
The Scythian, Moesian and North Dobrogea crustalblocks are thought to belong to the southeastern pro-longation of the Trans-European suture zone (TESZ; e.g.Pharao, 1999; Debacker et al., 2005). They are separatedby the Trotus (TF) and Peceneaga–Camena (PCF) faults(Fig. 1). On the Moesian Platform the Capidava–Ovidiu(COF) and Intramoesian (IMF) faults separate basementsof different composition. The COF separates a greenschistbasement to the north from a higher-grade metamorphicbasement to the south (Seghedi, 1998 and referencestherein). The PCF and the COF are outcropping in theDobrogea area near the Black Sea, while sediments andnappes cover the supposed NW-prolongation of the faultsas well as the IMF itself (Fig. 1; Visarion et al., 1988;
scu et al., 1976; Cornea et al., 1981; slightly modified; 1— sediments,and basement, 5 — Conrad discontinuity, 6 — Moho, 7 — Easternrustal earthquake foci). For location see Fig. 2.
6 F. Hauser et al. / Tectonophysics 430 (2007) 1–25
Polonic, 1996; Ellouz et al., 1994; Seghedi, 1998). In theautochthonous and overthrusted areas of the MoesianPlatform the seismic refraction line is expected to crosstwo of these major crustal faults, the Capidava–OvidiuFault (COF) and the Peceneaga–Camena Fault (PC).Recent field studies show, that the Trotus/Peceneaga–Fault system is a particularly active structure with apronounced tectonic geomorphology and local offsets of200 m, which were achieved during the Quaternary(Matenco et al., 2003; Tarapoanca et al., 2003). Basedmainly on reflection seismic data, these crustal faults arethought to extend down to the Moho discontinuity andpossibly even deeper (e.g. Visarion et al., 1988;Radulescu and Diaconescu, 1998).
Post-collisional (i.e. post-Sarmatian) sediments overliestructures of the Carpathian Orogen and its foreland butare also deformed by younger structures. The mostimportant of these structures is the Focsani Basin (Fig. 1).The sediments of the foredeep and the Focsani depressionreach up to 8 km for the last 14Ma (Matenco et al., 2003;Tarapoanca et al., 2003). Late Pliocene to EarlyQuaternary contractional deformation in the forelandreaches as far as the Pericarpathian Front (Hippolyte andSandulescu, 1996; Hippolyte et al., 1999; Matenco andBertotti, 2000; Fig. 1). Along the western flank of theFocsani Basin an eastward dipping monocline developed
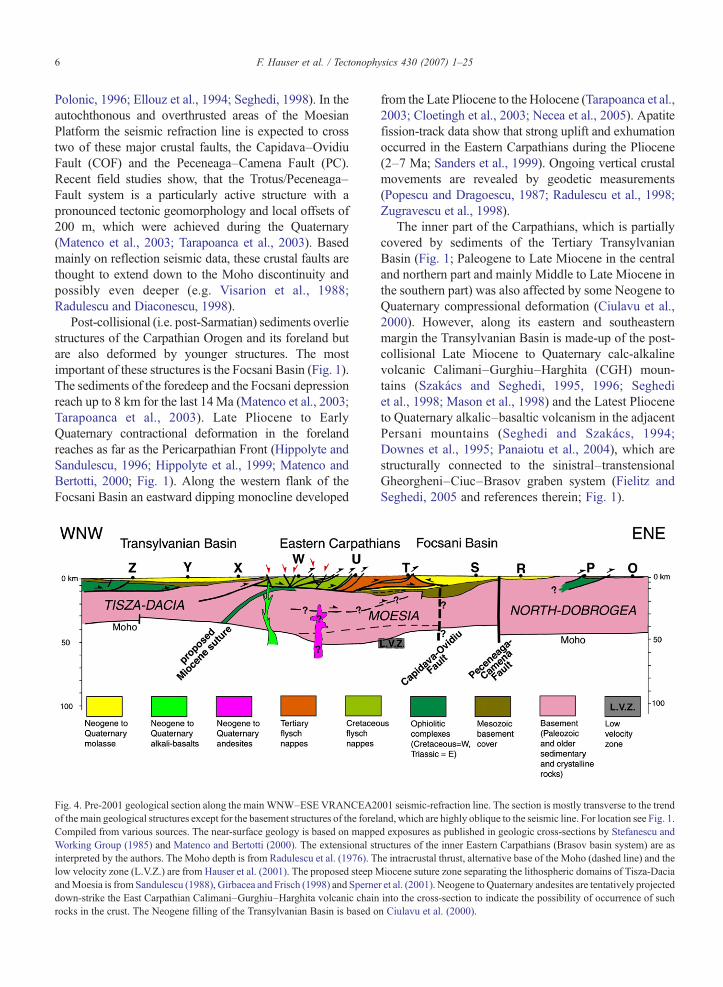
Fig. 4. Pre-2001 geological section along the main WNW–ESE VRANCEA2of the main geological structures except for the basement structures of the forelCompiled from various sources. The near-surface geology is based on mappeWorking Group (1985) and Matenco and Bertotti (2000). The extensional stinterpreted by the authors. The Moho depth is from Radulescu et al. (1976). Tlow velocity zone (L.V.Z.) are from Hauser et al. (2001). The proposed steep MandMoesia is fromSandulescu (1988), Girbacea and Frisch (1998) and Spernedown-strike the East Carpathian Calimani–Gurghiu–Harghita volcanic chainrocks in the crust. The Neogene filling of the Transylvanian Basin is based o
from the Late Pliocene to the Holocene (Tarapoanca et al.,2003; Cloetingh et al., 2003; Necea et al., 2005). Apatitefission-track data show that strong uplift and exhumationoccurred in the Eastern Carpathians during the Pliocene(2–7 Ma; Sanders et al., 1999). Ongoing vertical crustalmovements are revealed by geodetic measurements(Popescu and Dragoescu, 1987; Radulescu et al., 1998;Zugravescu et al., 1998).
The inner part of the Carpathians, which is partiallycovered by sediments of the Tertiary TransylvanianBasin (Fig. 1; Paleogene to Late Miocene in the centraland northern part and mainly Middle to Late Miocene inthe southern part) was also affected by some Neogene toQuaternary compressional deformation (Ciulavu et al.,2000). However, along its eastern and southeasternmargin the Transylvanian Basin is made-up of the post-collisional Late Miocene to Quaternary calc-alkalinevolcanic Calimani–Gurghiu–Harghita (CGH) moun-tains (Szakács and Seghedi, 1995, 1996; Seghediet al., 1998; Mason et al., 1998) and the Latest Plioceneto Quaternary alkalic–basaltic volcanism in the adjacentPersani mountains (Seghedi and Szakács, 1994;Downes et al., 1995; Panaiotu et al., 2004), which arestructurally connected to the sinistral–transtensionalGheorgheni–Ciuc–Brasov graben system (Fielitz andSeghedi, 2005 and references therein; Fig. 1).
001 seismic-refraction line. The section is mostly transverse to the trendand, which are highly oblique to the seismic line. For location see Fig. 1.d exposures as published in geologic cross-sections by Stefanescu andructures of the inner Eastern Carpathians (Brasov basin system) are ashe intracrustal thrust, alternative base of the Moho (dashed line) and theiocene suture zone separating the lithospheric domains of Tisza-Dacia
r et al. (2001). Neogene to Quaternary andesites are tentatively projectedinto the cross-section to indicate the possibility of occurrence of suchn Ciulavu et al. (2000).
7F. Hauser et al. / Tectonophysics 430 (2007) 1–25
Using published as well as unpublished geologicaldata, a crustal cross-section for the VRANCEA2001refraction linewas compiled (Fig. 4). The section ismostlytransverse to the trend of the main geological structuresexcept for the basement structures of the foreland, whichare highly oblique to the seismic line. The near-surfacegeology is based on mapped exposures as published ingeological cross-sections by Stefanescu and WorkingGroup (1985) and by Matenco and Bertotti (2000). Theextensional structures of the inner Eastern Carpathians(Brasov basin system) are as interpreted by the authors.The Moho depth is from Radulescu et al. (1976). Theintracrustal thrust, alternative base of the Moho (dashedline) and the low velocity zone (L.V.Z.) are from Hauseret al. (2001). The proposed steep Miocene suture zoneseparating the lithospheric domains of Tisza-Dacia andMoesia is from Sandulescu (1988), Girbacea and Frisch(1998) and Sperner et al. (2001). Neogene to Quaternaryandesites are tentatively projected down-strike the EastCarpathian Calimani–Gurghiu–Harghita volcanic chaininto the cross-section to indicate the possibility ofoccurrence of such rocks in the crust. The Neogene fillingof the Transylvanian Basin is based on Ciulavu et al.(2000). This cross-section,which is simplified and adaptedto the scale and resolution of the seismic line, forms thebase for a first geological interpretation of the velocity-depth model obtained from the seismic experiment aspresented in this paper. It can later be integrated into acomplex larger scale geodynamic model using additionalgeological and geophysical (e.g. mantle tomography) data.This is however not the focus of this paper.
3. Earlier seismic investigations
Parts of the study area have been investigated bydifferent geophysical methods during the last decades ofthe past century. Besides gravity, magnetic, magneto-telluric and heat flow measurements, seismic reflectionand refraction data played an important role. Here wesummarize the results, which are relevant for theVRANCEA2001 seismic refraction project.
On the Moesian Platform and in the Focsani andTransylvanian basin areas the VRANCEA2001 seismicline is either intersected by or sub-parallel to nearby seismicreflection profiles recorded for oil and gas exploration.These seismic lines mainly mapped the structure of theNeogene cover and to a lesser extent the pre-Neogenesedimentary succession and the crystalline basement.
A representative deep seismic reflection line acrossthe Moesian Platform extends from Ramnicu Sarat some40 km towards the east (RmS in Fig. 2). It shows a rapidthickening of the Neogene sediments from about 8 km at
the eastern end of the line to 12 km near Ramnicu Sarat(Raileanu and Diaconescu, 1998). The interpretation ofdeeper-crustal features defines the crystalline basementat 16 km, an intra-crustal boundary at 32 km and theMoho at about 42 km depth (Raileanu and Diaconescu,1998).
Within the Transylvanian Basin two deep reflectionlines cross the basin from NNW to SSE and fromW to E,respectively and both lines end near the VRANCEA2001profile (Tr1 and Tr2 in Fig. 2; Raileanu and Diaconescu,1998; Raileanu, 1998). The sedimentary sequence iscomposed of a pre-Cretaceous succession, a post-tectonicLate Cretaceous to Palaeogene cover and a Neogenesuccession with a total thickness of 9–10 km. Thecrystalline crust is ‘transparent’ and no significantreflections are observed except for some short, dippingsignals with weak coherency and most probably ofdiffractive nature. Sometimes, and mainly within thecentral part of the basin, the basement is marked byreflections. Structures are observed between 9 and 10 stwo way time (TWT) or approximately 27–30 km depthand 12–14 s TWT or approximately 36–42 km depth.These reflections are interpreted as a transition zone fromcrust to mantle, between approximately 27 km and 42 km(Raileanu and Diaconescu, 1998; Raileanu, 1998).
Based on seismic reflection and well data, Polonic(1998) produced a crystalline basement map ofRomania. This map predicts a dramatic deepening ofthe basement along the VRANCEA2001 seismic line,from 1–3 km in the Dobrogea area to 15 km in theFocsani Basin, 8–10 km in the Carpathian Orogen areaand 5–8 km in the Transylvanian Basin.
Previous crustal refraction lines recorded within theNorth Dobrogea (Pompilian et al., 1993), the FocsaniBasin (Enescu et al., 1972), the Moesian Platform and theFocsani and Transylvanian basins (Radulescu et al., 1976;Cornea et al., 1981) give further information on the deepcrustal structures.Within theNorthDobrogea a 6 km thicksedimentary cover is observed and the Moho reaches adepth of about 42–43 km (Pompilian et al., 1993). Thecrustal refraction line GT XI 1 (Fig. 2), recorded in the1970's from Focsani southwards over a length of 60–70 km, points out two sedimentary boundaries at 5 km and10 km depth, respectively, a basement at approximately17–18 km (K0 boundary), and an intra-crustal boundary(K1) at 26 km (Enescu et al., 1972).
Another crustal seismic refraction line GT II (Fig. 2)runs from the territory of Ukraine and the MoldavianRepublic through Galati with a SSW direction toCalarasi near the Bulgarian border. It crosses thePeceneaga–Camena Fault south of Braila (Fig. 1),where a large offset at all crustal levels is recorded. The
8 F. Hauser et al. / Tectonophysics 430 (2007) 1–25
interface K1 deepens from about 15 km south of thefault to about 21 km to the north of it and the Mohodeepens from 40 km to 48 km (Radulescu et al., 1976;Cornea et al., 1981).
The most important crustal seismic refraction line GTXI (Figs. 2 and 3) was recorded in the first half of the1970's (Radulescu et al., 1976). It runs nearly parallel tothe VRANCEA2001 profile at a distance of about 20 kmnorth of Braila and of about 50 km north of Medias. Itshows the following main features. In the Galati area thecrust has a total thickness of 42–43 km with an uppercrustal thickness of 20–22 km. In the Focsani Basin thesedimentary cover reaches a depth of 20 km. A crustalfault within the centre of the basin separates, atbasement level, an uplifted block to the east from asubsided one to the west. An intra-crustal boundary (K1)that delimits the upper and lower crust is located at32 km depth to the west and approximately 27 km to theeast of the fault. The Moho is located at 47 km to thewest and at approximately 42 km to the east of the fault.Further to the west the crustal boundaries are shallower.In the center of the Eastern Carpathians the K0-boundarylies at 7 km, K1 at 20 km and the Moho at 40 km depth.In the Transylvanian Basin K0 is at 3 km, K1 at 12–18 km and the Moho at 30 km (Radulescu et al., 1976).
Based on data collected before 1999 Radulescu(1988) and Enescu et al. (1992) produced contour-mapsof the two major boundaries (Conrad and Mohodiscontinuities) in the crust. Along the VRANCEA2001
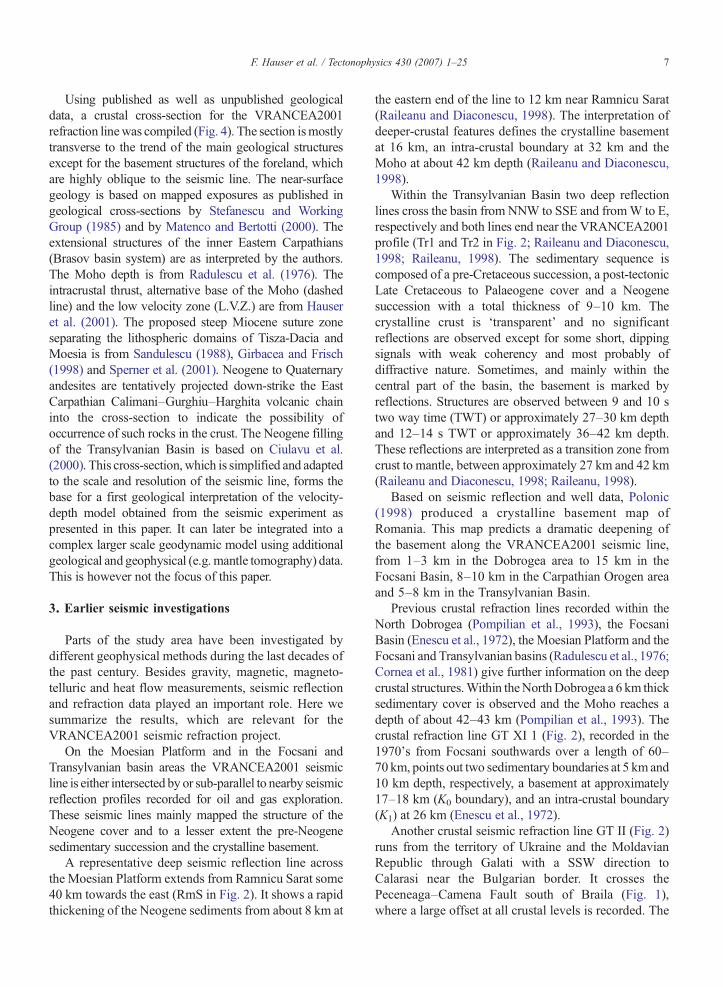
Fig. 5. Trace normalised P-wave record section from shot point O with 6 km/sare superimposed on the data. Travel times are labelled as follows: P1–P5 = fidiving waves through the upper and middle crust, respectively; Pi1P = reflectthe top of the lower crust; P6P and P8P = reflected waves from the base of thmantle boundary (Moho); Pn = diving wave through the upper mantle; Diff
line depth values of 22 km and 45 km are predicted forthe Dobrogea area, 26–28 km and 42 km for the FocsaniBasin, 24 km and 52 km for the Carpathian Orogen, and14 km and 34 km for the Transylvanian Basin. A cross-section parallel to the VRANCEA2001 line with up toscale projections of the Geotraverse XI, RmS and Tr1lines is shown in Fig. 5 of Knapp et al. (2005). For theGeotraverse XI see also Fig. 3.
The most recent refraction seismic line is theVRANCEA'99 line, the first seismic line of the presentjoint research project within the German–Romanianprogram mentioned above. This VRANCEA'99 lineintersects the VRANCEA2001 profile in the EastCarpathian mountain area at the centre of the seismo-genic “Vrancea area” (Figs. 1 and 4). Its interpretationshows a multi-layered structure (Hauser et al., 2001) andat the intersecting point it depicts 3 sedimentary layers,an upper and a lower crustal layer. The base of thesedimentary succession is at 11 km, the intra-crustalboundary at 29–30 km and the Moho at about 41 kmdepth. The P-wave velocities for the sedimentarysuccessions are 3.90–5.70 km/s, for the crystallinecrust 5.90–7.00 km/s and for the top of the upper mantle7.90 km/s.
4. The VRANCEA2001 seismic experiment
In August/September 2001 a large seismic experi-ment, called VRANCEA2001, was performed. After the
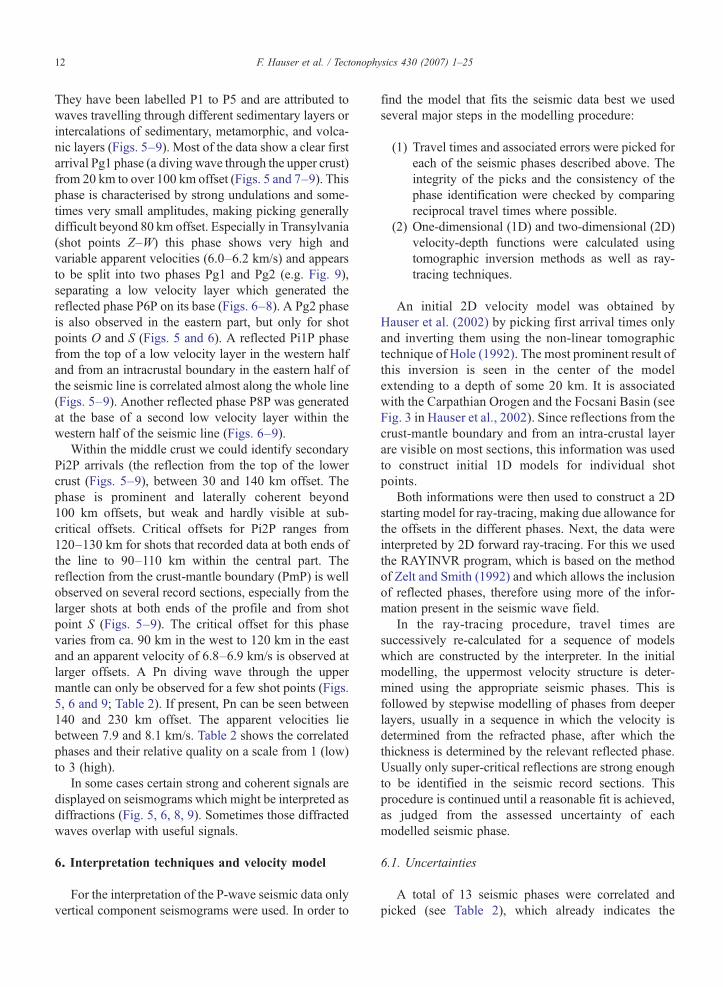
reduced time. The calculated travel times from the Vp model in Fig. 11rst arrival phases refracted within the sedimentary cover; Pg1 and Pg2 =ed waves from the top of the middle crust; Pi2P = reflected waves frome low velocity layers L6 and L8; PmP = reflected wave from the crust-. = supposedly diffracted waves.
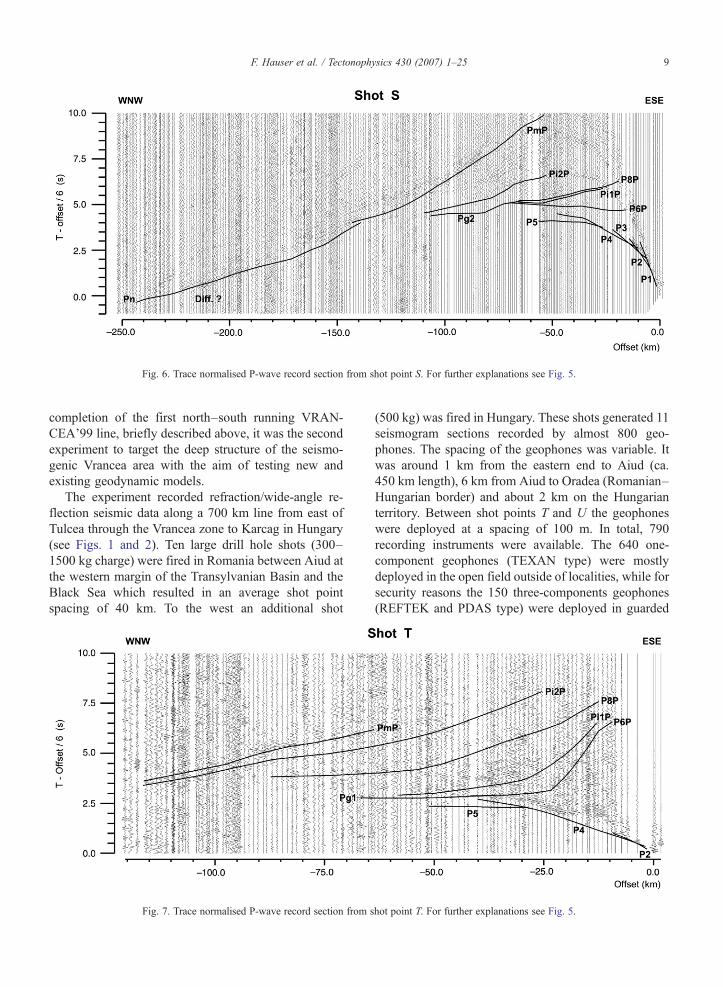
Fig. 6. Trace normalised P-wave record section from shot point S. For further explanations see Fig. 5.
9F. Hauser et al. / Tectonophysics 430 (2007) 1–25
completion of the first north–south running VRAN-CEA'99 line, briefly described above, it was the secondexperiment to target the deep structure of the seismo-genic Vrancea area with the aim of testing new andexisting geodynamic models.
The experiment recorded refraction/wide-angle re-flection seismic data along a 700 km line from east ofTulcea through the Vrancea zone to Karcag in Hungary(see Figs. 1 and 2). Ten large drill hole shots (300–1500 kg charge) were fired in Romania between Aiud atthe western margin of the Transylvanian Basin and theBlack Sea which resulted in an average shot pointspacing of 40 km. To the west an additional shot
Fig. 7. Trace normalised P-wave record section from s
(500 kg) was fired in Hungary. These shots generated 11seismogram sections recorded by almost 800 geo-phones. The spacing of the geophones was variable. Itwas around 1 km from the eastern end to Aiud (ca.450 km length), 6 km from Aiud to Oradea (Romanian–Hungarian border) and about 2 km on the Hungarianterritory. Between shot points T and U the geophoneswere deployed at a spacing of 100 m. In total, 790recording instruments were available. The 640 one-component geophones (TEXAN type) were mostlydeployed in the open field outside of localities, while forsecurity reasons the 150 three-components geophones(REFTEK and PDAS type) were deployed in guarded
hot point T. For further explanations see Fig. 5.
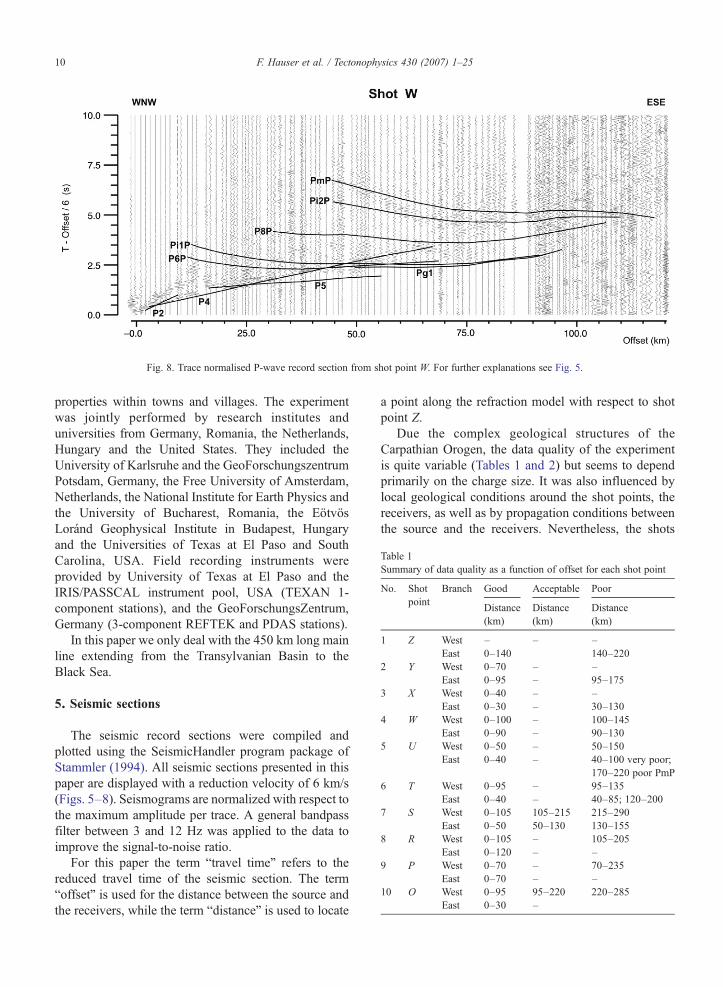
Fig. 8. Trace normalised P-wave record section from shot point W. For further explanations see Fig. 5.
Table 1Summary of data quality as a function of offset for each shot point
No. Shotpoint
Branch Good Acceptable Poor
Distance(km)
Distance(km)
Distance(km)
1 Z West – – –East 0–140 140–220
2 Y West 0–70 – –East 0–95 – 95–175
3 X West 0–40 – –East 0–30 – 30–130
4 W West 0–100 – 100–145East 0–90 – 90–130
5 U West 0–50 – 50–150East 0–40 – 40–100 very poor;
170–220 poor PmP6 T West 0–95 – 95–135
East 0–40 – 40–85; 120–2007 S West 0–105 105–215 215–290
East 0–50 50–130 130–1558 R West 0–105 – 105–205
East 0–120 – –9 P West 0–70 – 70–235
East 0–70 – –10 O West 0–95 95–220 220–285
East 0–30 –
10 F. Hauser et al. / Tectonophysics 430 (2007) 1–25
properties within towns and villages. The experimentwas jointly performed by research institutes anduniversities from Germany, Romania, the Netherlands,Hungary and the United States. They included theUniversity of Karlsruhe and the GeoForschungszentrumPotsdam, Germany, the Free University of Amsterdam,Netherlands, the National Institute for Earth Physics andthe University of Bucharest, Romania, the EötvösLoránd Geophysical Institute in Budapest, Hungaryand the Universities of Texas at El Paso and SouthCarolina, USA. Field recording instruments wereprovided by University of Texas at El Paso and theIRIS/PASSCAL instrument pool, USA (TEXAN 1-component stations), and the GeoForschungsZentrum,Germany (3-component REFTEK and PDAS stations).
In this paper we only deal with the 450 km long mainline extending from the Transylvanian Basin to theBlack Sea.
5. Seismic sections
The seismic record sections were compiled andplotted using the SeismicHandler program package ofStammler (1994). All seismic sections presented in thispaper are displayed with a reduction velocity of 6 km/s(Figs. 5–8). Seismograms are normalized with respect tothe maximum amplitude per trace. A general bandpassfilter between 3 and 12 Hz was applied to the data toimprove the signal-to-noise ratio.
For this paper the term “travel time” refers to thereduced travel time of the seismic section. The term“offset” is used for the distance between the source andthe receivers, while the term “distance” is used to locate
a point along the refraction model with respect to shotpoint Z.
Due the complex geological structures of theCarpathian Orogen, the data quality of the experimentis quite variable (Tables 1 and 2) but seems to dependprimarily on the charge size. It was also influenced bylocal geological conditions around the shot points, thereceivers, as well as by propagation conditions betweenthe source and the receivers. Nevertheless, the shots
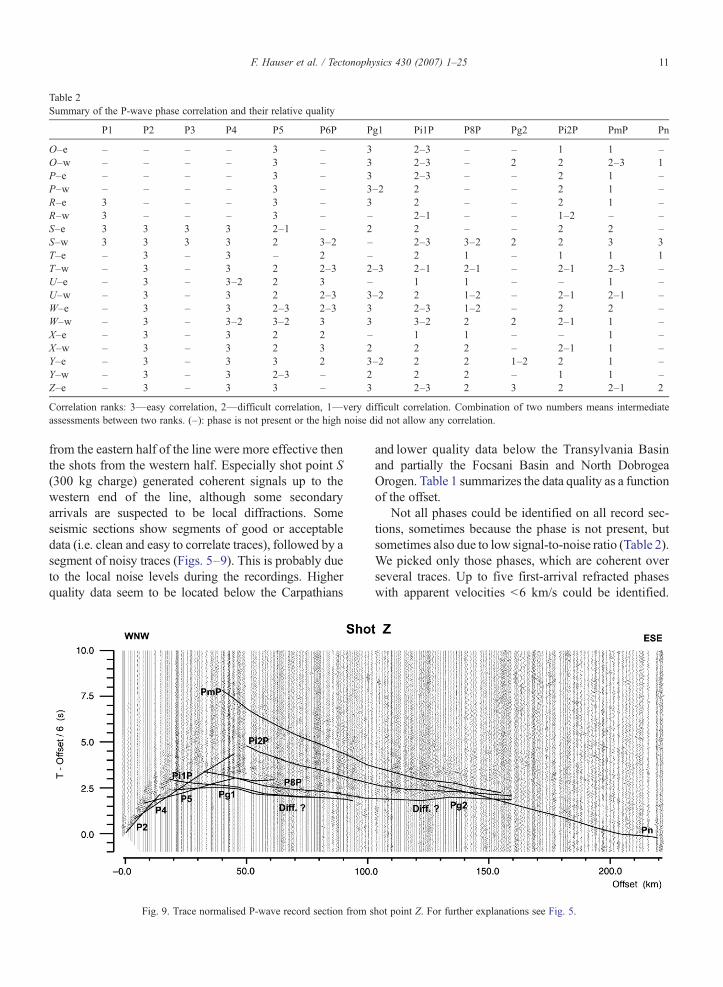
Table 2Summary of the P-wave phase correlation and their relative quality
P1 P2 P3 P4 P5 P6P Pg1 Pi1P P8P Pg2 Pi2P PmP Pn
O–e – – – – 3 – 3 2–3 – – 1 1 –O–w – – – – 3 – 3 2–3 – 2 2 2–3 1P–e – – – – 3 – 3 2–3 – – 2 1 –P–w – – – – 3 – 3–2 2 – – 2 1 –R–e 3 – – – 3 – 3 2 – – 2 1 –R–w 3 – – – 3 – – 2–1 – – 1–2 – –S–e 3 3 3 3 2–1 – 2 2 – – 2 2 –S–w 3 3 3 3 2 3–2 – 2–3 3–2 2 2 3 3T–e – 3 – 3 – 2 – 2 1 – 1 1 1T–w – 3 – 3 2 2–3 2–3 2–1 2–1 – 2–1 2–3 –U–e – 3 – 3–2 2 3 – 1 1 – – 1 –U–w – 3 – 3 2 2–3 3–2 2 1–2 – 2–1 2–1 –W–e – 3 – 3 2–3 2–3 3 2–3 1–2 – 2 2 –W–w – 3 – 3–2 3–2 3 3 3–2 2 2 2–1 1 –X–e – 3 – 3 2 2 – 1 1 – – 1 –X–w – 3 – 3 2 3 2 2 2 – 2–1 1 –Y–e – 3 – 3 3 2 3–2 2 2 1–2 2 1 –Y–w – 3 – 3 2–3 – 2 2 2 – 1 1 –Z–e – 3 – 3 3 – 3 2–3 2 3 2 2–1 2
Correlation ranks: 3—easy correlation, 2—difficult correlation, 1—very difficult correlation. Combination of two numbers means intermediateassessments between two ranks. (–): phase is not present or the high noise did not allow any correlation.
11F. Hauser et al. / Tectonophysics 430 (2007) 1–25
from the eastern half of the line were more effective thenthe shots from the western half. Especially shot point S(300 kg charge) generated coherent signals up to thewestern end of the line, although some secondaryarrivals are suspected to be local diffractions. Someseismic sections show segments of good or acceptabledata (i.e. clean and easy to correlate traces), followed by asegment of noisy traces (Figs. 5–9). This is probably dueto the local noise levels during the recordings. Higherquality data seem to be located below the Carpathians
Fig. 9. Trace normalised P-wave record section from s
and lower quality data below the Transylvania Basinand partially the Focsani Basin and North DobrogeaOrogen. Table 1 summarizes the data quality as a functionof the offset.
Not all phases could be identified on all record sec-tions, sometimes because the phase is not present, butsometimes also due to low signal-to-noise ratio (Table 2).We picked only those phases, which are coherent overseveral traces. Up to five first-arrival refracted phaseswith apparent velocities b6 km/s could be identified.
hot point Z. For further explanations see Fig. 5.
12 F. Hauser et al. / Tectonophysics 430 (2007) 1–25
They have been labelled P1 to P5 and are attributed towaves travelling through different sedimentary layers orintercalations of sedimentary, metamorphic, and volca-nic layers (Figs. 5–9). Most of the data show a clear firstarrival Pg1 phase (a diving wave through the upper crust)from 20 km to over 100 km offset (Figs. 5 and 7–9). Thisphase is characterised by strong undulations and some-times very small amplitudes, making picking generallydifficult beyond 80 km offset. Especially in Transylvania(shot points Z–W) this phase shows very high andvariable apparent velocities (6.0–6.2 km/s) and appearsto be split into two phases Pg1 and Pg2 (e.g. Fig. 9),separating a low velocity layer which generated thereflected phase P6P on its base (Figs. 6–8). A Pg2 phaseis also observed in the eastern part, but only for shotpoints O and S (Figs. 5 and 6). A reflected Pi1P phasefrom the top of a low velocity layer in the western halfand from an intracrustal boundary in the eastern half ofthe seismic line is correlated almost along the whole line(Figs. 5–9). Another reflected phase P8P was generatedat the base of a second low velocity layer within thewestern half of the seismic line (Figs. 6–9).
Within the middle crust we could identify secondaryPi2P arrivals (the reflection from the top of the lowercrust (Figs. 5–9), between 30 and 140 km offset. Thephase is prominent and laterally coherent beyond100 km offsets, but weak and hardly visible at sub-critical offsets. Critical offsets for Pi2P ranges from120–130 km for shots that recorded data at both ends ofthe line to 90–110 km within the central part. Thereflection from the crust-mantle boundary (PmP) is wellobserved on several record sections, especially from thelarger shots at both ends of the profile and from shotpoint S (Figs. 5–9). The critical offset for this phasevaries from ca. 90 km in the west to 120 km in the eastand an apparent velocity of 6.8–6.9 km/s is observed atlarger offsets. A Pn diving wave through the uppermantle can only be observed for a few shot points (Figs.5, 6 and 9; Table 2). If present, Pn can be seen between140 and 230 km offset. The apparent velocities liebetween 7.9 and 8.1 km/s. Table 2 shows the correlatedphases and their relative quality on a scale from 1 (low)to 3 (high).
In some cases certain strong and coherent signals aredisplayed on seismograms which might be interpreted asdiffractions (Fig. 5, 6, 8, 9). Sometimes those diffractedwaves overlap with useful signals.
6. Interpretation techniques and velocity model
For the interpretation of the P-wave seismic data onlyvertical component seismograms were used. In order to
find the model that fits the seismic data best we usedseveral major steps in the modelling procedure:
(1) Travel times and associated errors were picked foreach of the seismic phases described above. Theintegrity of the picks and the consistency of thephase identification were checked by comparingreciprocal travel times where possible.
(2) One-dimensional (1D) and two-dimensional (2D)velocity-depth functions were calculated usingtomographic inversion methods as well as ray-tracing techniques.
An initial 2D velocity model was obtained byHauser et al. (2002) by picking first arrival times onlyand inverting them using the non-linear tomographictechnique of Hole (1992). The most prominent result ofthis inversion is seen in the center of the modelextending to a depth of some 20 km. It is associatedwith the Carpathian Orogen and the Focsani Basin (seeFig. 3 in Hauser et al., 2002). Since reflections from thecrust-mantle boundary and from an intra-crustal layerare visible on most sections, this information was usedto construct initial 1D models for individual shotpoints.
Both informations were then used to construct a 2Dstarting model for ray-tracing, making due allowance forthe offsets in the different phases. Next, the data wereinterpreted by 2D forward ray-tracing. For this we usedthe RAYINVR program, which is based on the methodof Zelt and Smith (1992) and which allows the inclusionof reflected phases, therefore using more of the infor-mation present in the seismic wave field.
In the ray-tracing procedure, travel times aresuccessively re-calculated for a sequence of modelswhich are constructed by the interpreter. In the initialmodelling, the uppermost velocity structure is deter-mined using the appropriate seismic phases. This isfollowed by stepwise modelling of phases from deeperlayers, usually in a sequence in which the velocity isdetermined from the refracted phase, after which thethickness is determined by the relevant reflected phase.Usually only super-critical reflections are strong enoughto be identified in the seismic record sections. Thisprocedure is continued until a reasonable fit is achieved,as judged from the assessed uncertainty of eachmodelled seismic phase.
6.1. Uncertainties
A total of 13 seismic phases were correlated andpicked (see Table 2), which already indicates the
13F. Hauser et al. / Tectonophysics 430 (2007) 1–25
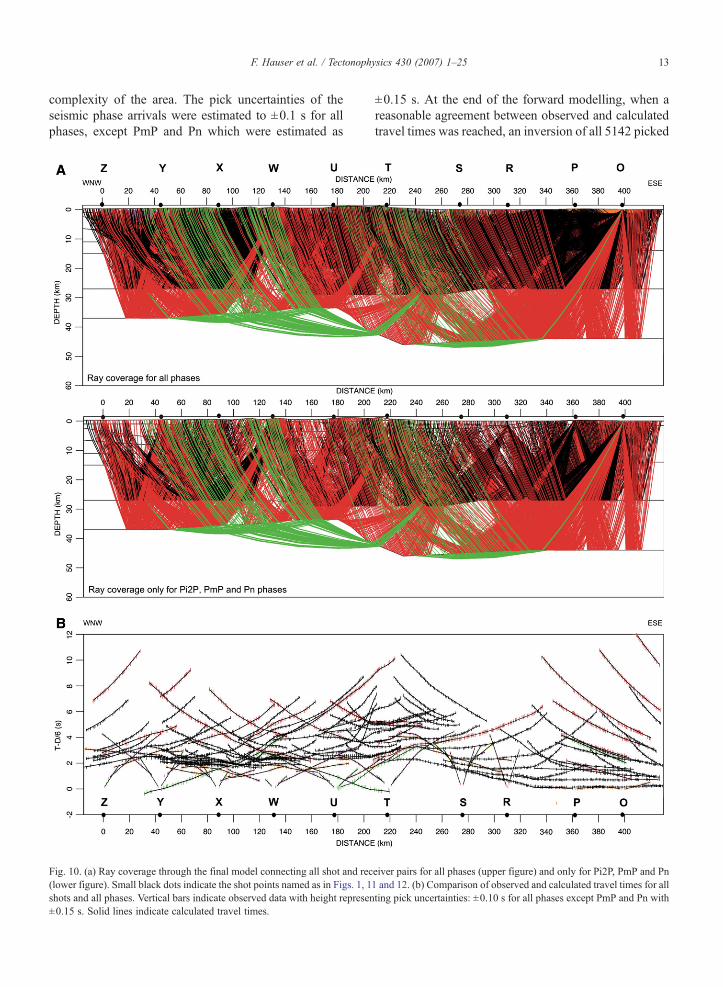
complexity of the area. The pick uncertainties of theseismic phase arrivals were estimated to ±0.1 s for allphases, except PmP and Pn which were estimated as
Fig. 10. (a) Ray coverage through the final model connecting all shot and rec(lower figure). Small black dots indicate the shot points named as in Figs. 1, 1shots and all phases. Vertical bars indicate observed data with height represen±0.15 s. Solid lines indicate calculated travel times.
±0.15 s. At the end of the forward modelling, when areasonable agreement between observed and calculatedtravel times was reached, an inversion of all 5142 picked
eiver pairs for all phases (upper figure) and only for Pi2P, PmP and Pn1 and 12. (b) Comparison of observed and calculated travel times for allting pick uncertainties: ±0.10 s for all phases except PmP and Pn with
14 F. Hauser et al. / Tectonophysics 430 (2007) 1–25
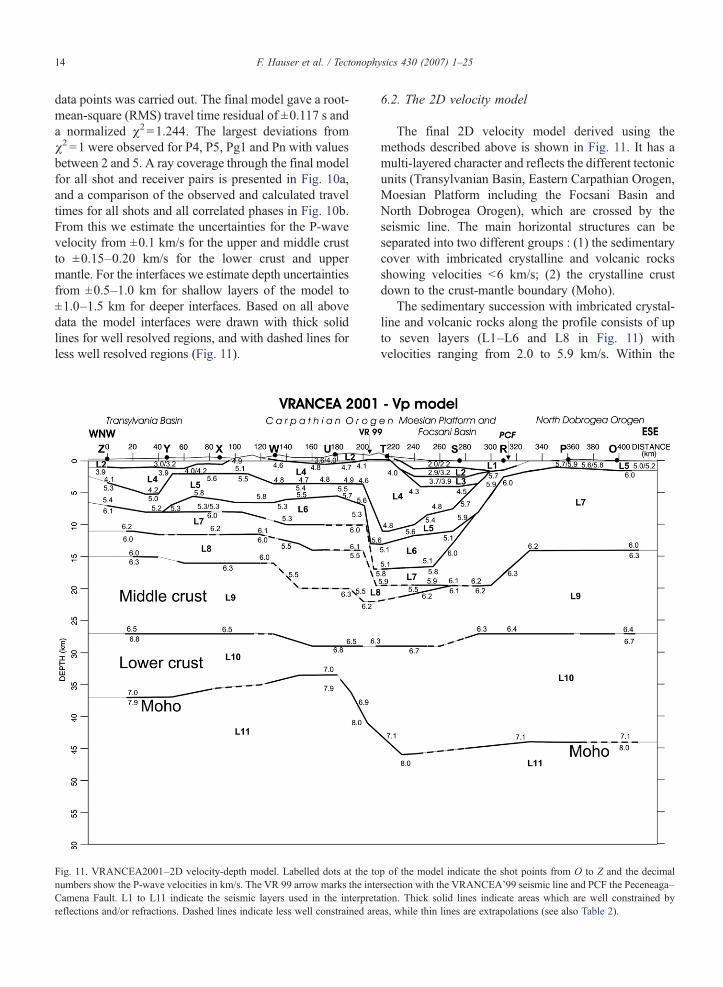
data points was carried out. The final model gave a root-mean-square (RMS) travel time residual of ±0.117 s anda normalized χ2 =1.244. The largest deviations fromχ2 =1 were observed for P4, P5, Pg1 and Pn with valuesbetween 2 and 5. A ray coverage through the final modelfor all shot and receiver pairs is presented in Fig. 10a,and a comparison of the observed and calculated traveltimes for all shots and all correlated phases in Fig. 10b.From this we estimate the uncertainties for the P-wavevelocity from ±0.1 km/s for the upper and middle crustto ±0.15–0.20 km/s for the lower crust and uppermantle. For the interfaces we estimate depth uncertaintiesfrom ±0.5–1.0 km for shallow layers of the model to±1.0–1.5 km for deeper interfaces. Based on all abovedata the model interfaces were drawn with thick solidlines for well resolved regions, and with dashed lines forless well resolved regions (Fig. 11).
Fig. 11. VRANCEA2001–2D velocity-depth model. Labelled dots at the tonumbers show the P-wave velocities in km/s. The VR 99 arrow marks the inteCamena Fault. L1 to L11 indicate the seismic layers used in the interpretareflections and/or refractions. Dashed lines indicate less well constrained are
6.2. The 2D velocity model
The final 2D velocity model derived using themethods described above is shown in Fig. 11. It has amulti-layered character and reflects the different tectonicunits (Transylvanian Basin, Eastern Carpathian Orogen,Moesian Platform including the Focsani Basin andNorth Dobrogea Orogen), which are crossed by theseismic line. The main horizontal structures can beseparated into two different groups : (1) the sedimentarycover with imbricated crystalline and volcanic rocksshowing velocities b6 km/s; (2) the crystalline crustdown to the crust-mantle boundary (Moho).
The sedimentary succession with imbricated crystal-line and volcanic rocks along the profile consists of upto seven layers (L1–L6 and L8 in Fig. 11) withvelocities ranging from 2.0 to 5.9 km/s. Within the
p of the model indicate the shot points from O to Z and the decimalrsection with the VRANCEA'99 seismic line and PCF the Peceneaga–tion. Thick solid lines indicate areas which are well constrained byas, while thin lines are extrapolations (see also Table 2).
15F. Hauser et al. / Tectonophysics 430 (2007) 1–25
Eastern Carpathian Orogen we find four layers (L2, L4,L5 and L6) above the crystalline basement (L7 with6.0 km/s) with variable thicknesses and increasingvelocities from 3.60 km/s at the surface to 5.70 km/s atthe base of the succession. The lowest layer (L6) is alow-velocity zone with 5.30 km/s sandwiched betweenhigher-velocity layers. Further to the west and into theTransylvanian Basin we find three layers (L2, L4 andL5) with variable thicknesses and seismic velocitiesfrom 3.00 km/s near the top to 5.80 km/s at thesediment-basement interface.
To the east and into the Focsani Basin the sedimentthickness increases drastically to about 20–22 km. Theseismic velocities cover a wide range and increase from2 km/s at the surface to 5.6 km/s in layer L5. The deepestpart of the Focsani Basin shows three layers (L6–L8)with velocities between 5.1 and 5.9 km/s, which areattributed to a succession of different sedimentary rockscharacterised by a high-velocity layer (L7) wedged inbetween layers with lower velocities (L6, L8). The NorthDobrogea Orogen is covered by a thin wedge ofsediments, volcanics and imbricated basement (L5; 1–3 km thick) with rather high velocities (5.00–5.90 km/s).
The seismic basement (L7–L10) coincides with adepth where velocities exceed 5.9 km/s. The uppercrustal velocities are very heterogeneous and seem toreflect different tectonic units. In addition, we find alow-velocity layer (L8 with 5.50–6.00 km/s) within theupper crystalline crust, which extends from the westernend of the seismic line to the Focsani Basin. A distinctintra-crustal boundary separates the middle crust (L9;6.1–6.5 km/s) from the lower crust (L10; 6.7–7.1 km/s)with varying depth from 27 km at the western end to29 km below the Focsani Basin and 27 km at the easternend of the seismic line.
Wide-angle Moho reflections (PmP) indicate theexistence of a first-order crust-mantle boundary (be-tween L10 and L11). The Moho topography shows athickening of the crust from 37 km in the west to 42–46 km below the Focsani Basin and 44 km in the NorthDobrogea Orogen area in the east. No pronouncedcrustal root below the Carpathian Orogen is recogni-zable. Some constraints on upper mantle seismic velo-cities are provided by Pn arrival times picked fromseveral shot points.
7. Discussion and interpretation
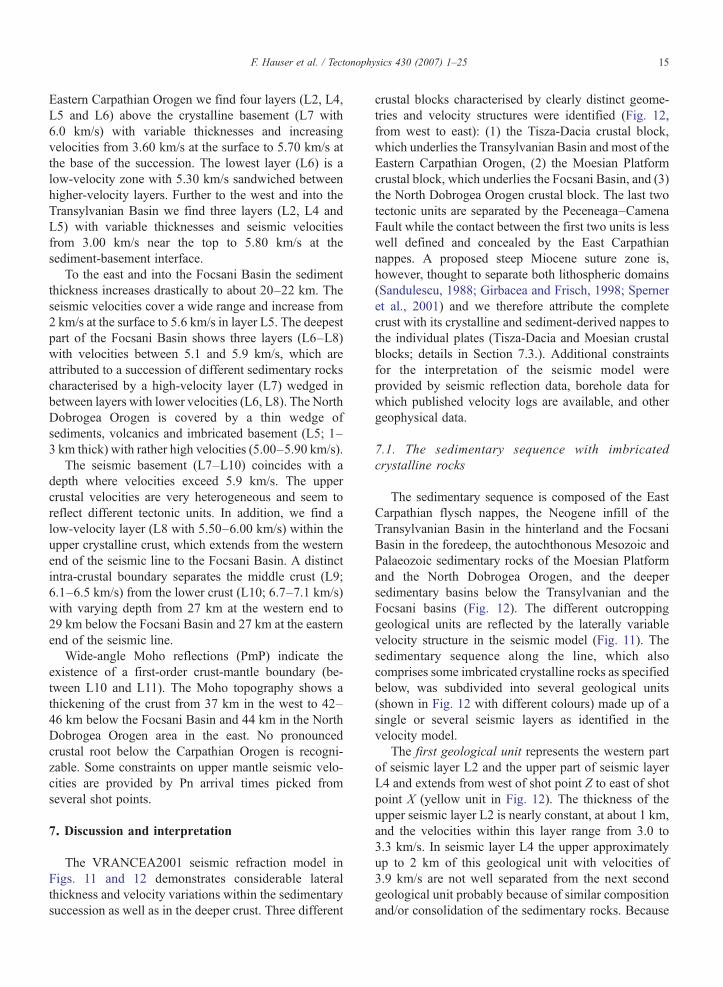
The VRANCEA2001 seismic refraction model inFigs. 11 and 12 demonstrates considerable lateralthickness and velocity variations within the sedimentarysuccession as well as in the deeper crust. Three different
crustal blocks characterised by clearly distinct geome-tries and velocity structures were identified (Fig. 12,from west to east): (1) the Tisza-Dacia crustal block,which underlies the Transylvanian Basin and most of theEastern Carpathian Orogen, (2) the Moesian Platformcrustal block, which underlies the Focsani Basin, and (3)the North Dobrogea Orogen crustal block. The last twotectonic units are separated by the Peceneaga–CamenaFault while the contact between the first two units is lesswell defined and concealed by the East Carpathiannappes. A proposed steep Miocene suture zone is,however, thought to separate both lithospheric domains(Sandulescu, 1988; Girbacea and Frisch, 1998; Sperneret al., 2001) and we therefore attribute the completecrust with its crystalline and sediment-derived nappes tothe individual plates (Tisza-Dacia and Moesian crustalblocks; details in Section 7.3.). Additional constraintsfor the interpretation of the seismic model wereprovided by seismic reflection data, borehole data forwhich published velocity logs are available, and othergeophysical data.
7.1. The sedimentary sequence with imbricatedcrystalline rocks
The sedimentary sequence is composed of the EastCarpathian flysch nappes, the Neogene infill of theTransylvanian Basin in the hinterland and the FocsaniBasin in the foredeep, the autochthonous Mesozoic andPalaeozoic sedimentary rocks of the Moesian Platformand the North Dobrogea Orogen, and the deepersedimentary basins below the Transylvanian and theFocsani basins (Fig. 12). The different outcroppinggeological units are reflected by the laterally variablevelocity structure in the seismic model (Fig. 11). Thesedimentary sequence along the line, which alsocomprises some imbricated crystalline rocks as specifiedbelow, was subdivided into several geological units(shown in Fig. 12 with different colours) made up of asingle or several seismic layers as identified in thevelocity model.
The first geological unit represents the western partof seismic layer L2 and the upper part of seismic layerL4 and extends from west of shot point Z to east of shotpoint X (yellow unit in Fig. 12). The thickness of theupper seismic layer L2 is nearly constant, at about 1 km,and the velocities within this layer range from 3.0 to3.3 km/s. In seismic layer L4 the upper approximatelyup to 2 km of this geological unit with velocities of3.9 km/s are not well separated from the next secondgeological unit probably because of similar compositionand/or consolidation of the sedimentary rocks. Because
Fig. 12. Interpreted geological cross-section (top: 4.5×vertical exaggeration, bottom: without vertical exaggeration) from the 2D seismic model ofFig. 11 along the main VRANCEA2001 seismic refraction line between the Transylvanian Basin and the Black Sea. The upper crustal geologicalstructures of the Tisza-Dacia and the Moesian crustal blocks are transverse to the section. The proposed out-of-sequence thrusting in the crystallinebasement (labeled with number 1) and the geologic structures of the North Dobrogea crustal block in the foreland (labeled with number 2) are obliqueto the seismic line. For location of the section and for location of the major geological structures compare with Fig. 1.
16 F. Hauser et al. / Tectonophysics 430 (2007) 1–25
of their proximity to the surface and from reflectionseismic lines and boreholes from gas exploration(Ciulavu, 1999; Ciulavu et al., 2000) they are howeverknown to exist. This geological unit with in total up to3 km of thickness represents the Neogene cover of theTransylvanian Basin (Fig. 12).
The second geological unit (seismic layer L4 be-tween west of shot point Z and shot point Y in Fig. 11)underlies geological unit 1 within the TransylvanianBasin (green unit in Fig. 12). It has an asymmetric shape
with a steeper eastern flank and its thickness increasesfrom 0 km in the west to about 2 km in the east. Thevelocity within this layer increases from 3.9 km/s at thetop to 4.2 km/s at the bottom. It represents the TarnavaBasin, which has a half-graben geometry and is filledwith Late Cretaceous to Paleogene sediments and isunderlain by Early Cretaceous sediments and Jurassicvolcanics. It is known from reflection seismic lines andboreholes from gas exploration (Ciulavu, 1999; Ciulavuet al., 2000).
17F. Hauser et al. / Tectonophysics 430 (2007) 1–25
The third geological unit comprises seismic layersL2 and L4 from west of shot point W to shot point T(Fig. 11; brown unit in Fig. 12) and has a thickness of 4–6 km. Its velocities range between 3.6 and 5.1 km/s withstrong lateral as well as vertical variations. This unitrepresents the presumed unrooted sedimentary nappepile of the Carpathian Orogen made up mainly ofTriassic to Neogene rocks (mostly Cretaceous andTertiary flysch of the Moldavide and Outer Dacidenappes; see Figs. 1 and 4).
The fourth geological unit (seismic layer L4 fromshot point Y to west of shot point W and layer L5 fromwest of shot point Z to halfway between shot points Uand T in Fig. 11) underlies geological units 1, 2 and 3(Transylvanian and Tarnava Basins and sedimentarynappe pile of the Carpathian Orogen; uppermost part ofviolet unit in Fig. 12). It reaches the surface betweenshot points X and W, where it can be correlated tosurface outcrops. The thickness of this unit rangesbetween 2 and 5 km with highly variable velocitiesbetween 4.0 and 5.8 km/s reaching the maximumvelocity (5.4 to 5.8 km/s) at the bottom of layer L5 at adepth of about 7 km. This unit represents imbricatedbasement nappes of the Median Dacides (mainlyBucovinian nappes; Sandulescu, 1984) of the Internaland External Carpathian Orogen. It is composed ofmetamorphic and other crystalline rocks. A heteroge-neous composition with participation of lower-grademetamorphic, possibly Palaeozoic rocks, and a localizedthin cover of autochthonous Palaeo and Mesozoic rockscould explain the velocity variations, especially the lowvelocities (b4.9 km/s) within seismic layer L4. Thisgeological unit may, west of shot point Y, contain thinthrust sheets of ophiolithic rocks from the Transylvanidenappes as proposed in the section of Fig. 4. Butvelocities point to a more generally crystalline compo-sition of the crust. There is also no indication of theproposed Miocene suture zone below the third geolo-gical unit (Eastern Carpathian flysch nappes) sincevelocities seem to be laterally and horizontally relativelycontinuous and lower than expected for mafic orultramafic ophiolitic rocks.
The fifth geological unit (seismic layer L6 in Fig. 11)is an about 2 to 4 km thick low velocity zone withvelocities of 5.3 km/s (blue unit in Fig. 12). It underliesgeological unit 4 (basement nappes of the CarpathianOrogen) and its western boundary near shot point Y is inwestern down-dip prolongation of the overthrustedbasement nappes at the surface (see preview cross-section in Fig. 4, east of shot point X). Because of thisrelationship it can be interpreted as the autochthonousPalaeozoic and/or Mesozoic cover of the basement
overthrusted by the deeper, higher velocity metamorphiccrystalline basement of geological unit 4 (Fig. 12;Sandulescu, 1984).
The sixth geological unit (seismic layers L1–L3 eastof shot point T and L4 below and east of shot point T inFig. 11; eastern yellow unit in Fig. 12) partiallyunderlies geological unit 3 (sedimentary nappe pile ofthe External Carpathians). It has its greatest thickness ofabout 10 km east of shot point T at the front of theCarpathian nappes and thins continuously from shotpoint S towards shot point R to only 1 km anddisappears further east. In its lower part (seismic layerL4) it displays an asymmetric shape with a steep westernflank, which clearly separates this unit from the westernarea, and a relatively gentle dipping eastern flank. In theupper parts (seismic layers L1 to L3) its moresymmetrical shape correlates with data known fromsurface geology and reflection seismic lines (Tarapoancaet al., 2003). Velocities increase from 2.0 to 4.8 km/s atthe base of the unit and are laterally continuous. Thisgeological unit corresponds to the Middle Miocene toQuaternary sedimentary fill of the Focsani Basin.
The seventh geological unit (seismic layer 5 in Fig. 11)begins about halfway between shot points U and T andcan be followed along the base of geological unit 6(Focsani Basin) until it reaches the surface between shotpoints R and P (dark-blue unit in Fig. 12), from where itstays at the surface to the eastern end of the section(easternmost light blue unit in Fig. 12). Its thickness isabout 2–3 km, while slightly decreasing to about 1–1.5 km east of shot point R. Velocities are in the range of5.4–5.9 km/s with only minor lateral variations. Thedeeper part of this unit (dark blue segment) probablyrepresents the autochthonous Mesozoic and maybe thevery thin Cenozoic sedimentary cover rocks of theMoesian Platform below the Neogene Focsani Basin.The high velocities would correlate with widely occurringcarbonate rocks in these layers (Tari et al., 1997).Observations of Poisson's ratio along the VRANCEA'99seismic refraction line seem to confirm this interpretation(Raileanu et al., 2005). In the Dobrogea area, this unit isalso composed of Triassic volcanic rocks and imbricatedPalaeozoic sedimentary, magmatic or metamorphic rocks.The whole layer in this crustal block probably representsthe NNE-ward overthrusted North Dobrogea Orogen(light blue segment in Fig. 12).
The eighth geological unit (seismic layer 6 betweeneast of shot point T and shot point S in Fig. 11; orangeunit in Fig. 12) is a homogeneous low-velocity layer witha thickness of about 5 km and velocities of 5.1 km/s. Itsisolated appearance with sharp lateral boundaries pointto a graben-like structure, while the lower velocities
18 F. Hauser et al. / Tectonophysics 430 (2007) 1–25
indicate a more clastic sedimentary succession. Since itis located below the proposed autochthonous Mesozoiccover rocks of the Moesian Platform, we propose aPermo-Triassic graben structure (Fig. 12). Similargeological structures of the Moesian Platform in thisor nearby areas have already been described orproposed by Tari et al. (1997), Landes et al. (2004),Panea et al. (2005), Bocin et al. (2005) and Raileanuet al. (2005).
The ninth geological unit (seismic layers L7 fromhalfway between shot points U and T until shot point Rand seismic layer L8 between shot points W and S inFig. 11) has a relatively constant thickness of about 6 kmwhile its velocities range from 5.5 to 5.9 km/s (light blueunit in Fig. 12). Its western part is located below theCarpathian nappes at 14 km depth, its central part atgreater depth below the proposed Permo-Triassicgraben, and the continuation to the east would becovered by Mesozoic platform rocks. Because this unitunderlies the above graben structure, we interpret it forthe central and eastern part as the autochthonousPalaeozoic cover rocks of the Moesian Platform(Fig. 12). The western part (west of halfway betweenshot points U and T) could be made up of similar rockscovering the eastern margin of the Tisza-Dacia blockwith a slightly thinned middle and lower crust, whichwere later overthrusted by crystalline Carpathian nappeswith higher velocities. The high velocities can, again, becorrelated in the Moesian domain with widely occurringcarbonate rocks in these layers (Tari et al., 1997) andPoisson's ratio observations along the VRANCEA'99seismic refraction line seem to confirm this as well(Raileanu et al., 2005).
7.2. The structure of the crystalline crust
The tenth geological unit (seismic layer L7 west ofhalfway between shot points U and T and east of shotpoint R; seismic layer L8 west of halfway between shotpoints W and U and seismic layers L9 and L10 inFig. 11) makes up the crystalline crust of the Tisza-Dacia, Moesian and North Dobrogea crustal blocks(violet, pink and gray–blue units in Fig. 12). It showsthickness variations related to the different crustalblocks, while there are only small lateral velocity varia-tions (especially in the middle crust) along the entireseismic line. The velocities increase from 6.0 km/s at thetop of basement to approximately 7.0 km/s at the Moho.
The total thickness of the crystalline crust lies bet-ween 30 and 34 km for the western part of the model,which corresponds to the Tisza-Dacia crustal block. Thisblock is characterised by basement thrusts in its upper
crustal layers down to 12–15 km depth as described inthe previous section. A low-velocity layer (L8 with6.0 km/s in Fig. 11) between 11 and 15 km depth isinterpreted as being related to another intra-crustalbasement thrust connected to the Carpathian Orogen,where a higher-velocity deeper crustal unit (L7 with 6.0–6.2 km/s in Fig. 11) was thrusted over a lower-velocityshallower crustal unit (Fig. 12). Between shot point Wand east of shot point U, the crystalline crust of theseismic layer L7 and the western part of layer L8 coverlower velocity rocks of the ninth geological unit(Fig. 12). We interpret this again as crystalline basementoverthrusted on top of Palaeozoic sedimentary rocksinside the Tisza-Dacia block. This structure is also seenin the 3D crustal tomography model of Landes et al.(2004) and has been correlated with a SSE-ward directedLate Pliocene/Early Pleistocene out-of-sequence base-ment thrust (Landes et al., 2003; Fielitz and Seghedi,2005). The middle crust comprises velocities of 6.3–6.5 km/s at depth between 15 and 29 km, whereas thelower crust with velocities of 6.8–7.0 km/s is thinner andhas a thickness of only between 8 and 10 km (Fig. 11). Asdiscussed later on (Section 7.3.), the middle and lowercrust of the Tisza-Dacia block have their easternboundary between shot points U and T (Fig. 12). Andlike for the upper crust, there is also no indication of theproposed Miocene suture zone in the middle and lowercrust, since velocities seem to be laterally and horizon-tally relatively continuous and lower than to be expectedfor mafic or ultramafic ophiolitic rocks. The velocitymodel gives also no indication of voluminous Neogeneto Quaternary volcanic rocks (basalts and andesites) astentatively proposed in the geological section of Fig. 4for this part of the seismic profile. Small-volume dikes orsub-volcanic intrusions are however still possible, butcannot be resolved.
To the east, until shot point R, a clearly distinctstructure in the central part of the model is associatedwith the Moesian crustal block. The total thickness ofthe Moesian crystalline crust is 19 to 25 km. The only7–9 km thick middle crustal layer with the top betweenapproximately 20 and 22 km depth shows velocities of6.1–6.3 km/s, while the 9–16 km thick lower crustallayer has velocities of 6.7–7.1 km/s. The easternboundary of this Moesian crustal block correlates wellwith the down-dip prolongation of the Peceneaga–Camena crustal fault (Figs. 2 and 12). As described inSection 7.1, above the thinned middle to lower crust, theMoesian block is characterised by alternating high- andlow-velocity layers (layers L1–L8 in Fig. 11), which weinterpret from bottom to top as a thick Palaeozoic au-tochthonous sedimentary cover, a Permo-Triassic
19F. Hauser et al. / Tectonophysics 430 (2007) 1–25
graben structure, a Mesozoic autochthonous sedimen-tary cover and a deep Middle Miocene to Quaternarysedimentary basin. The superposition of these differentstructures suggests a repeated reactivation of possiblyPalaeozoic or older major crustal discontiniuties withinthe Moesian block. The verification of this geologicalmodel, however, has to take into account the 3D-orientation of the individual structures, which cannot bedistinguished on this two-dimensional section. Inaddition, especially the deeper structures, which donot outcrop at the surface, are not yet clearly established.
East of the Peceneaga–Camena Fault, the NorthDobrogea crustal block shows a very distinct three-layered crystalline crust with a total thickness of 44 km.The upper crust has velocities of 6.0–6.2 km/s (seismiclayer L7), while middle and lower crustal velocities(seismic layer L9 and L10) range between 6.3–6.4 km/sand 6.7–7.1 km/s, respectively. The thick NorthDobrogea crystalline crust is connected with theScythian Platform, which is a continuation of the EastEuropean Platform further to the east and northeast, asshown by large-scale tomographic data from this area(Wortel and Spakman, 2000). We therefore suggest, thatthe North Dobrogea crustal block is mainly composed ofcrust from the Scythian Platform (see Fig. 1) and that theuppermost layer of 1 to 2 km thickness represents thecentral or frontal parts of the overthrusted wedge of theNorth Dobrogea Orogen. Layers L7, L9 and L10 showno lateral velocity variations between shot points R andO. Therefore, an important deep reaching ultramaficnappe, as proposed in the geological section of Fig. 4,seems improbable. Additionally the velocity model inthis area is sub-parallel to the geological structures. Forthis reason such a nappe would not be a steeply dippingstructure but a near-surface horizontal to shallow dippingbody. Velocities of 5.8 and 5.9 km/s in the thrust wedgeof seismic layer L5 could relate to such an ultramaficnappe, whose down-dip continuation must however besearched south and parallel to the actual seismic section.
7.3. Plate boundaries
As discussed in the introduction, the geodynamicsetting of the region covered by the VRANCEA2001seismic line is thought to relate to the final stages of asubduction process (e.g. Sandulescu, 1988; Csontos,1995; Girbacea and Frisch, 1998; Sperner et al., 2001;Cloetingh et al., 2004). This subduction involved theupper Tisza-Dacia lithospheric plate, which was alreadyaffected by important contractional deformation(thrusts, nappes and a palaeosuture) related to an earlierEarly Cretaceous subduction and collisional event. The
composite lower plate originated by the accretion ofdifferent lithospheric domains, which involved therelatively undeformed but compositionally distinctMoesian, Scythian and East European platform areasas well as the Late Triassic to Late Jurassic NorthDobrogea Orogen with its Variscan basement, allseparated by important crustal faults. The collision andclimax of deformation between both plates took place inthe Middle to Late Miocene (Sarmatian) and resulted ina steep suture zone thought to be concealed by theoverthrusted Eastern Carpathian flysch nappes, whichwould represent the unrooted accretionary prism. Thismodel is represented in the geological section of Fig. 4.
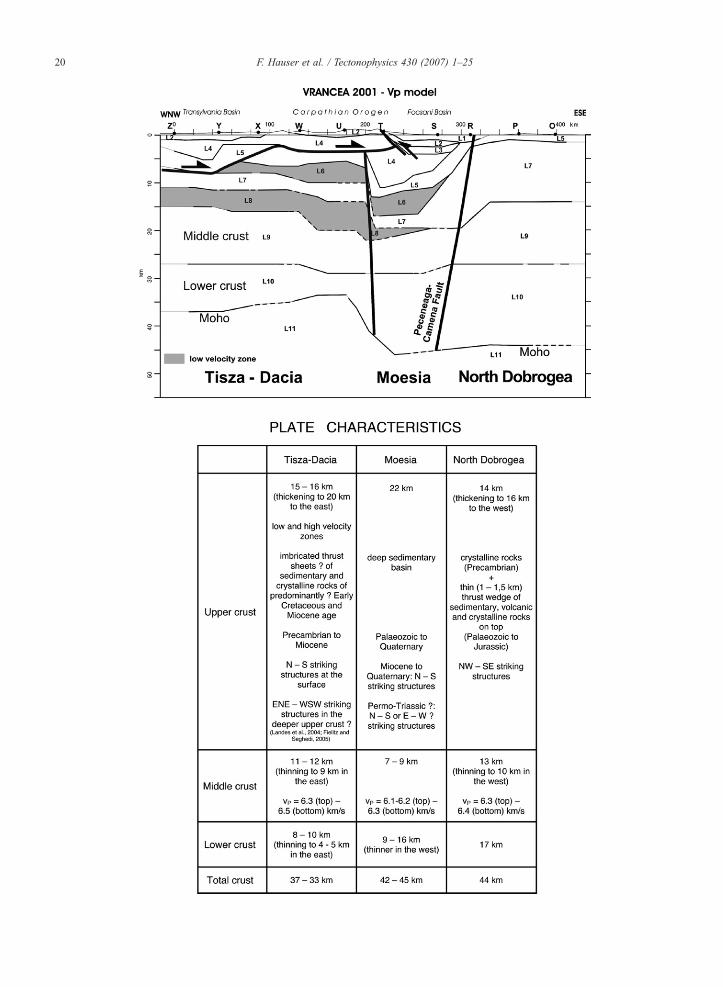
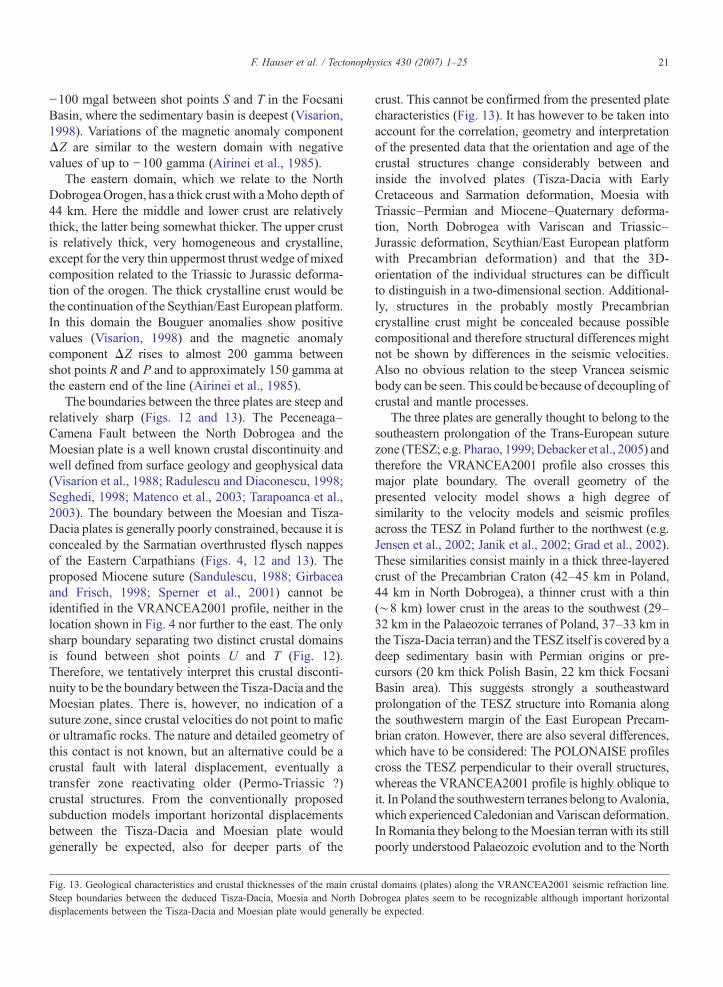
The VRANCEA2001 profile can be subdivided intothree crustal domains with distinct characteristicsconcerning thickness, composition, structuring andgeometry of the different crustal layers (Fig. 13).
The western domain, which we relate to the Tisza-Dacia plate, has the thinnest crust with a Moho depth of37–33 km. The middle crust is significantly thicker thanthe lower crust. The upper crust shows an alternation ofhigh and low velocity zones, which we interpret aslargely related to imbricated thrust sheets with alterna-ting sedimentary and crystalline rocks. Much of thisdeformation could already have been emplaced duringthe earlier Early Cretaceous subduction and collisionalevent with some reactivation and new deformationduring the later Sarmatian event. In this domainBouguer anomalies show negative values decreasingacross the Transylvanian Basin with the lowest valuesdue to thick sediments around shot point U (−50 mgal)and shot point Y (−60 mgal; Visarion, 1998). Positivevalues of the magnetic anomaly component ΔZ of up to300 gamma dominate the centre of the TransylvanianBasin, while negative values of up to −100 gamma wereobserved between shot points X and R (Airinei et al.,1985). These anomalies are related to different basementcompositions (greenschist basement with negativeanomalies and other basements with positive anomalies;Airinei et al., 1985).
The central domain, which we relate to the Moesianplate, has a thick crust with a Moho depth down to45 km. Here the middle crust (with slightly lowervelocities than the adjacent plates) is thinner than thelower crust. The upper crust is well layered, whollysedimentary and shows in its lower part also analternation of high and low velocity zones. Deformationseems to be limited to Permo-Triassic extension andMiocene to Quaternary subsidence in the Carpathianforeland. In this domain the Bouguer anomalies shownegative values with a small minimum of −85 mgalaround shot point T and an absolute minimum of
20 F. Hauser et al. / Tectonophysics 430 (2007) 1–25
21F. Hauser et al. / Tectonophysics 430 (2007) 1–25
−100 mgal between shot points S and T in the FocsaniBasin, where the sedimentary basin is deepest (Visarion,1998). Variations of the magnetic anomaly componentΔZ are similar to the western domain with negativevalues of up to −100 gamma (Airinei et al., 1985).
The eastern domain, which we relate to the NorthDobrogeaOrogen, has a thick crust with aMoho depth of44 km. Here the middle and lower crust are relativelythick, the latter being somewhat thicker. The upper crustis relatively thick, very homogeneous and crystalline,except for the very thin uppermost thrust wedge of mixedcomposition related to the Triassic to Jurassic deforma-tion of the orogen. The thick crystalline crust would bethe continuation of the Scythian/East European platform.In this domain the Bouguer anomalies show positivevalues (Visarion, 1998) and the magnetic anomalycomponent ΔZ rises to almost 200 gamma betweenshot points R and P and to approximately 150 gamma atthe eastern end of the line (Airinei et al., 1985).
The boundaries between the three plates are steep andrelatively sharp (Figs. 12 and 13). The Peceneaga–Camena Fault between the North Dobrogea and theMoesian plate is a well known crustal discontinuity andwell defined from surface geology and geophysical data(Visarion et al., 1988; Radulescu and Diaconescu, 1998;Seghedi, 1998; Matenco et al., 2003; Tarapoanca et al.,2003). The boundary between the Moesian and Tisza-Dacia plates is generally poorly constrained, because it isconcealed by the Sarmatian overthrusted flysch nappesof the Eastern Carpathians (Figs. 4, 12 and 13). Theproposed Miocene suture (Sandulescu, 1988; Girbaceaand Frisch, 1998; Sperner et al., 2001) cannot beidentified in the VRANCEA2001 profile, neither in thelocation shown in Fig. 4 nor further to the east. The onlysharp boundary separating two distinct crustal domainsis found between shot points U and T (Fig. 12).Therefore, we tentatively interpret this crustal disconti-nuity to be the boundary between the Tisza-Dacia and theMoesian plates. There is, however, no indication of asuture zone, since crustal velocities do not point to maficor ultramafic rocks. The nature and detailed geometry ofthis contact is not known, but an alternative could be acrustal fault with lateral displacement, eventually atransfer zone reactivating older (Permo-Triassic ?)crustal structures. From the conventionally proposedsubduction models important horizontal displacementsbetween the Tisza-Dacia and Moesian plate wouldgenerally be expected, also for deeper parts of the
Fig. 13. Geological characteristics and crustal thicknesses of the main crustaSteep boundaries between the deduced Tisza-Dacia, Moesia and North Dodisplacements between the Tisza-Dacia and Moesian plate would generally
crust. This cannot be confirmed from the presented platecharacteristics (Fig. 13). It has however to be taken intoaccount for the correlation, geometry and interpretationof the presented data that the orientation and age of thecrustal structures change considerably between andinside the involved plates (Tisza-Dacia with EarlyCretaceous and Sarmation deformation, Moesia withTriassic–Permian and Miocene–Quaternary deforma-tion, North Dobrogea with Variscan and Triassic–Jurassic deformation, Scythian/East European platformwith Precambrian deformation) and that the 3D-orientation of the individual structures can be difficultto distinguish in a two-dimensional section. Additional-ly, structures in the probably mostly Precambriancrystalline crust might be concealed because possiblecompositional and therefore structural differences mightnot be shown by differences in the seismic velocities.Also no obvious relation to the steep Vrancea seismicbody can be seen. This could be because of decoupling ofcrustal and mantle processes.
The three plates are generally thought to belong to thesoutheastern prolongation of the Trans-European suturezone (TESZ; e.g. Pharao, 1999;Debacker et al., 2005) andtherefore the VRANCEA2001 profile also crosses thismajor plate boundary. The overall geometry of thepresented velocity model shows a high degree ofsimilarity to the velocity models and seismic profilesacross the TESZ in Poland further to the northwest (e.g.Jensen et al., 2002; Janik et al., 2002; Grad et al., 2002).These similarities consist mainly in a thick three-layeredcrust of the Precambrian Craton (42–45 km in Poland,44 km in North Dobrogea), a thinner crust with a thin(∼8 km) lower crust in the areas to the southwest (29–32 km in the Palaeozoic terranes of Poland, 37–33 km inthe Tisza-Dacia terran) and the TESZ itself is covered by adeep sedimentary basin with Permian origins or pre-cursors (20 km thick Polish Basin, 22 km thick FocsaniBasin area). This suggests strongly a southeastwardprolongation of the TESZ structure into Romania alongthe southwestern margin of the East European Precam-brian craton. However, there are also several differences,which have to be considered: The POLONAISE profilescross the TESZ perpendicular to their overall structures,whereas the VRANCEA2001 profile is highly oblique toit. In Poland the southwestern terranes belong toAvalonia,which experienced Caledonian and Variscan deformation.In Romania they belong to theMoesian terran with its stillpoorly understood Palaeozoic evolution and to the North
l domains (plates) along the VRANCEA2001 seismic refraction line.brogea plates seem to be recognizable although important horizontalbe expected.
22 F. Hauser et al. / Tectonophysics 430 (2007) 1–25
Dobrogea orogen, which experienced Variscan andTriassic–Jurassic deformation. The Tisza-Dacia terran,which makes up the whole western half of theVRANCEA2001 profile and already experienced anEarly Cretaceous collisional event, is generally thoughtto have collided with the TESZ only during the Mioceneand, separated by an oceanic domain, was formerlylocated much farther to the west. Therefore its crustalgeometry cannot be compared easily with the Avaloniaterran. Also the younger basins showmarked differences.The Polish Basin is a Carboniferous–Permian andMesozoic structure that was inverted during the LateCretaceous and Early Tertiary. The Focsani Basin ismainly a Late Cenozoic structure marginally affected byLate Alpine deformation. It possibly had a Permo-Triassicprecursor basin, but its geometry and relation to theoverlying Cenozoic basin is only very poorly constrained.In summary, the POLONAISE and VRANCEA2001profils show globally many similarities, expecially due tothe contrast between the exceptionally thick EastEuropean Precambrian crust and the thinner southwesternaccreted terranes. Timing of accretion and deformation ofthese terranes might, however, be very different andcrustal and basinal similarities partly result only from themechanical differences between both crustal domains.
A more in-depth interpretation of the VRAN-CEA2001 is only possible in the context of a complexlarger scale geodynamic model using additional geo-logical and geophysical (e.g. mantle tomography;Wenzel et al., 1998b; Martin et al., 2005, 2006) data.This is however not the focus of this paper.
8. Conclusions
A700 km longWNW–ESE trending seismic refractionline was carried out in Romania in order to study thelithospheric structure. Here we present results from a sub-section between the Transylvanian Basin across the SE-Carpathians to the Carpathian foreland areas. Thegeophysical and geologic interpretation of the data byforward and inverse modeling gave the following results:
The sedimentary succession can be subdivided into 7layers with a total thickness of up to 22 km. It iscomposed of (1) the Carpathian nappe pile, (2) the post-collisional (post-Early Cretaceous) Paleo to NeogeneTransylvanian Basin, which covers the local LateCretaceous to Paleogene Tarnava Basin, (3) the NeogeneFocsani Basin in the foredeep area, which coversautochthonous Mesozoic and Palaeozoic sedimentaryrocks as well as a proposed Permo-Triassic grabenstructure of theMoesian Platform, and (4) the Palaeo andMesozoic rocks of the North Dobrogea Orogen.
The underlying crystalline crust shows considerablethickness variations, in total as well as in its individualsubdivisions, which correlate well with the Tisza-Dacia,Moesian and North Dobrogea crustal blocks, respec-tively. Only minor lateral changes in velocity structureof these blocks were observed. The Tisza-Dacia block isabout 35 km thick and low velocity zones in itsuppermost 15 km are presumably basement thrustsimbricated with sedimentary successions related to theCarpathian Orogen. The crystalline crust of Moesia doesnot exceed 23 km and is covered by up to 22 km ofsedimentary rocks. The North Dobrogea crust reaches athickness of about 44 km including an up to 2 km thickmixed sedimentary-volcanic-crystalline cover, which ismainly composed of a thin overthrusted wedge of theNorth Dobrogea Orogen.
The presented velocity model intersects the Trans-European suture zone (TESZ) and shows a high degreeof similarity in its overall geometry and velocities to thevelocity models and seismic profiles across the TESZ inPoland further to the northwest, although the specificcrustal evolution of both areas appears to have cleardifferences.
Acknowledgements
This investigation was only possible by the conti-nuous effort of many volunteers, in particular studentsfrom the Universities of Amsterdam, Bucharest andKarlsruhe. The National Institute for Earth Physics(NIEP) and the University of Bucharest (Geology andGeophysics Department) provided the logistics for thefieldwork in Romania. The Romanian ExplorationCompany PROSPECTIUNI S.A., Bucharest, was re-sponsible for the environmental study as well as thedrilling and shooting operations. Data were collectedusing the seismic equipment of the geophysicalinstrument pool of the GeoForschungsZentrum Potsdam(150 units) as well as the joint pool of IRIS /PASSCAL atSocorro, New Mexico and the University of Texas at ElPaso (640 units). The Deutsche Forschungsgemeinschaft(German Science Foundation) funded the projectthrough the Collaborative Research Centre 461 (CRC461) at the University of Karlsruhe, Germany: “StrongEarthquakes — a Challenge for Geosciences and CivilEngineering”. The RomanianMinistry for Education andResearch funded the Romanian researchers in thisproject via the CERES program (CERES 1 no. 34/2001 and CERES 4 no. 38/2004). The NATO ScienceCollaborative Research Linkage Grant no. EST.CLG974792 assisted the project by additional travel funding.Laszlo Csontos and an anonymous reviewer are
23F. Hauser et al. / Tectonophysics 430 (2007) 1–25
thankend for their careful and constructive reviews,which helped to improve and clarify parts of the paper.
References
Airinei, St., 1977. Lithosphere microplates on the Romanian territoryreflected in regional gravimetric anomalies (in Romanian). Stud.Cercet. Geol. Geofiz. Geogr., Ser. Geofiz. 15 (1), 19–30.
Airinei, S., Stoenescu, S., Velcescu, G., Romanescu, D., Visarion, M.,Radan, S., Roth, M., Besutiu, L., si Besutiu, G., 1985. Distributiaanomaliilor magnetice ΔZa pe teritoriul Romaniei. Stud. Cercet.Geol. Geofiz. Geogr., Ser. Geofiz. 23, 12–19.
Badescu, D., 1998. Geology of the East Carpathians — an overview.CERGOP “South Carpathians”monograph, vol. 7 (37), pp. 49–69.Warszawa.
Bocin, A., Stephenson, R., Tryggvason, A., Panea, I., Mocanu, V.,Hauser, F., Matenco, L., 2005. 2.5D seismic velocity modelling inthe southeastern Romanian Carpathians Orogen and its foreland.Tectonophysics 410, 273–291.
Ciulavu, D., Tertiary tectonics of the Transylvanian basin, Ph.D. thesis,154 pp., Vrije Univ., Amsterdam, Netherlands, 1999.
Ciulavu, D., Dinu, C., Szakács, A., Dordea, D., 2000. Neogenekinematics of the Transylvanian basin (Romania). AAPG Bull. 84(10), 1589–1615.
Cloetingh, S., Horvath, F., Dinu, C., Stephenson, R.A., Bertotti, G.,Bada, G., Matenco, L., Garcia-Castellanos, D., and the TECTOPworking group, 2003. Probing tectonic topography in the after-math of continental convergence in central Europe. EOS 84,89–93.
Cloetingh, S.A.P.L., Burov, E., Matenco, L., Toussaint, G., Bertotti,G., Andriessen, P.A.M., Wortel, M.J.R., Spakman, W., 2004.Thermo-mechanical controls on themode of continental collision inthe SE Carpathians (Romania). Earth Planet. Sci. Lett. 218, 57–76.
Constantinescu, L., Enescu, D., 1984. A tentative approach to possiblyexplaining the occurrence of Vrancea earthquakes. Rev. Roum.Geol. Geophys. Geogr., Ser. Geophys. 28.
Constantinescu, L., Cornea, S., Lazarescu, D., 1973. An approach tothe seismotectonics of the Romanian Eastern Carpathians. Rev.Roum. Geol. Geophys. Geogr., Ser. Geophys. 17 (2), 133–143.
Cornea, I., Radulescu, F., Pompilian, Al., Sova, A., 1981. Deep seismicsoundings in Romania. Pure Appl. Geophys. 119, 1144–1156.
Csontos, L., 1995. Tertiary tectonic evolution of the Intra-Carpathianarea: a review. Acta Vulcanol. 7, 1–13.
Debacker, T., Sintubin, M., Verniers, J. (Eds.), 2005. Avalonia–Moesia: Early Palaeozoic orogens in the Trans-European SutueZone. Geologica Belgica, vol. 8 (4), pp. 1–192.
Downes, H., Seghedi, I., Szakács, A., Dobosi, G., James, D.E., Vaselli,O., Rigby, I.J., Ingram, G.A., Rex, D., Pécskay, Z., 1995. Petrologyand geochemistry of late Tertiary/Quaternary mafic alkalinevolcanism in Romania. Lithos 35, 65–81.
Ellouz, N., Roure, F., Sandulescu, M., Badescu, D., 1994. Balancedcross-sections in the Eastern Carpathians (Romania): a tool toquantify Neogene dynamics. In: Roure, F., Ellouz, N., Shein, V.S.,Skvortsov, I. (Eds.), Geodynamic Evolution of SedimentaryBasins, pp. 305–325.
Enescu, D., Cornea, I., Constantinescu, P., Radulescu, F., si Patrut, S.,1972. Structura scoartei terestre si a mantalei superioare in zonacurburii Carpatilor. Stud. Cercet. Geol. Geofiz. Geogr., Ser. Geofiz.10 (1), 23–41.
Enescu, D., Danchiv, D., Bala, A., 1992. Lithosphere structure inRomania II. Thickness of the Earth crust. Depth-dependent
propagation velocity curves for the P and S waves. Stud. Cercet.Geol. Geofiz. Geogr., Ser. Geofiz. 30, 3–19.
Fielitz, W., Seghedi, I., 2005. Late Neogene to Quaternary tectonicgeomorphology and river drainage evolution in the EasternCarpathian Bend area of Romania. Tectonophysics 410, 111–136.
Fuchs, K., Bonjer, K.-P., Bock, G., et al., 1979. The Romanianearthquake of March 4, 1977; II, aftershocks and migration ofseismic activity. Tectonophysics 53, 225–247.
Girbacea, R., Frisch, W., 1998. Slab in the wrong place: lowerlithospheric mantle delamination in the last stage of the EasternCarpathian subduction retreat. Geology 26 (7), 611–614.
Grad, M., Jensen, S.L., Keller, G.R., Guterch, A., Thybo, H., Janik, T.,Tiira, T., Yliniemi, J., Luosto, U., Motuza, G., Nasedkin, V.,Czuba, W., Gaczynski, E., Sroda, P., Miller, K.C., Wilde-Piórko,M., Komminaho, K., Jacyna, J., Korabliova, L., 2002. Crustalstructure of the Trans-European suture zone region alongPOLONAISE'97 seismic profile P4. J. Geophys. Res. 108 (B11),2541. doi:10.1029/2003JB002426.
Hauser, F., Raileanu, V., Fielitz, W., Bala, A., Prodehl, C., Polonic, G.,Schulze, A., 2001. VRANCEA'99-the crustal structure beneath SECarpathians and the Moesian Platform from a seismic refractionprofile in Romania. Tectonophysics 340, 233–256.
Hauser, F., Prodehl, C., Landes, M., VRANCEAworking group, 2002.Seismic experiments target earthquake-prone region in Romania.EOS Trans. AGU 83, 457–463.
Hippolyte, J.C., Sandulescu, M., 1996. Paleostress characterization ofthe “Wallachian” phase in its type area, southeastern Carpathians,Romania. Tectonophysics 263, 235–249.
Hippolyte, J.C., Badescu, D., Constantin, P., 1999. Evolution of thetransport direction of the Carpathian belt during its collision withthe east European Platform. Tectonics 18, 1120–1138.
Hole, J.A., 1992. Nonlinear high-resolution three-dimensional seismictravel time tomography. J. Geophys. Res. 97, 6553–6562.
Janik, T., Yliniemi, J., Grad, M., Thybo, H., Tiira, T., andPOLONAISE P2 Working Group, 2002. Crustal structure acrossthe TESZ along POLONAISE'97 seismic profile P2 in NWPoland. Tectonophysics 360, 129–152.
Jensen, S.L., Thybo, H., POLONAISE'97 Working Group, 2002.Moho topography an lower crustal wide-angle reflectivity aroundthe TESZ in southern Scandinavia and northeastern Europe.Tectonophysics 360, 187–213.
Knapp, J.H., Knapp, C.C., Raileanu, V., Matenco, L., Mocanu, V.,Dinu, C., 2005. Crustal constraints on the origin of mantle seimicityin the Vrancea Zone, Romania: the case for active continentallithospheric delamination. Tectonophysics 410, 311–323.
Landes, M., Fielitz, W., Hauser, F., Popa, M., CALIXTO Group, 2004.3-D upper-crustal tomographic structure across the VranceaSeismic Zone, Romania. Tectonophysics 382, 85–102.
Martin, M., Ritter, J.R.R., and the CALIXTO Working Group, 2005.High-resolution teleseismic body-wave tomography beneath SERomania – I. Implications for three-dimensional versus one-dimensional crustal correction strategies with a new crustalvelocity model. Geophys. J. Int. 162, 448–460.
Martin, M., Wenzel, F., and CALIXTO working group, 2006. High-resolution teleseismic body wave tomography beneath SE-Romania – II. Imaging of a slab detachment scenario. Geophys.J. Int. 164, 579–595.
Mason, P.R.D., Seghedi, I., Szakács, A., Downes, 1998. Magmaticconstraints on geodynamic models of subduction in the EastCarpathians, Romania. Tectonophysics 297, 157–176.
Matenco, L., Bertotti, G., 2000. Tertiary tectonic evolution of the externalEast Carpathians (Romania). Tectonophysics 316, 255–286.
24 F. Hauser et al. / Tectonophysics 430 (2007) 1–25
Matenco, L., Bertotti, G., Cloetingh, S., Dinu, C., 2003. Subsidenceanalysis and tectonic evolution of the external Carpathian–MoesianPlatform region during Neogene times. Sediment. Geol. 156, 71–94.
Morley, C.K., 1996. Models for relative motion of crustal blockswithin the Carpathian region, based on restorations of the outerCarpathian thrust sheets. Tectonics 15, 885–904.
Necea, D., Fielitz, W., Matenco, L., 2005. Late Pliocene–Quaternarytectonic geomorphology along the Putna Valley, East Carpathians,Romania. Tectonophysics 410, 137–156.
Neugebauer, J., Greiner, B., Appel, E., 2001. Kinematics of theAlpine–West Carpathian orogen and palaeogeographic implica-tions. J. Geol. Soc. (Lond.) 158, 97–110.
Oncescu, M.C., 1984. Deep structure of the Vrancea region,Roumania, inferred from simultaneous inversion for hypocentersand 3-D velocity structure. Ann. Geophys. 2 (1), 23–28.
Oncescu, M.C., Bonjer, K.-P., Rizescu, M., 1998. Weak and strongground motion of intermediate depth earthquakes from the Vrancearegion. In: Wenzel, F., Lungu, D., Novak, O. (Eds.), VranceaEarthquakes: Tectonics, Hazard and Risk Mitigation. KluwerAcademic Publishers, Dordrecht, Netherlands, pp. 27–42.
Panea, I., Stephenson, R., Knapp, C., Mocanu, V.v., Drijkonongen, G.,Matenco, L., Knapp, J., Prodehl, C., 2005. Near-vertical seismicreflection image using a novel technique across the Vrancea zoneand Focsani Basin, Romania. Tectonophysics 410, 293–309.
Panaiotu, C.G., Pécskay, Z., Hambach, U., Seghedi, I., Panaiotu, C.E.,Itaya, T., Orleanu, M., Szakács, A., 2004. Short-lived Quaternaryvolcanism in the Perşani Mountains (Romania) revealed by com-bined K–Ar and paleomagnetic data. Geol. Carpath. 55, 333–339.
Pharao, T.C., 1999. Palaeozoic Terranes and their lithosphericboundaries within the Trans-European Suture Zone, TESZ, areview. Tectonophysics 314, 17–41.
Polonic, G., 1996. Structure of the crystalline basement in Romania.Rev. roum. Géophysique 40, 57–70.
Polonic, G., 1998. The structure and morphology of the crystallinebasement in Romania. CERGOP “South Carpathians”monograph,vol. 7 (37), pp. 127–131. Warszawa.
Pompilian, A., Radulescu, F., Diaconescu, M., Bitter, M., Bala, A.,1993. Refraction seismic data in the eastern side of Romania. Rom.Rep. Phys. 7–8, 613–621.
Popescu, M.N., Dragoescu, I., 1987. Maps of recent vertical crustalmovements in Romania: similarities an differences. J. Geodyn. 8,123–136.
Radulescu, F., 1988. Seismic models of the crustal structure in Romania.Rev. Roum. Geol. Geophys. Geogr., Ser. Geophys. 32, 13–17.
Radulescu, F., Diaconescu, M., 1998. Deep seismic data in Romania.CERGOP “South Carpathians” monograph, vol. 7 (37), pp.177–192. Warszawa.
Radulescu, D.P., Sandulescu, M., 1973. The plate-tectonics conceptand the geological structure of the Carpathians. Tectonophysics 16,155–161.
Radulescu, D.P., Cornea, I., Sandulescu, M., Constantinescu, P.,Radulescu, F., Pompilian, A., 1976. Structure de la croute terrestreen Roumanie, Essai d'interpretation des etudes sismiquesprofondes. Anu. Inst. Geol. Geofiz. L (50), 5–36.
Radulescu, F., Nacu, V., Bitter, M., 1998. Geodetic and geodynamicdata on the recent crustal movements. CERGOP “SouthCarpathians” monograph, vol. 7 (37), pp. 231–242. Warszava.
Raileanu, V., 1998. Studiul unor parametri fizici ai litosferei in unelezone din Romania,. Ph.D. Thesis, Inst.Fizica Atomica, Bucharest,232 pp.
Raileanu, V., Diaconescu, C., 1998. Seismic signature in Romaniancrust. Tectonophysics 288, 127–136.
Raileanu, V., Diaconescu, C.C., Radulescu, F., 1994. Characteristics ofRomanian lithosphere from deep seismic reflection profiling.Tectonophysics 239, 165–185.
Raileanu, V., Bala, A., Hauser, F., Prodehl, C., Fielitz, W., 2005.Crustal properties from S-wave and gravity data along a seismicrefraction profile in Romania. Tectonophysics 410, 251–272.
Royden, L.H., 1988. Late Cenozoic tectonics of the Pannonian basinsystem. In: Royden, L.H., Horvath, F. (Eds.), The PannonianBasin, a study in basin evolution. AAPG Memoir, vol. 45, pp.27–48.
Sanders, C.A.E., Andriessen, P.A.M., Cloetingh, S.A.P.L., 1999. Lifecycle of the East Carpathian orogen: erosion history of a doublyvergent critical wedge assessed by fission track thermochronology.J. Geophys. Res. 104, 29095–29112.
Sandulescu, M., 1984. Geotectonics of Romania. Technical PublishingHouse, Bucharest. 336 pp. (in Romanian).
Sandulescu, M., 1988. Cenozoic tectonic history of the Carpathians.In: Royden, L.H., Horvath, F. (Eds.), The Pannonian Basin, aStudy in Basin Evolution. AAPG Mem., vol. 45, pp. 17–25.
Seghedi, A., 1998. The Romanian Carpathian foreland. CERGOP“South Carpathians” monograph, vol. 7 (37), pp. 21–48. Warszawa.
Seghedi, I., Szakács, A., 1994. The Upper Pliocene–Pleistoceneeffusive and explosive basaltic volcanism from the PerşaniMountains. Rom. J. Petrol. 76, 101–107 Bucureşti.
Seghedi, I., Balintoni, I., Szakacs, A., 1998. Interplay of tectonics andneogene post-collisional magmatism in the intracarpathian region.Lithos 45, 483–497.
Sperner, B., Lorenz, F., Bonjer, K., Hettel, S., Mueller, B., Wenzel, F.,2001. Slab break-off-abrupt cut or gradual detachment? Newinsights from the Vrancea region (SE Carpathians, Romania). TerraNova 13, 172–179.
Sperner, B., Ratschbacher, L., Nemčok, M., 2002. Interplay betweensubduction retreat and lateral extrusion: tectonics of the WesternCarpathians. Tectonics 21 (6), 1051. doi:10.1029/TC901028.
Stammler, K., 1994. SeismicHandler — programmable multichanneldata handler for interactive and automatic processing of seismo-logical data. Comput. Geosci. 19 (2), 135–140.
Stampfli, G.M., Mosar, J., Marquer, D., Marchant, R., Baudin, T.,Borel, G., 1998. Subduction and obduction processes in the SwissAlps. Tectonophysics 296, 159–204.
Stanica, D., Stanica, M., 1998. 2D modelling of the geoelectricstructure in the area of the deep-focus Vrancea earthquakes.CERGOP “South Carpathians” monograph, vol. 7 (37), pp.193–203. Warszawa.
Stefanescu, M., andWorking Group,1985. Geological cross sections atscale 1 : 200,000 A14-A20 and D1. Inst. Geol. Geofiz., Bucharest.
Szakács, A., Seghedi, I., 1995. The Calimani–Gurghiu–Harghitavolcanic chain, East Carpathians, Romania: volcanologicalfeatures. Acta Vulcanol. 7 (2), 145–155.
Szakács, A., Seghedi, I., 1996. Volcaniclastic sequences aroundandesitic stratovolcanoes, East Carpathians, Romania. Rom. J.Petrol. 77 (Suppl. 1), 1–55.
Tari, G., Dicea, O., Faulkerson, J., Georgiev, G., Popov, S., Stefanescu,M., Weir, G., 1997. Cimmerian and Alpine Stratigraphy andStructural Evolution of the Moesian Platform (Romania/Bulgaria).In: Robinson, A.G. (Ed.), Regional and petroleum geology of theBlack Sea and surrounding region. AAPG Memoir, vol. 68, pp.63–90.
Tarapoanca, M., Bertotti, G., Matenco, L., Dinu, C., Cloetingh, S.A.P.L.,2003. Architecture of the Focsani Depression: a 13 km deep basin inthe Carpathians bend zone (Romania). Tectonics 22/6, 1074.doi:10.1029/2002TC001486.
25F. Hauser et al. / Tectonophysics 430 (2007) 1–25
Visarion, M., 1998. Gravity anomalies on the Romanian territory.CERGOP “South Carpathians” monograph, vol. 7 (37), pp.133–138. Warszawa.
Visarion, M., Sandulescu, M., Stanica, D., Veliciu, S., 1988.Contributions a la connaissance de la structure profonde de laplatforme Moesienne en Roumanie. Stud. Teh. Econ. - Inst. Geol.,Ser. D Prospect. Geofiz. 15, 211–222.
Wenzel, F., 1997. Strong Earthquakes: a challenge for geosciences andcivil engineering — a new Collaborative Research Center inGermany. Seismol. Res. Lett. 68, 438–443.
Wenzel, F., Lungu, D., Novak, O. (Eds.), 1998a. Vrancea Earthquakes:Tectonics, Hazard and Risk Mitigation. Selected papers of the FirstInternational Workshop on Vrancea Earthquakes, Bucharest,November 1–4, 1997. Kluwer Academic Publishers, Dordrecht,Netherlands. 374 pp.
Wenzel, F., Achauer, U., Enescu, D., Kissling, E., Russo, R., Mocanu,V., Mussachio, G., 1998b. The final stage of plate detachment;International tomographic experiment in Romania aims to a high-resolution snapshot of this process. EOS 79 (589), 592–594.
Wortel, R., Spakman, W., 2000. Subduction and slab detachment in theMediterranean–Carpathian region. Science 290, 1910–1917.
Zelt, C.A., Smith, R.B., 1992. Seismic traveltime inversion for 2-Dcrustal velocity structure. Geophys. J. Int. 108, 16–34.
Zugrăvescu, D., Polonic, G., Horomnea, M., Dragomir, V., 1998.Recent vertical crustal movements on the Romanian territory,major tectonic compartments and their relative dynamics. Rev.roum. Géophysique 42, 3–14.
Zweigel, P., Ratschbacher, L., Frisch, W., 1998. Kinematics of anarcuate fold-thrust belt: the southern East Carpathians (Romania).Tectonophysics 297, 177–207.