seismic assessment of evin-valley bridge by 3-d … in drain 3dx computer programme using a...
TRANSCRIPT

Seismic Assessment of Evin-Valley Bridge by 3-D Inelastic Dynamic Analysis
JSEE: Spring 2003, Vol. 5, No. 1 / 1
Fakhredin Danesh1 and Iraj Rahimi2
1. Assistant Professor, K.N. Toosi University of Technology, Tehran, Iran, P.O. Box15875-4416, email: [email protected]
2. Former Graduate Student of Earthquake Engineering, No. 25, 12th Street, KuyeAghajari, Ahvaz, Iran, email: [email protected]
ABSTRACT: Major damage was observed mostly in the older bridgestructures in the Northridge (1994), Kobe (1995) and Taiwan (1999)earthquakes. The most extensive damage included flexural/shearfailure of substructure members and superstructure unseating atsimple supports or expansion joints. In general, similar types ofdamages demonstrate a similar nature in view of the seismic behaviorof older bridge design in all three earthquakes. As modern bridgeshave not been significantly affected during the recent ground motions,no reliable judgment could be made on the seismic performance ofmodern bridges structures.The seismic performance of Evin-ValleyBridge, a newly built slab-on-girder bridge is investigated analyticallyat the damage control limit state. A 3-D model of the bridge wasbuilt in DRAIN 3DX computer programme using a fiber-sectionbeam-column element to represent inelastic behavior of RCsubstructure members. Elastomeric bearing pads, shear keys,expansion joints and the abutment backwalls were included inmodeling of cyclic behavior of each component. The superstructuregirder-beams were assumed to remain elastic and compressive elasticsprings were used to represent the soil effect. A free vibration analysisof the multiple-part structure, assuming open gaps and expansionjoints, showed the combined influence of a broad number of modes ofvibration in dynamic response of the bridge. However, since the gapsare predicted to frequently close and reopen under earthquake forces,such results should not be relied on predicting of the seismic response.The results obtained from dynamic analyses using the Naghan (1977),the Northridge (1994) and the Kobe (1995) acceleration records showthat the seismic demand values in the substructure elements are muchless than the existing member capacities. The results also indicate thatthe dynamic response values are not comparable with the earthquakedemands obtained from the equivalent static method and a largedifference is observed between the results of two methods.
Keywords: Bridge damages; Bridge modeling; Fiber elements;Inelastic analysis; DRAIN-3DX
Seismic Assessment of Evin-Valley Bridge by 3-D
Inelastic Dynamic Analysis
1. Introduction
Essential shortcoming in the old seismic designapproach of bridge structures has been demonstratedrepeatedly by the experience of large earthquakeswithin the last decade around the world. After SanFernando, California, 1971 earthquake, which causedextensive damage to highway bridges a great deal ofchanges have been made into the bridge seismic design
specifications. Such improvements were reasonablybased on the observed defects in the damagedcomponents.
During the major ground motions occurred withinthe last two decades, numerous bridges older than 20to 30 years were strongly moved so that the structuraldeficiencies were clearly revealed. But new bridge

2 / JSEE: Spring 2003, Vol. 5, No. 1
F. Danesh and I. Rahimi
structures designed according to the modern seismicdesign codes were rarely found within the strongshaking areas; so it has not become feasible yetto empirically certify the appropriate seismicperformance of modern bridge structures. Untilsuch experience to be achieved, theoretical analysesare the only remaining tool.
In this research the authors tried to evaluateanalytically the seismic performance of a newly builtbridge based on the damage control limit state criteria.Such criteria allow a larger safety margin for theassessment of existing structures than for the designof new ones. Investigation for any probable flaws inthe existing bridge was oriented with regard to thefailures observed in the recent strong motion events.
The structure is idealized as a 3-dimensionalmass-spring-damper model using the computerprogram DRAIN-3DX [12, 13]. Several elements areimplemented in this program, which may be used tomodel various components of a bridge structure. Theseinclude a relatively powerful fiber-section beam-column element with distributed plasticity, suitablefor reinforced concrete frame members. It is capableof representing various characteristics of RCmembers including cyclic strength decay, stiffnessdegradation, axial force-biaxial bending interactionand elastic shear behavior.
2. Seismic Damage to Bridges
A great number of bridges was suffered from theevent of the Northridge, California, 1994 earthquake.Five bridges were collapsed due to the failure ofcolumns or superstructure unseating; four onesdamaged severely due to flexural hinging or shearfailure of columns or typically flexural failure of thesuperstructure; seven bridges were experiencedmoderate damage consisting of cover concretespalling, fracture of joint restrainers, abutmentdamage, crushing of shear keys, etc. [6, 9]. In a similarway many bridges were damaged in the Kobeearthquake, 1995. Other than transverse overturningof a 635-m length of Hanshin elevated expressway,numerous massive RC bridge columns were damagedseriously due to flexural hinging or severe shearcracking. Poor construction has been reported to bethe main cause of damage in several bridges. In thisevent, unseating of superstructures most oftenoccurred after fracturing of joint restrainers, failureof bearing devices or rigid-body movement of the bentsdue to the soil liquefaction or lateral spreading. Inaddition, several steel bridge substructures within theKobe area were suffered from this event detecting
wall/panel buckling of box-section columns whichinitiated at corner welds or other points of discontinuity[2, 1, 10]. Frequent collapse or severe damage to RCcolumns was observed also in Ji-Ji, Taiwan, 1999earthquake. The most dramatic damage due to thisground motion was the chain-like falling down of thesimply supported spans in a great number of bridgeswhere no restraint was provided against longitudinalor transverse movement [7].
In all three events, the reason of collapsed orsignificantly damaged bridges is that all the structureswere designed according to former codes. The columnfailure is reported to be mainly due to low lateralconfinement or poor anchorage of reinforcementswhich imply insufficient flexural ductility, unreliableflexural strength or low shear strength. Uncertaintieshave been expressed on the probable influence of thevertical component of the ground motions in majordamage observed in some bridge columns due toshear-axial force interaction [11]. Unseating ofsuperstructure at simple supports is assigned toinsufficient seat length or lack of restrainingagainst horizontal movement both in transverseand longitudinal directions.
The reader may refer to Rahimi [16] for a completereview and classification of the damage caused by therecent-decade earthquakes in different bridgecomponents. Besides to the observed local defects suchas inadequate shear strength, it seems that a majorshortcoming in the older bridges is the inappropriatedistribution and transfer of induced forces betweenthe different components of the structure. An exampleis the absorption of a large shear force to the shortend columns or collapse of the superstructure afterfailure of a primary member of the substructure. Thisrequires an essential revision of the design philosophyof the whole structure.
Based on the above description of the structuralperformance of bridges during the recent earthquakesin the following investigation, it is tried to evaluate theresponse of the substructure members as the majorenergy-dissipating component of the bridge. Inaddition, possible loss of support at simple supportsof the existing superstructure will be of interest.
3. Description of Evin-Valley Bridge
The structure under consideration is a slab-on-girderhighway bridge at north of Tehran crossing the EvinValley in the east-west direction. The bridge wasdesigned according to AASHTO-1991 specificationsand was opened in October 1999. Figure (1) provides
Seismic Assessment of Evin-Valley Bridge by 3-D Inelastic Dynamic Analysis
JSEE: Spring 2003, Vol. 5, No. 1 / 3
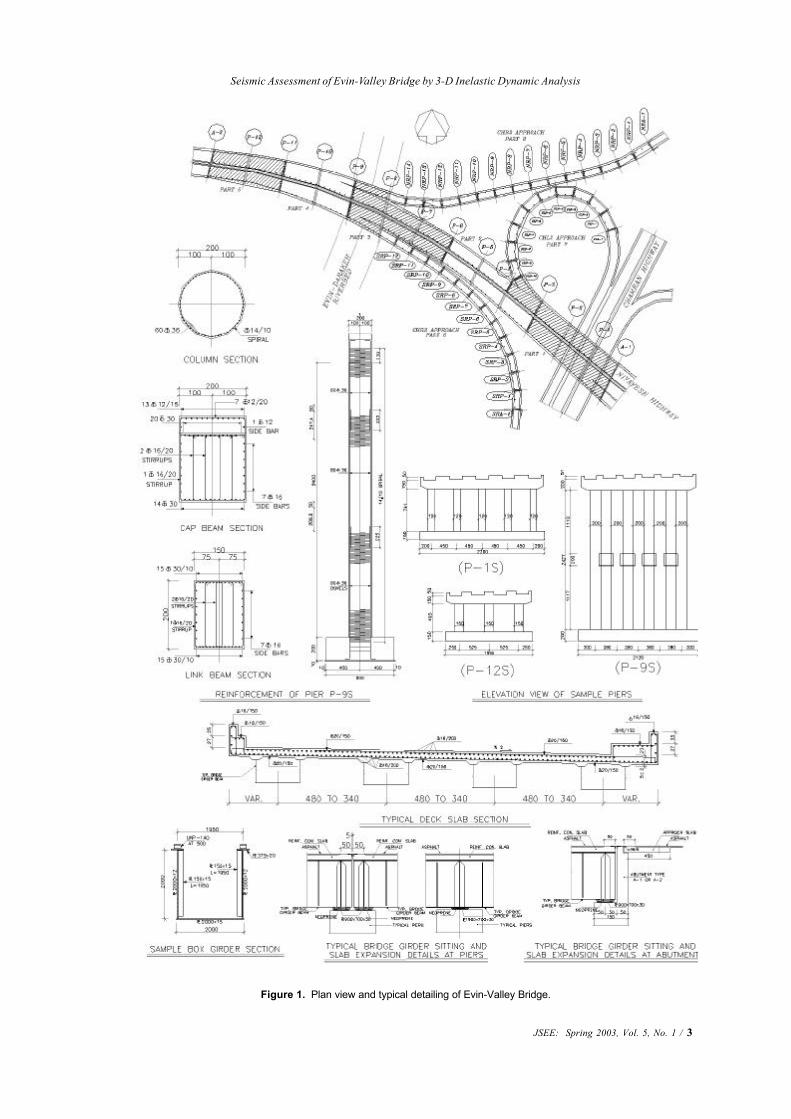
Figure 1. Plan view and typical detailing of Evin-Valley Bridge.
4 / JSEE: Spring 2003, Vol. 5, No. 1
F. Danesh and I. Rahimi
a plan of the intersection and typical detailing of thebridge. It consists of two adjacent structures, 2.5mapart. The north structure includes a main lane attachedto a ramp-way and a loop-way connecting the bridgeto the Chamran highway. The south one comprise ofa main lane and an access ramp-way southward.Abutments of the north and south main lanes restadjacent to each other. As in this research, only thesouth structure is modeled separately, a shortdescription of the different components is presented.Each of the 13 spans of the main lane is approximately40 m long while the ramp-way includes 13 spans ofnearly 20m length. Substructure consists of multi-column RC bents with cap beams. A link beam is addedat mid-height of the columns in tall bents. Table (1)summarizes dimensions of the bent members alongwith the reinforcement of column sections. All columnsare transversely reinforced by a F14-bar spiral of10cm pitch.
The superstructure constitutes of compositesteel-concrete box girder beams. Steel U shapedsections are 2m wide, 2m deep in the main-lane spansand 1m deep in the ramp-way spans. Constant RCslab thickness is 20cm. 5cm-wide expansion jointsare provided at P-3S, P 6S, P 9S and P 11S; girderscontinuously sit on the other bents. All ramp-wayspans are simply supported. All abutments are ofthe simple seat type. Elastomeric bearing pads areprovided at all supports in the main lane but girder
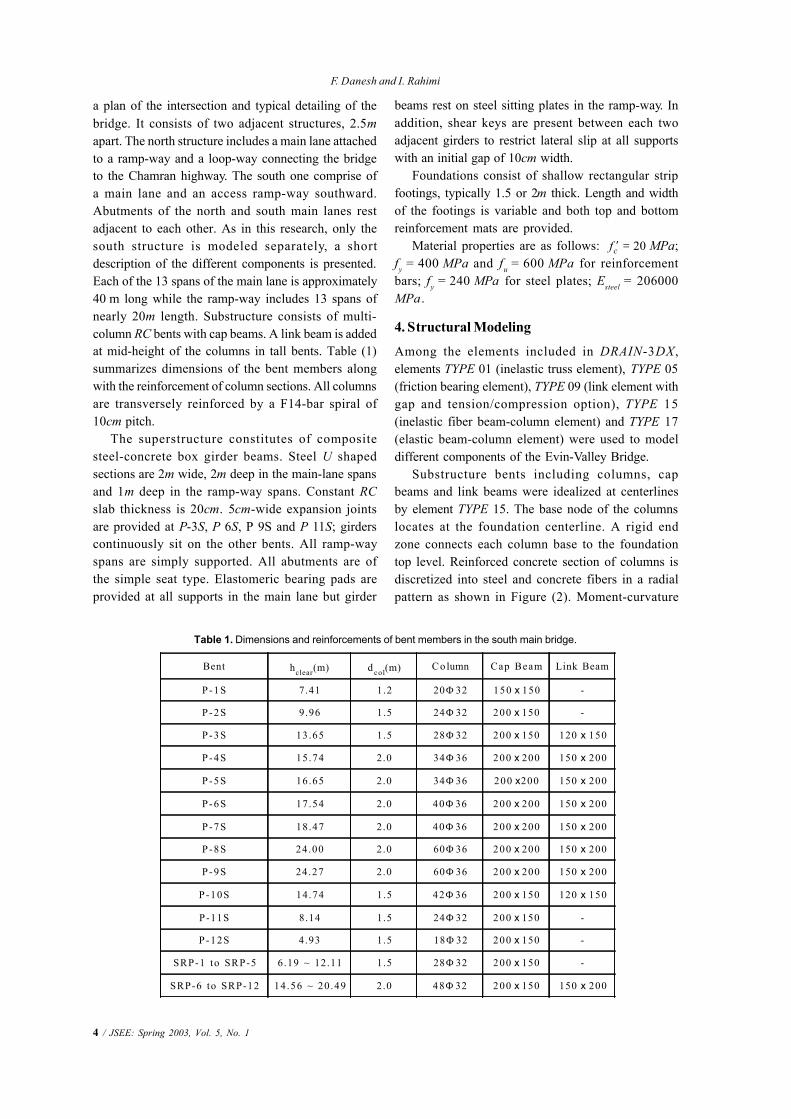
Table 1. Dimensions and reinforcements of bent members in the south main bridge.
beams rest on steel sitting plates in the ramp-way. Inaddition, shear keys are present between each twoadjacent girders to restrict lateral slip at all supportswith an initial gap of 10cm width.
Foundations consist of shallow rectangular stripfootings, typically 1.5 or 2m thick. Length and widthof the footings is variable and both top and bottomreinforcement mats are provided.
Material properties are as follows: 20=′cf MPa;fy = 400 MPa and fu = 600 MPa for reinforcementbars; fy = 240 MPa for steel plates; Esteel = 206000MPa .
4. Structural Modeling
Among the elements included in DRAIN-3DX ,elements TYPE 01 (inelastic truss element), TYPE 05(friction bearing element), TYPE 09 (link element withgap and tension/compression option), TYPE 15(inelastic fiber beam-column element) and TYPE 17(elastic beam-column element) were used to modeldifferent components of the Evin-Valley Bridge.
Substructure bents including columns, capbeams and link beams were idealized at centerlinesby element TYPE 15. The base node of the columnslocates at the foundation centerline. A rigid endzone connects each column base to the foundationtop level. Reinforced concrete section of columns isdiscretized into steel and concrete fibers in a radialpattern as shown in Figure (2). Moment-curvature
Bent hclear(m) d col(m) Co lumn Cap Beam Link Beam
P-1S 7.41 1.2 20Φ 32 150 x 150 -
P-2S 9.96 1.5 24Φ 32 200 x 150 -
P-3S 13.65 1.5 28Φ 32 200 x 150 120 x 150
P-4S 15.74 2.0 34Φ 36 200 x 200 150 x 200
P-5S 16.65 2.0 34Φ 36 200 x200 150 x 200
P-6S 17.54 2.0 40Φ 36 200 x 200 150 x 200
P-7S 18.47 2.0 40Φ 36 200 x 200 150 x 200
P-8S 24.00 2.0 60Φ 36 200 x 200 150 x 200
P-9S 24.27 2.0 60Φ 36 200 x 200 150 x 200
P-10S 14.74 1.5 42Φ 36 200 x 150 120 x 150
P-11S 8.14 1.5 24Φ 32 200 x 150 -
P-12S 4.93 1.5 18Φ 32 200 x 150 -
SRP-1 to SRP-5 6.19 ~ 12.11 1.5 28Φ 32 200 x 150 -
SRP-6 to SRP-12 14.56 ~ 20 .49 2.0 48Φ 32 200 x 150 150 x 200
Seismic Assessment of Evin-Valley Bridge by 3-D Inelastic Dynamic Analysis
JSEE: Spring 2003, Vol. 5, No. 1 / 5
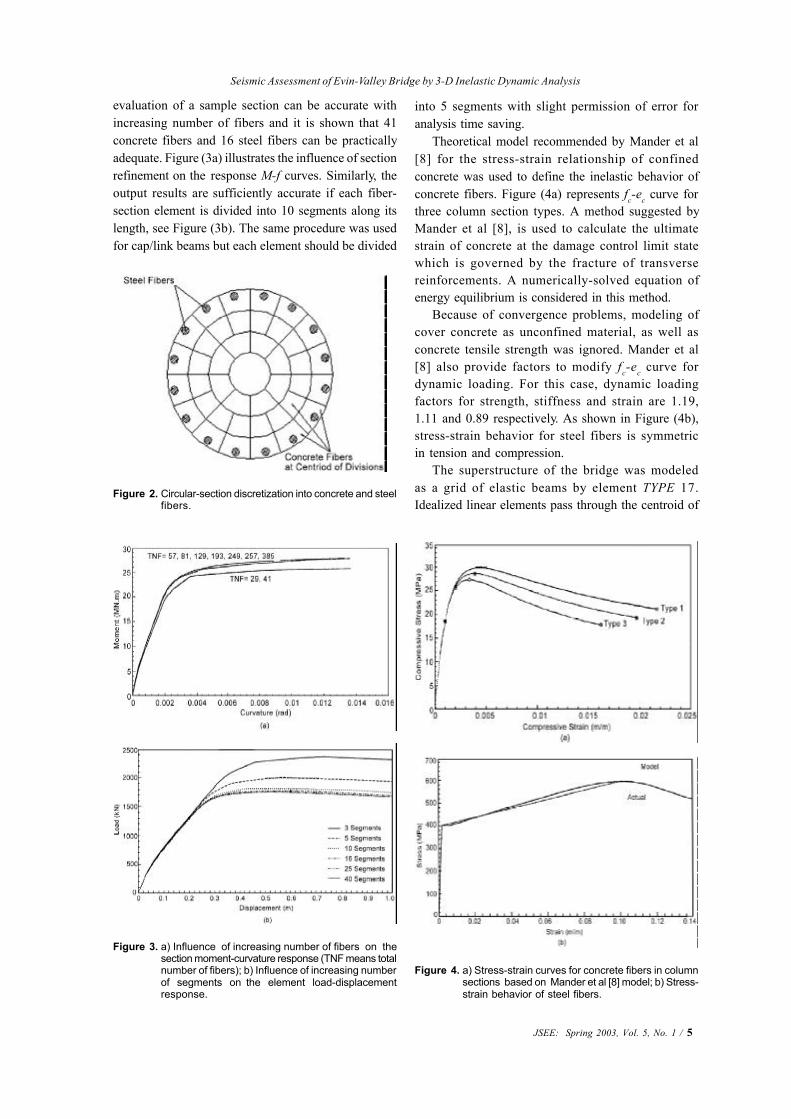
Figure 2. Circular-section discretization into concrete and steelfibers.
evaluation of a sample section can be accurate withincreasing number of fibers and it is shown that 41concrete fibers and 16 steel fibers can be practicallyadequate. Figure (3a) illustrates the influence of sectionrefinement on the response M-f curves. Similarly, theoutput results are sufficiently accurate if each fiber-section element is divided into 10 segments along itslength, see Figure (3b). The same procedure was usedfor cap/link beams but each element should be divided
Figure 4. a) Stress-strain curves for concrete fibers in columnsections based on Mander et al [8] model; b) Stress-strain behavior of steel fibers.
Figure 3. a) Influence of increasing number of fibers on thesection moment-curvature response (TNF means totalnumber of fibers); b) Influence of increasing numberof segments on the element load-displacementresponse.
into 5 segments with slight permission of error foranalysis time saving.
Theoretical model recommended by Mander et al[8] for the stress-strain relationship of confinedconcrete was used to define the inelastic behavior ofconcrete fibers. Figure (4a) represents fc-ec curve forthree column section types. A method suggested byMander et al [8], is used to calculate the ultimatestrain of concrete at the damage control limit statewhich is governed by the fracture of transversereinforcements. A numerically-solved equation ofenergy equilibrium is considered in this method.
Because of convergence problems, modeling ofcover concrete as unconfined material, as well asconcrete tensile strength was ignored. Mander et al[8] also provide factors to modify fc-ec curve fordynamic loading. For this case, dynamic loadingfactors for strength, stiffness and strain are 1.19,1.11 and 0.89 respectively. As shown in Figure (4b),stress-strain behavior for steel fibers is symmetricin tension and compression.
The superstructure of the bridge was modeledas a grid of elastic beams by element TYPE 17.Idealized linear elements pass through the centroid of

6 / JSEE: Spring 2003, Vol. 5, No. 1
F. Danesh and I. Rahimi
longitudinal girder beam sections. Transverse beamsrepresenting bending stiffness of the concrete slabbetween adjacent girder beams spaced at 0.2 l (l = spanlength) in the main lane spans and 0.25 l in theramp-way spans. At expansion joints, element TYPE09 were used to represent the effect of poundingwhen the initial gap is closed. Stiffness of suchelements after gap closing was assumed identicalto the elastic axial stiffness of the RC slab.
The elastomeric bearing pads and the shear keyswere idealized, as outlined in Figure (5), usingelement TYPE 05 and TYPE 09 respectively.Element TYPE 05 has two components: a bearingcomponent and a friction component. For simplicity,all shear keys at a support were collectivelyrepresented by two elements. Shear capacity of eachelement is the total value of all keys at a support
∑µ= syskey AfIV where shear stress reduction
factor 1=sf and Coulomb friction coefficient4.1=Π are assumed. ∑ sA is the total area of the bars
dowelled into the underlying cap beam.The element TYPE 09 was used for modeling
of the effect of the passive soil pressure behindthe abutments on the seismic response of the bridgewhen the initial gap between the superstructure andthe abutment backwall is closed. For the abutmentsA-1S, A-2S, and SRA-1, the nonlinear change of soilpressure after gap closing was based on theMaroney-Chai dimensionless curve [14] as illustratedin Figure (6).
Equivalent elastic springs idealize soil responseeffects on the structure. The proposed model ofChen [5] was used to calculate spring constants.Neglecting the effect of the rotational modes offoundation vibration, translational springs weredefined parallel to the local coordinates of each bent.Element TYPE 09 was used to model the soil springsresponding only in compression; a gap will open undertension. A perspective view of the finalized model isshown in Figure (7).
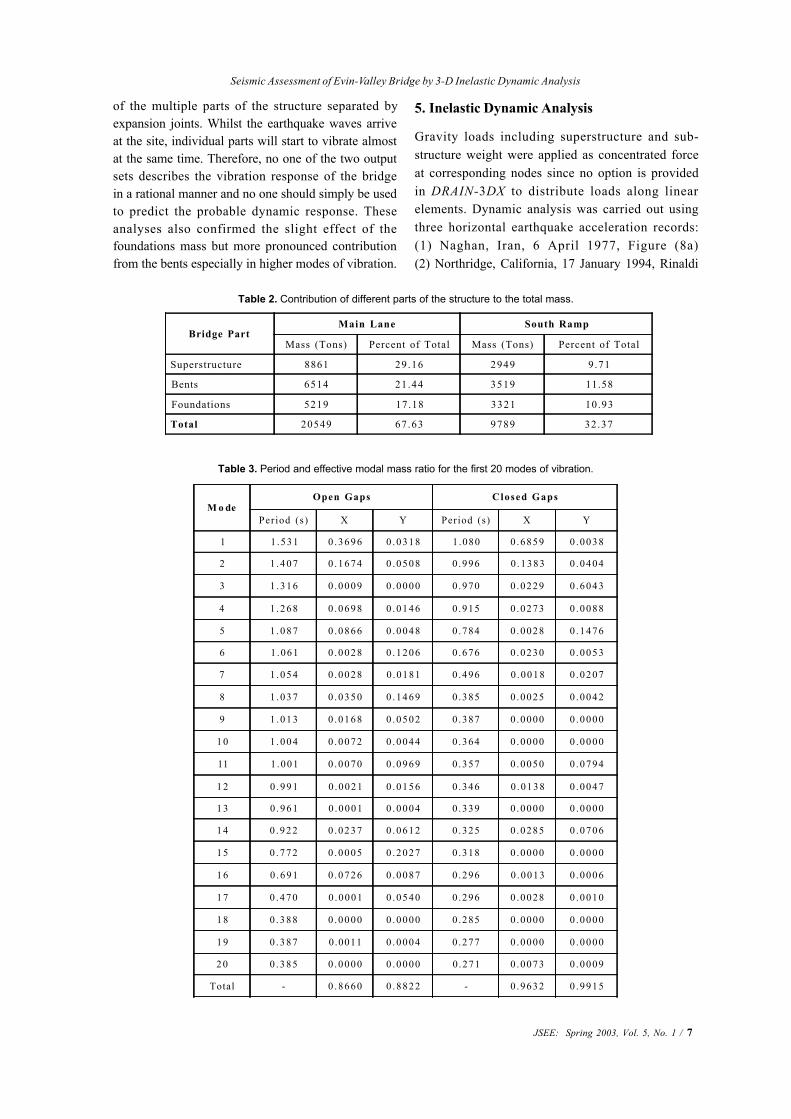
Structural mass within superstructure, bentmembers and foundations was lumped at thecorresponding nodes. Table (2) summarizes thestructural mass data. Free vibration analysis of themodel assuming open gaps resulted in a broad numberof effective modes of vibration with the firstpredominant modes in the global X and Y directionscontributing only 36% and 12% respectively. Anotheranalysis with closed gaps resulted in much differentvalues for periods and the effective modal massratios as compared in Table (3) for the first 20 modesof vibration where the governing modes in two
Figure 5. Modeling of the bearing systems and soil effects.
Figure 6. Load-displacement behavior of abutment backwallsprings.
Figure 7. A perspective view of the assembled model.
orthogonal directions contribute 68% and 60%respectively. At the beginning of seismic response,all gaps are open but gap closing seems to occurfrequently under seismic loading. While a structure-state with all closed gaps does not seem to be a matterof reality, free vibration analysis of the open-gapstructure just sorts the independent modes of vibration
Seismic Assessment of Evin-Valley Bridge by 3-D Inelastic Dynamic Analysis
JSEE: Spring 2003, Vol. 5, No. 1 / 7
Bridge PartMain Lane South Ramp
Mass (Tons) Percent of Total Mass (Tons) Percent of Total
Superstructure 8861 29.16 2949 9.71
Bents 6514 21.44 3519 11.58
Foundations 5219 17.18 3321 10.93
Total 20549 67.63 9789 32.37
M o deOpen Gaps Closed Gaps
Period (s) X Y Period (s) X Y
1 1 .531 0 .3696 0 .0318 1 .080 0 .6859 0 .0038
2 1 . 4 0 7 0 .1674 0 .0508 0 .996 0 .1383 0 .0404
3 1 . 3 1 6 0 .0009 0 .0000 0 .970 0 .0229 0 .6043
4 1 . 2 6 8 0 .0698 0 .0146 0 .915 0 .0273 0 .0088
5 1 . 0 8 7 0 .0866 0 .0048 0 .784 0 .0028 0 .1476
6 1 .061 0 .0028 0 .1206 0 .676 0 .0230 0 .0053
7 1 . 0 5 4 0 .0028 0 .0181 0 .496 0 .0018 0 .0207
8 1 . 0 3 7 0 .0350 0 .1469 0 .385 0 .0025 0 .0042
9 1 . 0 1 3 0 .0168 0 .0502 0 .387 0 .0000 0 .0000
1 0 1 . 0 0 4 0 .0072 0 .0044 0 .364 0 .0000 0 .0000
11 1 .001 0 .0070 0 .0969 0 .357 0 .0050 0 .0794
1 2 0 . 9 9 1 0 .0021 0 .0156 0 .346 0 .0138 0 .0047
1 3 0 . 9 6 1 0 .0001 0 .0004 0 .339 0 .0000 0 .0000
1 4 0 . 9 2 2 0 .0237 0 .0612 0 .325 0 .0285 0 .0706
1 5 0 . 7 7 2 0 .0005 0 .2027 0 .318 0 .0000 0 .0000
1 6 0 . 6 9 1 0 .0726 0 .0087 0 .296 0 .0013 0 .0006
1 7 0 . 4 7 0 0 .0001 0 .0540 0 .296 0 .0028 0 .0010
1 8 0 . 3 8 8 0 .0000 0 .0000 0 .285 0 .0000 0 .0000
1 9 0 . 3 8 7 0.0011 0 .0004 0 .277 0 .0000 0 .0000
2 0 0 . 3 8 5 0 .0000 0 .0000 0 .271 0 .0073 0 .0009
Total - 0 .8660 0 .8822 - 0 .9632 0 .9915
Table 2. Contribution of different parts of the structure to the total mass.
Table 3. Period and effective modal mass ratio for the first 20 modes of vibration.
of the multiple parts of the structure separated byexpansion joints. Whilst the earthquake waves arriveat the site, individual parts will start to vibrate almostat the same time. Therefore, no one of the two outputsets describes the vibration response of the bridgein a rational manner and no one should simply be usedto predict the probable dynamic response. Theseanalyses also confirmed the slight effect of thefoundations mass but more pronounced contributionfrom the bents especially in higher modes of vibration.
5. Inelastic Dynamic Analysis
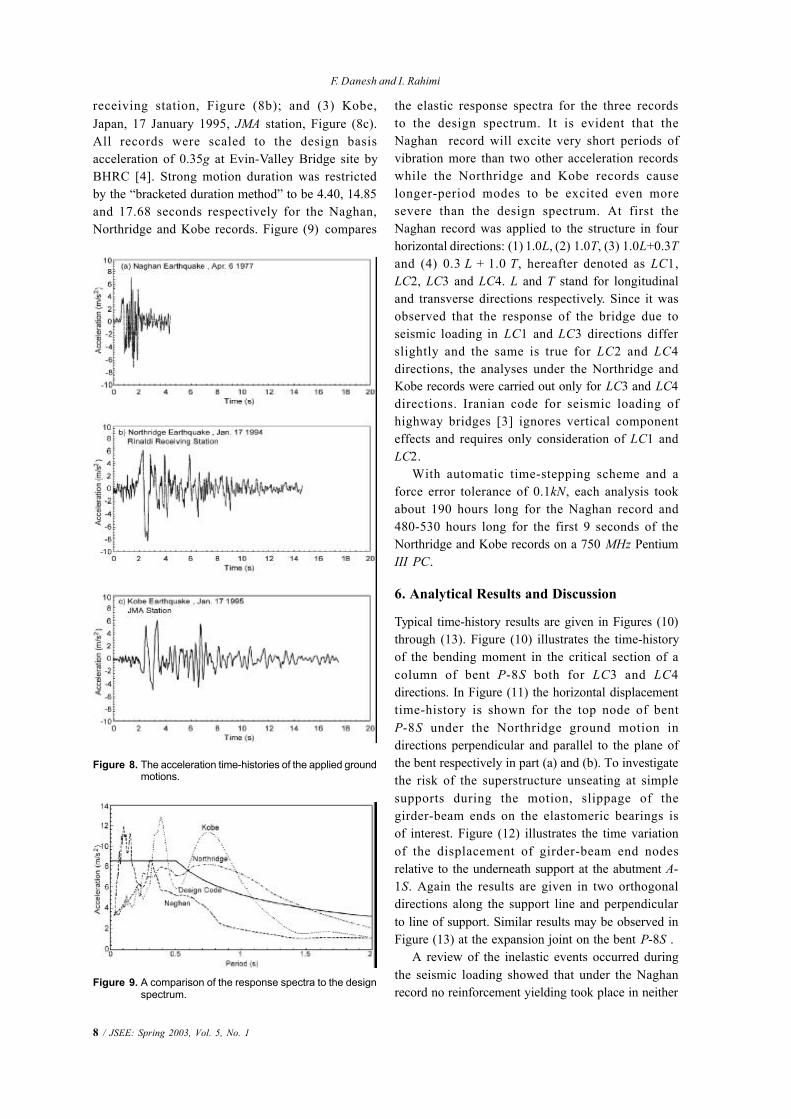
Gravity loads including superstructure and sub-structure weight were applied as concentrated forceat corresponding nodes since no option is providedin DRAIN-3DX to distribute loads along linearelements. Dynamic analysis was carried out usingthree horizontal earthquake acceleration records:(1) Naghan, Iran, 6 April 1977, Figure (8a)(2) Northridge, California, 17 January 1994, Rinaldi
8 / JSEE: Spring 2003, Vol. 5, No. 1
F. Danesh and I. Rahimi
Figure 9. A comparison of the response spectra to the designspectrum.
Figure 8. The acceleration time-histories of the applied groundmotions.
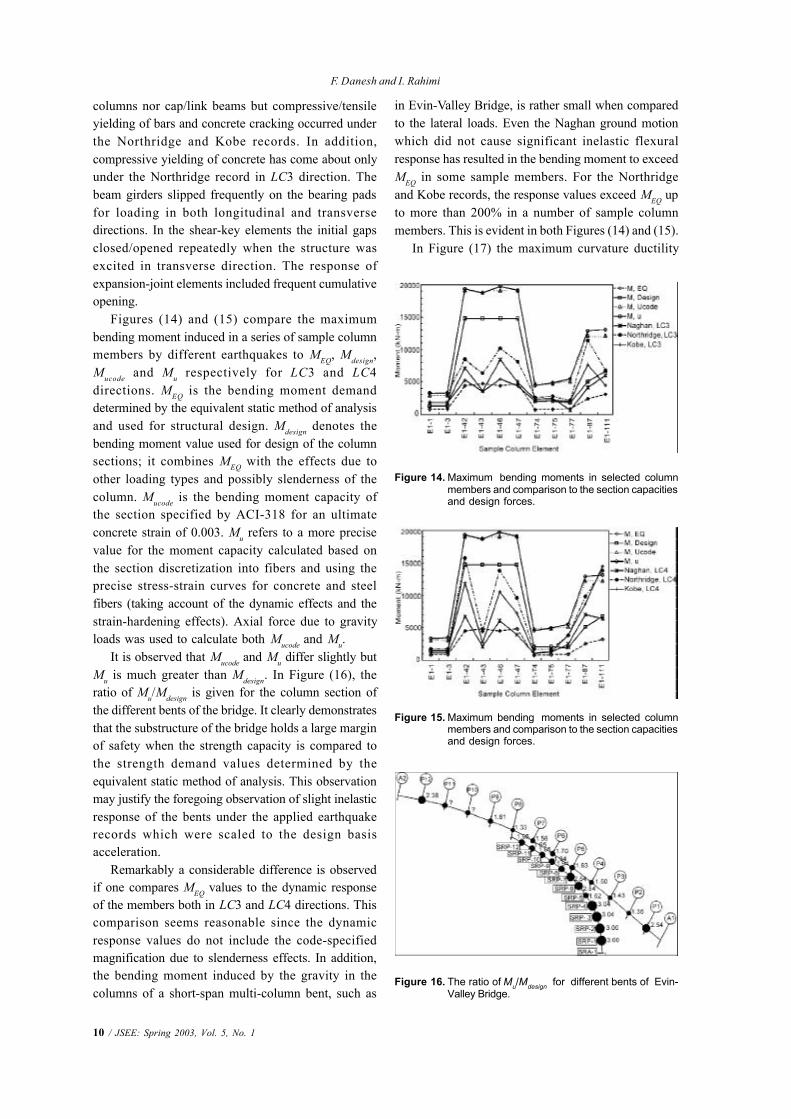
receiving station, Figure (8b); and (3) Kobe,Japan, 17 January 1995, JMA station, Figure (8c).All records were scaled to the design basisacceleration of 0.35g at Evin-Valley Bridge site byBHRC [4]. Strong motion duration was restrictedby the “bracketed duration method” to be 4.40, 14.85and 17.68 seconds respectively for the Naghan,Northridge and Kobe records. Figure (9) compares
the elastic response spectra for the three recordsto the design spectrum. It is evident that theNaghan record will excite very short periods ofvibration more than two other acceleration recordswhile the Northridge and Kobe records causelonger-period modes to be excited even moresevere than the design spectrum. At first theNaghan record was applied to the structure in fourhorizontal directions: (1) 1.0L, (2) 1.0T, (3) 1.0L+0.3Tand (4) 0.3 L + 1.0 T, hereafter denoted as LC1,LC2, LC3 and LC4. L and T stand for longitudinaland transverse directions respectively. Since it wasobserved that the response of the bridge due toseismic loading in LC1 and LC3 directions differslightly and the same is true for LC2 and LC4directions, the analyses under the Northridge andKobe records were carried out only for LC3 and LC4directions. Iranian code for seismic loading ofhighway bridges [3] ignores vertical componenteffects and requires only consideration of LC1 andLC2.
With automatic time-stepping scheme and aforce error tolerance of 0.1kN, each analysis tookabout 190 hours long for the Naghan record and480-530 hours long for the first 9 seconds of theNorthridge and Kobe records on a 750 MHz PentiumIII PC.
6. Analytical Results and Discussion
Typical time-history results are given in Figures (10)through (13). Figure (10) illustrates the time-historyof the bending moment in the critical section of acolumn of bent P-8S both for LC3 and LC4directions. In Figure (11) the horizontal displacementtime-history is shown for the top node of bentP-8S under the Northridge ground motion indirections perpendicular and parallel to the plane ofthe bent respectively in part (a) and (b). To investigatethe risk of the superstructure unseating at simplesupports during the motion, slippage of thegirder-beam ends on the elastomeric bearings isof interest. Figure (12) illustrates the time variationof the displacement of girder-beam end nodesrelative to the underneath support at the abutment A-1S. Again the results are given in two orthogonaldirections along the support line and perpendicularto line of support. Similar results may be observed inFigure (13) at the expansion joint on the bent P-8S .
A review of the inelastic events occurred duringthe seismic loading showed that under the Naghanrecord no reinforcement yielding took place in neither

Seismic Assessment of Evin-Valley Bridge by 3-D Inelastic Dynamic Analysis
JSEE: Spring 2003, Vol. 5, No. 1 / 9
Figure 11. Time variation of the displacement at the top of thebent P-8S under the Northridge ground motion.
Figure 10. Time variation of the bending moment in a columnof bent P-8S.
Figure 13. Time variation of the girder-beam end slippage atthe joint on the bent P-8S.
Figure 12. Time variation of the girder-beam end slippage atthe abutment A-1S.
10 / JSEE: Spring 2003, Vol. 5, No. 1
F. Danesh and I. Rahimi
columns nor cap/link beams but compressive/tensileyielding of bars and concrete cracking occurred underthe Northridge and Kobe records. In addition,compressive yielding of concrete has come about onlyunder the Northridge record in LC3 direction. Thebeam girders slipped frequently on the bearing padsfor loading in both longitudinal and transversedirections. In the shear-key elements the initial gapsclosed/opened repeatedly when the structure wasexcited in transverse direction. The response ofexpansion-joint elements included frequent cumulativeopening.
Figures (14) and (15) compare the maximumbending moment induced in a series of sample columnmembers by different earthquakes to MEQ, Mdesign,Mucode and Mu respectively for LC3 and LC4directions. MEQ is the bending moment demanddetermined by the equivalent static method of analysisand used for structural design. Mdesign denotes thebending moment value used for design of the columnsections; it combines MEQ with the effects due toother loading types and possibly slenderness of thecolumn. Mucode is the bending moment capacity ofthe section specified by ACI-318 for an ultimateconcrete strain of 0.003. Mu refers to a more precisevalue for the moment capacity calculated based onthe section discretization into fibers and using theprecise stress-strain curves for concrete and steelfibers (taking account of the dynamic effects and thestrain-hardening effects). Axial force due to gravityloads was used to calculate both Mucode and Mu.
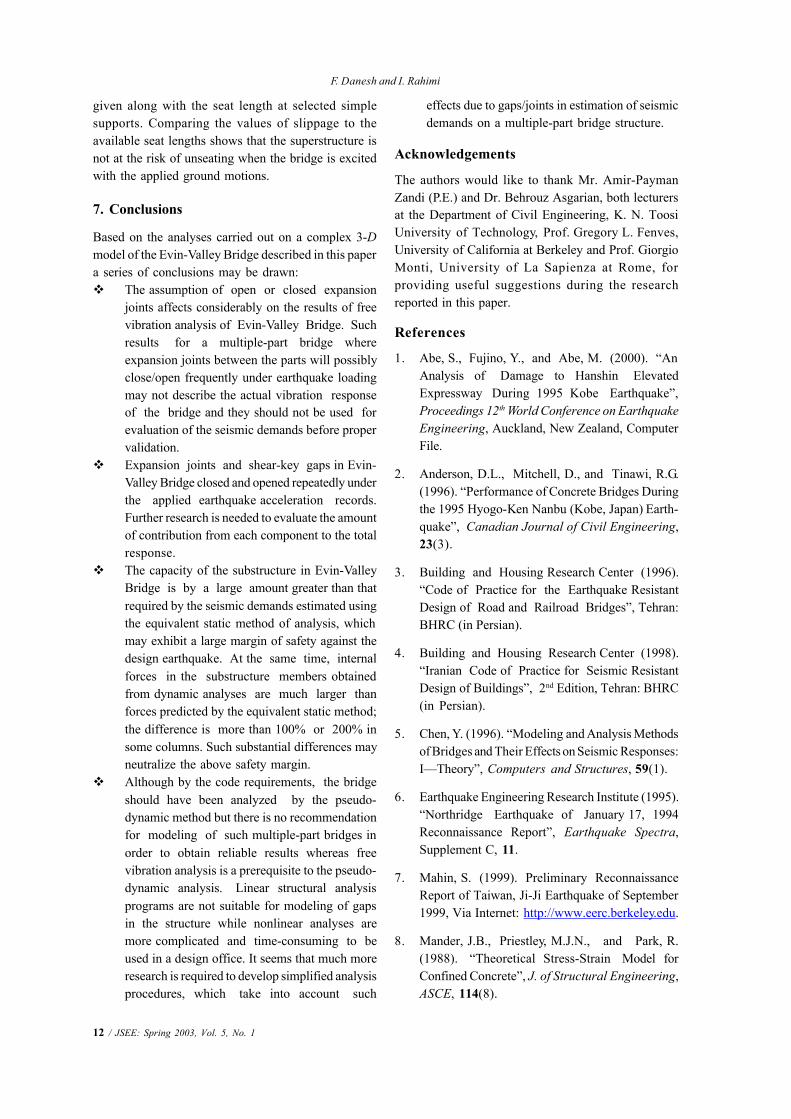
It is observed that Mucode and Mu differ slightly butMu is much greater than Mdesign. In Figure (16), theratio of Mu/Mdesign is given for the column section ofthe different bents of the bridge. It clearly demonstratesthat the substructure of the bridge holds a large marginof safety when the strength capacity is compared tothe strength demand values determined by theequivalent static method of analysis. This observationmay justify the foregoing observation of slight inelasticresponse of the bents under the applied earthquakerecords which were scaled to the design basisacceleration.
Remarkably a considerable difference is observedif one compares MEQ values to the dynamic responseof the members both in LC3 and LC4 directions. Thiscomparison seems reasonable since the dynamicresponse values do not include the code-specifiedmagnification due to slenderness effects. In addition,the bending moment induced by the gravity in thecolumns of a short-span multi-column bent, such as
Figure 14. Maximum bending moments in selected columnmembers and comparison to the section capacitiesand design forces.
Figure 15. Maximum bending moments in selected columnmembers and comparison to the section capacitiesand design forces.
Figure 16. The ratio of Mu/Mdesign for different bents of Evin-Valley Bridge.
in Evin-Valley Bridge, is rather small when comparedto the lateral loads. Even the Naghan ground motionwhich did not cause significant inelastic flexuralresponse has resulted in the bending moment to exceedMEQ in some sample members. For the Northridgeand Kobe records, the response values exceed MEQ upto more than 200% in a number of sample columnmembers. This is evident in both Figures (14) and (15).
In Figure (17) the maximum curvature ductility

Seismic Assessment of Evin-Valley Bridge by 3-D Inelastic Dynamic Analysis
JSEE: Spring 2003, Vol. 5, No. 1 / 11
Figure 17. mdemand (first number) and mcapacity (second number)for different bents of Evin-Valley Bridge.
Bent Stiffness Change Relative to the Next Bent
P-1S 0.085
P-2S 0.15
P-3S 0.241
P-4S 0.132
P-5S 0.140
P-6S 0.106
P-7S 0.052
P-8S 0.018
P-9S 0.188
P-10S 0.458
P-11S 1.390
P-12S -
Table 4. Change in stiffness of each bent of the Evin-ValleyBridge relative to the next bent.
Table 5. Maximum girder-beam end slippage at selected simple supports perpendicular to the line of the support (in cm).
SupportNaghan Northridge Kobe
Seat Length
LC1 LC2 LC3 LC4 LC3 LC4 LC3 LC 4
A-1S 7.0 0.9 7.3 2.3 18.3 6.8 16.2 3.6 85
A-2S 5.9 1.3 6.9 2.7 14.7 8.5 10.7 6.2 85
P-6S 8.3 0.3 8.4 2.8 20.1 5.9 18.4 5.2 80
SRA-1 0.8 1.5 0.4 1.2 1.3 4.5 1.3 3.8 80
SRP-6 5.2 2.8 5.0 1.0 19.1 4.1 9.2 4.3 85
demand, ,demandµ experienced in the columns of thedifferent bents due to ground acceleration recordsapplied to the structure is given along with thecurvature ductility capacity, ,capacityµ of the columnsections. The curvature ductility capacity is at thedamage control limit state governed by the fractureof transverse reinforcements as defined previously.Only in a few number of bents, demandµ exceeds 1.0.A large difference there exists between demandµ and
.capacityµ The ductility demand values does notchange in a predictable manner along the bridge.While the bent P-12S experiences a low ductilitydemand, it exceeds 1.0 at the other end short bentP-1S. However, the values of ductility capacityseem to follow a more smooth variation.
BHRC [3] recommends equivalent static methodof analysis under earthquake forces for a series ofregular bridges. Abrupt change in mass distribution,variation of stiffness between two adjacent bents bymore than 25% relative to the more flexible bentand a horizontal arch angle of greater than 90º causesa bridge to be categorized as irregular. Pseudo-dynamic(spectral) or dynamic method of analysis should beused for regular curved, suspension or cable-stayedbridges and irregular bridges of spans less than 150m.
As indicated in Table (4), because of the sudden
change in the relative lateral stiffness of the adjacentbents, the Evin-Valley Bridge goes into the category ofshort-span irregular bridges and it should not beanalyzed simply by the equivalent static method. Priorto an initial design of the substructure, relative lateralstiffness of the bents is not known and the equivalentstatic method will possibly be used for estimation ofthe seismic demands. However, it seems necessary tocheck the final design to comply with the codeprovisions. While the authors pointed to the problemsencountered in the free vibration analysis of themultiple-part structures, BHRC [3] does not provideany specification or recommendation for theprofessional engineer for reliable estimation of thedynamic response of the bridge using pseudo-dynamicor dynamic methods of analysis.
An evaluation of the critical shear force in thesubstructure members also revealed a large differenceto the existing capacities as estimated using theprocedure recommended by Priestley et al [15].Interested readers may refer to Rahimi [16] for details.
In Table (5) the maximum girder-beam endslippage perpendicular to the line of the support is
12 / JSEE: Spring 2003, Vol. 5, No. 1
F. Danesh and I. Rahimi
given along with the seat length at selected simplesupports. Comparing the values of slippage to theavailable seat lengths shows that the superstructure isnot at the risk of unseating when the bridge is excitedwith the applied ground motions.
7. Conclusions
Based on the analyses carried out on a complex 3-Dmodel of the Evin-Valley Bridge described in this papera series of conclusions may be drawn:v The assumption of open or closed expansion
joints affects considerably on the results of freevibration analysis of Evin-Valley Bridge. Suchresults for a multiple-part bridge whereexpansion joints between the parts will possiblyclose/open frequently under earthquake loadingmay not describe the actual vibration responseof the bridge and they should not be used forevaluation of the seismic demands before propervalidation.
v Expansion joints and shear-key gaps in Evin-Valley Bridge closed and opened repeatedly underthe applied earthquake acceleration records.Further research is needed to evaluate the amountof contribution from each component to the totalresponse.
v The capacity of the substructure in Evin-ValleyBridge is by a large amount greater than thatrequired by the seismic demands estimated usingthe equivalent static method of analysis, whichmay exhibit a large margin of safety against thedesign earthquake. At the same time, internalforces in the substructure members obtainedfrom dynamic analyses are much larger thanforces predicted by the equivalent static method;the difference is more than 100% or 200% insome columns. Such substantial differences mayneutralize the above safety margin.
v Although by the code requirements, the bridgeshould have been analyzed by the pseudo-dynamic method but there is no recommendationfor modeling of such multiple-part bridges inorder to obtain reliable results whereas freevibration analysis is a prerequisite to the pseudo-dynamic analysis. Linear structural analysisprograms are not suitable for modeling of gapsin the structure while nonlinear analyses aremore complicated and time-consuming to beused in a design office. It seems that much moreresearch is required to develop simplified analysisprocedures, which take into account such
effects due to gaps/joints in estimation of seismicdemands on a multiple-part bridge structure.
Acknowledgements
The authors would like to thank Mr. Amir-PaymanZandi (P.E.) and Dr. Behrouz Asgarian, both lecturersat the Department of Civil Engineering, K. N. ToosiUniversity of Technology, Prof. Gregory L. Fenves,University of California at Berkeley and Prof. GiorgioMonti, University of La Sapienza at Rome, forproviding useful suggestions during the researchreported in this paper.
References
1. Abe, S., Fujino, Y., and Abe, M. (2000). “AnAnalysis of Damage to Hanshin ElevatedExpressway During 1995 Kobe Earthquake”,Proceedings 12th World Conference on EarthquakeEngineering, Auckland, New Zealand, ComputerFile.
2. Anderson, D.L., Mitchell, D., and Tinawi, R.G.(1996). “Performance of Concrete Bridges Duringthe 1995 Hyogo-Ken Nanbu (Kobe, Japan) Earth-quake”, Canadian Journal of Civil Engineering,23(3).
3. Building and Housing Research Center (1996).“Code of Practice for the Earthquake ResistantDesign of Road and Railroad Bridges”, Tehran:BHRC (in Persian).
4. Building and Housing Research Center (1998).“Iranian Code of Practice for Seismic ResistantDesign of Buildings”, 2nd Edition, Tehran: BHRC(in Persian).
5. Chen, Y. (1996). “Modeling and Analysis Methodsof Bridges and Their Effects on Seismic Responses:I—Theory”, Computers and Structures, 59(1).
6. Earthquake Engineering Research Institute (1995).“Northridge Earthquake of January 17, 1994Reconnaissance Report”, Earthquake Spectra,Supplement C, 11.
7. Mahin, S. (1999). Preliminary ReconnaissanceReport of Taiwan, Ji-Ji Earthquake of September1999, Via Internet: http://www.eerc.berkeley.edu.
8. Mander, J.B., Priestley, M.J.N., and Park, R.(1988). “Theoretical Stress-Strain Model forConfined Concrete”, J. of Structural Engineering,ASCE, 114(8).

Seismic Assessment of Evin-Valley Bridge by 3-D Inelastic Dynamic Analysis
JSEE: Spring 2003, Vol. 5, No. 1 / 13
9. Mitchell, D., Bruneau, M., Williams, M.,Anderson, D. Saatcioglu, M., and Sexsmith, R.(1995). “Performance of Bridges in the 1994Northridge Earthquake”, Canadian Journal ofCivil Engineering, 22(2).
10. Motoki, K. and See, K. (2000). “Strong MotionCharacteristics Near the Source Region of theHyogoken-Nanbu Earthquake from Analysis of theDirections of Structural Failure”, Proceedings 12th
World Conference on Earthquake Engineering,Auckland, New Zealand. Computer File.
11. Papazoglu, A.J. and Elnashai, A.S. (1996). “Analy-tical and Field Evidence of the Damaging Effectof Vertical Earthquake Ground Motion”, Earth-quake Engineering and Structural Dynamics,25(10).
12. Powell, G.H. and Campbell, S. (1994). “Drain-3DX Element Description and User Guide forElement Type 01, Type 04, Type 05, Type 08,
Type 09, Type 15 and Type 17”, University ofCalifornia at Berkeley, Report No. UCB/SEMM-94/08.
13. Prakash, V., Powell, G.H., and Campbell, S.(1994). “Drain-3DX Base Program Descriptionand User Guide”, University of California atBerkeley, Report No. UCB/SEMM-94/07.
14. Priestley, M.J.N., Seible, F., and Calvi, G.M.(1996a). “Seismic Design and Retrofit ofBridges”, New York, John Wiley and Sons.
15. Priestley, M.J.N., Verma, R., and Xiao, Y. (1996b).“Seismic Shear Strength of Reinforced ConcreteBridge Columns: Closure by the Authors”, J.of Structural Engineering, ASCE, 122(4).
16. Rahimi, I. (2001). “Seismic Assessment of Evin-Valley Bridge by Inelastic Dynamic Analysis”,M.Sc. Dissertation, K.N. Toosi University ofTechnology, Tehran, Iran (in Persian).