segmentation of overlapping cervical cells with mask
TRANSCRIPT

Research ArticleSegmentation of Overlapping Cervical Cells with Mask RegionConvolutional Neural Network
Jiajia Chen 1 and Baocan Zhang 2
1Zhongshan Hospital Xiamen University, Xiamen, Fujian 361004, China2Chengyi University College, Jimei University, Xiamen, Fujian 361021, China
Correspondence should be addressed to Baocan Zhang; [email protected]
Received 5 August 2021; Accepted 18 September 2021; Published 4 October 2021
Academic Editor: Tao Huang
Copyright © 2021 Jiajia Chen and Baocan Zhang. This is an open access article distributed under the Creative CommonsAttribution License, which permits unrestricted use, distribution, and reproduction in any medium, provided the original workis properly cited.
The task of segmenting cytoplasm in cytology images is one of the most challenging tasks in cervix cytological analysis due to thepresence of fuzzy and highly overlapping cells. Deep learning-based diagnostic technology has proven to be effective insegmenting complex medical images. We present a two-stage framework based on Mask RCNN to automatically segmentoverlapping cells. In stage one, candidate cytoplasm bounding boxes are proposed. In stage two, pixel-to-pixel alignment isused to refine the boundary and category classification is also presented. The performance of the proposed method isevaluated on publicly available datasets from ISBI 2014 and 2015. The experimental results demonstrate that our methodoutperforms other state-of-the-art approaches with DSC 0.92 and FPRp 0.0008 at the DSC threshold of 0.8. Those resultsindicate that our Mask RCNN-based segmentation method could be effective in cytological analysis.
1. Introduction
Cervical cancer is one of the most common types of canceramong women, which causes tens of thousands of deathsevery year. In recent years, cytology test, such as Pap smear,is widely used to diagnose cervical cancer in its early precan-cerous stages. The successful detection of precancerouslesions is essential for effective treatment of the cancer [1].Conventionally, the slides containing the cells from uterinecervix are stained and examined under a microscope by acytologist or pathologist, to detect nucleus and cytoplasmicatypia. However, the sensitivity of the test is mainly affectedby many factors, such as the overlap among the cells andsmearing (e.g., the presence of mucus, blood, and inflam-matory cells) [2]. Although the impact could be reducedby newer preparation techniques (such as ThinPrep), thesefactors would lead to a large variation in false-negative rate[3]. On the other hand, the diagnostic procedure requires alarge amount of time and is tedious. These issues have moti-vated the development of automated diagnostic techniques.Those techniques are largely based on the cell images
acquired by a digital camera connected to a microscope.For cell images, automatically segmenting cervical cells fromoverlapped clumps is fundamental and remains a highlychallenging task.
In previous studies, many approaches have been pro-posed for complete segmentation of overlapping cervicalcells [4–6]. This increase was probably motivated by the firstand second overlapping cervical cell segmentation chal-lenges held in the International Symposium on BiomedicalImaging (ISBI) 2014 and 2015. During the conferences,two high-quality datasets containing the original cell imagesand their annotations were made publicly available. Andthose two datasets make the evaluation and comparison ofdifferent segmenting methods possible. Lu et al. [4] seg-mented overlapping cells by joint optimization of multipleset functions, where each function had both intracell andintercell constraints. Phoulady et al. [6] proposed a frame-work to detect nuclei and cytoplasm in cervical cytologyextended depth of field (EDF) images. The boundaries werefirst approximated by a defined similarity metric and refinedin two steps by reducing concavity. The framework was also
HindawiComputational and Mathematical Methods in MedicineVolume 2021, Article ID 3890988, 10 pageshttps://doi.org/10.1155/2021/3890988

evaluated on the two public datasets mentioned above. Tar-eef et al. [7] introduced a multipass fast watershed-basedmethod to segment both nucleus and cytoplasm from largecell masses of overlapping cells. They located the nuclei withbarrier-based watershed and then segmented the isolated,partially overlapping cells with a watershed transform. Atlast, they proposed mutual iterative watersheds applied toeach nucleus to estimate the cell shape. Liu et al. [8] pro-posed a morphological scaling-based topology filter. Andthey combined the topology filter with a newly derivedmathematical toolbox into a multifunctional filtering algo-rithm 2D codimension two-object level set method, to splitoverlapping cells. The performance was evaluated quantita-tively and qualitatively on the ISBI 2014 dataset.
Recently, deep learning has proven to be very successfulin image classification, object detection, and instance seg-menting. In deep learning, the convolutional neural network(CNN) is the most commonly used architecture for imageanalyzing tasks. The CNNmodels extract the underlying fea-tures of images automatically and do not need any a prioriknowledge. For example, Moeskops et al. [9] proposed anautomatic segmentation of MR brain images with a CNN.Additionally, the technique of transfer learning was exploitedto overcome the lack of sufficient training data. Zhang et al.performed cross-subject seizure detection in EEGs usingtransfer learning [10].
Many CNN-based methods for cell segmentation havebeen proposed and published. Song et al. [11] presented amultiscale CNN to classify every pixel into the category ofcytoplasm or background, where the accurate detection ofnuclei was critical. The labeling results were fed into thedynamic multitemplate deformation model for boundaryrefinement. They also incorporated high-level shape infor-mation to guide segmentation. Tareef et al. [12] presenteda segmentation framework on superpixelwise convolutional
neural network and utilized a learning shape prior to delin-eate the contour of each individual cytoplasm. The shapeprior was dynamically determined during the training pro-cess. Wan et al. [13] adopted TernausNet to classify theimage pixels into nucleus, cytoplasm, or background. Then,a modified DeepLab (V2) model was used to perform cyto-plasm segmentation. It was worthy of note that a syntheticmethod was used to generate cell masses containing overlap-ping cells in the paper. Although the experimental results onreal or synthetic datasets demonstrated promising results,these deep learning-based methods were somehow compli-cated or required prior knowledge about the shape of cells.This motivated our work to develop a fully automatic cellsegmentation model for highly overlapping cells.
In this paper, we present a new segmentation method forsegmenting cell clumps using mask region convolutionalneural network (Mask RCNN). The workflow of the methodis depicted in Figure 1. The real and synthetic cytologyimages from ISBI 2014 and ISBI 2015 are used as the originaldatasets. Similar to many previous works using deep learn-ing to perform cytoplasm segmentation, the original imagesare augmented by flipping and rotating. Then, the originalimages and augmented ones are divided into training, vali-dating, and testing datasets for the subsequent MaskRCNN. Mask RCNN is basically an extension of FasterRCNN [14], by adding a branch for predicting objectmasks. In other words, Mask RCNN has three outputbranches (i.e., mask branch, bounding box branch, and cat-egory branch). Mask RCNN is a typical two-stage method.In stage I, feature maps from images are extracted by thebackbone network. These feature maps are passed througha regional proposal network to return the candidate bound-ing boxes of instance objects. In stage II, RoI (Region ofInterest) pooling layer brings these candidate boundingboxes to the same size. And then, the proposals are passed
ISBI2014
ISBI2015 Data augmentation
ResNet50
RPN
RoisFeaturemaps
Full connectionlayers
Full connectionlayers
ROI align
Category Box Mask
Flip and rotate
Mask RCNN
Evaluation
Cytoplasm 1.000
Cytoplasm 1.000
Cytoplasm 1.000Cytoplasm 1.000 Cytoplasm 1.000
Cytoplasm 1.000
Cytoplasm 1.000
Cytoplasm 1.000
Cytoplasm 1.000
Cytoplasm 1.000
Cytoplasm 0.999
Cytoplasm 0
Cytoplasm 1.000
Cytoplasm 1.000
Cytoplasm 0.998
000
Figure 1: Workflow of the segmentation for overlapping cell images using Mask RCNN.
2 Computational and Mathematical Methods in Medicine
to fully connected layers to output the bounding boxes,masks of objects, and category.
In summary, the main contributions of this work includethe following:
(i) A new method using Mask RCNN is proposed forsegmentation of overlapping cervical cells, wheresmall amount of annotated images is needed andany a priori knowledge about cells is not required
(ii) Our proposed method achieves superior resultscompared to other state-of-the-art methods in someterms of measures
The rest of this paper is organized as follows. Section 2describes the method. Section 3 gives the structure of theconvolutional network and the detailed information of data-sets. Section 4 describes the experimental results and com-parison with state-of-the-art results. The discussion ispresented in Section 5.
2. Method
Each cell image contains many cells, where cells sometimesoverlap at a high ratio. Because of the relative small sizeand high contrast with background of the nuclei, segmentingnuclei is generally easier than segmenting cytoplasm. In pre-vious works, many methods have been proposed to segmentnuclei. Phoulady et al. [6] used the geometric features thatnuclei were represented by small uniform intensity darkand convex regions. Wan et al. [13] used TernausNet toassign each pixel to three labels (nucleus, cytoplasm, andbackground). Based on the locations of detected nuclei, thecorresponding regions were used in the following task ofcytoplasm segmentation. On the other hand, nucleus detec-tion inaccuracies directly affect the outcome of final cyto-plasm segmentation.
In this paper, a new method based on Mask RCNN isproposed for cytoplasm segmentation directly, without the
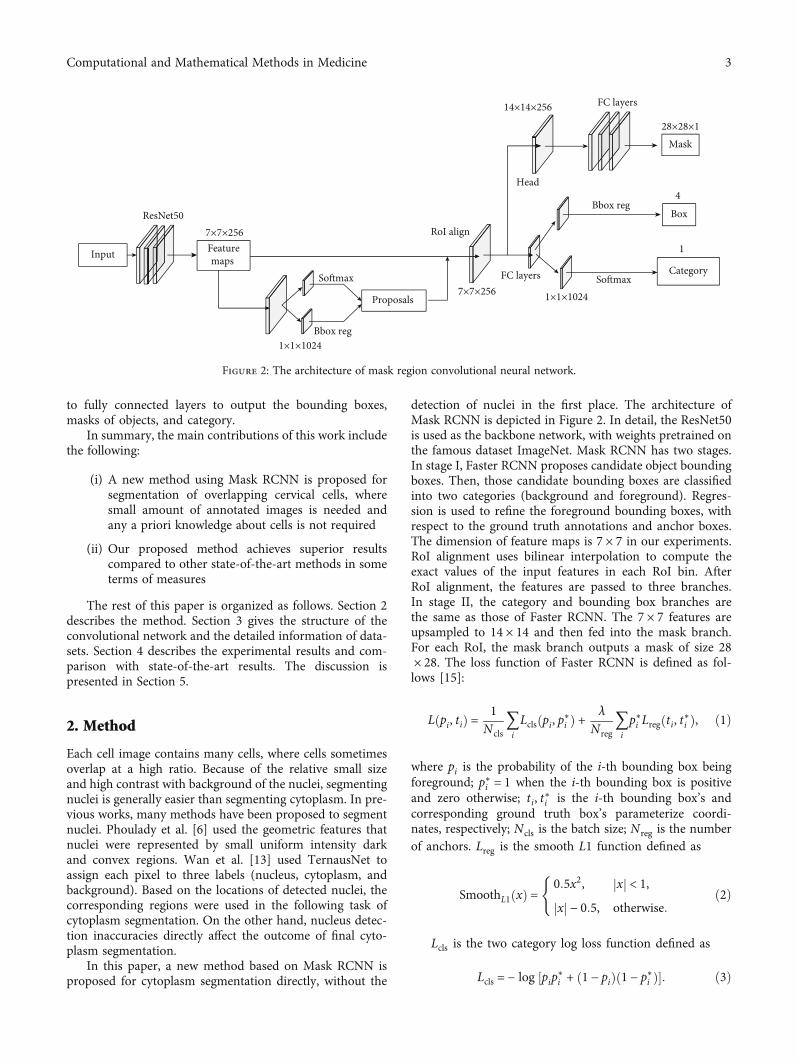
detection of nuclei in the first place. The architecture ofMask RCNN is depicted in Figure 2. In detail, the ResNet50is used as the backbone network, with weights pretrained onthe famous dataset ImageNet. Mask RCNN has two stages.In stage I, Faster RCNN proposes candidate object boundingboxes. Then, those candidate bounding boxes are classifiedinto two categories (background and foreground). Regres-sion is used to refine the foreground bounding boxes, withrespect to the ground truth annotations and anchor boxes.The dimension of feature maps is 7 × 7 in our experiments.RoI alignment uses bilinear interpolation to compute theexact values of the input features in each RoI bin. AfterRoI alignment, the features are passed to three branches.In stage II, the category and bounding box branches arethe same as those of Faster RCNN. The 7 × 7 features areupsampled to 14 × 14 and then fed into the mask branch.For each RoI, the mask branch outputs a mask of size 28× 28. The loss function of Faster RCNN is defined as fol-lows [15]:
L pi, tið Þ = 1Ncls
〠i
Lcls pi, p∗ið Þ + λ
Nreg〠i
p∗i Lreg ti, t∗ið Þ, ð1Þ
where pi is the probability of the i-th bounding box beingforeground; p∗i = 1 when the i-th bounding box is positiveand zero otherwise; ti, t∗i is the i-th bounding box’s andcorresponding ground truth box’s parameterize coordi-nates, respectively; Ncls is the batch size; Nreg is the numberof anchors. Lreg is the smooth L1 function defined as
SmoothL1 xð Þ =0:5x2, xj j < 1,
xj j − 0:5, otherwise:
(ð2Þ
Lcls is the two category log loss function defined as
Lcls = − log pip∗i + 1 − pið Þ 1 − p∗ið Þ½ �: ð3Þ
Input Featuremaps
Proposals
Softmax
Bbox reg
FC layers
Bbox reg
Softmax Category
Box
Mask
Head
ResNet50
FC layers
RoI align 7×7×256
1×1×1024
7×7×256 1×1×1024
14×14×256
28×28×1
4
1
Figure 2: The architecture of mask region convolutional neural network.
3Computational and Mathematical Methods in Medicine

The loss function of the mask branch, denoted by Lmask ,is defined as the average binary cross-entropy loss. For aRoI associated with ground truth class k, Lmask is onlydefined on the k-th mask. The total loss function is thesum of all three branches, defined as L = Lcls + Lbox + Lmask.For more detailed information about Mask RCNN, pleaserefer to the original paper proposed by He et al. [15]. As anexample, Figure 3 presents a cervical cytology image from ISBI2014 with the ground truth cytoplasm annotations and thesegmentation proposed by our method.
3. Datasets and Experimental Design
In 2014 and 2015, the first and second Overlapping CervicalCytology Image Segmentation Challenges (ISBI 2014 andISBI 2015 [4]) were held. During the conferences, two data-sets of high-quality cervical cytology image and their groundtruth cell segmentation were made publicly available. Thosetwo challenges have greatly motivated the research aboutsegmentation of overlapping cells. The first dataset (fromISBI 2014) consists of 135 synthetic and 8 real cervical cytol-ogy EDF images in the training set and 810 synthetic and 8real cervical cytology EDF images in the test set. The syn-thetic images are created by minor transformation of back-ground and brightness of different isolated cells in realEDF images. It should be noticed that the real EDF imagesin this dataset were released without annotations of individ-ual cytoplasm. So those images were not used in our paper.The second dataset (from ISBI 2015) contains 8 real cervicalcytology EDF images in the training set and 9 real ones inthe test set, with both ground truth annotations of cyto-plasm. As for the main difference of those two datasets,images from ISBI 2014 are of size 512 × 512 with 2-10 cellsin each image, and images from ISBI 2015 are of size 1024× 1024 with more than 40 cells in each image.
Table 1 describes the training and testing datasets usedin our experiments. The training dataset consists of 900 syn-thetic images from ISBI 2014 and 8 real EDF images fromISBI 2015. The testing dataset contains 45 images from ISBI2014 and 9 images from ISBI 2015.
In order to compare with the segmentation results pro-posed by other researchers on the same datasets, we adoptfour widely used evaluation metrics. The dice similarity coef-ficient (DSC) of two regions A and B is defined as DSC = 2jA ∩ Bj/jAj + jBj. A cell in ground truth is considered to bewell segmented if a segmentation in the detection has DSCabove a specific threshold with it. In our evaluation, we adoptthe following values of DSC threshold: {0.5, 0.6, 0.7, and 0.8}.The object-based false-negative rate (FNRo) is defined asthe rate of cells having a DSC below the threshold. At pixellevel, true positive rate (TPRp) and false positive rate (FPRp)are also reported. Their definitions are as follows: TPRp =TP/ðTP + FNÞ, FPRp = FP/ðFP + TNÞ. Higher value of TPRpalong with lower value of FPRp means better cell segmenta-tion. During evaluation, a cell in ground truth is not countedin the metrics of TPRp and FPRp if there is no region in thesegmentation result that has a DSC greater than the specificthreshold.
In the training process, the pretrained weights on Ima-geNet for the backbone network ResNet50 are used. The cellimages from ISBI 2015 of size 1024 × 1024 are resized usingcrop. And the size of batch normalization is 8 images perbatch. The nonmaximum suppression thresholds are set tobe 0.9 and 0.7 during training and testing, respectively.The test platform is a desktop system with Nvidia RTX2080Ti and 128GB memory running Debian.
4. Results and Comparison
We first report the qualitative results on both datasets byseveral examples. And then, quantitatively the performanceof our method is evaluated in comparison with that ofstate-of-the-art approaches.
The final segmentation results on some cell images fromdatasets ISBI 2014 and ISBI 2015 are presented in Figure 4.Compared with synthetic cervical cell images (Figure 4(a)),the real cytology images (Figure 4(b)) contain much morecells with high overlapping ratio. Higher overlapping ratiomakes the segmentation more difficult.
The segmentation performance is evaluated by four eval-uation metrics (i.e., DSC, FNRo, TPRp, and FNRp), whichare the original metrics in the two ISBI competitions. Thequantitative results are listed in Table 2. As shown by thetable, the mean DSC on dataset ISBI 2015 is a litter lowerthan that on dataset ISBI 2014, and the mean FNRo on data-set ISBI 2015 is a little higher than that on dataset ISBI 2014.Those results are likely to be caused by the fact that the cer-vical cell images from ISBI 2015 have much more cells withhigher overlapping ratio than the cell images from ISBI2014.
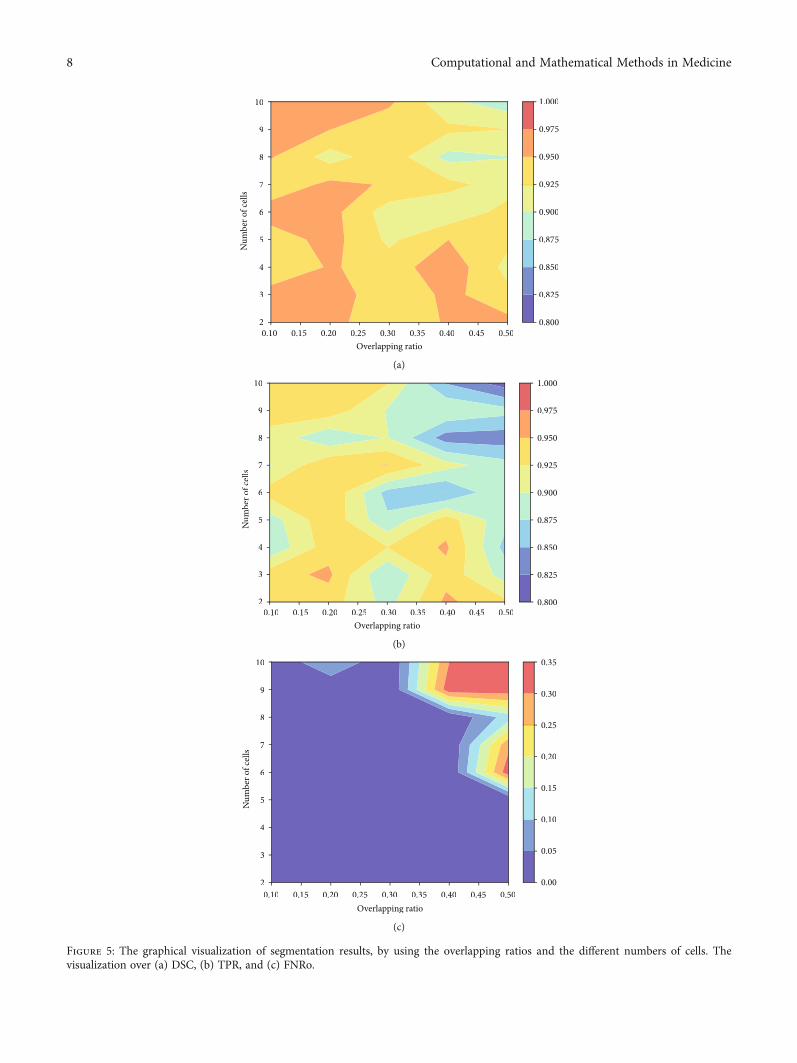
The dataset from ISBI 2014 provides not only theground truth cell segmentation but also the number of cervi-cal cells and the mean overlapping ratio between every pairof cells in synthetic images. Based on this information, weconduct additional experiments to evaluate the segmenta-tion performance over cell images with varied number ofcells and overlapping ratio. The overlapping ratio indicatesthe degree of coincide between two cells in the cell images.The metrics of DSC, TPR, and FNRo are used in the evalu-ation. Figure 5 shows a graphical visualization of segmenta-tion results in terms of the three metrics. As seen from thosefigures, our model can successfully segment cells fromclumps with a small number of cells and high overlappingratio. It can also effectively segment cells from clumps witha large number of cells (about 10 cells) and low overlappingratio. In Figure 4(a), three typical segmentations of syntheticcell images are presented with automated detection.Figure 4(b) shows three real EDF cervical cytology imageswith automated segmentation.
Due to the fact that manual annotations of cell segmen-tation are tedious and very time-consuming, the number ofreal cytological images with ground truth segmentation issmall. Synthetic images are relatively easy to generate fromisolated cells in real EDF images. On the other hand, thetraining of deep neural network needs a large amount ofsamples with ground truth annotations. Therefore, in our
4 Computational and Mathematical Methods in Medicine

(a)
(b)
Figure 3: Continued.
5Computational and Mathematical Methods in Medicine

experiments, the training dataset contains much more syn-thetic cytology images than real ones.
For comparison, we employ the same DSC threshold of0.7. The experimental results are listed in Tables 3 and 4.
According to Table 3, our proposed method achieves thebest performance in terms of FPRp and FNRo over the othermethods. In particular, the object-based false-negative rate ismuch lower than that of the other methods. Our methodobtains a comparable DSC (0.92), with about 2.2% improve-ment over the average value (0.9).
By examining the results in Table 4, our method achievesbetter results than other approaches in some metrics andslightly worse results in other metrics. In detail, our modelachieves the second best and third best results in terms ofDSC and TPRp, respectively. In terms of FPRp, our methodachieves the best result by a little margin. However, when theDSC threshold is set to be 0.8, our proposed method shows apromising performance in cytoplasm segmentation. Theresults are presented in Table 5. Our proposed Mask RCNNmodel achieves the best results in terms of DSC and FPRp
over other two methods. Specifically, our obtained DSC is0.92 and FPRp is 0.0008.
Compared with results obtained by Wan et al. [13], ourachieved TPRp is 0.94, with up to 4% improvement, butthe metric of FNRo is a little higher. Our obtained FNRo ismuch lower than that achieved by Tareef et al. [7]. Thoseexperimental results indicate that our proposed methodcan be used to effectively segment individual cytoplasm fromcell clusters in real cytology images.
The python code is run on a PC with a powerful GPUNvidia GTX2080Ti. It would take around 1.5 s for the algo-rithm to segment the overlapping cells in a real EDF image.But it should be noticed that the time for segmentingdepends largely on hardware and code optimization.
5. Discussion
Segmenting cytoplasm in cytology images is one of the mostchallenging tasks in cervix cytological analysis. This situa-tion is caused by many reasons. For example, cells in imagesoverlap at a relatively high ratio. And the presence of mucusand blood makes the images fuzzy. It is a very challengingtask to precisely annotate the boundary of every single cellin images. Therefore, automated segmentation based oncomputer technology is much needed.
In this work, the proposed method based on MaskRCNN produces robust results on the problem of segment-ing cytoplasm from cell images with high overlapping ratio.
Cytoplasm 1.000
Cytoplasm 1.000
Cytoplasm 1.000
Cytoplasm 1.000
Cytoplasm 1.000
Cytoplasm 1.000
Cytoplasm 1.000
Cytoplasm 1.000
(c)
Figure 3: Example of segmentation of a cytology image: (a) the original overlapping cell image; (b) the ground truth segmentation; (c) theproposed segmentation using Mask RCNN.
Table 1: The number of cell images in the datasets.
Total ISBI 2014 ISBI 2015
Training set 908 900 8
Testing set 1 45 45
Testing set 2 9 9
6 Computational and Mathematical Methods in Medicine

The qualitative results shown in Figure 4 allow us to con-clude that our method produces robust boundaries on syn-thetic and real cytology images. However, some cytoplasmembedded in clumps is not segmented well enough, espe-cially in the real EDF images. Quantitatively, our proposedmethod achieves the best results in terms of DSC and FPRpover other state-of-the-art approaches at the DSC thresholdof 0.8. However, compared with other approaches, ourmethod achieves better results in some terms and worseresults in other terms, at the same DSC threshold of 0.7 (assuggested by the Overlapping Cervical Cytology Image Seg-
mentation Challenges in 2015). The percentage of correctlysegmented cells is a little bit low when segmenting cellsembedded in clumps with a large number of cells. As canbe concluded from the experimental results (Table 2), theaverage FNRo is 0.04 and 0.24 over dataset ISBI 2014 andISBI 2015, respectively. To the best of our knowledge, nopublished approaches have achieved superior performancein all four metric terms on the same test dataset.
Overall, the qualitative and quantitative evaluation dem-onstrates the efficiency of our proposed method for cell seg-mentation in cytology images. Compared with other
(a)
(b)
Figure 4: Segmentation results on (a) synthetic cervical cell images from ISBI 2014 and (b) real cervical cell images from ISBI 2015.
Table 2: Segmentation performance with four evaluation metrics.
Dataset Thresholding DSC TPRp FPRp FNRo
ISBI 2014
DSC > 0:5 0:92 ± 0:037 0:89 ± 0:057 0:001 ± 0:026 0:0056 ± 0:026DSC > 0:6 0:93 ± 0:032 0:89 ± 0:053 0:001 ± 0:0007 0:013 ± 0:054DSC > 0:7 0:93 ± 0:029 0:90 ± 0:048 0:001 ± 0:0007 0:022 ± 0:066DSC > 0:8 0:94 ± 0:022 0:91 ± 0:037 0:001 ± 0:0006 0:058 ± 0:127
ISBI 2015
DSC > 0:5 0:84 ± 0:032 0:90 ± 0:046 0:001 ± 0:0004 0:120 ± 0:067DSC > 0:6 0:87 ± 0:025 0:91 ± 0:049 0:001 ± 0:0003 0:200 ± 0:091DSC > 0:7 0:89 ± 0:022 0:92 ± 0:051 0:001 ± 0:0002 0:277 ± 0:093DSC > 0:8 0:92 ± 0:01 0:94 ± 0:029 0:0008 ± 0:0001 0:387 ± 0:131
7Computational and Mathematical Methods in Medicine
10
9
8
7
6
5
4
2
Num
ber o
f cel
ls
3
0.800
0.825
0.850
0.875
0.900
0.925
0.950
0.975
1.000
0.10 0.15 0.20 0.25Overlapping ratio
0.30 0.35 0.40 0.45 0.50
(a)
10
9
8
7
6
5
4
2
Num
ber o
f cel
ls
3
0.10 0.15 0.20 0.25Overlapping ratio
0.30 0.35 0.40 0.45 0.500.800
0.825
0.850
0.875
0.900
0.925
0.950
0.975
1.000
(b)
0.35
0.30
0.25
0.20
0.15
0.10
0.05
0.00
10
9
8
7
6
5
4
20.10 0.15 0.20 0.25
Overlapping ratio
Num
ber o
f cel
ls
0.30 0.35 0.40 0.45 0.50
3
(c)
Figure 5: The graphical visualization of segmentation results, by using the overlapping ratios and the different numbers of cells. Thevisualization over (a) DSC, (b) TPR, and (c) FNRo.
8 Computational and Mathematical Methods in Medicine

approaches, our method does not need any prior knowledgeof the shape of cells and could segment cytoplasm withoutany information of the nuclei. For instance, the level set-based segmentation methods require a number of arbitraryparameters empirically set of every dataset, such as in [12,17, 18]. Some methods are based on shape deformationand detection, such as in [12]. Although shape-basedmethod is one of reliable techniques for cell segmentation,it may lack strong generalization ability for insufficient cellshapes in the training dataset.
However, our method requires a large number of anno-tated cell images for training. On the other hand, our modeltends to annotate small isolated clumps as cytoplasm, wherethose clumps of small area may be mucus or blood. One pos-sible improvement is to utilize the information of shape andarea of the cells. In the future work, we will modify our pro-posed model by filtering out candidate bounding boxes thathave relatively small area. In addition, we will try to build aframework to further improve accuracy and efficiency. Toour knowledge, the new CNN model BlendMask can effec-tively predict dense per-pixel position-sensitive instance fea-tures with few channels and learn attention maps for eachinstance with merely one convolution layer [19]. It hasshowed remarkable performance on some open datasets. A
new model based on BlendMask could be our candidatemethod for segmentation of overlapping cervical cells.
6. Conclusion
In this paper, we present a Mask RCNN-based method thataddresses the challenging task of segmenting cells in cytol-ogy images. The method requires neither prior knowledgeof the shape of cells nor the detection of nuclei. Therefore,our method has relatively strong generalization ability. Theexperimental results on publicly available datasets show thatour method achieves the best DSC of 0.92 and FPRp of0.0008 at the DSC threshold of 0.8.
Data Availability
The datasets used in this paper were made publicly availablein the first and second Overlapping Cervical Cytology ImageSegmentation Challenges in 2014 and 2015.
Conflicts of Interest
The authors declare that they have no conflict of interest.
Table 3: Comparison of segmentation performance on ISBI 2014 test dataset using DSC, TPRp, FPRp, and FNRo (DSC threshold = 0:7).The values are in the format of μ ± σ.
Method DSC TPRp FPRp FNRo
Tareef et al. [7] 0:89 ± 0:07 0:94 ± 0:07 0:005 ± 0:005 0:22 ± 0:24
Lee and Kim [16] 0:90 ± 0:08 0:88 ± 0:10 0:002 ± 0:002 0:14 ± 0:19
Lu et al. [4] 0:88 ± NA 0:92 ± NA 0:002 ± NA 0:21 ± NA
Wan et al. [13] 0:93 ± 0:04 0:93 ± 0:05 0:001 ± 0:002 0:11 ± 0:13
Liu et al. [8] 0:90 ± 0:07 0:91 ± 0:08 0:003 ± 0:005 0:28 ± 0:23
Our Mask RCNN 0:92 ± 0:02 0:90 ± 0:05 0:001 ± 0:0007 0:02 ± 0:06
Table 4: Comparison of segmentation performance on ISBI 2015 test dataset using DSC, TPRp, FPRp, and FNRo (DSC threshold = 0:7).The values are in the format of μ ± σ.
Method DSC TPRp FPRp FNRo
Tareef et al. [7] 0:85 ± 0:07 0:95 ± 0:07 0:004 ± 0:004 0:11 ± 0:17
Song et al. [11] 0:89 ± NA 0:92 ± NA 0:002 ± NA 0:26 ± NA
Lee and Kim [16] 0:88 ± 0:09 0:88 ± 0:12 0:001 ± 0:001 0:43 ± 0:17
Phoulady et al. [6] 0:85 ± 0:08 0:94 ± 0:06 0:005 ± 0:005 0:16 ± 0:22
Wan et al. [13] 0:92 ± 0:05 0:91 ± 0:05 0:001 ± 0:003 0:13 ± 0:15
Our Mask RCNN 0:89 ± 0:02 0:92 ± 0:05 0:001 ± 0:0002 0:27 ± 0:09
Table 5: Comparison of segmentation performance on ISBI 2015 test dataset using DSC, TPRp, FPRp, and FNRo (DSC threshold = 0:8).The values are in the format of μ ± σ.
Method DSC TPRp FPRp FNRo
Tareef et al. [7] 0:89 ± NA 0:97 ± NA 0:002 ± NA 0:59 ± NA
Wan et al. [13] 0:91 ± 0:06 0:90 ± 0:05 0:001 ± 0:002 0:28 ± 0:24
Our Mask RCNN 0:92 ± 0:01 0:94 ± 0:02 0:0008 ± 0:0001 0:38 ± 0:13
9Computational and Mathematical Methods in Medicine

Acknowledgments
This work was supported in part by Youth Teacher Educa-tion Research Funds of Fujian (Grant No. JAT201044).
References
[1] L. A. Torre, F. Bray, R. L. Siegel, J. Ferlay, J. Lortet-Tieulent,and A. Jemal, “Global cancer statistics, 2012,” CA: a CancerJournal for Clinicians, vol. 65, no. 2, pp. 87–108, 2015.
[2] A. Gençtav, S. Aksoy, and S. Önder, “Unsupervised segmenta-tion and classification of cervical cell images,” Pattern Recogni-tion, vol. 45, no. 12, pp. 4145–4168, 2012.
[3] H. Z. Noorani, C. Arratoon, and A. Hall, “Assessment of tech-niques for cervical cancer screening,” Technical ReportCCOHTA Report 1997: 2E, Canadian Coordinating Officefor Health Technology Assessment, 1997.
[4] Zhi Lu, G. Carneiro, and A. P. Bradley, “An improved jointoptimization of multiple level set functions for the segmenta-tion of overlapping cervical cells,” IEEE Transactions on ImageProcessing, vol. 24, no. 4, pp. 1261–1272, 2015.
[5] H. Ahmady Phoulady, D. Goldgof, L. O. Hall, and P. R. Mou-ton, “A new approach to detect and segment overlapping cellsin multi-layer cervical cell volume images,” in 2016 IEEE 13thInternational Symposium on Biomedical Imaging (ISBI),pp. 201–204, Czech Republic, 2016.
[6] H. A. Phoulady, D. Goldgof, L. O. Hall, and P. R. Mouton, “Aframework for nucleus and overlapping cytoplasm segmenta-tion in cervical cytology extended depth of field and volumeimages,” Computerized Medical Imaging and Graphics,vol. 59, pp. 38–49, 2017.
[7] A. Tareef, Y. Song, H. Huang et al., “Multi-pass fast watershedfor accurate segmentation of overlapping cervical cells,” IEEETransactions on Medical Imaging, vol. 37, no. 9, pp. 2044–2059, 2018.
[8] G. Liu, Q. Ding, H. Luo et al., “A novel evolution strategy oflevel set method for the segmentation of overlapping cervicalcells,” Applied sciences, vol. 11, no. 1, p. 443, 2021.
[9] P. Moeskops, M. A. Viergever, A. M. Mendrik, L. S. de Vries,M. J. N. L. Benders, and I. Isgum, “Automatic segmentationof MR brain images with a convolutional neural network,”IEEE Transactions on Medical Imaging, vol. 35, no. 5,pp. 1252–1256, 2016.
[10] B. C. Zhang, W. N. Wang, Y. T. Xiao et al., “Cross-subject sei-zure detection in EEGs using deep transfer learning,” Compu-tational and Mathematical Methods in Medicine, vol. 2020,Article ID 7902072, 2020.
[11] Y. Song, E. L. Tan, X. D. Jiang et al., “Accurate cervical cell seg-mentation from overlapping clumps in Pap smear images,”IEEE Transactions on Medical Imaging, vol. 36, no. 1,pp. 288–300, 2017.
[12] A. Tareef, Y. Song, H. Huang et al., “Optimizing the cervixcytological examination based on deep learning and dynamicshape modeling,” Neurocomputing, vol. 248, pp. 28–40, 2017.
[13] T. Wan, S. S. Xu, C. Sang, Y. L. Jin, and Z. C. Qin, “Accuratesegmentation of overlapping cells in cervical cytology withdeep convolutional neural networks,” Neurocomputing,vol. 365, pp. 157–170, 2019.
[14] R. Girshick, “Fast R-CNN,” in 2015 IEEE International Confer-ence on Computer Vision (ICCV), Santiago, Chile, 2015.
[15] K. He, G. Gkioxari, P. Dollar, and R. Girshick, “Mask R-CNN,”IEEE Transactions on Pattern Analysis and Machine Intelli-gence, vol. 42, no. 2, pp. 386–397, 2020.
[16] H. Lee and J. Kim, “Segmentation of overlapping cervical cellsin microscopic images with superpixel partitioning and cell-wise contour refinement,” in 2016 IEEE Conference on Com-puter Vision and Pattern Recognition Workshops (CVPRW),pp. 3431–3440, Las Vegas, NV, USA, 2015.
[17] Z. Lu, G. Carneiro, and A. P. Bradley, “Automated nucleus andcytoplasm segmentation of overlapping cervical cells,” inAdvanced Information Systems Engineering, pp. 452–460,MICCAI, Springer, 2013.
[18] Z. Lu, G. Carneiro, A. P. Bradley et al., “Evaluation of threealgorithms for the segmentation of overlapping cervical cells,”IEEE Journal of Biomedical and Health Informatics, vol. 21,no. 2, pp. 441–450, 2017.
[19] H. Chen, K. Sun, Z. Tian, C. Shen, Y. Huang, and Y. Yan,“BlendMask: top-downmeets bottom-up for instance segmen-tation,” in 2020 IEEE/CVF Conference on Computer Vision andPattern Recognition (CVPR), pp. 8570–8578, Seattle, WA,USA, 2020.
10 Computational and Mathematical Methods in Medicine