seeking the beijing consensus in asia: an empirical test of soft power jiakun jack zhang, uc san...
TRANSCRIPT

Seeking the Beijing Consensus in Asia: An Empirical Test of Soft Power
Jiakun Jack Zhang, UC San Diego
Annual Meeting of the Pacific Chapter of American Association for Public Opinion Research (PAPOR)
San Francisco, 11 December 2014

Findings
• Few empirical tests exist to quantify the alleged expansion of Chinese soft power
• This paper makes first-cut effort at operationalizing soft power using public opinion data
• I find no evidence that favorable views of China are correlated with increased support for the China Model of development OR decreased support for democracy

Beijing ConsensusChina Model
• Soft power challenge: Economic and Ideological• Focus: Ideological challenge to the Washington
Consensus (liberal democratic order) • Beijing Consensus = non-democratic version of state
capitalism• Soft Power = China’s influence measured by public
opinion survey

Variables
• 2010 Asian Barometer Survey • Independent Variables
• China’s Regional Influence • China’s Country Influence • China’s Future Influence
• Dependent Variables • Development Preference (China Model) • Democracy Preference

Asian Barometer Survey
• Part of the Global Barometer Survey network• ABS researchers regularly collect nationally
representative public opinion data from 13 East Asian countries on 22 topics
• Uses a standard survey instrument translated into local languages, administered through face-to-face interviews
• Average sample size of 1200 respondents• Wave 3: data from Taiwan, Philippines, and Mongolia in
2010


Hypotheses
• H1a: Those who perceive China’s influence in the region as positive are more likely view China as a model for their own country’s development. (chinainf & devpref)
• H1b: Those who perceive China’s influence on their country as positive are more likely view China as a model for their own country’s development. (q161 & devpref)
• H1c: Those who perceive China’s influence as growing are more likely view China as a model for their own country’s development. (change & devpref)
• H2a: Those who perceive China’s influence in the region as positive are less likely to favor democracy. (chinainf & dempref)
• H2b: Those who perceive China’s influence on their country as positive are less likely to favor democracy. (q161 & devpref)
• H2c: Those who perceive China’s influence as growing are less likely to favor democracy. (change & devpref)
China’s Influence Development Preference Democracy Preference
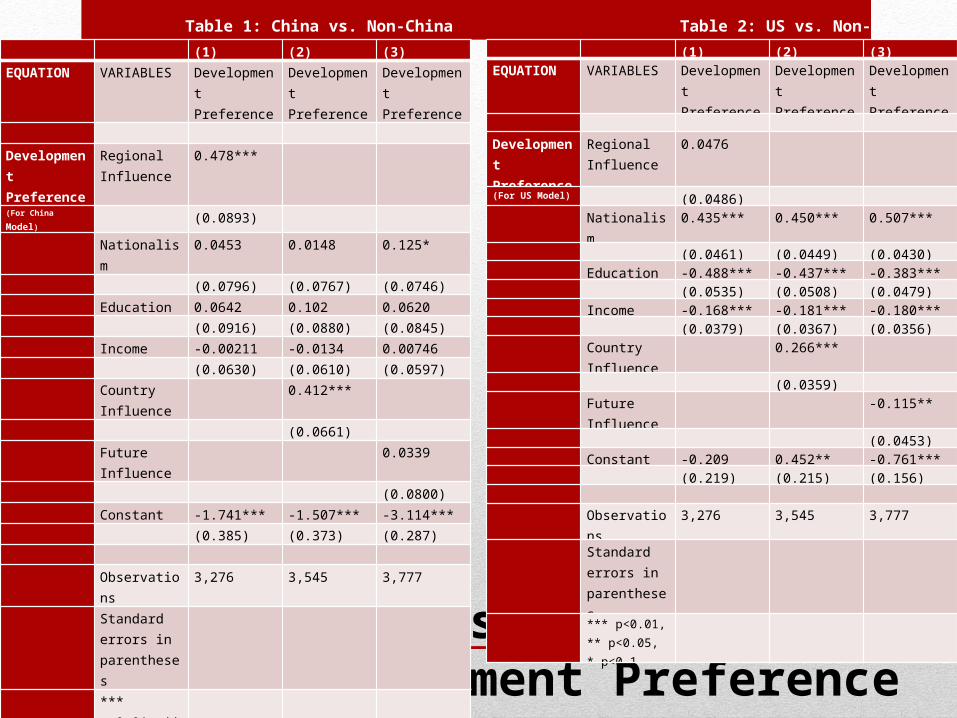
Logit Regression Results for Development Preference
(1) (2) (3)EQUATION VARIABLES Development
PreferenceDevelopment Preference
Development Preference
Development Preference
Regional Influence
0.478***
(For China Model) (0.0893) Nationalism 0.0453 0.0148 0.125* (0.0796) (0.0767) (0.0746) Education 0.0642 0.102 0.0620 (0.0916) (0.0880) (0.0845) Income -0.00211 -0.0134 0.00746 (0.0630) (0.0610) (0.0597) Country
Influence 0.412***
(0.0661) Future
Influence 0.0339
(0.0800) Constant -1.741*** -1.507*** -3.114*** (0.385) (0.373) (0.287) Observations 3,276 3,545 3,777 Standard errors
in parentheses
*** p<0.01, ** p<0.05, * p<0.1
Table 1: China vs. Non-China Table 2: US vs. Non-US
(1) (2) (3)
EQUATION VARIABLES Development Preference
Development Preference
Development Preference
Development Preference
Regional Influence
0.0476
(For US Model) (0.0486)
Nationalism 0.435*** 0.450*** 0.507***
(0.0461) (0.0449) (0.0430)
Education -0.488*** -0.437*** -0.383***
(0.0535) (0.0508) (0.0479)
Income -0.168*** -0.181*** -0.180***
(0.0379) (0.0367) (0.0356)
Country Influence
0.266***
(0.0359)
Future Influence
-0.115**
(0.0453)
Constant -0.209 0.452** -0.761***
(0.219) (0.215) (0.156)
Observations 3,276 3,545 3,777
Standard errors in parentheses
*** p<0.01, ** p<0.05, * p<0.1

Ordered Probit Regression Results for Democracy Preference
(1) (2) (3)EQUATION VARIABLES Democracy
PreferenceDemocracy Preference
Democracy Preference
Democracy Preference
Regional Influence
0.0907***
(4 variable) (0.0269) Education 0.104*** 0.102*** 0.0940*** (0.0289) (0.0278) (0.0271) Income -0.0298 -0.0351* -0.0463** (0.0198) (0.0192) (0.0187) Nationalism 0.0698*** 0.0686*** 0.0807*** (0.0249) (0.0243) (0.0233) Country
Influence 0.0705***
(0.0197) Future Influence 0.0129
(0.0250)cut1 Constant -1.445*** -1.512*** -1.287*** (0.125) (0.122) (0.0931)cut2 Constant -0.000476 -0.0633 0.146 (0.122) (0.119) (0.0901) Observations 3,087 3,328 3,509 Standard errors
in parentheses
*** p<0.01, ** p<0.05, * p<0.1
Table 3 : Large Democracy
(1) (2) (3)
EQUATION VARIABLES Democracy Preference
Democracy Preference
Democracy Preference
Democracy Preference
Regional Influence
-0.0824***
(1 variable) (0.0248)
Education 0.0551** 0.0564** 0.0687***
(0.0262) (0.0252) (0.0245)
Income -0.00149 0.0129 0.0198
(0.0181) (0.0175) (0.0171)
Nationalism -0.0488** -0.0434* -0.0556***
(0.0230) (0.0224) (0.0215)
Country Influence
-0.0690***
(0.0181)
Future Influence -0.000356
(0.0230)
cut1 Constant -0.00394 0.0983 -0.113
(0.112) (0.109) (0.0823)
cut2 Constant 0.933*** 1.025*** 0.819***
(0.113) (0.110) (0.0830)
cut3 Constant 1.659*** 1.740*** 1.530***
(0.115) (0.112) (0.0854)
Observations 3,143 3,393 3,589
Standard errors in parentheses
*** p<0.01, ** p<0.05, * p<0.1
Table 4 : Small Democracy

Conclusions
• Evidence for Beijing Consensus theory very weak: • Affinity for Chinese influence had negligible impact on
the respondent’s desire to adopt the China Model • No relationship could be found between favorable
attitudes towards China and preference for democracy • Asia was easy case: if BCT fails in Asia it should fail
elsewhere • Alternative Explanations: hard power matters • Future Extensions: Complete ABS surveys, Africa survey
China’s Influence Development Preference? Democracy Preference?