sedimentation and eutrophication research on … · sedimentation and eutrophication research on...
TRANSCRIPT

SEDIMENTATION AND EUTROPHICATION RESEARCH O N THREE SMALL RESERVOIRS
November 1969 ARS 41-158
Agricultural Research Service
UNITED STATES DEPARTMENT OF AGRICULTURE

SEDIMENTATION AND EUTROPHICATION RESEARCH ON THREE SMALL RESERVOIRS'
D. L. Rausch and H. G. ~ e i n e m a n n ~
INTRODUCTION
Reservoir designs are based on storage requirements for water and sediment and on desired reservoir opera- tion. Information needed for accurate reservoir designs-in addition to the necessary hydrologic factors-includes sediment yield from upstream water- sheds, distribution and volume-weight of deposited sediment, density currents, thermal stratification, reser- voir trap efficiency, and eutrophication. Recent advances in instrumentation and techniques now make it possible to develop this needed information.
Comprehensive reservoir studies are needed to learn more about the interaction between sedimentation aspects and between sedimentation and eutrophication. These studies are necessary for optimum reservoir designs. Such designs require an understanding of the basic physical and chemical actions in these water bodies. Because millions of dollars are spent on the construction of reservoirs each year, we must learn to predict what will happen under different conditions and to use the controls that are available for maximum benefits.
Research to date has been fragmental and has usually been directed toward very narrow aspects of the total problem. Many reservoir sedimentation surveys have been made in the past; but, almost without exception, the objective has been some operational feature and the studies usually have not been detailed enough to gain an understanding of the basic processes involved.
The Soil Conservation Service, the Agricultural Re- search Service, and the U.S. Geological Survey are
Soil and Water Conservation Research Division, Agricultural Research Service, USDA, in cooperation with the Agricultural Engineering Department of the Missouri Agricultural Experiment Station, Columbia, Mo.
Agricultural Engineer and Director, respectively, North Central Watershed Research Center, Columbia, Mo.
cooperating on a national tiap efficiency study of small reservoirs. Preliminary reports on this study were made by Gottschalk (813 of the Soil Conservation Service and Guy (10) of the U.S. Geological Survey. Brune (4) and Moore, Wood, and Renfro (17) previously reported on the trap efficiency of small reservoirs. In these studies, the trap efficiency was determined, but the basic factors affecting it were not studied.
There are a few reports on density currents and thermal stratification, but these are usually on large reservoirs. None exist, to our knowledge, on small reservoirs where related hydrological data are also obtained. Koberg and Ford (14) give a good explanation of the development of thermal stratification, and Heine- mann, Rausch, and Campbell (13) show some curves of such stratification. The latter report also gives data on the concentrations of some flocculating agents.
Gottschalk and Brune (9); Glymph (7); Ackerman and Corinth (2); and Farnum, Beer, and Heinemann (5) evaluated the parameters affecting sediment yield to small reservoirs. Borland and Miller (31, Heinemann (11), and Stall (19) studied the distribution of sediment within reservoirs. Heinemann (12) and McHenry (16) studied the volume-weight of deposited sediment in small reservoirs.
This publication describes a comprehensive research program that was initiated in 1968 on three small reservoirs near Columbia, Mo. The program includes studies of reservoir trap efficiency, density currents, thermal stratification, eutrophication, sediment yield, and reservoir sediment distribution and volume-weight. The publication also describes the instrumentation used in such studies, some of which is new.
31talic numbers in parentheses refer to Literature Cited at end of publication.
RESERVOIR DESCRIPTION
The following criteria were established for the high so that some of the storage parameters will change selection of the reservoirs being studied: (1) they must during the study; and (4) the reservoirs must be free of either be new, or all the original data must be available; boat traffic, and the instruments must be well protected. (2) they must represent the predominant sizes now being After a thorough search, three reservoirs were constructed; (3) the estimated sediment yield must be selected. Physical data are given in table 1.
TABLE 1.-Physical data of reservoirs and their watersheds1
Reservoir Characteristic
-
Ashland Bailey Callahan
Surface area (acres) . . . . . . . . . . . . . . . . . . . . . . . . . . . . . . . . Capacity (acre-feet)
. . . . . . . . . . . . . . . . . Water depth (feet) . . . . . . . . . . . . . . . . . . . Shape factor2
Date of construction . . . . . . . . . . . . . . . Flood storage, runoff (inches) . . . . . . . . . .
Watershed Characteristic
Area (acres) . . . . . . . . . . . . . . . . . . . . . Average land slope (percent) . . . . . . . . . . .
. . . . . . . . . . . . . . . . . . . . . Soil texture
2,480 0.8
Clay loam to
silt loam
235 1.1
Clay loam to
silt loam
3,600 1 .o
Clay loam to
silt loam
'Numbers in parentheses apply to the reservoir at emergency spillway elevation. 2 ~ h a p e factor is the length of the reservoir divided by the diameter of a circle of equal area.
STUDY PROCEDURE
The study of these three reservoirs includes measure- the reservoir (stage and stratification). Thus, trap effi- ment of: (1) the inflow and outflow of water, (2) nutri- ciency must be studied on a storm basis to determine ent and sediment concentrations of inflow, outflow, and which factors affect it. reservoir water, (3) temperature distribution throughout the reservoir, (4) density currents, and (5) characteristics and distribution of deposited sediment. These data are collected from three general locations on each reservoir-the main tributary, the reservoir, and the spillway. For the Ashland reservoir, these locations and the data collected at each are shown in figure 1.
Trap Efficiency
One of the more important factors affecting the design of a reservoir is its desired trap efficiency. Reservoir trap efficiency is defined as the percentage of the sediment yield to a reservoir that is retained in it. The trap efficiency for a given reservoir is not a constant factor. It can be expected to vary with volume and rate of the runoff, sediment characteristics and concentra- tions, temperature of the water, and initial condition of
There are two methods of determining the amount of sediment retained in the reservoir over a given period of time. The first is to measure directly by reservoir sedimentation survey, at the beginning and end of the time period, the volume of deposited sediment and to sample the sediment to determine its volume-weight. Total weight of sediment deposited is computed using the volume and volume-weight. The second method is to subtract the sediment outflow of the reservoir from the total sediment inflow. This requires.continuous measure- ment of the sediment inflow and outflow. To measure trap efficiency on a storm basis, it is necessary to use this second method of determining sediment retained.
The equation for computing trap efficiency using the second method is:
Trap Efficiency (percent) = 100 Sediment inflow -Sediment outflow
X Sediment inflow

6 4 RANGE 19
Main tributary Stream discharge Samples
Suspended Sediment Nutrient of water and solids
Reservoir
RANGE 10 l- Velocity and Direction of Density Currents Water ~em~erature (TI Nutrient Samples of Water Sedimentation Survey along Ranges
RANGE 9 Volume-weight Particle-size Distribution
k ,
RANGE 8 Volume of Deposition Nutrients in Sediment
Water Stage (for Discharge) Samples
0 200 400 600 800 1000 Suspended Sediment r - - - - - Nutrient of water and solids
SCALE IN FEET
Figure 1.-Data collection locations, Ashland reservou,and type of information collected.
To measure sediment inflow, an instrumentation system has been set up on the main tributary of each reservoir. This system measures and records the stage of streamflow and samples streamflow at predetermined but varied intervals. 1t also records the time of sampling.
The stage is measured by a servo-manometer "bubbler" unit connected by a drive chain to an FW-1 water stage recorder (fig. 2): Bubbles come through an orifice mounted in a tee and then flow into a vertical 2-inch pipe located in the stream channel and perforated to allow water to cover the orifice. Water pressure at the orifice is transmitted through the bubble tube to the servo-manometer where it is measured. Stream gaging
and precalibrated weirs are used to correlate stage with discharge.
Samples of streamflow are taken using a PS-66 pumping sampler (6). This device pumps a sample from a stream and bottles it (fig. 3). When the sampling cycle begins, the intake hose is backflushed from a storage container to clear the intake of debris and to prime the pump. The pump then begins to operate, pumping water from the stream through the sample trap, refilling the backflush barrel. The pump is then shut off and the sample trap is opened, allowing the sample to flow into a bottle. The nozzle is then shifted to the next bottle and the sampler is ready for the next sample.

Figure 2.-Servo-manometer and FW-1 recorder. Figure 4.-Water-level switches and bubbler orifice pipe.
Figure 3.-PSd6 pumping sampler with pint bottles.
Sampling is automatically initiated by two sub- systems. The first subsystem, which was furnished with the sampler, is made up of three water-level switches and a masteFclock switch. The three water-level switches are installed at varying depths in the stream channel on the bubbler orifice, as shown in figure 4. Samples are taken every 5 minutes when all three switches are floating, every 30 minutes when two switches are floating, and every 60 minutes when one switch is floating.
-. rlgure 5.-One-way cam on servo-manometer drlvc sprocke .
Since this subsystem provided too few samples on the rising portion of the hydrograph where the concen- tratior, is the highest, the control was modified to provide a second overriding subsystem for initiating sampling. A one-way cam was connected to the servo- manometer drive sprocket, as shown in figure 5. This cam activates a microswitch when a rise in stage is detected and causes a sample to be taken every 0.19-, 0.25, or 0.3-foot rise of stage (depending on which cam is used). The time each sample is taken is recorded on the FW-I stage recorder by a blip of the event marker connected to the sampler. As many as 144 pint samples can be taken automatically by this sampler. These subsystems provide enough samples to characterize the sediment concentration accurately during storm runoff.
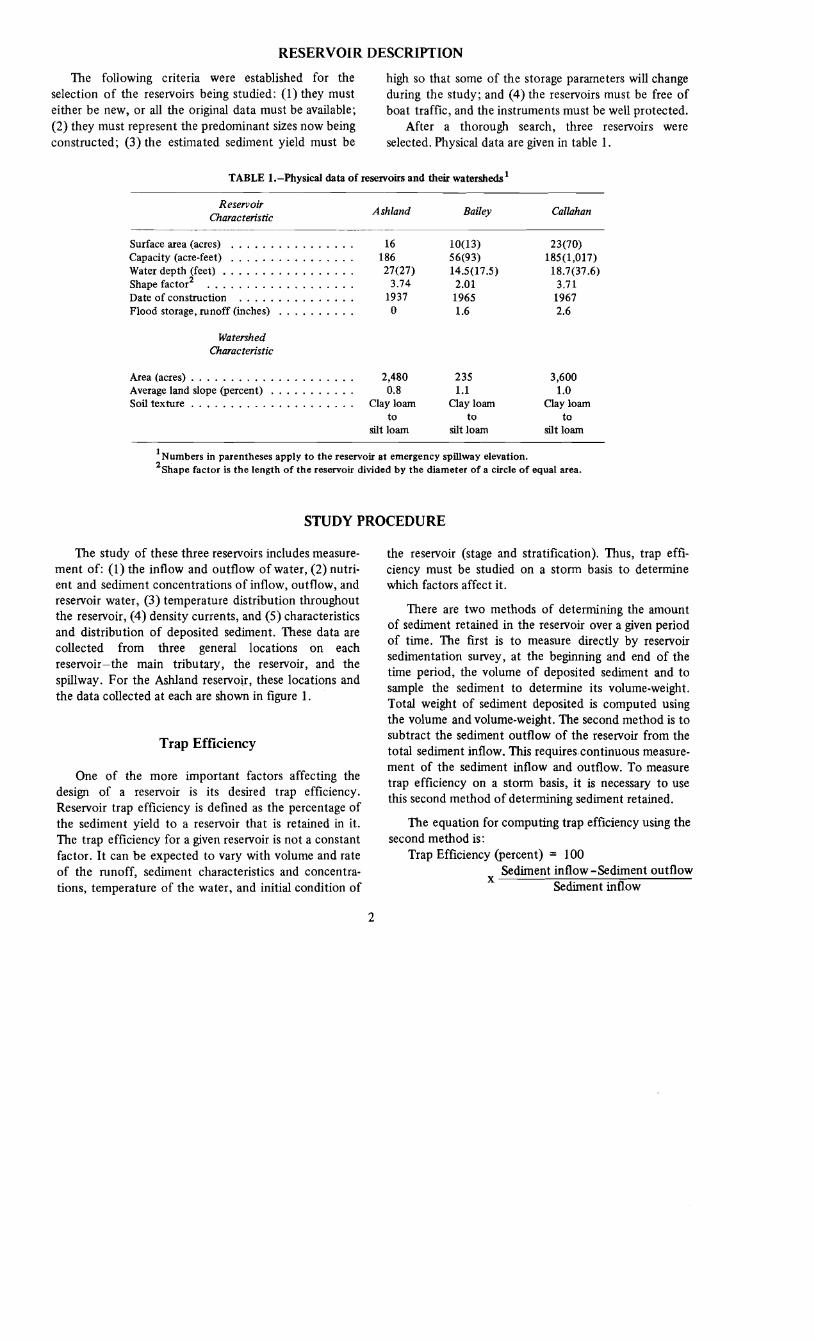
The intake to the sampler is designed to withdraw the water-sediment mixture simultaneously from several levels of streamflow. The intake shown in figure 6 is raised to show five %-inch holes on each side of the arm
Cq'iai:e i t . S;;.iivav P i p e , " rp . . . - - - . ' , --
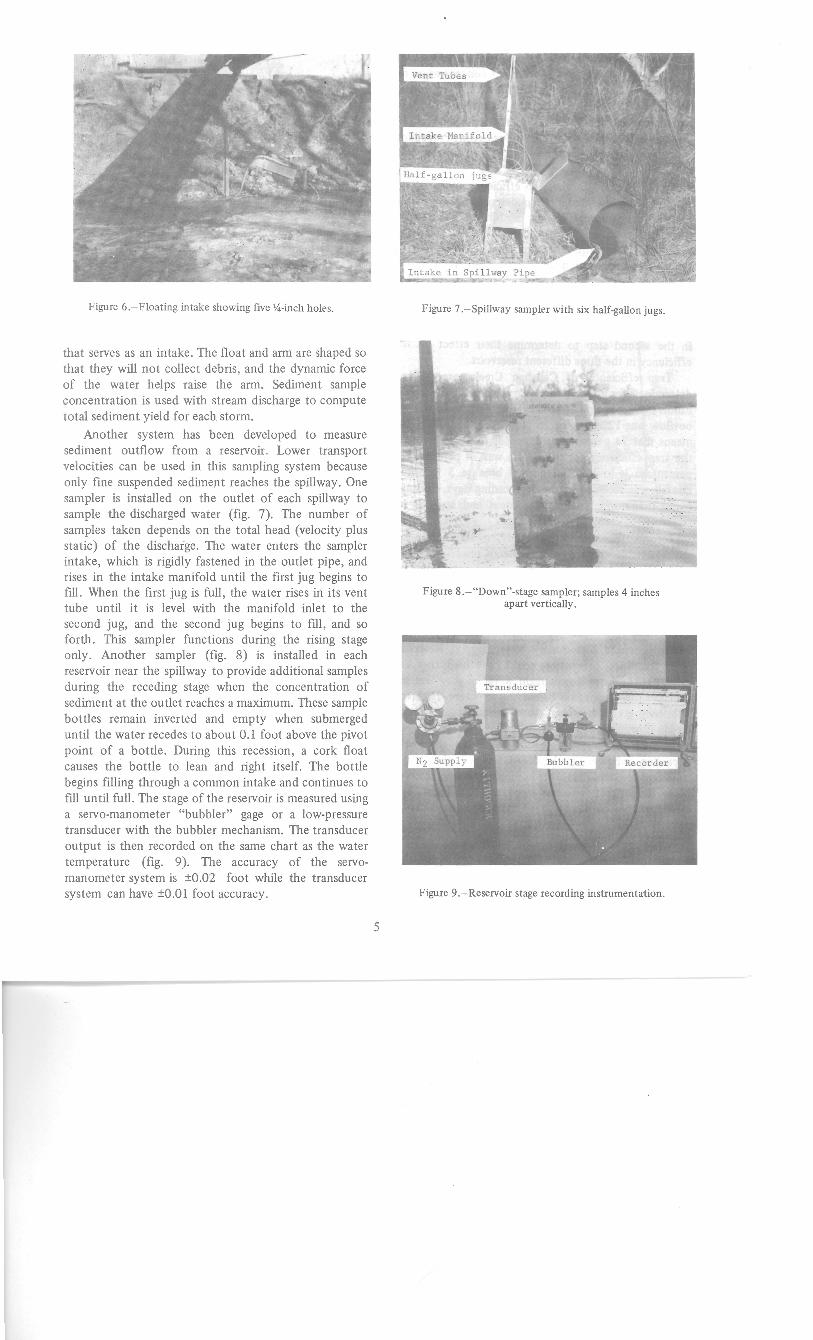
Figure 6.-Floating intake showing five %-inch holes. Figure 7.-Spillway sampler with six half-gallon jugs.
that serves as an intake. The float and arm are shaped so that they wiU not collect debris, and the dynamic force of the water helps raise the arm. Sediment sample concentration is used with stream discharge to compute total sediment yield for each storm.
Another system has been developed to measure sediment outflow from a reservoir. Lower transport velocities can be used in this sampling system because only fine suspended sediment reaches the spillway. One sampler is installed on the outlet of each spillway to sample the discharged water (fig. 7). The number of samples taken depends on the total head (velocity plus static) of the discharge. The water enters the sampler intake, which is rigidly fastened in the outlet pipe, and rises in the intake manifold until the first jug begins to fill. When the first jug is full, the water rises in its vent tube until it is level with the manifold inlet to the second jug, and the second jug begins to fdl, and so forth. This sampler functions during the rising stage only. Another sampler (fig. 8) is installed in each reservoir near the spillway to provide additional samples during the receding stage when the concentration of sediment at the outlet reaches a maximum. These sample bottles remain inverted and empty when submerged until the water recedes to about 0.1 foot above the pivot point of a bottle. During this recession, a cork float causes the bottle to lean and right itself. The bottle begins filling through a common intake and continues to fill until full. The stage of the reservoir is measured using a servo-manometer "bubbler" gage or a low-pressure transducer with the bubbler mechanism. The transducer output is then recorded on the same chart as the water temperature (fig. 9). The accuracy of the servo- manometer system is f0.02 foot while the transducer system can have k0.01 foot accuracy.
Figure 8.-"Downm-stage sampler; samples 4 inches apart vertically.
Figure 9.-Reservoir stage recording instrumentation.

Total sediment outflow is computed for each storm using spillway discharge and sediment concentration for each sample. Sediment deposited for each storm is then the difference between sediment inflow and outflow. The computed values of sediment deposited can be checked by periodic surveys of the reservoir. Procedures for these surveys have been explained in previous publications (12, 18).
Data collected in the trap efficiency phase of this study will be analyzed first to determine the variables that affect trap efficiency within each reservoir- watershed complex. These variables include those that vary with each storm, such as rate and volume of runoff, sediment concentration in runoff, and temperature, stratification, and water level in the reservoir. Constants in the first step of the analysis are reservoir capacity, shape, and depth; spillway capacity; and watershed size, shape, slope, and soils. These constants will be analyzed in the second step to determine their effect on trap efficiency in the three different reservoirs.
Trap efficiency of Callahan Creek reservoir was determined for the largest storm of 1968 (0.59 inch of runoff). The sediment inflow was 464 tons and the outflow was 122 tons, or 26 percent of the inflow. This means that 74 percent was deposited in the reservoir, or the trap efficiency for that storm was 74 percent. This percentage is lower than normal because 3 inches of rainfall was received in the 3 preceding days, causing a higher-than-normal sediment content and stage in the reservoir.
Information gained by studying trap efficiency should enable the engineer to design reservoirs with a desired range of trap efficiency. Local conditions and reservoir use will indicate the specific range of trap efficiency that is desirable and, hopefully, possible. Water supply and recreational reservoirs should normally require low trap efficiency in order to trap less sediment and maintain a high-quality water supply. Reservoirs built for flood prevention could have high trap effi- ciency to improve downstream water quality and pre- vent channel deposition below the structure. High trap efficiency could, however, cause serious channel degra- dation down~trearn.~
If accurate design data become available, the cost of bypassing sediment can be compared with the cost of removing the sediment or building another reservoir when the original one has filled with sediment. This should enable construction of more economical struc- tures.
--
Roehl, J . W . Sediment delivery ratios and the effects of structures on downstream contributions. Presented at the ARS- SCS Sedimentation Workshop, Panguitch, Utah, September 12, 1962.
Density Currents
Density currents5 have been observed on large reservoirs, but their existence and magnitude on small reservoirs are unknown. To fully understand differences in sediment distribution and trap efficiency, density currents must be considered. The depth and existence of density currents in a reservoir are related to thermal stratification of the water and to sediment concen- tration.
As the temperature varies with depth, the density of water changes. As a result, the coolest and most dense water is on the bottom and the warmest and least dense water is at the surface. Because of these differences in density, water does not mix and becomes stratified during the warmer months of the year. Limnologists have divided the water depth into three layers: (a) epilimnion, a layer of little temperature change from the surface to the level where the temperature changes rapidly with depth, (b) thermocline, the layer where the temperature changes rapidly with depth, and (c) hypo- limnion, the layer of isothermal water between the thermocline and the bottom of the reservoir. When water enters the reservoir, it sinks to a layer of equal density or to the bottom if it is more dense than the hypolimnion.
To detect movement of density currents and to measure thermal stratification in these three reservoirs, a temperature monitoring system was established. Six or seven locations in each reservoir are monitored for temperature changes at different depths by 22 thermo- couples (fig. 10). Water temperatures are monitored at one to five depths at each location. The thermocouples are attached to a rope anchored at one end and connected to floats at the other. The thermocouple leads are run along the bottom of the reservoir to an instrument house on shore where temperatures are recorded by a multipoint recorder.
Temperature of the incoming water is measured by one of the thermocouples located near the main tribu- tary. The change in temperature of other thermocouples to this temperature indicates the passage of the incoming water. The time it takes the incoming water to pass from one location to another'can be used to determine the
'A density current is the gravity flow of a fluid through, under, or over another fluid of different density, such as sediment-laden water flowing through a reservoir. It retains its unmixed identity because its density differs from that of the water through which it flows.

BAILEY RESERVOIR
. I
Location of top thermocouple at each location. J
Figure 10.-Location and depth (feet) of thermocouples.

velocity of the incoming water in that section of the reservoir. If the temperature change is confined to the bottom of the reservoir or to a given depth, it is likely to be a density current. This can be verified if the temperature of the incoming water is warmer than that of the overlying water and if the sediment concentration is high enough to make it more dense and remain beneath the cooler water. However, if the temperature of the incoming water is the same as that of the hypolimnion, the density current cannot be detected by this method.
The temperature monitoring system in Callahan Creek reservoir detected a temperature change caused by sediment-laden runoff from a storm of February 1,1968, moving through the cooler water already in the reservoir. Water temperature near the bottom and at the head of the reservoir was 44°F. t o 45' and rose 4' at 0505 hours with the entrance of warmer storm runoff (49'). After 35 minutes, the storm runoff reached a point 1,000 feet farther into the reservoir, indicating a velocity of 0.5 foot per second. In the 800-foot reach above the dam, the density current velocity was 0.35 foot per second. It took 5 days for the sediment to settle out of the influent sufficiently to allow the warmer water to mix with the cooler water and return the reservoir to an isothermal condition.
Another instrument is being developed to measure low velocities and direction of flow of water in reservoirs. This instrument is a small buoyant cylinder with one end attached to the top of a vertically mounted, flexible beam. Movement of the water-and, therefore, the cylinder-will cause a deflection of the beam which is measured by strain gage equipment. The instrument is designed to measure velocities from 0.01 foot per second t o 1 foot per second and horizontal direction to the nearest 5". Tests are being conducted now to determine its accuracy and feasibility for use in reservoirs.
The ability to measure density currents will aid in understanding and predicting sediment distribution throughout the reservoir. Also, if density currents are frequent and predictable, structures can be designed to bypass sediment and thereby control the trap efficiency.
During early stages of storm runoff, sediment-laden water can be seen entering a "clear" reservoir and, usually, sinking beneath the clear surface water. The surface remains clear and is discharged through the spillway. This suggests that sediment-laden water is moving along the bottom and that if it were discharged instead of surface water, trap efficiency would be lowered.
Eutrophication
Enrichment of our water resources by industrial, urban, and farm wastes and by fertilizers is an urgent problem. Reservoir eutrophlcation6 by nitrate and phosphate is serious in many areas. This entire problem and its effect on reservoirs needs to be studied.
The purpose of this study is to determine (1) the quantity and character of nutrients entering the reservoir from agricultural watersheds, (2) the degree to which the reservoir utilizes or traps these nutrients, (3) the quan- tity and character of nutrients discharged from the reservoir, and (4) the possibility of some degree of control by reservoir management and design. These data will be related to water inflow and outflow, sediment characteristics, and to trap efficiency of the reservoir.
The method for measuring nutrient flow is similar to that used for measuring sediment flow. Inflow samples taken by the pumping sampler and outflow samples taken by the spillway samplers will also be analyzed for the selected nutrients. Nutrient concentration, together with the discharge past each sampler, will give nutrient inflow and outflow for a reservoir on a storm basis. The difference between the nutrient inflow and outflow will be the amount trapped in the reservoir. Because nutri- ents trapped during a storm flow may be discharged later through base flow if they are in solution or remain in suspension, additional water samples may be taken directly from the reservoir to verify trapping, chemical change, and stratification of nutrients. Samples of sediment deposited in the reservoir will be analyzed to determine nutrient content.
To learn which nutrients are attached to sediment particles and which are in solution, the liquids and solids of each sample will be analyzed individually. The liquid phase will be analyzed for nitrate and phosphate and possibly nitrite. The solids will be analyzed for total nitrogen and total phosphorus. We expect most of the phosphate to be attached to sediment particles, whereas most of the nitrate will be in solution. The presence of organic matter may cause an exception to this.
The source of nutrients will be determined from precipitation and land management data. Recording rain gages are dispersed throughout each watershed to record each rainfall event. Soil erodibility will be evaluated from soils and topographic maps of each watershed.
Eutrophication is the excessive fertilization of waters with nutrients, notably nitrogen and phosphorus, which results in the degradation of the material beauty and usefulness of the waters. The process is caused by nature as well as man ( I ) .

Field erosion will be evaluated by direct observation. Farmers will be interviewed to determine fertilizer application rate, cultivated acreage, pasture stocking rate, and other management practices that affect nutri- ent inflow. This information is needed not only to show how nutrients are supplied to a reservoir, but also to show how to manage the movement of these nutrients, and how reservoirs can best be managed or designed to ensure quality water. If the sediment that enters a reservoir can be controlled or bypassed, nutrients that are attached to the sediment or held in solution in the density current can also be controlled. The ability to control the movement of nutrients is necessary to minimize eutrophication of our reservoirs.
Sediment Yield, Distribution, and Volume-Weight
To design a reservoir accurately, the design engineer must predict the sediment yield, its distribution within the impoundment, and its volume-weight throughout the design life of the reservoir. If sediment storage is underdesigned, the reservoir will fill with sediment more rapidly than planned, resulting in more rapidly diminish- ing usefulness. This spreads the initial cost over a shorter time base than anticipated. Conversely, if sediment storage is overdesigned, the estimated initial cost will be excessive and the reservoir may not even be built.
The accuracy of predicting the sediment storage depends on the prediction of the three factors men- tioned above-sediment yield, distribution, and volume- weight-and on knowledge of the trap efficiency of the designed structure. Sediment yield, as discussed earlier, is the amount of sediment that enters the reservoir. It directly affects the amount of sediment that is deposited and will be measured at the pumping sampler locations.
The distribution of sediment shows the location of sediment deposits in reservoirs. It is expressed as the percentage of total sediment that is located downstream from a vertical plane or below a horizontal plane of the reservoir and it is computed on a volume basis. The distribution is usually shown as a mass diagram'in which the percentage of accumulated sediment is plotted, either against percentage of total depth or percentage of total distance from the dam. The empirical equations developed by Heinemann (11) and others for predicting sediment distribution in small reservoirs in the loessial hills area of the Missouri River Basin will be tested on these reservoirs. The prediction of the sediment distribu- tion in a new reservoir affects the design location of the principal spillway and, in turn, the amount of storage available for sediment below and above the spillway.
The volume-weight of sediment is more difficult to predict because it varies widely within a reservoir and from one reservoir to another. Volume-weight is defined as the weight of dry sediment per unit volume. It is measured by analyzing volumetric samples of the sedi- ment or by measuring sediment in place using a gamma density probe (12). The volume-weight of the sample varies with its composition, depth in sediment, and whether or not it has been exposed and dried. The volume-weight must be predicted to determine the capacity of the reservoir to accommodate sediment.
Lane and Koelzer predicted volume-weight of fine sediment based on the percentage of sand, silt, and clay, operating level of the reservoir, and years after deposi- tion (15). This method was based on many field samples, with recognition that volume-weight varied with com- position and degree of consolidation.
Other empirical relationships have also been devel- oped for small reservoirs. For Sabetha Lake in Kansas (12), Heinemann's best equation for predicting its volume-weight was:
where w/v is the volume-weight, in pounds per cubic foot; D is the depth of sediment, in feet; and C is the percentage of clay (< 2p). The coefficient of deter- mination, R 2, was 0.790.
For Ashland Lake in Missouri (131, we applied the theory of consolidation, which shows that the void ratio varies with the intergranular pressure. Using this theory, the best equation for predicting volume-weight was:
where C is the percentage of clay (<4p) and the other symbols are as defined above. The coefficient of determination for this equation was 0.823.
In this study, sediment yield, distribution, and volume-weight will be determined from reservoir sedi- mentation surveys (18). Volumetric samples will be taken for volume-weight and particle-size analysis. The gamma probe will also be used for volume-weight measurements where the sediment is thicker than 18 inches. To study consolidation of the sediment more closely, access tubes will be installed in the delta areas of these reservoirs. These tubes will serve several functions: (1) the gamma probe can be lowered without disturbing the sediment; (2) the probe can be lowered in the same location each time; and (3) the volume-weight of the entire depth of sediment can be measured easily where it would otherwise be impenetrable. Changes in volume- weight with time can thus be studied.

Sedimentation surveys made on these three reservoirs the first 3 months after construction). Volume-weight have shown the average annual sediment deposition of determined by the gamma probe and volumetric sampler drainage area to be: Ashland, 2.4 tons per acre; Bailey, varied from 30 to 88 pounds per cubic foot. 4.0 tons per acre; and Callahan, 1.6 tops per acre (for
DISCUSSION AND SUMMARY
At present, we lack useful knowledge on the sedi- mentation and eutrophication of small reservoirs. Some information exists on sediment yield, but little exists on the processes involved in reservoir sedmentation and eutrophication. Information is sorely needed to optimize reservoir designs for extended usefulness.
The object of this research program is to study all the facets of reservoir sedimentation concurrently, in an effort to determine the relationships between its various components. Every effort is being made to ensure a useful, complete, and detailed study with wide applica- tion.
The research plan discussed in this publication will enable us to measure and sample everything coming into the reservoir, to study behavior in the reservoir, and to analyze the discharge from the reservoir. The source of runoff entering the reservoir will be determined from rain gages, soils, and topographic maps of the watershed.
The inflow will be evaluated for the following items: runoff rate, sediment concentration and composition, nutrient concentration and composition, and tempera- ture. In the reservoir itself, the movement of the inflow can be followed by means of current meters giving the direction and velocity of the flow and also by water temperature measurements. Periodically, the reservoir
water will be sampled for an analysis of the nutrient content. Periodic detailed reservoir sedimentation sur- veys will be made to determine the distribution, volume, and mlume-weight of the deposited sediment, as well as its nutrient content, particle-size distribution, specific gravity, and other physical dimensions.
The changes in volume-weight of the deposited reservoir sediment can be related to time by using permanently installed access tubes. These access tubes permit the lowering of the gamma probe into the deposited sediment to any depth without disturbing the sediment.
Equipment on the principal and emergency spillways provide samples for evaluating the rate and amount of sediment and nutrients carried out of the reservoir.
Recent advances in instrumentation techniques made it possible to set up a very comprehensive and detailed study of reservoirs involving trap efficiency, density currents, thermal stratification, eutrophication, and sedi- ment yield, distribution, and volume-weight. Similar studies should be undertaken for each major soils- topographic region. Such data would help the planners and designers of reservoirs control and conserve our soil and water resources.
LITERATURE CITED
(1) Anonymous. 1967. Eutrophication Symposium. U.S. Dept.
Agr., Agr. Sci. Review, Third Quarter, p. 35. (2) Ackermann, W. C., ind Corinth, R. L.
1962. An empirical equation for reservoir sedi- mentation. Comn. of Land Erosion, Inter- natl. Assoc. of Sci. Hydrol. Proc. 59: 359-366.
(3) Borland, W. M., and Miller, C. R. 1960. Distribution of sediment in large reservoirs.
Amer. Soc. of Civ. Engin. Trans. 125 (I): 166-180.
(4) Brune, Gunnar M. 1953. Trap efficiency of reservoirs. Amer. Geo-
phys. Union Trans. 34 (3): 407-418. (5) Farnum, C. W., Beer, C. E., and Heinemann, H. G.
1966. Evaluation of factors affecting reservoir
sediment deposition. Internatl. Assoc. of Sci. Hydrol. Proc. 7 1 : 747-758.
(6) Federal Inter-Agency Sedimentation Project 1966.. Catalog, instruments and reports for fluvial
sediment investigations. (7) Glymph, L. M., Jr.
1954. Studies of sediment yields from watersheds. Tenth General Assembly, Internatl. Union of Geodesy and Geophysics. Proc. 36: 178-191.
(8) Gottschalk, L. C. 1965. Trap efficiency of small floodwater-
retarding structures. ASCE Water Resources Engin. Conf., Mobile, Ala., Reprint 147, March.
(9) and Brune, G. M. 1950. Sediment design criteria for the Missouri

Basin loess hills. U.S. Dept. Agr., Soil Conserv. Sew., SCS TP97,21 pp.
(10) Guy, H. P., and others. 1958. Sediment yield from small watersheds and
its detention by flood-retarding stmctures. U.S. Dept. of Interior, Geol. Survey, Water Resources Div., Washington, D.C., 174 pp.
(1 1) Heinemann, H. G. 196 1. Sediment distribution in small floodwater-
retarding reservoirs. U.S. Dept . Agr., Agr. Res. Sew., ARS 41-44,37 pp.
(12) 1962. Volume-weight of reservoir sediment.
Hydraulics Div., h e r . Soc. Civ. Engin. Roc. 3274: 181-197.
(13) Rausch, D. L., and Campbell, R. S. 1966. Sedimentation in a small channel-type reser-
voir. Internatl. Assoc. of Sci. Hydrol. Proc. 71 : 769-779.
(14) Koberg, G. E., and Ford, M. E., Jr. 1965. Elimination of thermal stratification in
reservoirs and the resulting benefits. U.S. Geological 'survey Water-Supply Paper 1809-M, 28 pp.
(15) Lane, E. W., and Koelzer, V. A. 1943. Density of sediments deposited in reser-
voirs. St. Paul U.S. Engineer District, Sub- office, Iowa City, Iowa, Report No. 9, 60 PP.
(16) McHenry, J. Roger 1962. Determination of sediment density by
gamma attention. U.S. Dept. Agr., Agr. Res. Serv., ARS 41-61, 15 pp.
(17) Moore, C. M., Wood, W. J., and Renfro, G. W. 1960. Trap efficiency of reservoirs, debris basins,
and debris dams. Hydraulics Div., Amer. Soc. of Civ. Engin. Proc. 86 (HY2): 69-87.
(18) Rausch, D. L., and Heinemann, H. G . 1968. Reservoir sedimentation survey methods.
Univ. of Mo. Agr. Expt. Sta., Res. Bul. 939, 20 PP.,
(19) Stall, John B. 1964. Sediment movement and deposition pat-
terns in Illinois impounding reservoirs. Amer. Water Works Assoc. Jour. 56 (6): 735-766.

UNITED STATES DEPARTMENT OF AGRICULTURE Agricultural Research Service
Beltsvi l le , Maryland 20705
Official Business POSTAGER FEES PAID
Unitmd Stator h p o r t m n t of Agriculture