sediment budget and hydrology
TRANSCRIPT

Sediment Budget and Hydrology
Rollin H. Hotchkiss, Ph.D., P.E., D.WRE, F.ASCE
Brigham Young University
Provo, Utah

Acknowledgments
• UNESCO
• Manfred Spreafico, Chairman
– International Sediment Initiative
– ISI
• Des Walling – the REAL content expert
• Jos Brils: Energy and Passion!

Provo, Utah
http://i.infopls.com/images/states_imgmap.gif


Units in this Section
1. Introduction
2. Overview of soil loss and erosion
3. Components of the sediment budget
4. Estimating or measuring each component
5. Land use impacts on sediment budget
6. River transport of sediments
7. Measuring transported sediments
8. Making the sediment budget
9. Measuring streamflow discharge rates

Objective
• Help you learn specific steps you can take to
calculate a sediment budget for watersheds in
your country, or for a river at a national
boundary

1. Introduction
• What is a sediment budget?
• Budgets have
– Inflows (income)
– Outflows (payments)
– Storage (savings or unpaid bills)
• We will apply this to sediment
– Consider sediment mass
– Mass has units of
• Metric tons (tonnes)
• kg
1. Introduction

Conservation of Mass Equation
• 0 =�
��∭��∀ +∬� ∙ ���
Where
�= time
� = density
∀ = volume
� = velocity vector
� = unit normal vector
A = area
1. Introduction

Meaning of Equation
• 0 =�
��∭��∀ +∬� ∙ ���
• 0 = change of sediment in C.V + Outflow - Inflow
Control Volume
Inflow Outflow
1. Introduction

Applied to a Watershed
http://www.raritanbasin.org/Pictures/watershed.jpg
Sediment Outflow
0 = change of sediment in C.V + Outflow - Inflow
Negative: loss
1. Introduction

No Sediment Added?
• Considers watershed from divide to mouth
• POSSIBLE sources outside the ‘control volume’
– Dust deposition
– Ash deposition
– Tectonic uplift
http://www.crh.noaa.gov/ddc/swaw/glddust.JPG
http://www.thorvaldseyri.is/skrar/image/Frettir/oskubylur.JPG
http://www.conjugatemargins.com/images/Source_to_Sink.jpg
1. Introduction

Applied to Subwatersheds
• Each colored area is its own watershed
• Now “0 = change of sediment in C.V + Outflow –Inflow” has changed
– Outflow from upstream is equal to inflow to downstream
• What if each colored area were a country?
http://www.munuscongwatershed.org/media/pages/subwatersheds_1.jpg
1. Introduction

2. Overview of Soil Loss and Erosion
• It all begins with soil in the watershed
• Processes (budget later)
1. rainfall splash
2. freeze/thaw
3. overland flow
4. landslides
5. mechanical movement
2. Overview of Soil Loss and Erosion
These 3 combined for soil
erosion budget

Rainfall Splash
• Rainfall detaches soil
• Function of
– Soil strength
– Rainfall intensity
• Location on planet
• Time of year
• What other factors?
2. Overview of Soil Loss and Erosion
http://www.falw.vu/~trendy/splash.jpg

Freeze/Thaw
• Expansion upon
freezing
• Can “cryoturbate” soil
• Makes more
susceptible to erosion
• Can be a significant
factor
2. Overview of Soil Loss and Erosion
http://farm5.staticflickr.com/4150/5084482442_1974452967.jpg

Overland Flow
• “Rill” can be plowed
over
• “Gully” cannot be
plowed over
• Not restricted to
agricultural lands
2. Overview of Soil Loss and Erosion
http://soilerosion.net/image/hillslope_rills.jpg
http://www.teara.govt.nz/files/p19790pc.jpg

Landslide Input
• Can be massive
• Function of
– Geology
– Land use history
– Precipitation
2. Overview of Soil Loss and Erosion
http://eusoils.jrc.ec.europa.eu/library/themes/Landslides/images/EC.jpg

Mechanical Movement
• Mechanical push into
stream
• Often done during
– Mining
– Logging
– Other watershed
disturbance
2. Overview of Soil Loss and Erosion
http://upload.wikimedia.org/wikipedia/commons/d/dc/Mining_Debris_in_C
wm_Nant_Iago_-_geograph.org.uk_-_300633.jpg

3. Components of the Sediment
Budget
1. Dust deposition/scour
2. Soil erosion: combine1. Rainfall detachment
2. Freeze/thaw
3. Overland flow
3. Landslides
4. Mechanical Movement
5. Streambank erosion
6. Reservoirs associated with dams
7. Tributary input
3. Sediment Budget Components

Dust Deposition/Scour
• Deposition is input to watershed
• Scour and transport by air is loss from watershed
• Usually very long term process
3. Sediment Budget Components
http://4.bp.blogspot.com/_yoZVx644Jak/TE0IYfx3gtI/
AAAAAAAAAEU/PspvyizArhQ/s1600/1.jpg
http://news.sciencemag.org/sciencenow/assets_c/2011/01
/sn-tibet-thumb-800xauto-5105.jpg

Soil Erosion
• We’ve already reviewed processes
• Soil erosion budget includes– Rainfall detachment
– Freeze/thaw
– Overland flow
• Important: Erosion vs. Delivery– Erosion: loss of soil from its Delivery: that portion of
soil loss that is delivered to a stream or river
• Sediment delivery ratio (SDR): delivered/eroded
• SDR primarily a function of watershed size
3. Sediment Budget Components

Soil Erosion and SDR
• A LOT of soil is
stored in the
watershed!
• Where?
– Floodplains
– Flatter areas
• Careful when
calculating budget
3. Sediment Budget Components

Landslides and Mechanical Movement
• Part of erosion and soil loss, but
• Separate budget items because processes are
fundamentally different

Streambank Erosion
3. Sediment Budget Components
http://www.crwr.utexas.edu/gis/gishydro03/Classroom/
trmproj/Lancaster/AustinErosion_files/image002.jpg
http://www.cws.bse.vt.edu/images/sized/images/upload
s/Pic_2_-_streambank_erosion-440x230.jpg

Streambank Erosion
• 37% of the total load in River Ouse, Yorkshire,
UK
• 50% in Midwestern streams, USA
• 78% in the Gowrie Creek, Australia
• 80% in the loess area of Midwest USA
• Up to 92% in Gelbaek stream, Denmark
• From Yong Lai, U.S. Bureau of Reclamation
who has sources for each example
3. Sediment Budget Components

Reservoirs Associated with Dams
• Reservoirs are sinks within a watershed
• Sediment stored in reservoir
• May or may not be released
• Matilija Dam, CA
– Being removed
– Sink becomes a source
3. Sediment Budget Components
http://www.usbr.gov/pmts/sediment
/projects/Matilija/images/ReservoirD
elta.png

Tributary Input
• Confluence of
Ohio River and
Mississippi Rivers,
USA
• One carries more
sediment than
the other
3. Sediment Budget Components
http://media-3.web.britannica.com/eb-
media/80/3080-004-CCCE5015.jpg

4. Estimating or Measuring Each
Component: SummaryComponent How Estimated/Measured
Dust deposition/scour Floodplain excavation; anecdotal evidence
Soil erosion Several components: section 2 for components
Streambank erosion Field surveys and aerial mapping
Landslides Aerial photography and survey
Mechanical movement Field survey
Reservoir sedimentation Reservoir sediment surveys
Tributary input Riverine measures of sediment transport
4. Estimating/Measuring

Estimating/Measuring Dust
• Time scale:
centuries or more
• Floodplain
excavation
• Stratigraphic
analysis
• Example:
London,England
4. Estimating/Measuring
http://getfile6.posterous.com/getfile/files.pos
terous.com/temp-2012-05-
08/AHJxgJgscsHIeIlyGHoiJmCEBfBxmFslcpxvHJ
zIzpqyrogEkHoBHggCrtHa/borehole3.jpg

Observed at a Global Scale: from Des Walling

Predicted at a Global Scale
• Jon Pelletier, 2012. A spatially distributed
model for the long-term suspended sediment
discharge and delivery ratio of drainage
basins. Journal of Geophysical Research 117.
• Pixel-by-pixel computer modeling using GIS
tools at a very large scale
• Predicts the kind of charts that Walling
produced from observed data

Modeled Sediment Yield

1/(sediment delivery ratio)

Estimating/Measuring Soil Erosion –
Local Scale
• Does not include
landslides or
mechanical movement
• Simplest: nails in a
board
• Harder: measure from
plots
4. Estimating/Measuring
http://www.fao.org/docrep/T0848E/t0848e05.jpg
http://www.marketplace.org/sites/default/files/style
s/slide-show-2-column-530x396/public/SRI.jpg

Estimating Soil Erosion
• Based upon many plot experiments
• Universal Soil Loss Equation (USLE)
• � = ������ where
A = soil loss, tons/acre
R = rainfall erosivity index
K = soil erodibility index
LS = hillslope length-slope factor
C = cropping management factor
P = erosion-control factor
4. Estimating/Measuring

USLE
• Published 1965
• Much information available
• Figures, charts, tables for each parameter
• Most common method for estimating soil loss
• Does NOT predict delivery
• US Department of Agriculture now advocates
the use of RUSLE2
4. Estimating/Measuring

RUSLE2
• http://www.ars.usda.gov/Research/docs.htm?docid=5971
• Computer-assisted software and documentation
4. Estimating/Measuring

RUSLE2, continued
4. Estimating/Measuring

Landslide
• Aerial photography
• Somewhat random
• Estimate volume by
– Map measurements
– Ground survey
http://ars.els-cdn.com/content/image/1-s2.0-
S0169555X06000067-gr6.jpg
4. Estimating/Measuring

Estimating/Measuring Mechanical
Movement
• Field-based survey
• Usually required as
part of a restoration
or reclamation plan
• Meet required
performance criteria
4. Estimating/Measuring
http://www.eoearth.org/files/123401_123500/123460/250px-
Surface_mine_reclamation.jpg

Estimating/Measuring Streambank
Erosion
• Historical
maps for
meander
belts
• Mississippi
River
4. Estimating/Measuringhttp://www.jenbervin.com/images/mississippi/meanderbeltmap.jpg

Estimating/Measuring Streambank
Erosion
• Aerial photography
for more recent
bank failure
– Good for
reconnaissance
• Can field survey for
more accurate data
4. Estimating/Measuring
http://water.epa.gov/scitech/datait/tools/warsss/images/fig30.jpg

Estimating/Measuring Streambank
Erosion
• Erosion Pins
• Easily used
• Monitor
�Floods
�Annually
�Seasonally
4. Estimating/Measuring
http://pubs.usgs.gov/fs/2005/3134/images/fig07_left.jpg

Estimating/Measuring Reservoir
Sedimentation• Need initial survey
– Topo map before construction
– Bathymetric soon after closure
• Subsequent surveys– Best: multibeam
echosounder -$80,000
– Good: single beam echosounder: $25,00
4. Estimating/Measuring
http://t0.gstatic.com/images?q=tbn:ANd9GcRUS3O8Fi
9iX11K8VZibZ9Sdyu8QrpJ8ByLFfWy2vn8cUKxEege8Uol
Jga6

Elements of Modern Surveys
http://sofia.usgs.gov/publications/ofr/00-347/images/survey.gif
4. Estimating/Measuring

Estimating/Measuring Tributary Input
• Milk River, Montana
• You may want to trace
where sediment is
coming from
• Go upstream looking at
tributaries
• Measure tributary input
• See item 7
4. Estimating/Measuring
http://www.airphotona.com/stockimg/images/00066.jpg

5. Land Use Impacts on Sediment
Budget
• Deforestation
• Well-known
impacts
• Exposure to
rainfall splash
• Loss of soil
strength
5. Land Use Impacts
http://www.dr1.com/blogs/uploads/environment_deforestation.jpg

Urbanization
• Often clear land for
entire subdivisions
• Increase in
– Runoff
– Erosion
• Can impact an entire
region/country or
countries
5. Land Use Impacts
http://passel.unl.edu/Image/siteImages/UrbanRillErosion-NRCS-LG.jpg

Agriculture
• Centuries-old problem
• Cultivating perpendicular
to contours
• Add water
• And…increase erosion!
5. Land Use Impacts
http://static.howstuffworks.com/gif/irrigation-soil-erosion.jpg

Other Land Use Impacts
• You name them!
5. Land Use Impacts

…And NO land use impact?
5. Land Use Impacts
Mean Annual Precipitation
Soil Loss
http://farm2.static.flickr.com/1299/556137713_ef65e479e2.jpg
Low Precip = Low Erosion
http://www.isavo.com/pic409/jungle2.jpg
High Precip = Low Erosion
Moderate Precip = High Erosion
http://2.bp.blogspot.com/-F0rei5azSEs/Tvtd1ltJ6rI/AAAAAAAAA-
w/1tUU8KGzdOc/s1600/Lesotho+Landscape.JPG

6. River Transport of Sediments
• Bedload
– Along streambed
• Suspended Load
– In water column
– Can deposit
• Washload
– Very fine
– Does not deposit
6. River Transport of Sediments

Bedload
• Requires high Q
• VERY nonlinear
• Einstein’s challenge
• Can be between 5
and 80% of total
sediment load
• Low end = gravel
• High end = sand
6. River Transport of Sediments
http://gallery.usgs.gov/video/water/2010/jul/bedload
_transport_kootenai_river_2.jpg

Suspended Load
• New Zealand
• Glacial outwash
• Grey is suspended
load
• Can see previous
bedload
6. River Transport of Sediments
http://www.swisseduc.ch/glaciers/new_zealand
/fox_glacier/icons/17_river_turbulent.jpg

Wash Load
• Very fine material
• Colors water
• Deposits only
– In reservoirs
– On floodplains
• Colorado River
6. River Transport of Sediments
http://therockyriver.com/wp-
content/uploads/2012/08/ColoradoRiver
SedimentLoadMonsoonHugeFishKill.png

7. Measuring Transported Sediments
• Suspended Load
– DH-48
– Hand-held
– Only small rivers
• Manual procedure
– Very expensive
http://www.envcoglobal.com/files/MO-HyS-DH-48-L.jpg
7. Measuring Transported Sediments

Larger Rivers
• Deployed from bridges
• Still expensive
http://www.envcoglobal.com/files/MO-HyS-D49-
L.jpg
7. Measuring Transported Sediments
http://mi.water.usgs.gov/splan5/sp09500/images/sus.sam.jpg

Emerging Suspended Load Methods
• Continuous recording turbidity meter
– Mounted on bottom of stream
– Light shines upward
– Records turbidity
• Related to suspended load concentration
– Occasional water samples collected for calibration
7. Measuring Transported Sediments
http://ga.water.usgs.gov/edu/pictures/TurbiditySond.jpg

Emerging Suspended Load Methods
• Satellite imagery
• Coloration indicates suspended load
• Need some calibration
• Very useful and emerging technology
7. Measuring Transported Sediments
Coastal Singapore: infrared (left) and
turbidity (right)
Soo Chin Liew. Monitoring turbidity and suspended sediment concentration of coastal and
inland waters using satellite data. Geoscience and Remote Sensing Symposium, 2009 IEEE
International. Pages 11-837 to II-839

Bedload Sediment Measurements
• Hand-held method
– Small streams
– Labor intensive
– Dangerous
• Helley-Smith
http://www.halltechaquatic.com/wp-
content/themes/halltechaquatic/images/cat1/bedloadsampl
er621.jpg
7. Measuring Transported Sediments

Larger Rivers
• Heavier Helley-
Smith!
• Deployed from
bridge
• Still expensive
http://www.rickly.com/ss/images/HELLEY.JPG
7. Measuring Transported Sediments
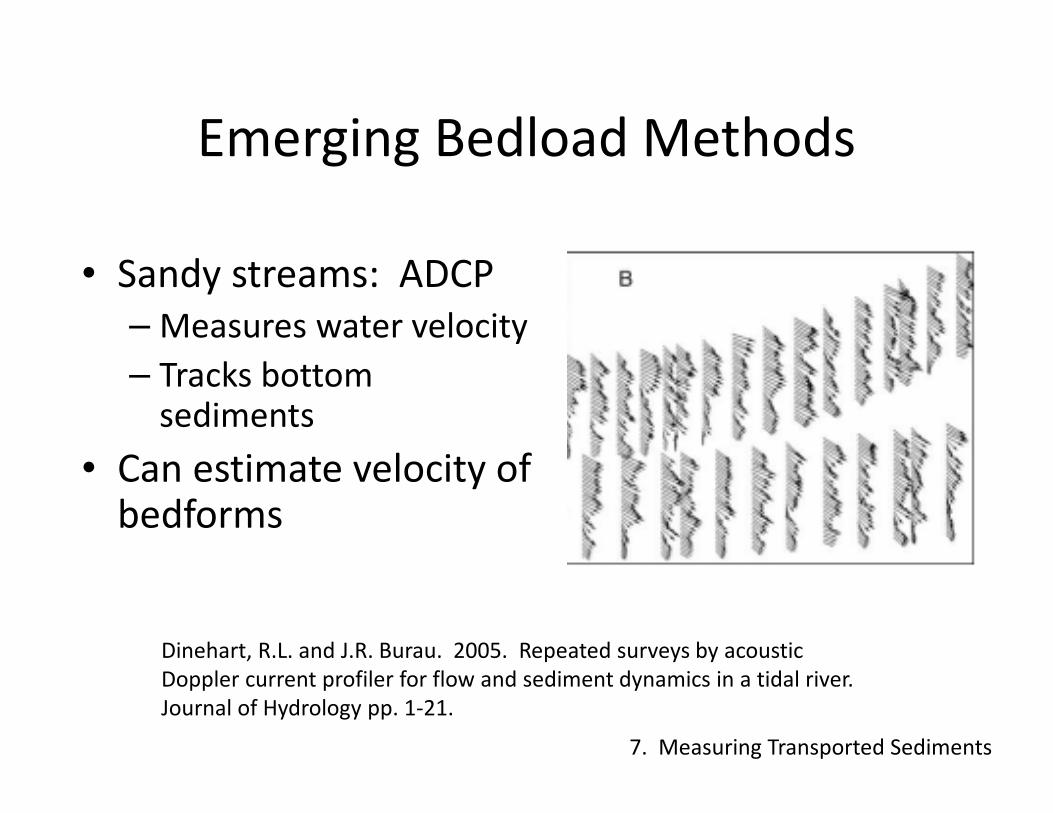
Emerging Bedload Methods
• Sandy streams: ADCP
– Measures water velocity
– Tracks bottom sediments
• Can estimate velocity of bedforms
7. Measuring Transported Sediments
Dinehart, R.L. and J.R. Burau. 2005. Repeated surveys by acoustic
Doppler current profiler for flow and sediment dynamics in a tidal river.
Journal of Hydrology pp. 1-21.

Other Bedload Methods
• Impact
– Strikes plate
– Sound ~ transport
• Painted rocks, magnetic rocks
7. Measuring Transported Sediments
Moen, Knut M., Jim Bogen, John F. Zuta, Premus K. Ade, and Kim
Esbensen. 2010. Bedload measurement in rivers using passive acoustic
sensors. USGS Scientific Investigations Report 2010-5091

8. Making the Sediment Budget
• Two approaches
– Add up components
– Simulate components with computer models
• Firstapproach– �!�"#!��$"!%� = ∑�%%'(�)!*'#+'�!��,
– Usually simply measured as riverine transport
– Individual budget items allow you to focus on
those particular items
8. Making the Budget

2nd Approach: Computer Modeling
• Use measure data to calibrate a computer model
• Use the model to predict impacts of changes
8. Making the Budget
http://ars.els-cdn.com/content/image/1-s2.0-
S0022169407006737-gr4.jpg

Computer Models
Model Reference Comments
RUSLE2: Revised
Universal Soil Loss
Equation
http://fargo.nserl.purdue.edu/ Upland watersheds
AGNPS: Agricultural
Non-Point Source
Pollution Model
Google “AGNPS” Upland watersheds
MIKE SHE http://www.crwr.utexas.edu/gis/gish
yd98/dhi/mikeshe/Mshemain.htm
Comprehensive
rainfall/runoff model
GSSHA: Gridded
Surface-Subsurface
Hydrologic Analysis
http://chl.erdc.usace.army.mil/gssha 2-D
rainfall/runoff/erosion

Hydrology
• We’ll not talk
about each
component
• Focus: discharge
rates
• MIKE SHE and
GSSHA simulate
all componentshttp://geofreekz.wordpress.com/the-hydrosphere/
9. Measuring Streamflow Discharge Rates

9. Measuring Streamflow Discharge
Rates
• Why focus on measuring streamflow discharge
rates?
• Sediment yield = sediment concentration x
water discharge
– Example: (3,000 mg/l) x (1 million l/s) = 1 billion
mg/s = 1 million kg/s = 1,000 metric tons/s
9. Measuring Streamflow Discharge Rates

Smaller Streams
• USA: Price meter
• Used since 1880s
• Deploy by
– Wading
– From bridge
• Most common
method for 100
yearshttp://www.envcoglobal.com/files/imagecache/product_
page_image/MO-D622RG-L.jpg
9. Measuring Streamflow Discharge Rates

Smaller Streams
• Online video
training
• http://wwwrcamnl.
wr.usgs.gov/sws/S
WTraining/WRIR00
4036/Index.html
http://fishwild.vt.edu/afs/fisheries_techniques/Chapter4/Estimation%
20of%20stream%20velocity%20using%20a%20Price%20AA%20flow%
20meter%20f.JPG
9. Measuring Streamflow Discharge Rates

Medium to Large Rivers: Modern
Method
• Acoustic Doppler Current Profiler (ADCP)
• 0.8 m-long ‘boat’
• Dragged across river or drone
• Acoustic signals use Doppler effect to measure velocity
http://t0.gstatic.com/images?q=tbn:ANd9GcTg3xFgJXmSZ4ZhO4yMt_
ngu3e9ru0T3zPOwOuOj5iXDVxG44IDdw
9. Measuring Streamflow Discharge Rates

ADCP Methods
• 4 sensors: 1 for
depth, 1 each for
velocity in x, y, and z
directions
• Integrates
meassurements
instantly
• Gives detail about
discharge distributionhttp://www.eoearth.org/files/110701_
110800/110736/310px-Adcp_600.jpg
9. Measuring Streamflow Discharge Rates

Accessing Records: U.S. Geological
Survey (USGS)
http://waterwatch.usgs.gov/
9. Measuring Streamflow Discharge Rates
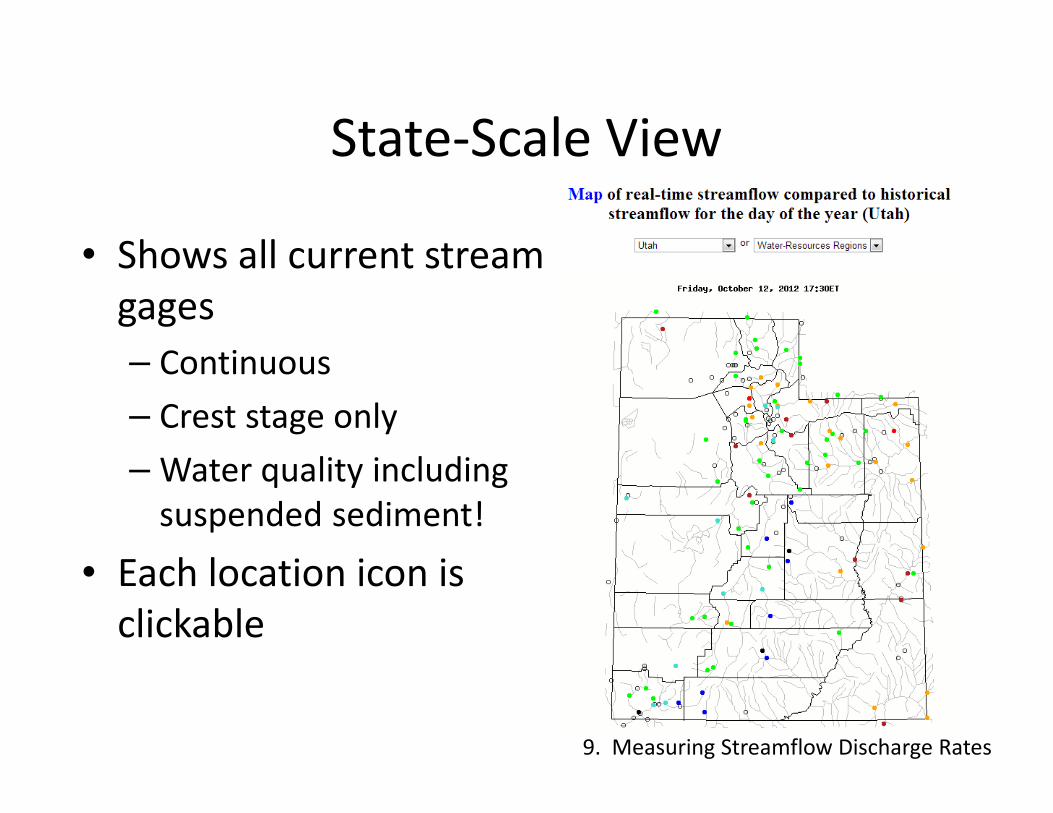
State-Scale View
• Shows all current stream
gages
– Continuous
– Crest stage only
– Water quality including
suspended sediment!
• Each location icon is
clickable
9. Measuring Streamflow Discharge Rates

Provo River, Provo, Utah
• Plots for one
week
• All axes can
be changed
• Updated
frequenty
each day
• State of art
9. Measuring Streamflow Discharge Rates

Summary
• Sediment Budgets– Consider each component
– What is dominant in your watershed/country?
– Invest in data collection!!
• Riverine sediment concentration measurement– Collaborate across countries
– Use consistent methods and training
– All data put online in real time
• Stream discharge measurement is foundation– Add sediment measurements to the discharge net
– Many other topics to discuss!

Thank you!