sediment and nutrient export by water from an agricultural ... file74 geografi sebagai sintesis:...
TRANSCRIPT

74
Geografi sebagai sintesis: Meneliti kembali peranan geografi di sebalik ...
Sediment and nutrient export by water from an agricultural catchment: An analysis of hysteresis patterns in the Upper Relau River, PenangEksport Sedimen dan Nutrien dari Kawasan Tadahan Pertanian: Satu Analisis Pola Histeresis di Ulu Sungai Relau, Pulau Pinang
Wan Ruslan Ismail1, Salleh Bakar2 & Zullyadini A. Rahaman1
1Hydro Geomorphology Research Group, Geography Section, School of Humanities, Universiti Sains Malaysia, 11800 Minden, Penang2Yayasan Pembangunan Ekonomi Islam Malaysia (YaPIEM), No 52, Bangunan YaPEIM, Jalan Kg. Attap,Beg Berkunci 11012, 50732 Kuala Lumpure-mail: [email protected]
AbstractA small drainage basin (0.5 km2) was selected on the Relau hill to evaluate sediment and nutrient export. Stream flow gauging, water depth and gulp water samples were collected manually on a weekly basis between November 2001 to October 2002 with additional gauging and water samples taken during storm events. The concentrations of sediment and nutrient were analysed to determine the quality of the river water and the health of the catchment. The highest suspended sediment concentrations and nutrients concentration in upper Relau catchment are, in most cases, associated with periods of high discharge during the monitoring period. Hysteresis relationships between SSC, NO3-N, TN, orthophosphate and TP concentration with discharge (Q) shows some form of pattern of variation during the monitoring period. The hysteresis approach was used to identify the sources of SSC, NO3-N and orthophosphate in streams. The findings from this study are common to most drainage systems having seasonal bimodal discharge. We describe the mechanisms of SSC, NO3-N and orthophosphate, TN and TP concentrations generation with discharge magnitudes, highlighting the importance of storm events in the transportation of pollutants from this small hill-land catchment where agriculture is the dominant land use.
KeywordsHysteresis, SSC, NO3-N, Orthophosphate, TP, TN, Relau River
AbstrakSatu penilaian eksport sedimen dan nutrien telah dijalankan di satu kawasan tadahan kecil (0.5 km2) di atas bukit Relau. Pengukuran aliran sungai, kedalaman, dan sampel air dikutip secara manual setiap minggu antara November 2001 dan Oktober 2002 dengan sampel air dan pengukuran semasa musim ribut. Kepekatan sedimen dan nutrien dianalisis untuk menentukan kualiti air sungai dan kesihatan kawasan tadahan. Kepekatan sedimen dan nutrien yang paling tinggi di Ulu Sg. Relau dalam banyak kes ialah berkait dengan kadar luahan tinggi
Geografi Vol 1, No 1 (April 2013), 74-101© Penerbit Universiti Pendidikan Sultan Idris 2013

75
Geografi Vol 1, No 1 (April 2013), 74-101© Penerbit Universiti Pendidikan Sultan Idris 2013
sepanjang masa pemonitoran. Pertalian histeresis antara SSC, NO3-N, TN, ortofosfat dan TP dengan luahan (Q) mempamerkan beberapa bentuk pertalian sepanjang masa pemonitoran. Pendekatan histeresis digunakan untuk menentukan sumber pencemar sediment (SSC), NO3-N, dan ortofosfat di dalam sungai. Dapatan kajian ini adalah hampir serupa dengan dapatan lain yang mengalami luahan bermusim dwi-mod. Kami menjelaskan mekanisme penjanaan kepekatan sedimen (SSC), NO3-N, ortofosfat, TN dan TP dengan perubahan magnitud luahan, dan menunjukkan kepentingan kejadian hujan ribut dalam mengangkut bahan pencemar dari kawasan tadahan kecil ini yang didominasi oleh pertanian.
Kata kunciHisteresis, SSC, NO3-N, Orthofosfat, TP, TN, Sungai Relau
Introduction
Sediments and nutrients are two of most common pollutants and the study of these pollutants on receiving streams is very important to improving our knowledge in the management of catchment areas. Suspended sediment concentrations in rivers have been frequently studied because these can provide important information on the processes of erosion and deposition as well as hydraulics and water quality (Siakeu et al., 2004), and understanding sediment transport is essential for possessing a comprehensive knowledge of drainage basin processes (Hudson, 2003).
The concentration of sediments and nutrients in rivers determine the water quality and thus reflect the health of the catchment. Therefore, it is important to assess and monitor catchment conditions in order to control water quality problems (Dai et al., 2004). Past studies have shown that the suspended sediment concentration plays an important role in transporting nutrient contaminants through the river systems (Horowitz, 1995; Foster & Charlesworth,1996; Russell et al., 1998; Russell et al., 2001; Ward & Trimble, 2004; Verstraeten & Poesen, 2002). The suspended sediment from erosion can be detrimental to aquatic ecosystems in various ways, such as reducing light penetration, clogging aquatic vegetation and spawning gravel (Clark et al., 1985), and affecting the quality of water as it degrades the quality of habitat for fish and other biota (House et al., 1997; Neal et al., 1997; Long et al., 1998).
Nutrients (particularly N and P) often reach surface waters in sufficient amounts to accelerate or maintain eutrophication in agriculturally dominated watersheds (Carpenter et al., 1998; Daniel et al., 1998). The nutrient enrichments especially of nitrogen and phosphorus could lead to eutrophication of water bodies. These elements are readily transported in stream flow and their concentrations are strongly dependent on land use in the catchment (Viney et al., 2000). Nutrient pollutions has been reported to have several undesirable effects, most of which are related to the increased growth of phytoplankton and other aquatic plants (DeWitt & Bendoricchio, 2001), and increased biomass of freshwater phytoplankton and periphyton, reducing water clarity, elevating

76
Geografi sebagai sintesis: Meneliti kembali peranan geografi di sebalik ...
pH leading to the depletion of dissolved oxygen in the water column (Davis & Koop, 2001).
The impact of elevated phosphorus concentration in rivers for example, include increasing rates of plant growth, changes in species composition and proliferation of planktonic, epiphytic and epibenthic algae, resulting in shading of higher plants (Mainstone & Parr, 2002). Awareness and understanding of N and P sources and transfers in catchments as well as knowledge about its fate in aquatic systems, i.e. interaction with bottom sediments and biota to help identify and reduce eutrophication risks (Banaszuk & Wysocka-Czubaszek, 2005).
Numerous studies aimed at understanding the processes controlling nutrient concentrations and flux in river systems have been carried out (Edwards, 1973; Oborne et al., 1980), and the quality of river water is determined by the levels of nutrient inputs, particularly of N and P (Miltner & Rankin, 1998). Large losses of sediment and nutrients normally occur during storms. Agricultural runoff following storm events transports the sediment and nutrient concentrations from agricultural land catchments into receiving streams (Dendy, 1981). Large losses of nutrients from agricultural soils are often associated with the intensive use of fertilizers, especially in situations when fertilizer use exceeds the nutrient requirement of crops (Stalnacke et al., 2003).
Figure 1 The hysteresis of suspended sediment concentration (SSC) and discharge (Q) relationship are: (A) a linear, (B) a clockwise, and (C) an anticlockwise hysteresis Source: Hudson (2003)

77
Geografi Vol 1, No 1 (April 2013), 74-101© Penerbit Universiti Pendidikan Sultan Idris 2013
Variations in water discharge-sediment and nutrient concentration relationships usually result in loop patterns called hysteresis. The relationships are often used to make inferences about the various processes contributing to the sediment and nutrient export from a basin (Steegen et al., 2000). These hysteresis loops are caused by the variations during the observed hydrological event of the amount of material available for erosion (Picouet et al., 2001). When plotted, such concentration-discharge relationships result in ‘loop trajectories’ (Figure 1). The extent and degree of hysteresis is likely to depend on many complex factors involving both chemical and hydrological processes in soils and within the river itself (Webb & Walling, 1992).
The three most distinct forms of hysteresis are shown in Figure 1. A linear relationship occurs when Q and SSC have coincident peaks, and the rate of increase and decrease is relatively equal (Figure 1a). More commonly, rivers exhibit clockwise or positive hysteresis Q-SSC relations (Figure 1b). This occurs when SSC peaks before Q, or if there is a considerable reduction in SSC during the receding limb of the hydrograph. A clockwise hysteresis is often interpreted as an indication that within-channel sediment sources and/or sediment flushing, i.e. the removal of sediment made available during inter-storm periods, are important (Olive & Rieger, 1985).
Studies that exhibit a counterclockwise (negative) hysteresis relationship between Q and SSC (Figure 1c) are less commonly reported. Negative hysteresis is often seen as an indication that most sediments are delivered by hillslope processes (Klein, 1984; Hamilton, 1991). Hysteresis has been used to help identify the sources of many elements in solution in catchment areas especially the hysteresis effects produced during storm events (McDiffett et al., 1989). During the past two or three decades, hysteresis loop patterns have been used, often in conjunction with supporting evidence, to delineate source area contributions to streamflow, to infer geochemical processes that affect storm water quality, and to discern mixing processes as they occur before, during, and after storm events (Rose, 2003). This study extends the hyteresis approach which has been used elsewhere (Bogen, 1980; McDiffett et al., 1989; Williams 1989; Steegen et al., 2000; Bowes et al., 2005) to help identify the source of pollution based on SS, nitrate, TN, orthophosphate, and TP concentrations with discharge (Q) relationships of single storm events in this part of the South East Asian region.
Research area
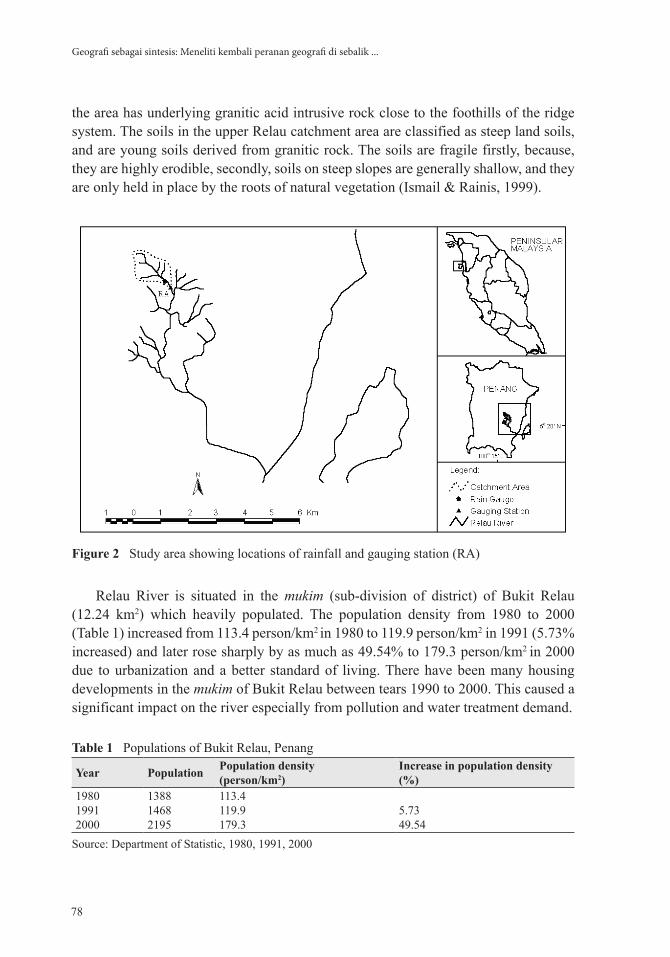
This study was carried out in the upper Relau River catchment (0.68 km2) located at 05° 21’ 08” N, 100° 16’ 45” E; 60 m a.s.l. on the south coast of Penang Island (Figure 2). The Relau River runs in a NNW-SSE direction from the hilly areas south of the Penang Hill ridge system to the south channel between Penang and the mainland. The drainage density of Relau river at this site is 4.55 km km-2 and a total stream length of approximately 2.19 km. The gradient of upper Relau river is 28.8%. Orchards are the main land use, accounting for almost 72.7% of the total catchment area, while the rest are planted with vegetables and bananas (Ismail Rahaman, 1994). Geologically,
78
Geografi sebagai sintesis: Meneliti kembali peranan geografi di sebalik ...
the area has underlying granitic acid intrusive rock close to the foothills of the ridge system. The soils in the upper Relau catchment area are classified as steep land soils, and are young soils derived from granitic rock. The soils are fragile firstly, because, they are highly erodible, secondly, soils on steep slopes are generally shallow, and they are only held in place by the roots of natural vegetation (Ismail & Rainis, 1999).
Figure 2 Study area showing locations of rainfall and gauging station (RA)
Relau River is situated in the mukim (sub-division of district) of Bukit Relau (12.24 km2) which heavily populated. The population density from 1980 to 2000 (Table 1) increased from 113.4 person/km2 in 1980 to 119.9 person/km2 in 1991 (5.73% increased) and later rose sharply by as much as 49.54% to 179.3 person/km2 in 2000 due to urbanization and a better standard of living. There have been many housing developments in the mukim of Bukit Relau between tears 1990 to 2000. This caused a significant impact on the river especially from pollution and water treatment demand.
Table 1 Populations of Bukit Relau, Penang
Year Population Population density(person/km2)
Increase in population density (%)
198019912000
138814682195
113.4119.9179.3
5.7349.54
Source: Department of Statistic, 1980, 1991, 2000

79
Geografi Vol 1, No 1 (April 2013), 74-101© Penerbit Universiti Pendidikan Sultan Idris 2013
Rainfall and discharge
The seasonal distribution of rainfall of the study area is shown in Fig. 3. There is a double-peaked distribution in April-May and October-November (Ismail 1995, 1996). The mean annual rainfall recorded during the study period at upper Relau was 2101.9 mm which was slightly lower than the annual rainfall at Bayan Lepas Airport located south of the catchment area.
0
50
100
150
200
250
300
350
400
Nov-0
1
Dec-0
1
Jan-0
2
Feb-0
2
Mar-0
2
Apr-0
2
May-0
2
Jun-0
2
Jul-0
2
Aug-0
2
Sep-0
2
Oct-0
2Month
Rain
fall (
mm
)
Upstream Relau Downstream Relau Mean at Bayan Lepas 1997-2002
Figure 3 Seasonal rainfall distributions at the study sites and the long term rainfall at Bayan Lepas Airport. (2.8 m a.s.l)
The seasonal variation in discharge during the study period is shown in Fig. 4a. The period between January to March is the low flow period with base flow discharge of about 0.02 m3s-1. The rainy season is marked by the onset of spikes in the rainfall graph beginning end of March right up to November. The highest discharge of Relau river during the study period was more than 0.16 m3s-1 in September 2002. The highest peak discharge per unit area was 8.33 m3s-1km-2 and minimum discharge per unit area was 0.13 m3s-1km-2. The instantaneous peak discharge per unit area at upper Relau was reported in an earlier study was 3.66 m3s-1km-2 (Ismail, 1995). Mean runoff coefficient was 52.6%. Runoff was low in February and May while the highest runoff was observed in November (Ismail, 1995).

80
Geografi sebagai sintesis: Meneliti kembali peranan geografi di sebalik ...
0
20
40
60
80
100
120
140No
v-01
Dec-0
1
Jan-0
2
Feb-0
2
Mar-0
2
Apr-0
2
May-0
2
Jun-0
2
July-
02
Aug-0
2
Sep-0
2
Oct-0
2
Rainf
all (m
m)
0.000.020.040.060.080.100.120.140.160.18
Q (m3 /s)
Rainfall Q
0
20
40
60
80
100
120
140
Nov-0
1
Dec-0
1
Jan-0
2
Feb-0
2
Mar-0
2
Apr-0
2
May-0
2
Jun-0
2
July-
02
Aug-0
2
Sep-0
2
Oct-0
2
Rainf
all (m
m)
0.000.020.040.060.080.100.120.140.160.18
Q (m3 /s)
Rainfall Q
0.0
0.5
1.0
1.5
2.0
2.5
Nov-
01
Dec-
01
Jan-
02
Feb-
02
Mar
-02
Apr-0
2
May
-02
Jun-
02
July-
02
Aug-
02
Sep-
02
Oct-0
2
TN an
d Ni
trate
(mg/
l)
0.000.020.040.060.080.100.120.140.160.18
Q (m
3 /s)
TN Nitrate Q
0.00
0.01
0.02
0.03
0.04
0.05
0.06
Nov-0
1
Dec-0
1
Jan-0
2
Feb-0
2
Mar-0
2
Apr-0
2
May-0
2
Jun-0
2
July-
02
Aug-0
2
Sep-0
2
Oct-0
2
TP an
d Or
thop
hosp
hate
(mg/
l)
0.000.020.040.060.080.100.120.140.160.18
Q (m
3 /s)
TP Orthophosphate Q
Figure 4 Trend of discharge Q, with (a) rainfall, (b) SSC, (c) TN and nitrate, (d) TP and orthophosphate

81
Geografi Vol 1, No 1 (April 2013), 74-101© Penerbit Universiti Pendidikan Sultan Idris 2013
Materials and methods
Water sampling and river gauging
Stream flow gauging, water depth and gulp water samples were collected manually on a weekly basis starting from November 2001 to October 2002 with additional gauging and water samples taken during storm events. Three replicates of water samples (left bank, middle and right bank) were taken and stored using acid rinsed polyethylene bottles. During storm events, the water samples were collected at an interval of 15 minutes or 30 minutes during the course of the storm event depending on rainfall duration and intensity. These samples were kept cooled with ice immediately following collection and brought back to the laboratory for further analysis. Daily rainfall were collected manually with rain gauges set up near the sampling station via open glass funnel (diameter 210-230 mm) described by Buijsman and Erisman (1988). Parameters to obtain water discharge such as depth, channel cross section, and velocity were measured in-situ. Water velocity was measured using the Owen and Boyd HydroProb propeller and water discharge, Q was calculated using the velocity-area method (Gregory & Walling, 1973; Gordon et al., 1992).
Laboratory Analysis
The following parameters were measured: suspended sediment concentrations (SSC), TP, orthophosphate, NO3-N, NO2-N and TN. The SSC were determined by filtration method using Whatman GF/C filter paper with pore size of 0.45 µm, and drying at 105°C for 24 hours. For dissolved components, samples were filtered using 0.45 µm filter membranes Whatman cellulose nitrate, 47 mm diameter. The samples were analyzed for NO3-N using cadmium reduction method (APHA 1989); NO2-N by diazotizing method (APHA, 1989); TP and orthophosphate were analyzed according to the ascorbic-molybdate methods (Murphy & Riley 1962); for TN and TP the samples were previously digested by acid potassium persulfate in an autoclave (Koroleff, 1983).
Result
Monitoring was done manually for a one year period and produced hysteresis loops for 4 storm events during the study period. Hysteresis loops for individual storm events have been constructed between SSC and Q (Figure 5). The storm on 23 October 2001 was anticlockwise while the storm events occurred on 2 November 2001 and 27 August 2002 produced an eight-shaped hysteresis.
Seasonal Variations
The seasonal variation of Q is reflected in the rainfall pattern (Figure 4a) and the variations of Q with suspended sediment are shown in Fig 4b and the nutrient variations

82
Geografi sebagai sintesis: Meneliti kembali peranan geografi di sebalik ...
23 October 2001
0.0
0.2
0.4
0.6
0.8
1.0
10:1
5
10:3
0
10:4
5
11:0
0
11:1
5
11:3
0
12:0
0
12:3
0
13:0
0
18:4
0Time
Q (
m3
s-1)
0
500
1000
1500
2000
SS
C (
mg
l-1)
Q SSC
23 October 2001
0200400600800
1000120014001600
0.0 0.2 0.4 0.6 0.8 1.0Q (m3 s-1)
SSC
(mg
l-1)
2 November 2001
0
2
4
6
8
8:00
8:30
9:00
9:30
10:0
0
10:3
0
11:0
0
11:3
0
12:0
0
12:3
0
Time
Q (m
3 s-1)
0500100015002000250030003500
SSC
(mg
l-1)
Q SSC
2 November 2001
0
500
1000
1500
2000
2500
3000
3500
0 1 2 3 4 5 6Q (m3 s-1)
SS
C (m
g l-1
)
10 April 2002
0.0
0.5
1.0
1.5
2.0
2.5
9:00
9:15
9:30
10:0
0
10:3
0
11:0
0
11:3
0
12:0
0
Time
Q (m
3 s-1)
0100200300400500600
SSC
(mg
l-1)
Q SSC
10 April 2002
0
100
200
300
400
500
600
0.0 0.5 1.0 1.5 2.0Q (m3 s-1)
SSC
(mg
l-1)
27 August 2002
0.0
0.3
0.6
0.9
1.2
1.5
11:3
012
:00
12:1
012
:15
12:2
512
:40
15:3
015
:45
16:0
016
:15
16:3
0
Time
Q (m
3 s-1)
0
100
200
300
400
SSC
(mg
l-1)
Q SSC
27 August 2002
0
50
100
150
200
250
300
350
400
450
0.0 0.3 0.6 0.9 1.2 1.5Q (m3 s-1)
SSC
(mg l-1 )
Figure 5 The pattern and types of SSC and Q hysteresis during storm events

83
Geografi Vol 1, No 1 (April 2013), 74-101© Penerbit Universiti Pendidikan Sultan Idris 2013
23 October 2001
0.0
0.2
0.4
0.6
0.8
1.010
:15
10:3
0
10:4
5
11:0
0
11:1
511
:30
12:0
0
12:3
0
13:0
0
18:4
0Time
Q (
m3
s-1)
0.00.20.40.60.81.01.21.4
NO
3 (m
g l-1
)
Q Nitrate
23 October 2001
0.0
0.2
0.4
0.6
0.8
1.0
1.2
1.4
0.0 0.2 0.4 0.6 0.8 1.0Q (m3 s-1)
NO
3 (m
g l-1
)
2 November 2001
0
2
4
6
8
8:00
8:30
9:00
9:30
10:0
0
10:3
0
11:0
0
11:3
0
12:0
0
12:3
0
Time
Q (
m3 s
-1)
0.0
0.2
0.4
0.6
0.8
1.0N
O3
(mg
l-1)
Discharge Nitrate
2 November 2001
0.0
0.2
0.4
0.6
0.8
1.0
0.0 1.0 2.0 3.0 4.0 5.0 6.0Q (m3 s-1)
Nitr
ate
(mg
l-1)
10 April 2002
0.0
0.5
1.0
1.5
2.0
2.5
9:00
9:15
9:30
10:0
0
10:3
0
11:0
0
11:3
0
12:0
0
Time
Q (
m3
s-1)
0.0
0.5
1.0
1.5
2.0
Nitr
ate
(m
g l-1
)
Discharge Nitrate
10 April 2002
0.0
0.4
0.8
1.2
1.6
2.0
0.0 0.5 1.0 1.5 2.0Q (m3 s-1)
Nitr
ate
(mg
l-1)
27 August 2002
0.0
0.3
0.6
0.9
1.2
1.5
11:3
0
12:0
0
12:1
5
12:2
5
12:4
0
15:3
0
16:0
0
16:3
0
Time
Q (m
3 s-1)
0.0
0.3
0.6
0.9
1.2
NO 3
(m
g l-1
)
Q Nitrate
27 August 2002
0.0
0.3
0.6
0.9
1.2
0.0 0.3 0.6 0.9 1.2 1.5Q (m3 s-1)
Nitr
ate
(mg
l-1)
Figure 6 The pattern and types of NO3-N and Q hysteresis during storm events

84
Geografi sebagai sintesis: Meneliti kembali peranan geografi di sebalik ...
23 October 2001
0.00.20.40.60.81.0
10:1
5
10:3
0
10:4
5
11:0
0
11:1
5
11:3
0
12:0
0
12:3
0
13:0
0
18:4
0
Q (
m3/
s)
0.00.51.01.52.02.5
TN
(m
g l-1
)
Q TN
23 October 2001
0.00
0.50
1.00
1.50
2.00
2.50
0.00 0.20 0.40 0.60 0.80 1.00
Q (m3 s-1)
TN (m
g l-1)
2 November 2001
01234567
8:00
8:30
9:00
9:30
10:0
0
10:3
0
11:0
0
11:3
0
12:0
0
12:3
0
Q (m
3 s-1)
0.0
0.5
1.0
1.5
2.0
2.5
TN (m
g l-1)
Q TN
2 November 2001
0.0
0.5
1.0
1.5
2.0
2.5
0 1 2 3 4 5 6 7
Q (m3 s-1)
TN ((
mg
l-1)
10 April 2002
0.0
0.5
1.0
1.5
2.0
2.5
9:00
9:15
9:30
10:0
0
10:3
0
11:0
0
11:3
0
12:0
0
Q (m
3 s-1)
0
100
200
300
400
500
600
700
TN (m
g l-1)
Q TN
10 April 2002
0
200
400
600
800
0 1 1 2 2 3
Q (m3 s-1)
TN
(m
g l-1)
27 August 2002
0.0
0.2
0.4
0.6
0.8
1.0
1.2
1.4
11:3
0
12:0
0
12:1
5
12:2
5
12:4
0
15:3
0
16:0
0
16:3
0
Q (m
3 s-1)
0.00.20.40.60.81.01.21.41.61.82.0
TN (m
g l-1)
Q TN
27 August 2002
0.0
0.4
0.8
1.2
1.6
2.0
0 0.2 0.4 0.6 0.8 1 1.2 1.4
Q (m3 s-1)
TN (m
g l-1)
Figure 7 The pattern and types of TN and Q hysteresis during storm events

85
Geografi Vol 1, No 1 (April 2013), 74-101© Penerbit Universiti Pendidikan Sultan Idris 2013
23 October 2001
0.00.10.20.30.40.50.60.70.80.91.0
10:1
5
10:3
0
10:4
5
11:0
0
11:1
5
11:3
0
12:0
0
12:3
0
13:0
0
18:4
0
Q (m
3 s-1)
0.000.010.020.030.040.050.060.070.08
TP (m
g l-1)
Q TP
23 October 2001
0.00
0.010.02
0.030.04
0.05
0.060.07
0.08
0.00 0.20 0.40 0.60 0.80 1.00
Q (m3 s-1)
TP (m
g l-1)
2 November 2001
0
1
2
3
4
5
6
7
8:00
8:30
9:00
9:30
10:0
0
10:3
0
11:0
0
11:3
0
12:0
0
12:3
0
Q (m
3 s-1)
0.000.010.020.030.040.050.060.070.08
TP (m
g l-1)
Q TP
2 November 2001
0.00
0.010.02
0.030.04
0.05
0.060.07
0.08
0 1 2 3 4 5 6 7
Q (m3 s-1)
TP (m
g l-1)
10 April 2002
0.0
0.5
1.0
1.5
2.0
2.5
9:00
9:15
9:30
10:0
0
10:3
0
11:0
0
11:3
0
12:0
0
Q (m
3 s-1)
0.000.010.020.030.040.050.060.070.08
TP (m
g l-1)
Q TP
10 April 2002
0.00
0.010.02
0.030.04
0.05
0.060.07
0.08
0.0 0.5 1.0 1.5 2.0 2.5
Q (m3 s-1)
TP (m
g l-1)
27 August 2002
0.0
0.2
0.4
0.6
0.8
1.0
1.2
1.4
11:3
0
12:0
0
12:1
5
12:2
5
12:4
0
15:3
0
16:0
0
16:3
0
Q (m
3 s-1)
0.00.00.00.10.10.10.10.10.20.20.2
TP (m
g l-1)
Q TP
27 August 2002
0.00
0.05
0.10
0.15
0.20
0 0.2 0.4 0.6 0.8 1 1.2 1.4
Q (m3 s-1)
TP (m
g l-1)
Figure 8 The pattern and types of TP and Q hysteresis during storm events

86
Geografi sebagai sintesis: Meneliti kembali peranan geografi di sebalik ...
23 October 01
0.00
0.20
0.40
0.60
0.80
1.00
10:1
510
:30
10:4
511
:00
11:1
511
:30
12:0
012
:30
13:0
018
:40
Time
Q (m
3 s-1)
0.00
0.01
0.02
0.03
0.04
PO4-
P C
once
ntra
tion
(mg
l-1)
Discharge Orthophosphate-P
23 October 01
0.00
0.01
0.02
0.03
0.04
0.00 0.20 0.40 0.60 0.80 1.00Q (m3 s-1)
PO4-P
Con
cent
ratio
n (m
g l-1
)2 November 01
0.001.002.003.004.005.006.007.00
8:00
8:30
9:00
9:30
10:0
0
10:3
011
:00
11:3
012
:00
12:3
0
Time
Q (m
3 s-1)
0.00
0.01
0.02
0.03
0.04
0.05
PO4-
P C
once
ntra
tion
(mg
l-1)
Discharge Orthophosphate-P
2 November 01
0.00
0.01
0.02
0.03
0.04
0.05
0.00 2.00 4.00 6.00Q (m3 s-1)
PO4-P
Con
cent
ratio
n(m
g l-1
)
10 April 02
0.00
0.50
1.00
1.50
2.00
2.50
9:00
9:15
9:30
10:0
0
10:3
0
11:0
0
11:3
0
12:0
0
Time
Q (m
3 s-1)
0.000
0.010
0.020
0.030
0.040
PO4-
P C
once
ntra
tion
(mg
l-1)
Discharge Orthophosphate-P
10 April 02
0.00
0.01
0.02
0.03
0.04
0.00 0.50 1.00 1.50 2.00Q (m3 s-1)
PO4-P
Con
cent
ratio
n(m
g l-1
)
27 August 02
0.00
0.30
0.60
0.90
1.20
1.50
11:3
0
0:00
12:1
5
12:2
5
12:4
0
15:3
0
16:0
0
16:3
0
Time
Q (m
3 s-1)
0.00
0.01
0.02
0.03
0.04
PO4-P
Con
cent
ratio
n (m
g l-1
)
Discharge Orthophosphate-P
27 August 02
0.00
0.01
0.02
0.03
0.04
0.00 0.30 0.60 0.90 1.20 1.50Q (m3 s-1)
PO4-P
Con
cent
ratio
n (m
g l-1
)
Figure 9 The pattern and types of orthophosphate and Q hysteresis during storm events

87
Geografi Vol 1, No 1 (April 2013), 74-101© Penerbit Universiti Pendidikan Sultan Idris 2013
in Figures 4c and 4d. The plot of SSC with Q (Figure 4b) revealed strong seasonal variations that paralleled seasonal rise and fall in stream discharge. The SSC tended to increase with Q during monitoring period, peaking almost simultaneously with Q peak and then declining rapidly to an undetectable value well before Q dropped towards base flow conditions (Figure 4b). Based on the relationship between SSC and Q, approximately 94% (p<0.001) of the variance in SSC in Upper Relau is explained by the variations in Q. During August, September and October 2002, there was a recession in both SSC transport and Q. One exception to this trend was a major SSC transport and Q event in late August, which was associated with a severe storm.
The plot of TN and nitrate (Figure 4c) does not really show a marked influence of discharge. However, there was a slight influence of Q on the variations of TP and orthophosphate (Fig. 4d). The relationship between TN, nitrate, TP and orthophosphate concentrations with Q are prone to a high degree of uncertainty and scatter. The plot of the nitrate, TN, orthophosphate and TP concentrations shows evidence of the variability in the distribution of these pollutants concentration. The relationship between NO3-N and TN with Q were weak with r2 = 0.074 (p<0.001) and r2 = 0.271 (p<0.001) respectively. The relationship between orthophosphate and TP concentrations with Q were also weak (r2=0.0441 (p<0.001) and r2 = 0.109 (p<0.001) respectively) but slightly better than the relationship for NO3 and TN.
The Sediment and Nutrient Hysteresis
Hysteresis is often explained as the consequence of the removal of sediment produced in the inter-storm period by the first flush of water (Gregory and Walling, 1973). However, clockwise hysteresis was also observed in runoff events following each other very rapidly. Another explanation for hysteresis is that sediment supply is coming mainly from the channel bed and/or channel banks. Hysteresis loops for individual storm events have been constructed between SSC and Q (Fig 5). The storm on 23 October 2001 was anticlockwise while the storm events which occurred on 2 November 2001 and 27 August 2002 produced an eight-shaped hysteresis.
Figure 6 is the hysteresis for nitrate with Q. The behavior of nitrate concentrations during storms appears to be varied. The NO3-N concentration during selected storm events showed rapid increase at the start of storm events and later decreased when Q increased. This phenomenon can be observed on storm events occurring on 23 October 2001, 2 November 2001, 10 April 2002 and 27 August 2002 (Figure 6), where the nitrate concentration tended to decrease when the Q greatly increased, and an anticlockwise hysteresis was produced.
The hysteresis for TN with discharge is shown in Figure 7. The first storm on 23 Oct 2001 and the third storm on 10 April 2002 display an anticlockwise loop; the 2 November 2001 storm exhibits an eight-shaped and 27 August 2002 is a positive loop. The TP loop (Figure 8) on the other hand was different in the first storm on 23 Oct 2001

88
Geografi sebagai sintesis: Meneliti kembali peranan geografi di sebalik ...
and the second storm on 2 Nov 2001 displays an anticlockwise loop; the third storm on 10 April 2002 was eight-shaped and clockwise on 27 August 2002.
The orthophosphate hysteresis also displays an anticlockwise and loop number eight (Figure 9). The orthophosphate concentration tends to fluctuate, either increased or decreased when Q is increased. The fluctuation of orthophosphate concentration during these storm events produced either an anticlockwise hysteresis (23 Oct 2001; 2 Nov 2001), or a clockwise hysteresis (27 Aug 2002) and a slight number eight loop (10 April 2002).
Plot of Log Q against Log SSC
A plot of log Q against log Q was plotted to examine the source of sediment (Fig. 10). The plot will show whether the system has run out of readily suspendable and erodible material or not. A convex plot will show that the river is likely to be ‘sediment starved’ and vice versa if the curve is a concave plot, the chances are, that much of the sediment is coming from erosion and/or from an upstream source. Fig 8 shows that the storm on 23 Oct 2001 is a convex curve while most of the storms are concave showing a distant source of sediment. That explains why all the hysteresis are anticlockwise.
23 Oct 2001 y = -3.8415x2 + 0.8213x + 2.7826R2 = 0.6043
0
0.5
1
1.5
2
2.5
3
3.5
-0.6 -0.5 -0.4 -0.3 -0.2 -0.1 0Log Q
2 Nov 2001y = 1.3806x2 + 0.5418x + 2.3663
R2 = 0.9251
00.5
11.5
22.5
33.5
4
-0.4 -0.2 0 0.2 0.4 0.6 0.8 1
Log Q
Lo
g S
SC
10 April 2002
y = 1.0963x2 + 0.9931x + 2.1341R2 = 0.7803
0
0.5
1
1.5
2
2.5
3
-0.8 -0.6 -0.4 -0.2 0 0.2 0.4
Log Q
Log
SSC
27 Aug 2002 y = 0.9945x2 + 0.6706x + 2.3054
R2 = 0.1687
0
0.5
1
1.5
2
2.5
3
-0.6 -0.5 -0.4 -0.3 -0.2 -0.1 0 0.1 0.2
Log Q
Log
SSC
Figure 10 Log Q against Log SSC

89
Geografi Vol 1, No 1 (April 2013), 74-101© Penerbit Universiti Pendidikan Sultan Idris 2013
Discussion
Temporal Variations of Suspended Sediment Concentrations (SSC) with Discharge (Q)
Based on the relationship between SSC and Q, approximately 94% (p<0.001) of the variance in SSC in Upper Relau is explained by the variations in Q. In some cases the maximum SSC which precedes peak Q results from a reduction of the erosive effect of rainfall and increased volume of subsurface contributions to the recession flow (Gregory & Walling, 1973). Extreme rainfalls could create a large volume of runoff that is capable of excavating a high proportion of sediment loads from small river catchments (Curtis & Douglas 1993). During monitoring period, the amount of rainfall in mid July 2002 was the highest, but this rainfall was the only influence on the SSC, possibly due to the effects of lag or delayed rainfall (Olive & Rieger, 1985).
Sediment sources in the steeper areas of the catchment are primarily unstable soil and weathered rock that, either devoid of vegetation or otherwise susceptible to splash and rill erosion due to steep topography (Leonard et al., 1979). In other words, it is not only the hydraulic properties of the flow that determine the suspended sediment response but also the sediment supplies in the catchment (Graf 1988). This suggests that much of the sediment was flushed through the system early in the rainy season (March and April). This is most likely because of the availability of large amounts of fine-grained hill-slope sediments during the early months, which could rapidly be transported to the channel due to the proximity of steep slopes and because of the sudden increase in precipitation associated with the onset of summer rains (Hudson, 2003). At the beginning of the rainfall season, sediments came from the surface runoff occurring on hill-slopes, from re-entrainment of sediments deposited in the channel network and from river bed erosion (Picouet et al., 2001). The runoff produced during or after rainfall event contains relatively high level of nutrients during the monitoring period.
The Temporal Variations of Nutrients with Discharge
Nitrate
The concentrations of all nutrients tended to fluctuate considerably and were almost certainly influenced by a variety of factors. This is true in our study where the concentration of NO3-N varied considerably throughout the monitoring period (Figure 4c). The NO3-N level shows a striking monthly variation where NO3-N concentration reached maximum in April 2002 and minimum in December 2001. This effect is closely associated with the amount of rainfall, which is responsible for the presence of NO3-N in the stream. Contribution of subsurface flow and groundwater Q possibly may raise the NO3-N concentration in streams, even in the absence of a runoff event (Hooda et al., 2000; Baker & Laflen, 1983).

90
Geografi sebagai sintesis: Meneliti kembali peranan geografi di sebalik ...
There was a delayed NO3-N peak in September 2002 which suggests that NO3-N reached the stream by way of percolation into the soil and as a result of drainage activities, rather than the immediate runoff from rainfall. This is in keeping with expectations based on the known effects of rainfall on the movement of NO3-N in soil, as rain begins to penetrate the soil it carries free NO3-N down into the soil toward groundwater, so that when soil becomes waterlogged, small amount NO3-N is carried off to the stream (Commoner, 1975). The NO3-N concentration was at a minimum and constant from December 2001 to January 2002 when Q was low during this period. It is well documented that vegetation uptake, together with denitrification in soil, streams and near-stream zones, effectively reduces inorganic-N concentrations in surface water especially during summer (Burt et al., 1988; Cirmo & McDonnell, 1997). Indeed, NO3-N flushing can occur during the transition from dry to wet conditions in small catchments (Avila et al., 1992; Biron et al., 1999).
The wide variation in Q resulting from heavy rainfall caused pronounced fluctuation of orthophosphate concentration and NO3-N pattern during the monitoring period (Figure 4d). The slight Q increase in early March 2002 was sufficient to begin flushing out the old soil water accumulated over the preceding months (Leonard et al., 1979).
Orthophosphate
The orthophosphate concentration was found to be highly variable and strongly affected by rainfall events, presumably from surface runoff and groundwater flow feeding into rivers. Increase in the concentration of orthophosphate coincided with rainfall events, followed by rapid decline after rainfall (MacDonald et al. 1994). Increases in orthophosphate concentration following rainfall events could be explained by higher orthophosphate concentration in the wet months. The highest Q probably will dislodge orthophosphate concentration on the surface of bed sediment. The lowest orthophosphate concentration during summer base flow probably influenced uptake by macrophytes and algae (Hill, 1982). Lower correlation of orthophosphate concentration with Q was due to the fact that the highest concentrations occurred early in a storm event, usually before maximum flow. Later in the storm event, they were diluted, so that low concentration was observed over a wide range of Q (McDiffett et al., 1989). Higher concentrations at low Q are expected due to ‘washout’ of soluble particulate phosphorus in the atmosphere (Neal et al., 2003), and these processes may include dilution by input of sub-surface flow to the stream, deposition and re-suspension, sorption of dissolved phosphorus by suspended sediment and channel bank, and also bed material (Sharpley et al., 1999). Some unusual orthophosphate peaks measured in the agricultural basin has been found to reflect the leaching of soluble P-forms coming from slurry washed off the land soon after application (Salvia-Castellvi et al., 2005).

91
Geografi Vol 1, No 1 (April 2013), 74-101© Penerbit Universiti Pendidikan Sultan Idris 2013
The Hysteresis
Suspended sediment response
In recognizing the sequential nature of storm data, an increasing number of researchers have plotted hysteresis loops to indicate that the relationship between SSC and Q is variable through a storm event (Olive & Rieger, 1985). Previous studies have shown that the relationship between SSC and Q during individual flood events is complex with hysteresis loops (Wood, 1977; Williams, 1989; Kronvang et al., 1997).
The storm event on 23 October 2001 shows that the SSC was low when Q was high, and this storm resulted in an anticlockwise hysteresis. The SSC decreased relatively to the Q with each subsequent Q rise, and virtually no SSC response occurred in the subsequent rise. This response occurs when the storm event is not of sufficient length to cause exhaustion of material of a size suitable to be transported in suspension (Wood, 1977). Klein (1984) argues that this behaviour is due to the flushing of accumulated materials near the channel by surface runoff and the subsequent exhaustion of these sediment sources. This may also be due to the travel distance from the runoff and sediment generating areas since Q peaks can travel with wave velocity to the gauging station, whereas the suspended sediment travels with flow velocity (Williams, 1989), and sediments are transported from areas that are far away from the channel. An additional explanation for an anticlockwise hysteresis pattern would be due to a minor precipitation event occurring after the major event, providing additional silt/clay from runoff-derived sources (Williams, 1989).
During an anticlockwise loop, sediment sources are widespread throughout the catchment rapidly exhausted. This is because of the incorporation of sediment from areas that are not constantly connected to the channel network, like old debris-flow tails or unconsolidated deposition areas of older runoff events, and trails. These areas are only connected to the channel network when the runoff is generated all over the catchment. This is only possible under extremely high moisture conditions, so that saturation excess overland flow is generated independent of the topographical situation, or by the overflow of widespread saturation areas that may function as storing tanks with only occasional connection to the channel network (Seeger et al., 2004). The decrease of SSC before the decrease of Q indicates that the suspended sediment sources are limited and rapidly depleted. Therefore, the runoff generation (and sediment mobilisation) is limited to areas near the channel (Seeger et al., 2004).
The storm events which occurred on 2 November 2001 and 27 August 2002 produced an eight-shaped hysteresis. This response represents a multiple stream rise storm, which results in SSC exhibiting both a lead and lag response on different rises and results in a hysteresis with both clockwise and an anticlockwise, often figured as eight-shaped (Olive & Rieger, 1985). Eight-shaped loops can be understood as a sequence of clockwise and counter-clockwise partial floods (Seeger et al., 2004).
In the storm event on 2 November 2001, the SSC and Q are closely related, where

92
Geografi sebagai sintesis: Meneliti kembali peranan geografi di sebalik ...
SSC and Q rise together, but SSC decreases relative to Q with each subsequent Q rise. This pattern appears to show a limit to the availability of sediment of a size suitable for transport by suspension (Wood, 1977). This pattern also shows that the suspended material originates in the channel itself where the supply of suitable material to the channel by runoff processes has become reduced (Arnborg et al., 1967). At the first stage, flood generation and sediment production occurs near the channel (Seeger et al., 2004). The SSC and Q decrease together because during the falling limb of Q, the mobilizable material has been removed or cannot be entrained anymore because of the cessation of rainfall and surface runoff (Picouet et al., 2001). During periods of high Q, SSC in large rivers more directly reflects mobilization of sand from the channel bed (Mossa, 1996). Attenuation of SSC values during the lag period between the SSC peak and Q peak produces an extreme hysteresis effect, such that SSC values typically return to background levels well before the Q peak. Mossa (1996) reports similar patterns of decreasing SSC at high Q for the lower Mississippi River. Extreme hysteresis of this type is often explained by in-channel processes, such as mobilization of fines from the channel bed during the rising stage of a flood or differences between the routing time of flood waves and sediment plumes (Wood, 1977; Marcus, 1989). The external factors to the channel network also influence hysteresis. These include exhaustion of the upland sediment sources during a prolonged event, or asymmetry between the major sediment and runoff sources in the basin (Williams, 1989; Jeje et al., 1991).
The second eight-shaped hysteresis on the 27 August 2002 appeared when an early flushing of all available SSC during the initial of Q and SSC tended to peak before Q. The rapid increase in SSC at the start of storm event reflects an initial uptake of sediment from the channel perimeter, whereas each rise in river flow mobilized the fine sediment deposited on the falling stage of the previous storm (Douglas et al., 1992). Arnborg et al. (1967) suggests that the relationship results from the first sediment being entrained during the rising stage which was last deposited on the river bed during the previous recession flow. This pattern may be caused by the presence of a sediment source near the gauging station (Brasington & Richards, 2000); or due to the entrainment of sediment from the bed during the rising limb (Arnborg et al., 1967; Bogen, 1980). Again, subsequent stream Q which decreases in the same storm event results in relatively low rises in SSC. This situation may be caused by additional sources of sediment, which could be associated with small landslides due to increasing soil moisture during the onset of the rainy season (Ismail & Rainis, 1999), when primarily loosened sediment is scoured from the channel banks as Q rises (Russell et al., 2001). During overbank flow, the cross-stream gradient of SSC almost certainly increases, given the local access to additional sediment supplies on the flood plain, and there are also likely to be increases in viscosity and decreases in turbulence as a function of the very high concentrations of suspension. This may decrease the uniformity of the SSC significantly and a fixed-point sample may become less representative of the mean

93
Geografi Vol 1, No 1 (April 2013), 74-101© Penerbit Universiti Pendidikan Sultan Idris 2013
concentration. The second reason relates to the difficulties of determining water Q during overbank flow (Alexandrov et al., 2003).
The rise of Q response occurred with slight increase of SSC, but SSC lagged behind Q with rising concentration occurring on the falling limb after Q resulted in a clockwise hysteresis which was observed during the storm event on 10 April 2002. The initial stream Q peak resulted in high SSC, while the SSC rise was progressively lower with each subsequent stream rise. This occurs despite the fact that in most cases when the catchment becomes wet, it might be expected that a greater proportion of the catchment contributes to surface runoff, so the potential source area of sediment increases (Olive & Rieger, 1985). The magnitude of SSC recorded in a stream during a storm event reflects the mixing of sediment-laden runoff with prevailing base flow (Ismail & Rahaman, 1994). If base flow is high, storm runoff concentration could be considerably diluted, conversely, a little dilution occurs if the base flow is low (Walling & Webb, 1982). As the intensity of the rainfall decreases, the generation of Hortonian overland flow stops and the contributing areas are closer to the ravine where sediment sources are limited and rapidly exhausted during the event. As a consequence, sediment production decreases faster than runoff generation (Seeger et al., 2004). The decrease of SSC and Q increase is due to the fact erosion is slowed down and dilution occurs with the increasing contribution of the groundwater flow (poor in sediment) to the total flow (Picouet et al., 2001).
Nitrate response
The response of particular catchment during storm events will reflect not only land use, soil and the underlying rock mineralogy, but also the antecedent soil moisture conditions as well as the spatial intensity and duration of rainfall (House & Warwick, 1998). All the storm events showed that the NO3-N concentration rapidly increased in the upper Relau River at the beginning of the storm and diluted as the Q reached the maximum. This phenomenon could be due in part to direct input from the rainfall itself (McDiffett et al., 1989), and in part, to flushing of accumulated NO3-N from the soil (Webb & Walling, 1985). The concentrations of NO3-N tended to fluctuate considerably and were almost certainly influenced by a variety of factors in addition to Q, such as the length of time between storm events and the amount of precipitation (McDiffett et al., 1989). NO3-N can be washed out easily during severe storms, and its restoration in the catchment takes time (Creed et al., 1996).
The increase in NO3-N concentration occurs only up to a certain level, beyond which they decrease with increasing Q. The decrease in NO3-N concentration at the higher rates of Q is probably related to dilution of the NO3-N once it has reached a maximum rate of release (Becher et al., 2001). The NO3-N concentration decreases because of the dilution effect of the high Q, and the excess water which causes flooding decreases the efficiency of NO3-N leaching (Moreau et al., 1998).

94
Geografi sebagai sintesis: Meneliti kembali peranan geografi di sebalik ...
Walling and Webb (1980) interpret hysteresis dynamics for the River Exe in England in terms of variable source area contributions during the course of a storm and infer that clockwise hysteresis (increasing solute concentrations associated with the falling limb) is the result of groundwater contributions from distal tributaries. These statements are further supported by Baker and Laflen (1983) who assert that the high NO3-N concentration in the streams which is drained from grassland and arable area come predominantly from groundwater discharge and subsurface flow including tile or pipe drainage.
For anticlockwise hysteresis loops (Figure 5), Q is expected to be initially diluted in NO3-N during storm runoff, followed by a higher concentration when the sub-surface component becomes an important contribution (House & Warwick, 1998). The NO3-N concentration during all storm events shows that high NO3-N concentration during the recession limb is possibly reflected by the diluting influence of channel precipitation and quick flow at the beginning of the stream rise, which is overridden by the arrival of NO3-N rich delayed runoff in the stream channel later during the event (Burt et al., 1983). The lag of the NO3-N concentration peak behind Q is probably due to delayed arrival of water from the upper end of catchment with a relatively high NO3-N concentration. Nutrient storage available for leakage is limited, and accumulated matter may be flushed out during the first high flow event. Then, the concentrations decrease with time during continuous or repeated events (Lucey & Goolsby, 1993; Caissie et al., 1996). The NO3-N concentration usually shows a short-lived decrease in the rise limb of the hydrograph, when surface runoff occurs. After this initial reduction, NO3-N concentrations increase and some time exceed pre-storm levels, indicating NO3-N losses by leaching of soils via subsurface and through flow pathways (Salvia-Castellvi et al., 2005).
Phosphorus response
Phosphorus (P) in streams includes point and non-point source inputs and can be organic and inorganic. In many parts of the world, the increased flux of P during storm events is due disproportionately to the increased mobilization of P in its particulate form (Edwards & Owens, 1991; McDowell & Sharpley, 2002). The orthophosphate concentration in streams was found to be highly variable and strongly influenced by rainfall events, presumably from surface runoff and groundwater flow feeding into streams. The data encompasses a wide range of initial conditions for individual storm events and incorporate the effects of hysteresis, both of which contribute to the scatter of the C-Q data. The investigation of orthophosphate concentration during selected storm events shows highly variable concentration and the hysteresis tended to form anticlockwise loops. During 4 storm events recorded on 23 October 2001, 2 November 2001, 10 April 2002 and 27 August 2002 (Figure 6), the orthophosphate concentrations tend to fluctuate, either increasing or decreasing when Q is increased. The fluctuation of orthophosphate concentration during this storm event produced either a clockwise

95
Geografi Vol 1, No 1 (April 2013), 74-101© Penerbit Universiti Pendidikan Sultan Idris 2013
or an anticlockwise hysteresis.During the storm event on 23 October 2001, Q initially increased and this
increasing Q is followed by increasing orthophosphate concentration. However, when Q decreased, the orthophosphate concentration also decreased. This storm event produced an anticlockwise hysteresis (Figure 6) because the peaks of orthophosphate concentration are delayed compared to peaks in Q. The delayed phenomenon was also observed by, for example, Bowes et al. (2005) at Grinton U.K. This delay between the peak in stream Q and the maximum phosphorus concentration suggests that the majority of phosphorus is derived from a source that is mobilised slowly or is distant from the sampling point (Bowes et al., 2005). This provides a source of phosphorus that can be rapidly mobilised during high flows, either by desorption into the water column (Froelich, 1988), or by entrainment of phosphorus-rich fine sediment (Bowes et al., 2003).
In the 2 November 2002 storm event, the orthophosphate concentration was low initially where Q was also low. Both Q and orthophosphate peaked simultaneously (Figure 6). Orthophosphate concentrations decrease gradually while Q rapidly decreased after 30 minutes and slowly declined after that. At this time the orthophosphate concentrations remain at higher concentration and tended to increase again slightly before stagnating until the Q reached the base flow. This storm behaviour produced an anticlockwise hysteresis. The increase in concentrations for a specific Q during the rising limb of the hydrograph may be attributed to the increase in groundwater discharge as a result of a rapid rise in hydraulic head along the perimeter of the stream channel (Sklash & Farvolden, 1979; Walling & Foster, 1975). It is possible that external sources and local flow conditions in the immediate vicinity of each site appear to exert a strong influence on concentrations (Smith et al., 2005) and also diluted slightly, during the hydrograph peak as dilution decreased during the start of the receding limb, and concentrations became the highest (Caruso, 2002; Lewis, 1986).
The storm events on 10 April 2002 and 27 August 2002 show high orthophosphate concentration during the early storm events and then diluted when Q increased. Nevertheless, when Q gradually declined, the orthophosphate concentration still increased, but when reaching a maximum level, the orthophosphate concentration slightly decreased. At a certain level of Q, the orthophosphate concentration increased again, even when Q declined towards base flow level. The rapid increase in orthophosphate concentration at the start of these storm events demonstrates that marginal phosphorus accumulated since the last storm event enters the stream as the water level rises. When a storm event follows immediately afterwards, much of the marginal phosphorus has already been removed by a previous flood, and so the gradient constant is reduced (Bowes et al., 2005). The source of this mobilized TP must be either within or close to the river itself in order to be transported so rapidly, and is most likely to be from the bed-sediment, field drains and in-wash of TP from the river bank due to rainfall and rising stream levels (Bowes et al., 2005). Leaching of orthophosphate to the groundwater is considered to be of little significance because of the normally

96
Geografi sebagai sintesis: Meneliti kembali peranan geografi di sebalik ...
strong TP absorption to the soil (DeWitt & Bendoricchio, 2001; Scanlon et al., 2004). TP, rather than be released, remains in the upper portions of the soil profile as a result of absorption onto amorphous oxides of iron and aluminim (Johnson et al., 1986) and adsorption onto bottom and suspended sediments (Neal & Heathwaite, 2005).
Conclusion
As a conclusion, in our study, particular emphasis is placed on the description and interpretation of seasonal and storm period patterns of sediment and nutrient concentrations, which are found to be highly dynamic and strongly episodic. Great variation occurred between SSC, NO3-N, and orthophosphate concentrations and Q during the study period. This variable concentration could arise from hysteresis phenomena between rising and recession flow. The results of a detailed study on SSC, NO3-N and orthophosphate concentrations have been outlined, where preliminary interpretation of SSC, NO3-N and orthophosphate concentrations are highly episodic during the monitoring period. The highly episodic SSC, NO3-N and orthophosphate concentration during the monitoring period is not only dependent on or influenced by Q, but also related to other factors which must be taken into consideration too, such as rainfall intensity, antecedent soil moisture and total rainfall. In this study, we try to find the source of SSC, NO3-N, TN, orthophosphate and TP concentrations, focusing on the contribution of these pollutants during storm events by observing the hysteresis patterns formed. From our limited storms, generally, in our findings SSC tends to show a clockwise hysteresis (10th April 2002) which is the most common type of sediment transport observed elsewhere by many researchers, but with substantial difference in Q and rainfall conditions. In addition, an anticlockwise (23 October 2001) and “eight shaped” (2nd November 2001 and 27th August 2002) hysteresis loops were also observed. However, the hysteresis patterns for NO3-N and orthophosphate concentrations are mostly anticlockwise hysteresis for all storms.
Acknowledgements
The project was partly funded by a research grant from the Ministry of Science and Technology of Malaysia (IRPA Grant No. 08-02-05-0015). Figure 1 is reprinted from Hudson, P. F. (2003). Event sequence and sediment exhaustion in the lower Panuco Basin, Mexico CATENA, Vol 52 (1), 57-76, with permission from Elsevier.
References
American Public Health Association. (1989). Standard methods for examination of water and wastewater. 17th Edition. Washington D.C: American Public Health Association.
Alexandrov, Y., Laronne, J. B. & Reid, I. (2003). Suspended sediment concentration and its variation with water discharge in a dryland ephemeral channel, northern Negev, Israel. Journal of Arid Environment, 53, 73–84.

97
Geografi Vol 1, No 1 (April 2013), 74-101© Penerbit Universiti Pendidikan Sultan Idris 2013
Arnborg, L., Walker, H. J. & J. Peippo, J. (1967). Suspended load in the Colville River, Alaska, 1962. Geografiska Annaler, 49, 131–144.
Avila, A., Pinol, J., Roda, F. & Neal, C. (1992). Storm solute behaviour in a montane Mediterranean forested catchment. Journal of Hydrology, 140, 143–161.
Banaszuk, P. & Wysocka-Czubaszek. A. (2005). Phosphorus dynamics and fluxes in a lowland river: The Narew Anastomosing River System, NE Poland. Ecological Engineering, 25, 429–441.
Biron, P. M., Roy, A. G., Courschesna, F., Hendershot, W. H., Cote, B., & Fyles, J. (1999). The effects of antecedent moisture conditions on the relationships of hydrology to hydrochemistry in a small forested watershed. Hydrological Processes, 13, 1541–1555.
Baker, J. L. & Laflen, J. M. (1983). Water quality consequences of conservation tillage. Journal of Soil and Water Conservation, 38, 186–193.
Becher, K. D., Kalkhoff, S. J., Schnoebelen, D. J., Barnes, K. K., & Miller, V. E. (2001). Water-quality assessment of the eastern Iowa basins-nitrogen, phosphorus, suspended sediment and organic carbon in surface water, 1996–1998. United State Geological Survey Water Resources Investigations Report 01-4175.
Bogen, J. (1980). The hysteresis effect of sediment transport systems. Norsk Geogr. Tiddskr, 34, 45–54.
Bowes, M. J., House, W. A., & Hodgkinson, R. A. (2003). Phosphorus dynamics along a river continuum. Science of the Total Environment, 313, 199–212.
Bowes, M. J., House, W. A., Hodgkinson, R.A., & Leach, D. V. (2005). Phosphorus–discharge hysteresis during storm events along a river catchment: the River Swale, UK. Water Research, 39, 751–762.
Brasington, J. & Richards, K. S. (2000). Turbidity and suspended sediment dynamics in small catchments in the Nepal Middle Hills. Hydrological Processes, 14, 2259–2274.
Buijsman, E. & Erisman, J. W. (1988). Wet deposition of ammonium in Europe. Journal of Atmospheric Chemistry, 6, 265–280.
Burt, T. P., Butcher, D. P., Coles, N., & Thomas, A. D. (1983). The natural history of Slapton Ley Nature Reserve XV: Hydrological processes in the Slapton Wood catchment. Field Studies Journal, 5, 731–752.
Burt, T. P., Arkell, B. P., Trudgill, S. T. & Walling, D. E. (1988). Stream nitrate levels in a small catchment in southwest England over a period of 15 years. Hydrological Processes, 2, 267–284.
Caissie, D., Pollock, T. L., & Cunjak, R. A. (1996). Variation in stream water chemistry and hydrograph separation in a small drainage basin. Journal of Hydrology, 178, 137–157.
Carpenter, S. R., Caraco, N. F., Correll, D. L.. Howarth, R. W., Sharpley, A. N. & Smith, V. H. (1998). Nonpoint pollution of surface waters with phosphorus and nitrogen. Ecological Applications, 8, 559–568.
Caruso, B. S. (2002). Temporal and spatial patterns of extreme low flows and effects on stream ecosystems in Otago, New Zealand. Journal of Hydrology, 257, 115–133.
Cirmo, C. P., & McDonnell, J. J. (1997). Linking the hydrologic and biogeochemical controls of nitrogen transport in near-stream zones of temperate-forested catchments: a review. Journal of Hydrology, 199, 88–120.
Clark, E. H., Haverkamp, J. A. & Chapman, W. (1985). Eroding soils: the off-farm impacts. Washington D.C: The Conservation Foundation.
Commoner, B. (1975). Threats to the integrity of the nitrogen cycle: Nitrogen compound in soil, water, atmosphere and precipitation. In Singer, S. F. (ed.), The changing global environment.(pp. 341–366). Dordrecht-Holland: D. Reidel Publishing Company,

98
Geografi sebagai sintesis: Meneliti kembali peranan geografi di sebalik ...
Curtis, C. D. & I. Douglas, (1993). Catchment processes and the quantity and composition of sediments delivered to terminal basins. Philosophical Transaction of the Royal Society of London A, 344, 5–20.
Creed, I. F., Band, L. E., Foster, N. W., Morrison, I. K., Nicolson, J. A., Semkin, R. S. & Jeffries, D. S. (1996). Regulation of nitrate-N release from temperate forest: A test of the N flushing hypothesis. Water Resource Research, 32, 3337–3354.
Dai, J. J., Lorenzato, S. & Rocke, D. M. (2004). A knowledge-based model of watershed assessment for sediment. Environmental Modeling & Softwares, 19, 423–433.
Daniel, T. C., Sharpley, A. N. & Lemunyon, J. L. (1998). Agricultural phosphorus and eutrophication: A symposium overview. Journal of Environmental Quality, 27, 251–257.
Davis, J. R. & Koop, K. (2001). Current understanding of the eutrophication process in Australia. In Schumann, A. H., Acreman, M. C., Davis, J. R., Marino, M. A., Rosbjerg, D. & Jun, X. (eds.), Regional management of water resources. IAHS Publication, 268, 89–95.
Department of Statistic. (2000). Census data for state/districts. Kuala Lumpur : Department of Statistic.
Department of Statistic. (1991). Census data for state/districts. Kuala Lumpur: Department of Statistic.
Department of Statistic. (1980). Census data for state/districts. Kuala Lumpur: Department of Statistic.
Dendy, F. E. (1981). Sediment yield from a Mississippi delta cotton field. Journal of Environmental Quality, 10, 482–486.
DeWitt, M. & Bendoricchio, G. (2001). Nutient fluxes in the Po Basin. Science of the Total Environment, 273, 147–161.
Douglas, I., Spencer, T., Greer, T., Bidin, K., Sinun, W. & Wong, W. M. (1992). The impact of selective commercial logging on stream hydrology, chemistry and sediment loads in the Ulu Segama Rain Forest, Sabah, Malaysia. Philosophical Transaction of the Royal Society of London, A, 335, 397–406.
Edwards, A. M. C. (1973). The variation of dissolved constituents with discharge in some Norfolk Rivers. Journal of Hydrology, 18, 219–242.
Edwards, W. M. & Owens, L. B. (1991). Large storm effects on total soil erosion. Journal of Soil & Water Conservation, 46, 75–77.
Foster, I. D. L. & Charlesworth, S. M. (1996). Heavy metals in the hydrological cycle: Trends and explanation. Hydrological Processes, 10, 227–261.
Froelich, P. N. (1988). Kinetic control of dissolved phosphate in natural rivers and estuaries-a primer on the phosphate buffer mechanism. Limnology and Oceanography, 33, 649–668.
Graf, W. H. (1988). Fluvial processes in dryland rivers. Berlin: Springer-Verlag.Gregory, K. J. & Walling, D. E. (1973). Drainage basin form and process. London: Edward Arnold.Gordon, N. D., McMahon, T. A. & Finlayson, B. L. (1992). Stream hydrology: An introduction for
ecologists. Chichester: John Wiley & Son Ltd.Hill, A. R. (1982). Phosphorus and major cation mass balances for two rivers during low summer
flows. Freshwater Biology, 12, 273–304.Hooda, P. S., Edwards, A. C., Anderson, H. A. & Miller, A. (2000). A review of water quality
concerns in livestock farming areas. Science of the Total Environment, 250, 143–167.House, W. A., Leach, D., Long, A., Cranwell, P., Smith, C., Bharwaj, L., Meharg, A., Ryland,
G., Orr, D. O. & Wright, J. (1997). Micro-organic compounds in the Humber Rivers. Science of the Total Environment, 194, 357–371.
House, W. A. & Warwick, M. S. (1998). Hysteresis of the solute concentration/discharge relationship in rivers during storms. Water Research, 32(8), 2279–2290.

99
Geografi Vol 1, No 1 (April 2013), 74-101© Penerbit Universiti Pendidikan Sultan Idris 2013
Horowitz, A. J., (1995). The use of suspended sediment and associated trace elements in water quality studies. IAHS Special Publication 4. IAHS Press, Wallingford, UK.
Hudson, P. F. (2003). Event sequence and sediment exhaustion in the lower Panuco Basin, Mexico. Catena, 52, 57–76.
Ismail, W. R. & Rahaman, Z. A. (1994). The impact of quarrying activity on suspended sediment concentration and sediment load of Sungai Relau, Pulau Pinang, Malaysia. Malaysian Journal of Tropical Geography, 25(1), 45–57.
Ismail, W. R. (1995). Impact of urbanisation and uphill land clearances on the sediment yield of an urbanising catchment of Pulau Pinang, Malaysia. In: McLelland, S. J., Skellern, A. R. and Porter, P. R. (eds.), Postgraduate research in geomorphology: Selected papers from the 17th BGRG Postgraduate Symposium, University of Leeds, UK., 28–33.
Ismail, W. R. (1996). The role of tropical storms in the catchment sediment removal. Journal Biosciences, 7(2): 153–168.
Ismail, W. R. & Rainis, R. (1999). The behaviour transport of sediment in three hilly catchments of Penang Hill, Malaysia. Journal Bioscience, 10(1), 75–97.
Jeje, L. K., Ogunkoya, O. O. & Oluwatimilehin, J . M. (1991). Variation in suspended sediment concentration during storm discharges in three small streams in upper Osun basin, central western Nigeria. Hydrological Processes, 5, 361–69.
Johnson, D. W., Cole, D. W., Van Miegroet, H. & Horng, F. W. (1986). Factors affecting anion movement and retention in four forest soils. Soil Science Society of America Journal, 50, 776–783.
Klein, M. (1984). Anti clockwise hyteresis in suspended sediment concentration during individual storm: Holbeck catchment, Yorkshire, England. Catena, 11, 251–257.
Koroleff, K. 1983. Determination of nutrients. In. Grashoff, K., Ehrhardt, M. & Kremling, K. (eds.) Methods of seawater analysis(2nd Edtion). (pp. 93–134). New York: Verlag Chemie Weinheim,
Kronvang, B., Laubel, A. & Grant, R. (1997). Suspended sediment and particulate phosphorus transport and delivery pathways in an arable catchment, Gelbaek Stream, Denmark. Hydrological Processes, 11, 627–642.
Leonard, R. L., Kaplan, L. A., Elder, J. F., Coats, R. N. & Goldman, C. R. (1979). Nutrient transport in surface runoff from a Subalpine watershed, Lake Tahoe basin, California. Ecological Monograph, 49(3), 281–310.
Lewis, W. M. (1986). Nitrogen and phosphorus runoff losses from a nutrient-poor tropical moist forest. Ecology, 67(5),1275–1282.
Long, J. L. A., House, W. A., Parker, A. & Rae, J. E. (1998). Micro-organic compounds associated with sediments in the Humber Rivers. Science of the Total Environment, 210(6), 229–253.
Lucey, K. L., & Goolsby, D. A. (1993). Effects of climate variations over 11 years on nitrate-nitrogen concentration in the Raccon River, Iowa. Journal of Environmental Quality, 22, 38–46.
MacDonald, A. M., Edwards, A. C., Pugh, K. & Balls, P. W. (1994). The impact of land use on nutrient transport into and through three rivers in the north east of Scotland. In Kirby, C. & White, W.R. (eds.), Integrated river basin development. England: John Wiley & Son Ltd., pp. 201–214.
Mainstone, C. P. & Parr, W. (2002). Phosphorus in rivers-ecology and management. Science of the Total Environment, 282/283, 25–47.
Marcus, W. A. (1989). Lag-time routing of suspended sediment concentrations during unsteady flow. Geological Society of America Bulletin, 101, 644–651.

100
Geografi sebagai sintesis: Meneliti kembali peranan geografi di sebalik ...
McDiffett, W. F., Beidler, A. W., Dominick, T. F., & McCrea, K. D. (1989). Nutrient concentration-stream discharge relationship during storm events in a first-order stream. Hydrobiologia, 179, 97–102.
McDowell, R. W. & Sharpley, A. N. (2002). The effects of antecedent moisture conditions on sediment and phosphorus loss during overland flow: Mahantango Creek catchment, Pennsylvania, USA. Hydrological Processes, 16, 3037–3050.
Miltner, R. J. & Rankin, E. T. (1998). Primary nutrients and the biotic integrity of rivers and streams. Freshwater Biology, 40, 145–158.
Mossa, J. (1996). Sediment dynamics in the lowermost Mississippi River. Engineering Geology, 45, 457–479.
Moreau, S., Bertru, G. & Buson, C. (1998). Seasonal and spatial trends of nitrogen and phosphorus loads to the upper catchment of the River Vilaine (Brittany): Relationships with land use. Hydrobiologia, 373/374, 247–258.
Murphy, J. & Riley, J. P. (1962). A modified single solution method for the determined of phosphate in natural waters. Analitica Chimica Acta, 27, 31 – 36.
Neal, C., House, W. A., Leeks, G. J. L., & Marker, A. H. (1997). UK fluxes to the North Sea, Land Ocean Interaction Study (LOIS): River Basins Research, the First 2 Years 1993-1995. Science of the Total Environment 194,1–4.
Neal, C., Reynolds, B., Neal, M., Hughes, S., Wickham, H., Hill, L., Rowland, P., & Pugh, B. (2003). Soluble reactive phosphorus levels in rainfall, cloud water, throughfall, stemflow, soil waters, stream waters and groundwaters for the Upper River Severn area, Plynlimon, mid Wales. Science of the Total Environment, 314/316: 99–120.
Neal, C. & Heathwaite, A. L. (2005). Nutrient mobility within river basins: A European perspective. Journal of Hydrology, 304: 477–490.
Oborne, A. C., Brooker, M. P., & Edwards, R. W. (1980). The chemistry of the River Wye. Journal of Hydrology, 45: 233–252.
Olive, L. J. & Rieger, W. A. (1985). Variation in suspended sediment concentration during storms in five small catchments in southeast New South Wales. Australian Geographical Studies, 23(1), 38–51.
Picouet, C., Hingray, B., & Olivry, J. C. (2001). Empirical and conceptual modelling of the suspended sediment dynamics in a large tropical African river: The Upper Niger River basin. Journal of Hydrology, 250, 19–39.
Rose, S. (2003). Comparative solute-discharge hysteresis analysis for an urbanized and a ‘control basin’ in the Georgia (USA) Piedmont. Journal of Hydrology, 284, 45–56.
Russell, M. A., Walling, D. E., Webb, B. W. & Bearne, R. (1998). The composition of nutrient fluxes from contrasting UK river basins. Hydrological Processes, 12, 1461–1482.
Russell, M. A., Walling, D. E. & Hodgkinson, R. A. (2001). Suspended sediment source in two small lowland agricultural catchment in the UK. Journal of Hydrology, 252, 1–24.
Salvia-Castellvi, M., Iffly, J. F., Borght, P. V., & Hoffmann, L. 2005. Dissolved and particulate nutrient export from rural catchments: A case study from Luxembourg. Science of the Total Environment, 344, 51–65.
Scanlon, T. M., Kiely G. & Xie, Q. 2004. A nested catchment approach for defining the hydrological controls on non-point phosphorus transport. Journal of Hydrology, 291, 218–231.
Seeger, M., Errea, M. P., Beguerıa, S., Arnaez, J., Martı, C. & Garcıa-Ruiz, J. M. (2004). Catchment soil moisture and rainfall characteristics as determinant factors for discharge/suspended sediment hysteretic loops in a small headwater catchment in the Spanish Pyrenees. Journal of Hydrology, 288, 299–311.

101
Geografi Vol 1, No 1 (April 2013), 74-101© Penerbit Universiti Pendidikan Sultan Idris 2013
Sharpley, A. N. & Menzel, R. G. (1987). The impact of soil and fertilizer phosphorus on the environment. Advance in Agronomy, 41, 297-323.
Sharpley, A. N., Gburek, W. J., Folmar, G. & Pionke, H. B. (1999). Sources of phosphorus exported from an agricultural watershed in Pennsylvania. Agricultural and Water Management, 41, 77–89.
Siakeu, J., Oguchi, T., Aoki, T., Esaki, Y. & Jarvie, H. P. (2004). Change in riverine suspended sediment concentration in central Japan in response to late 20th century human activities. Catena, 55, 231–254.
Sklash, M. G., & Farvolden, R. N. (1979). The role of groundwater in storm runoff. Journal of Hydrology, 43, 45–65.
Smith, R. M. S., Evans, D. J. & Wheater, H. S. (2005). Evaluation of two hybrid metric-conceptual models for simulating phosphorus transfer from agricultural land in the River Enborne, a lowland UK catchment. Journal of Hydrology, 304, 366–380.
Stalnacke, P., Grimvall, A., Libiseller, C., Laznik, M., & Kokorite, I. (2003). Trends in nutrient concentrations in Latvian rivers and the response to the dramatic change in agriculture. Journal of Hydrology, 283, 184–205.
Steegen, A., Govers, G., Nachtergaele, J., Takken, I., Beuselinck, L., & Poesen, J. (2000). Sediment export by water from an agricultural catchment in the Loam Belt of central Belgium. Geomorphology, 33, 25–36
Threlfall, J. (1986). The relationship between discharge and suspended sediment in a small nival subarctic catchment. In Gardiner, V. (ed.), International geomorphology. (pp. 823–841). New York: Wiley
Verstraeten, G. & Poesen, J. (2002). Regional scale variability in sediment and nutrient delivery from small agricultural watersheds. Journal of Environmental Quality, 31, 870–879.
Viney, N. R., Sivapalan, M. & Deeley, D. (2000). A conceptual model of nutrient mobilisation and transport applicable at large catchment scales. Journal of Hydrology, 240, 23–44.
Walling, D. E. & Foster, I .D. L. 1975. Variation in the natural chemical concentrations of river water during flood flows and the lag effect: Some further comments. Journal of Hydrology, 26, 237–244.
Walling, D. E. & Webb, B. W. (1980). The spatial behaviour in the interpretation of stream solute behavior. Journal of Hydrology, 47, 129–149.
Walling, D. E. & Webb, B. W. (1982). Sediment availability and the prediction of storm-period sediment yields. International Association of Hydrological Science Publication, 137, 327–337.
Ward, A. D. & Trimble, S. W. (2004). Environmental hydrology. Second Edition. Boca Raton, Florida: CRC Press.
Webb, B. W. & Walling, D. E. (1985). Nitrate behaviour in streamflow from a grassland catchment in Devon, UK. Water Research, 19, 1005–1016.
Webb, B. W. & Walling, D. E. (1992). Water quality II: Chemical characteristics. In Calow, P. & Petts, G. E. (eds.). The rivers handbook: Hydrological and ecological principles. Vol.1. (pp. 73–100). Oxford: Blackwell Scientific Publications.
Williams, G. P. (1989). Sediment concentration versus water discharge during single hydrologic events in rivers. Journal of Hydrology, 111, 89–106.
Wood, P. A. (1977). Controls of variation in suspended sediment concentration in the River Rother, West Sussex, England. Sedimentology, 24, 437–445.