securing the present, shaping the future - world...
TRANSCRIPT

Securing the Present, Shaping the Future
WORLD BANK EAST ASIA AND PACIFIC ECONOMIC UPDATE 2011, VOLUME 1


WORLD BANK EAST ASIA AND PACIFIC ECONOMIC UPDATE 2011, VOLUME 1
Securing the Present, Shaping the Future

© March 2011 The International Bank for Reconstruction and Development / The World Bank1818 H Street NWWashington DC 20433Telephone: 202-473-1000Internet: www.worldbank.org
All rights reserved
1 2 3 4 13 12 11 10
This volume is a product of the staff of the International Bank for Reconstruction and Development / The World Bank. The findings, interpretations, and conclusions expressed in this volume do not necessarily reflect the views of the Executive Directors of The World Bank or the governments they represent.
The World Bank does not guarantee the accuracy of the data included in this work. The boundaries, colors, denominations, and other information shown on any map in this work do not imply any judgement on the part of The World Bank concerning the legal status of any territory or the endorsement or acceptance of such boundaries.
Rights and Permissions
The material in this publication is copyrighted. Copying and/or transmitting portions or all of this work without permission may be a violation of applicable law. The International Bank for Reconstruction and Development / The World Bank encourages dissemination of its work and will normally grant permission to reproduce portions of the work promptly.
For permission to photocopy or reprint any part of this work, please send a request with complete information to the Copyright Clearance Center Inc., 222 Rosewood Drive, Danvers, MA 01923, USA; telephone: 978-750-8400; fax: 978-750-4470; Internet: www.copyright.com.
All other queries on rights and licenses, including subsidiary rights, should be addressed to the Office of the Publisher, The World Bank, 1818 H Street NW, Washington, DC 20433, USA; fax: 202-522-2422; e-mail: [email protected].
ISSN: 2079-5874
Key title: World Bank East Asia and Pacific Economic Update … (Print)Abbreviated key title: World Bank East Asia Pac. Econ. Update (Print)
Cover photo: Tracey Shelton
WORLD BANK EAST ASIA AND PACIFIC ECONOMIC UPDATE 2011, VOL. 1

Preface and acknowledgments
The East Asia and Pacific Economic Update was prepared by a team led by Ivailo Izvorski with guidance from Vikram Nehru (East Asia and Pacific Regional Chief Economist) and team members Ekaterina Vostroknutova, Antonio Ollero, Doug Addison, Ahmad Ahsan, Henrike Brecht, Ardo Hansson, Abhas Jha, Louis Kujis, Andrew Mason, Shane Perkinson, Frederico Gil Sander, Manohar Sharma, and Xiaodong Wang. Inputs were also provided by Axel Baeumler, Jeff Chelsky, Luc Christiaensen, Mark Andrew Dutz, Swati Ghosh, Juan Feng, Gabriela Inchauste, Henry Edward Jewell, Tehmina Khan, Chul Ju Kim, Richard Little, Manjula Luthria, Stephen O’Connell, and Shahid Yusuf. World Bank country economists throughout East Asia and Pacific region provided country write-ups and tables, and assisted with the analysis.
Developing East Asia as used in this report includes China, Indonesia, Malaysia, Philippines, Thailand, Cambodia, Lao People’s Democratic Republic, Mongolia, Papua New Guinea, Timor-Leste, Vietnam, and the island economies in the Pacific. The Newly Industrialized Economies (NIEs) include Hong Kong SAR, China; the Republic of Korea; Singapore; and Taiwan, China. Middle-income countries, as used in this report, refer to China, Indonesia, Malaysia, Philippines, and Thailand. Low-income countries as used in this report include Cambodia and Lao PDR. The ASEAN member countries are Brunei Darussalam, Cambodia, Indonesia, Lao PDR, Malaysia, Myanmar, Philippines, Singapore, Thailand, and Vietnam.
SECURING THE PRESENT, SHAPING THE FUTURE
iii
contents
Preface and Acknowledgments ....................................................................................................................................iii
Abbreviations ...............................................................................................................................................................vii
Summary ............................................................................................................................................................ 1
Part I. Securing the Recovery, Lowering Inflation ................................................................................................. 3
I. Recovery firmly on track ................................................................................................................................ 4Growth surprises on the upside .................................................................................................................... 4
Box 1. Then and now: the 1997-98 Asian financial crisis and the global economic crisis ........................ 5Box 2. The rise of China ........................................................................................................................... 6
Industrial employment and wages are picking up ......................................................................................... 7Progress in reducing poverty is complicated by higher food and fuel prices ................................................ 8Exports are stabilizing at a faster pace than before the crisis ....................................................................... 9Capital flows surge, volatility increases ...................................................................................................... 11
II. Fighting inflation has become a key short-term priority ......................................................................... 14Inflation is on the rise .................................................................................................................................. 14Monetary policy is tightened ....................................................................................................................... 16
Box 3. The rising challenge of food security .......................................................................................... 17Exchange rate appreciation slows ............................................................................................................... 18Fiscal deficits are declining ......................................................................................................................... 20
Part II. Shaping The Future: Sustaining Inclusive Growth ................................................................................ 23
III. The changing global environment and the rise of East Asia ................................................................. 24The rise of developing countries: opportunities and challenge ................................................................... 24Growing economic weight, rising voice ...................................................................................................... 26
Box 4. Korea: From low-income to high-income in two generations .................................................... 27Box 5. Taking a seat at the table: The emerging role of East Asia in global economic governance ....... 28
A more populous, more urban, and older world .......................................................................................... 29Commodity prices are on the rise ............................................................................................................... 30The role of East Asia ................................................................................................................................... 31
IV. Regional integration and the role of China for regional prosperity ..................................................... 32Regional integration is becoming a key driver of regional growth ............................................................... 32China’s global and regional role surged since 1978 .....................................................................................33China’s economy through 2030: sustained albeit moderating growth ........................................................ 35China’s economy and its living standards in international perspective in 2030........................................... 36China’s rising regional and global role ......................................................................................................... 37
WORLD BANK EAST ASIA AND PACIFIC ECONOMIC UPDATE 2011, VOL. 1
iv

V. How will ageing affect East Asia’s growth? ............................................................................................. 39Ageing impacts growth ............................................................................................................................... 39Ageing is not all: countervailing factors, behavioral changes, and policies ................................................. 39Negative growth impact from rising fiscal and health costs of aging ......................................................... 41The role of government policies .................................................................................................................. 41
Box 6. Advancing labor mobility in East Asia: One scheme at a time .................................................... 42
VI. Rising inequality with high growth and falling poverty .......................................................................43Inequality is rising ........................................................................................................................................43Changing economies, changing wage premia, and rising inequality ........................................................... 45Is rising inequality in East Asia inevitable? ................................................................................................. 47
VII. Innovation for stronger productivity growth ......................................................................................... 49Productivity growth is lagging in most countries in the region ...................................................................49Innovation happens in cities ........................................................................................................................ 51Cities will adapt to the needs of their economies ....................................................................................... 52Education ensures absorption capacity .......................................................................................................53Links to universities, entrepreneurship and competition are also transmission channels ........................... 55
VIII. Energy security, environmental sustainability, and climate change ................................................. 57Ensuring environmental sustainability ......................................................................................................... 57
Box 7. The choice of energy future in East Asia ...................................................................................58Energy efficiency.........................................................................................................................................58Low-carbon technologies ............................................................................................................................60Low-carbon cities .......................................................................................................................................60Rapid urbanization demands more resilient cities ....................................................................................... 61
Box 8. Understanding risk and building urban resilience ........................................................................63
Country Pages and Key Indicators .................................................................................................................. 64Cambodia ....................................................................................................................................................64China ........................................................................................................................................................... 67Fiji ................................................................................................................................................................ 70Indonesia ..................................................................................................................................................... 73Lao PDR ...................................................................................................................................................... 77Malaysia ......................................................................................................................................................80Mongolia .....................................................................................................................................................83Papua New Guinea ......................................................................................................................................86Philippines ...................................................................................................................................................90Small Pacific Islands ....................................................................................................................................94
The challenge of climate change adaptation in Kiribati ..........................................................................96Solomon Islands .......................................................................................................................................... 97Thailand ..................................................................................................................................................... 100Timor-Leste ............................................................................................................................................... 103Vietnam ..................................................................................................................................................... 105
Key elements of Vietnam’s stabilization policy..................................................................................... 106
SECURING THE PRESENT, SHAPING THE FUTURE
CONTENTS v

Appendix Tables ....................................................................................................................................................... 109Appendix Table 1. Real GDP Growth ........................................................................................................ 109Appendix Table 2. Real GDP and Components of Aggregate Demand .....................................................110Appendix Table 3. East Asia: Merchandise Export Growth .......................................................................110Appendix Table 4. East Asia and the Pacific: GDP Growth Projections .....................................................111Appendix Table 5. Regional Aggregates for Poverty Measures in East Asia ............................................111Appendix Table 6. East Asia: Exchange Rates ...........................................................................................112Appendix Table 7. East Asia: Foreign Exchange Reserves Excluding Gold ................................................113Appendix Table 8a. East Asia: Balance of Payments .................................................................................114Appendix Table 8b. East Asia: Capital Account Components ....................................................................114Appendix Table 9. East Asia: Nonperforming Loans ..................................................................................115Appendix Table 10. East Asia: Financial Market Indicators ........................................................................116Appendix Table 11. Measures to Help Manage Capital Inflows .................................................................117
Appendix Charts ........................................................................................................................................................118Appendix Chart 1. East Asia: Foreign Exchange Reserves and Exchange Rates ......................................118Appendix Chart 2. East Asia: Real and Nominal Exchange Rates ..............................................................119
References ....................................................................................................................................................... 120
WORLD BANK EAST ASIA AND PACIFIC ECONOMIC UPDATE 2011, VOL. 1
vi CONTENTS

abbreviations
ADB Asian Development BankAPEC Asia Pacific Economic CooperationASEAN Association of Southeast Asian
Nations (Brunei Darussalam, Cambodia, Indonesia, Lao PDR, Malaysia, Myanmar, Philippines, Singapore, Thailand and Vietnam)
BI Bank IndonesiaBLA Bilateral AgreementBIS Bank for International SettlementsBNM Bank Negara MalaysiaBOP Balance of Paymentsbps Basis pointsBRICs Brazil, Russian Federation, India, and
China
CCS carbon capture and storageCDB China Development BankCGE Computable General EquilibriumCEIC Economic databaseCIC China Investment CorporationCPI Consumer Price IndexCRED The Center for Research on the
Epidemiology of Disasters
DHC District Heating and Cooling DRC Development Research CenterDSM Demand –Side ManagementE&E Electronics and electrical (device
sector)
EAP East Asia and the Pacific RegionECA Europe and Central Asia RegionEdStats Education StatisticsEEZ Exclusive Economic Zone (Tuvalu)EFPO Energy Fund Public Organization
(Thailand)
EGs Economic Groups (Vietnam)EMPI Exchange Market Pressure IndexENSO El Nino South OscillationESMAP Energy Sector Management
Assistance Program
FEWS Flood early warning systemFDI Foreign direct investmentFIDF Financial Institutions Development
Fund (Thailand)
FTA Free Trade AgreementG-3 U.S., the Eurozone, and Japan
G-7 U.S., U.K., Germany, France, Italy, Canada, Japan
G-20 Group of twentyGCI Global Competitiveness IndicatorsGDP Gross Domestic ProductGEF Global Environmental FacilityGEP Global Economic ProspectsGW Giga wattHCMC Ho Chi Minh CityHP Filter Hodrick Prescott FilterICT Information and Communication
Technology
IEA International Energy AgencyIMF International Monetary FundIPO Initial Public OfferingIT Information TechnologyKAM Knowledge Assessment
Methodology (World Bank)
KI Knowledge Index by KAMLAC Latin American and the Caribbean
Region
LDR Loan-to-Deposit RatioLICS Low-Income CountriesLNG Liquefied Natural Gas Project (Papua
New Guinea)
LPG Liquid Petroleum GasMCA Millennium Challenge Account
(Vanuatu)
MDGs Millennium Development GoalsMICs Middle-income CountriesMNC Multinational corporationmt Metric tonMW Mega wattNAB New arrangement to borrowNBS National Bureau of StatisticsNGO Non-Governmental OrganizationNIEs Newly Industrialized Economies NPL Non-Performing LoanNSDP National Strategic Development Plan
(Cambodia)
OECD Organization for Economic Co-operation and Development
PPPs Public-Private PartnershipsQDII Qualified Foreign Institutional
Investor (China)
SECURING THE PRESENT, SHAPING THE FUTURE
vii
R&D Research and DevelopmentRE Renewal EnergyRER Real AppreciationRERF Revenue Equalization Reserve Fund
(Kiribati)
SAAR Seasonally Adjusted Annualized RateSAFE State Administration of Foreign
Exchange (China)
SBI Short-Term Money Market Instrument (Indonesia)
SBIs Bank Indonesia CertificatesSED Sustainable Energy DevelopmentSEDLAC Socio-Economic Database for Latin
America and the Caribbean.
SGO Stability and Growth PactSMEs Small and Medium EnterprisesSOEs State-Owned EnterprisesSUSENAS Indonesia Socioeconomic SurveySWFs Sovereign Wealth FundsTFP Total Factor ProductivityTMP Temporary Movement of PersonsTTF Tuvalu Trust FundUN COMTRADE United National Statistics Division –
Commodity Trade Statistics
UNCTAD United Nations Conference on Trade and Development
UNESCO United Nations Education, Scientific and Cultural Organization
UNFPA United Nations Population FundUNISDR United Nations International Strategy
for Disaster Reduction
U.S. United StatesUSLPTO United States Patent and Trademark
Office
VAT Value Added TaxVF Village Fund (Thailand)WB World BankWHL Worldhotel-link.com LimitedWTO World Trade Organization
CountriesCHN ChinaHKG Hong Kong SAR, ChinaIDN IndonesiaKHM CambodiaKOR Republic of KoreaLAO Lao People’s Democratic Republic
(PDR)
MNG MongoliaMYS MalaysiaPHL The PhilippinesPNG Papua New GuineaSGP SingaporeTHA ThailandTMP Timor LesteTWN Taiwan, ChinaVNM Vietnam
WORLD BANK EAST ASIA AND PACIFIC ECONOMIC UPDATE 2011, VOL. 1
viii ABBREVIATIONS

Summary
Real GDP growth in East Asia has been moderating after a sharp rebound from the global crisis. The slowdown in growth since mid-2010, even though smaller than earlier projected, has occurred despite a stronger-than-expected recovery in high-income economies and only gradual withdrawal of the monetary and fiscal stimulus across the region. We project real GDP growth will settle to about 8 percent in 2011 and 2012 from about 9.6 percent in 2010.
Inflation has become the key short-run challenge for the authorities in the region, complicated by a surge in portfolio capital inflows and rapidly increasing food and commodity prices that hit low-income households disproportionately. Price shocks are affecting core inflation that could trigger a wage-price spiral. Central banks across developing East Asia have tightened monetary policy only cautiously because of earlier concerns about the durability of the global expansion, expectations that the surge in food and fuel prices may turn out to be temporary, and worries that higher interest rates may boost interest-sensitive inflows.
For many middle-income countries in East Asia, lowering inflation presents difficult policy choices. Most have eschewed the use of capital controls, and allowing exchange rates to appreciate may protect against importing inflation but jeopardizes international competitiveness. And the independence of monetary policy is partially constrained by open capital accounts. This places the bulk of the adjustment burden on fiscal policy where the challenge lies in lowering deficits more rapidly while creating the fiscal space to finance infrastructure to drive future growth and assuring necessary social investments and cash transfers to the poor.
The sharp increase in commodity prices portends increased volatility for the foreseeable future. All commodity prices are on an upswing, some either at all-time highs or at levels exceeding those reached only two years ago. These latest price developments continue the trend that began earlier this decade of a steady climb in real commodity prices, interrupting a decade-long downward trend in the 1990s. Policies to provide incentives and ensure the investment needed to help develop new and greener energy sources, notably with low-carbon emissions and much improved energy efficiency should be a priority for governments in the region.
Over the medium-term, East Asia has the potential to sustain rapid increases in living standards even as the global economy enters a more challenging phase. Unlike the framework of stable exchange rates and closed capital accounts that characterized the background for the rise of Western Europe, Japan, and the NIEs after World War II, the future will likely be dominated by sharply increased volatility in commodity prices, capital flows, and exchange rates. If history is any guide, periods of sustained monetary expansion in high-income economies tend to be followed by a surge in global inflation, high nominal interest rates, and economic instability. If such a scenario unfolds, as is likely, it will test the resolve of governments in East Asia and circumscribe the policy options available to maintain rapid but steady growth.
China, today the world’s second largest economy and its leading exporter and manufacturer, will remain a powerful source of external demand for East Asian producers in the foreseeable future. The trend toward increasing intra-regional trade, with China a larger final consumer of regional product, is likely to continue. And favorable prospects for China augur well for the global and regional production networks into which countries of the region are increasingly tightly integrated. Rising wages in coastal China are forcing companies located there to either move up the value chain or relocate further inland or to neighboring low-income countries (and occasionally to lower-cost regions in neighboring middle-income countries). And with China deploying its large foreign exchange reserves, capital flows to the region could rise substantially. Tighter regional integration will ensure that these trends further
SECURING THE PRESENT, SHAPING THE FUTURE
1

boost the international competitiveness of Developing East Asia while also providing an engine of growth that is relatively less dependent on the slow-growing high-income countries.
But even as developing East Asia continues to grow rapidly, rising inequality is a matter for concern and could pose a challenge to future social stability. One factor underpinning rising inequality is rapid globalization which raises skill premiums—a phenomenon observed worldwide. Another is rapid urbanization that contributes to high growth rates but at the same time leaves behind lagging regions. Ensuring equal access to education, improving connectivity between leading and lagging regions, and expanding targeted social services are some of the policy responses necessary to ensure inequality does not rise to levels that breed social exclusion and cut growth potential.
As much as one-third of per-capita growth in East Asia over the last half a century was due to the favorable demographic dividend. In the future, however, a rapidly ageing population will slow growth rates in the economies of East Asia unless its effects are offset by faster growth in productivity, larger fixed investment, increased participation in the work force of women, longer work lives, and policy adjustments that encourage productivity and help contain ageing-related fiscal costs.
No country has grown to middle income without industrializing and urbanizing. East Asia’s cities have helped support economic growth, but their full potential as the source of innovation and productivity is yet to be realized. Cities will need to become the true crucibles of innovation by exploiting the proximity of companies and workers, acting as knowledge exchanges, and providing capital for innovative but risky projects.
The risks of climate change and natural disasters complicate East Asia’s quest for continuous rapid growth. On the one hand, the carbon footprint of the region must be contained: this is the essence of the mitigation agenda. On the other, countries need to learn to live with the consequences of a changing climate—the adaptation agenda. And nowhere is the adoption and implementation of an adaptation agenda more important than in East Asia’s urban centers, the concentration of increasingly larger share of output and population. These agglomerations are under the grave threat of extreme weather events, rising sea levels and other natural hazards—some of which, such as earthquakes, are not climate-related. However every natural hazard does not automatically lead to catastrophic loss of life and property. The recent tragic earthquake in Japan with a magnitude 8.9—the most powerful in the country’s recorded history—and the subsequent tsunami are a stark reminder of the dangers from natural hazards and the key role of careful and thorough investments the authorities have made in seismic safety and emergency preparedness. The extent to which countries in the region will be affected economically will vary and depend on factors that will become clearer in the coming weeks.
WORLD BANK EAST ASIA AND PACIFIC ECONOMIC UPDATE 2011, VOL. 1
2 SUMMARY

Part I. Securing the recovery, Lowering infLation
Developing countries in east asia have recovered from the recent global economic crisis faster than from earlier global or regional shocks, including the 1997-98 asian financial crisis and the 2001 u.S. equity market crash. Much of this rebound has been due to the decisive and large fiscal and monetary stimulus measures that were implemented by all countries in the region, especially china. withdrawing the fiscal stimulus and returning monetary policy to normal is now a priority, as doing so will help contain inflationary pressures and limit the extent to which higher prices for food and fuel permanently boost inflation expectations. it will also help protect fiscal space—a crucial asset before the crisis—for use in case of future shocks.
SECURING THE PRESENT, SHAPING THE FUTURE
3

I. recovery fIrmly on track
The region’s recovery is firmly on track, with real GDP, industrial production and exports above pre-crisis levels. But employment in manufacturing—which typically pays higher wages than jobs in other sectors—has lagged, suggesting employers are still cautious about the durability of global growth. Sluggish manufacturing growth, combined with the negative impact of rising food and fuel prices, could slow progress reducing poverty across the region this year.
Growth surprises on the upside
Output growth throughout developing East Asia moderated in the second half of 2010 but was still surprisingly strong. This positive outcome reflected sustained monetary and fiscal stimulus measures and stronger growth in demand abroad, both of which partly offset the return of capacity utilization to pre-crisis levels. Real GDP growth in developing East Asia and Pacific amounted to 9.6 percent for 2010 as a whole (Figure 1and Table 1), 0.7 percentage points higher than our estimate in November 2010 (see our East Asia update from November 2010, Robust Recovery, Rising Risks). Estimates for growth among the G-3 (the U.S., the EU, and Japan) were also revised up by a similar amount, thanks largely to a markedly better outcomes in the eurozone and Japan.
Growth in 2010 was broad-based. Seven countries in developing East Asia grew by 7 percent or more last year, including Thailand and Malaysia, the only middle-income countries in the region whose economies had contracted in 2009. Real GDP grew 7.8 percent in both countries in 2010, driven equally by domestic and external demand and accommodative policies. In the Philippines, a surge in consumer and business optimism in part due to the presidential elections, and stronger and more robust remittance growth were additional factors that underpinned the country’s fastest growth in more than three decades.
The post-crisis rebound in 2010 was faster than the recovery from previous crisis episodes, including after the 1997-98 Asian financial crisis. Much of this rebound reflected the solid macroeconomic foundations that existed before the crisis, plentiful fiscal space, low external and government debt, and the strong balance sheets
figure 1. Real GDP growth moderated…
percent change year-on-year
Developing East Asia excluding China Developing East Asia
Sources: CEIC and World Bank staff calculations.
table 1. …but for the full year 2010 was close to pre-crisis levels and East Asia remains the fastest growing global region
percent change
Source: World Bank Global Economic Prospects 2011.
1981 1986 1991 1996 2001 2006 2011
15
-10
10
5
0
-5
2008 2009 2010e
Developing East Asia 8.5 7.4 9.6
Excluding China 4.7 1.2 6.9
Europe and Central Asia 3.9 -6.6 4.7
Latin America and Caribbean 4.0 -2.2 5.7
Middle East and North Africa 4.2 3.1 3.3
South Asia 4.8 7.0 8.7
Excluding India 3.7 4.3 5.1
Sub-Saharan Africa 5.2 1.7 4.7
High Income Countries 0.2 -3.4 2.8
WORLD BANK EAST ASIA AND PACIFIC ECONOMIC UPDATE 2011, VOL. 1
4
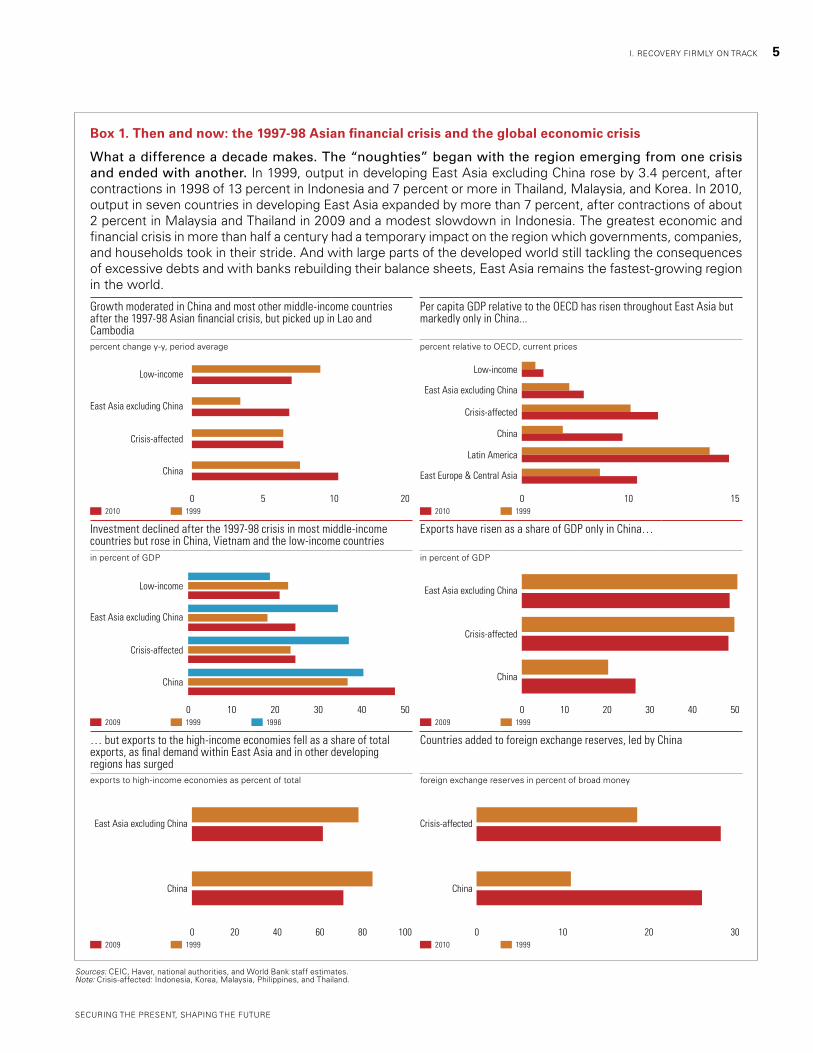
Box 1. Then and now: the 1997-98 Asian financial crisis and the global economic crisis
What a difference a decade makes. The “noughties” began with the region emerging from one crisis and ended with another. In 1999, output in developing East Asia excluding China rose by 3.4 percent, after contractions in 1998 of 13 percent in Indonesia and 7 percent or more in Thailand, Malaysia, and Korea. In 2010, output in seven countries in developing East Asia expanded by more than 7 percent, after contractions of about 2 percent in Malaysia and Thailand in 2009 and a modest slowdown in Indonesia. The greatest economic and financial crisis in more than half a century had a temporary impact on the region which governments, companies, and households took in their stride. And with large parts of the developed world still tackling the consequences of excessive debts and with banks rebuilding their balance sheets, East Asia remains the fastest-growing region in the world.
Sources: CEIC, Haver, national authorities, and World Bank staff estimates. Note: Crisis-affected: Indonesia, Korea, Malaysia, Philippines, and Thailand.
Growth moderated in China and most other middle-income countries after the 1997-98 Asian financial crisis, but picked up in Lao and Cambodiapercent change y-y, period average
2010 1999
China
Crisis-affected
East Asia excluding China
Low-income
5 100 20
Per capita GDP relative to the OECD has risen throughout East Asia but markedly only in China...
percent relative to OECD, current prices
2010 1999
East Europe & Central Asia
Latin America
China
Crisis-affected
East Asia excluding China
Low-income
0 10 15
Investment declined after the 1997-98 crisis in most middle-income countries but rose in China, Vietnam and the low-income countriesin percent of GDP
2009 1999 1996
China
Crisis-affected
East Asia excluding China
Low-income
0 302010 40 50
Exports have risen as a share of GDP only in China…
in percent of GDP
2009 19990 302010 5040
East Asia excluding China
Crisis-affected
China
… but exports to the high-income economies fell as a share of total exports, as final demand within East Asia and in other developing regions has surgedexports to high-income economies as percent of total
2009 19990 604020 10080
East Asia excluding China
China
Countries added to foreign exchange reserves, led by China
foreign exchange reserves in percent of broad money
2010 1999
China
0 10 3020
Crisis-affected
SECURING THE PRESENT, SHAPING THE FUTURE
I. RECOVERY FIRMLY ON TRACK 5

of companies and commercial banks. An increasingly diversified global customer base also helped (Box 1). The emergence of China as a major source of final demand in the region and globally has been equally crucial, a topic to which we will return in Chapter IV.
Thanks to continued strong growth, China became the second largest economy in the world measured at market exchange rates.1 Despite efforts by the authorities to cool the pace of expansion, growth has remained firm since mid-2010 and amounted to 10.3 percent for the year as a whole, up from 9 percent in 2009. Net exports made a small positive contribution to growth according to official estimates in contrast with the substantially negative contribution of 4 percent in 2009. In the near term, China’s rapid expansion and its rising inflation rate presents a growing risk for the region, given the moderate expansion in activity in high-income economies and the much increased final demand in China for goods produced in the region. Over the medium term, however, China will continue to present a unique opportunity that the countries in the region must seize, a topic to which we will return in later sections (Box 2).
1 In purchasing power parity (PPP) that adjusts for the different purchasing power of the dollar across countries, China became the world’s second largest economy in 2002.
Box 2. The rise of China
The most populous country in the world and the richest country until the early 19th century is now:
The world’s second largest economy• after the U.S. at market exchange rates since 2010. In per capita terms, China’s GDP is just one-tenth that of Japan. Adjusting for purchasing power parity, China’s GDP per capita is one-fifth that of Japan and 14 percent of the level in the U.S..The largest exporter• after overtaking Germany in 2009.The largest manufacturer • followed by the U.S. in value added measured in current prices.The world’s largest steel producer since 2009• , producing about 10 million tons more than each of the OECD countries combined and the rest of the world.The largest consumer of refined metals • (41 percent of the world), more than the OECD combined. The largest global energy user • after surpassing the U.S. in 2010. Ten years ago, China’s energy consumption was half that of the U.S. Per capita energy consumption in China is just one-fourth of that in the U.S., but U.S. oil consumption is double that of China.The country with the largest installed wind energy capacity.•The second largest recipient of FDI after the U.S. • with about $100 billion in 2010.Sovereign risk rated on par with Japan• after Standard and Poors downgraded Japan to BB- on January 27, 2011.
Rapid expansion also returned to Cambodia and Mongolia, whose economies contracted in 2009. In Cambodia, the recovery in garment exports and in tourist arrivals contributed to an estimated real growth rate of about 6.7 percent in 2010 after the first contraction in almost three decades. In Mongolia, resurgent foreign investment in the extractive industries supported by thus far prudent fiscal policy and renewed progress on structural reforms, led to an estimated 6 percent expansion despite severe weather-related losses in the livestock sector.
More generally, the rebound among the region’s resource-rich economies reflected the rapid increase in global demand for commodities. This strong demand is transforming the economies of Lao, Mongolia, PNG, Timor-Leste, and the commodity-producing regions in Indonesia, Malaysia, and Vietnam. For most of these countries, resource riches have helped boost living standards this decade. But whether this abundance will ultimately elevate
WORLD BANK EAST ASIA AND PACIFIC ECONOMIC UPDATE 2011, VOL. 1
6 I. RECOVERY FIRMLY ON TRACK

countries to high-income status is yet to be seen in the region. Prudent fiscal management of windfalls and incentives that create genuine alternative industries and sources of income will ultimately be crucial for ensuring that commodity riches do not become a curse.
Last year’s growth outcome in developing East Asia was surprisingly positive, but the outcome in 2011 is likely to be more subdued. Throughout East Asia, the rise in inflation at varying speeds and the volatility of commodity prices, exchange rates, and capital inflows will likely require more determined policy actions this year, including more monetary tightening than most projections call for. In the high-income countries, the recovery is firming up but is more likely than not to continue at a sluggish pace, albeit a bit faster than was expected earlier due to the new fiscal stimulus package in the U.S. and Japan.
However, several key risks remain in the high-income economies, including those resulting from persistent banking and sovereign stress in the peripheral eurozone and still unresolved issues with residential real estate in the U.S.. Developments in the Middle East of late have contributed to substantially higher oil prices and still have the potential of further disruption on commodity price volatility than is currently appreciated. And given the links between energy and food prices, these developments in the Middle East could have implications that extend well beyond energy.
We project growth in China to slow to about 9 percent this year from 10.3 percent in 2010 and about 11 percent on average during 2000–2007 as measures to cool the property market and contain inflation, combined with efforts to rebalance the pattern of investment and growth, take firmer hold. In the rest of developing East Asia, real GDP growth is likely to amount to about 5.3 percent, little changed from the pace during 2000-2007 but down from 7 percent in 2010 and 7.5 percent in the decade before the 1997–98 Asian financial crisis. Returning to a more buoyant growth path in the middle-income countries other than China remains a key priority for governments, one that they must achieve to enable a transition to high-income status in the foreseeable future, rather than stagnation in their current middle-income status.
Industrial employment and wages are picking up
Industrial employment has begun to pick up in most middle-income countries in the region, albeit unevenly and at a slower pace than output. Since many manufacturers in Malaysia and Thailand are part of regional or global production networks that are dependent on demand from the high-income economies, hiring has been tepid and has yet to reach pre-crisis levels (Figure 2). In contrast, industrial employment in Indonesia and Philippines has recovered, driven by domestic demand (and by remittances in the latter country). The uptick in industrial employment together with increased hiring in services has helped to reduce open unemployment rates across the region (Figure 3).
table 2. Growth in 2010 was broad-basedpercent change year-on-year
Sources: CEIC and World Bank staff projections.
Estimate Forecast
2009 2010 2011 2012
Developing East Asia 7.4 9.6 8.2 7.9
China 9.2 10.3 9.0 8.5
Indonesia 4.6 6.1 6.4 6.7
Malaysia -1.7 7.2 4.8 5.7
Philippines 1.1 7.3 5.0 5.4
Thailand -2.3 7.8 3.7 4.2
Vietnam 5.3 6.8 6.3 6.7
Cambodia -2.0 6.7 6.5 6.5
Fiji -3.0 0.1 1.3 0.7
Lao PDR 7.5 8.4 8.6 7.6
Mongolia -1.3 6.1 10.3 7.6
Papua New Guinea 5.5 7.5 5.5 5.5
Developing East Asia excl China 1.2 6.9 5.3 5.7
Memoranda
High-income countries -3.4 2.8 2.4 2.7
SECURING THE PRESENT, SHAPING THE FUTURE
I. RECOVERY FIRMLY ON TRACK 7

Real wages in industry have followed the same trend as real growth. The pace of increase has been the fastest in China, because of strong demand for labor and robust growth in productivity (Figure 4).
Progress in reducing poverty is complicated by higher food and fuel prices
The pace of poverty reduction in East Asia picked up in 2010 due to better-than-expected growth in many countries. Nearly 51 million people were lifted out of poverty in developing East Asia and Pacific during 2010, reducing the poverty headcount to 27 percent of the region’s population from 30 percent in 2009. The pace of poverty reduction almost doubled from 2008–09, although it was still slower than during 2000–07. The marked progress reducing poverty notwithstanding, the region remains home to about 500 million poor people (those living on less than $2 per day), with the majority living in China and East Asia’s other large middle-income countries
The effects of higher global food and fuel prices continue to be significantly modified by domestic policies and these have a bearing on both the prevalence and severity of poverty. Both Indonesia and the Philippines
figure 2. Industrial employment in Indonesia and Philippines reached pre-crisis levelsindex, 2007=100
2010 2009 2008
Sources: CEIC and World Bank.
115
110
85
105
100
95
90
Indonesia Malaysia Philippines Thailand
figure 3. Unemployment has declined across the middle-income countriesin percent of the labor force
Q1–3 2009 Q1–3 2010
Sources: CEIC and World Bank.
9
8
7
0
6
5
4
3
2
1
Indonesia Malaysia Philippines Thailand
figure 4. Real wages have risen in most countries other than Indonesiaindex, Q1-2007=100
China Indonesia Thailand
Sources: CEIC and World Bank.
140
130
85
120
110
100
90
Q1-07 Q3-07 Q1-08 Q3-08 Q1-09 Q3-09 Q1-10 Q3-10
figure 5. Poverty reduction has been impressive, but about 500 million people in East Asia still live on less than $2/daypopulation in millions
Source: World Bank staff calculations.
China 300.2
Pacific 3.8
IDAs 13.4Malaysia
PhilippinesIndonesia
1.8
37.9110.8
ThailandVietnam
5.333.8
MiddleIncome
Countries
WORLD BANK EAST ASIA AND PACIFIC ECONOMIC UPDATE 2011, VOL. 1
8 I. RECOVERY FIRMLY ON TRACK
strictly control imports of rice and support domestic prices in order to promote domestic production. As a result, in both countries, rice prices are significantly higher than international prices and result in subsidizing net sellers at the expense of net buyers who are often the poorest. Although rice prices remained stable in the Philippines, domestic wholesale prices were more than 50 percent higher than global prices. In Indonesia, the gap between domestic and international prices increased further in 2010. And although many smallholders in Lao PDR and Cambodia produce rice in self-sufficient quantities, they frequently sell at harvest time (when prices are lower) because of lack of storage facilities or pressing needs, and buy rice later in the season when prices are higher. Though countries such as Philippines and Indonesia have cash or food subsidy programs for the needy, they are not necessarily targeted to the poorest. In the Philippines, for example, it is estimated that only a third of the total subsidized rice goes to the poorest quintile and as much as 41 percent of that leaks to non-poor households. Fuel subsidy programs are often characterized by similar if not higher leakage rates.
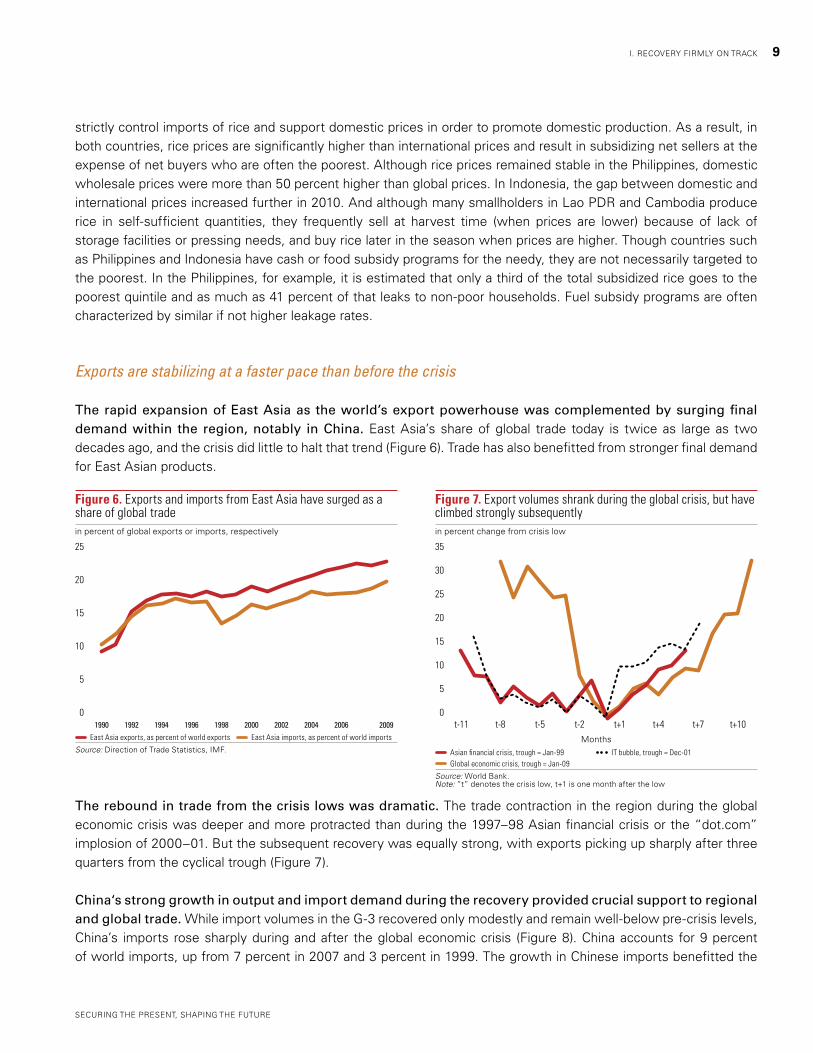
Exports are stabilizing at a faster pace than before the crisis
The rapid expansion of East Asia as the world’s export powerhouse was complemented by surging final demand within the region, notably in China. East Asia’s share of global trade today is twice as large as two decades ago, and the crisis did little to halt that trend (Figure 6). Trade has also benefitted from stronger final demand for East Asian products.
The rebound in trade from the crisis lows was dramatic. The trade contraction in the region during the global economic crisis was deeper and more protracted than during the 1997–98 Asian financial crisis or the “dot.com” implosion of 2000–01. But the subsequent recovery was equally strong, with exports picking up sharply after three quarters from the cyclical trough (Figure 7).
China‘s strong growth in output and import demand during the recovery provided crucial support to regional and global trade. While import volumes in the G-3 recovered only modestly and remain well-below pre-crisis levels, China’s imports rose sharply during and after the global economic crisis (Figure 8). China accounts for 9 percent of world imports, up from 7 percent in 2007 and 3 percent in 1999. The growth in Chinese imports benefitted the
figure 6. Exports and imports from East Asia have surged as a share of global tradein percent of global exports or imports, respectively
East Asia exports, as percent of world exports East Asia imports, as percent of world imports
Source: Direction of Trade Statistics, IMF.
25
0
20
15
10
5
1990 1992 1994 1996 1998 2000 2002 2004 2006 2009
figure 7. Export volumes shrank during the global crisis, but have climbed strongly subsequentlyin percent change from crisis low
MonthsAsian financial crisis, trough = Jan-99 IT bubble, trough = Dec-01Global economic crisis, trough = Jan-09
Source: World Bank.Note: “t” denotes the crisis low, t+1 is one month after the low
35
30
0
25
20
15
10
5
t-11 t-8 t-5 t-2 t+1 t+4 t+7 t+10
SECURING THE PRESENT, SHAPING THE FUTURE
I. RECOVERY FIRMLY ON TRACK 9

region significantly. Exports from the rest of developing East Asia to China grew faster than their exports to the rest of the world. Compared to 2007, exports to China now comprise a larger share of total exports in every economy in developing East Asia and the NIEs (Figure 9). But the story is not restricted to China. Import demand in the region excluding China also grew faster during the crisis than import demand in the G-3.
Final demand appears to have given a stronger lift to Chinese imports from the region than demand via international production networks. China’s imports from emerging East Asia grew much faster than China’s own exports to the high-income economies (Figure 10). Specifically, China’s imports for processing trade grew much more slowly than “ordinary trade” imports (Figure 11). And, imports by foreign-invested enterprises in China—the workhorses of the global networks—also rose more slowly than imports by state and other local enterprises.
The impact of this buoyancy in Chinese imports on the region’s economies was not uniform. Starting in mid-2010, the region’s commodity exporters benefitted from increased demand for industrial raw materials and from higher international prices. In the Philippines (where electrical and electronic exports account for two-thirds of total
figure 8. China’s imports surged during the recovery…
index, Jan 2009 = 100
China United States European Union JapanEast Asia excluding China
Source: World Bank.
250
200
0
150
100
50
Jan-09 May-09 Sep-09 Jan-10 May-10 Sep-10
figure 9. …providing a strong impetus to regional trade
exports to China in percent of total country exports
2010 2007
Source: CEIC.
0 20 40 60 80 100
CambodiaVietnam
PhilippinesIndonesiaSingapore
ThailandMalaysia
KoreaLao PDR
Taiwan, ChinaHong Kong SAR, China
Mongolia
figure 10. China’s imports from East Asia are larger than its exports to the United Statesin billions of U.S. dollars
Imports from Emerging East Asia Exports to the United States
Source: CEIC.
figure 11. Imports related to processing trade networks are laggingindex of three-month moving average U.S. dollar values, Jan-09 = 100
Imports - Ordinary trade Imports - Processing with imported materials
Source: CEIC.
Jan-09 Apr-09 Jul-09 Oct-09 Jan-10 Apr-10 Jul-10 Oct-10
45
40
35
30
0
25
20
15
10
5
Jan-09 May-09 Sep-09 Jan-10 May-10 Sep-10
215
175
195
75
135
155
115
95
WORLD BANK EAST ASIA AND PACIFIC ECONOMIC UPDATE 2011, VOL. 1
10 I. RECOVERY FIRMLY ON TRACK

exports and 90 percent of the country’s shipments to China) the contraction in the global electronics trade has meant that it did not benefit as much from the strength of Chinese imports as either Malaysia or Thailand.
Capital flows surge, volatility increases
After shrinking sharply in 2008, net capital inflows into developing East Asia surged to a record in 2010. Inflows were highly concentrated in China, Indonesia, Malaysia and Thailand (Figure 12 and Figure 13). Globally, nine countries received 95 percent of the portfolio equity, 50 percent of the portfolio debt and 74 percent of the short-term debt flows to all developing countries. East Asia’s experience with capital flows during and after the global economic crisis contrasts with the period after the 1997–98 Asian financial crisis when the crash was more severe (although concentrated in three countries: Indonesia, Thailand and Korea) and the revival slower.
Portfolio flows into the region’s equities and bonds have been particularly volatile recently. In Indonesia, foreign investors purchased $2.2 billion worth of equities and $9.6 billion of government bonds in 2010, but sold $0.7 billion of the former and almost a $1 billion of the latter in January 2011 alone (Figure 14). In the Philippines, the range in net monthly foreign purchases of securities widened considerably. Both the largest monthly purchase and sale have more than doubled from a year earlier in 2010 (Figure 15). The pattern of larger and more volatile flows is also evident in Korea where purchases of government bonds by non-residents fell from $53 billion in April 2008 to $28 billion in January 2009 before rebounding to $65 billion at present
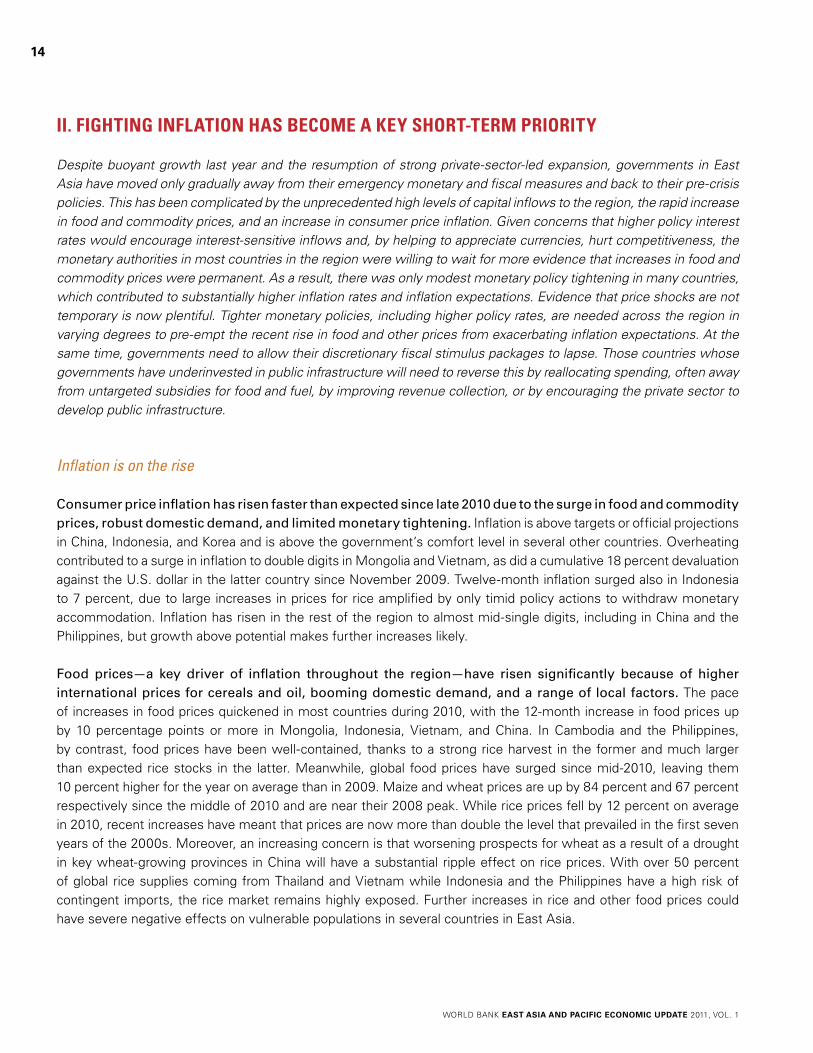
Portfolio inflows have buoyed the region’s asset markets, but increased recent volatility is a useful reminder how quickly such inflows can reverse. As a result of large non-resident purchases of East Asian equities through most of 2010, the regional stock market index has outperformed the global index by 1.5 times and is currently at a level twice as high as its lowest point during the global financial crisis (Figure 16). Stock market capitalization for emerging East Asia also doubled to 110 percent of GDP in 2010 from 2003. As corporate fundamentals improved and as corporate and government issuers have taken advantage of the historically low yields to ramp up bond debt issuance, East Asia’s bond markets have responded with a bond return index that is now three times higher than its level at the beginning of 2000 and a regional return index that is one and half times the global index (Figure 17).
figure 12. Net capital flows into developing East Asia surged to a record…in billions of U.S. dollars
Net FDI Net Portfolio Inv. Net Other Inv. Net Capital Flows
Source: Haver Analytics.Note: Net capital flows is the difference between foreign investment in a country and resident investment abroad.
figure 13. …but are highly concentrated in a few countries, notably Chinain billions of U.S. dollars
China Indonesia Malaysia Philippines Thailand
Source: Haver Analytics.Note: Net capital flows is the difference between foreign investment in a country and resident investment abroad.
1995 20101998 2001 2004 2007
250
200
150
-150
50
100
0
-50
-100
1995 20101998 2001 2004 2007
250
200
150
-100
50
100
0
-50
SECURING THE PRESENT, SHAPING THE FUTURE
I. RECOVERY FIRMLY ON TRACK 11
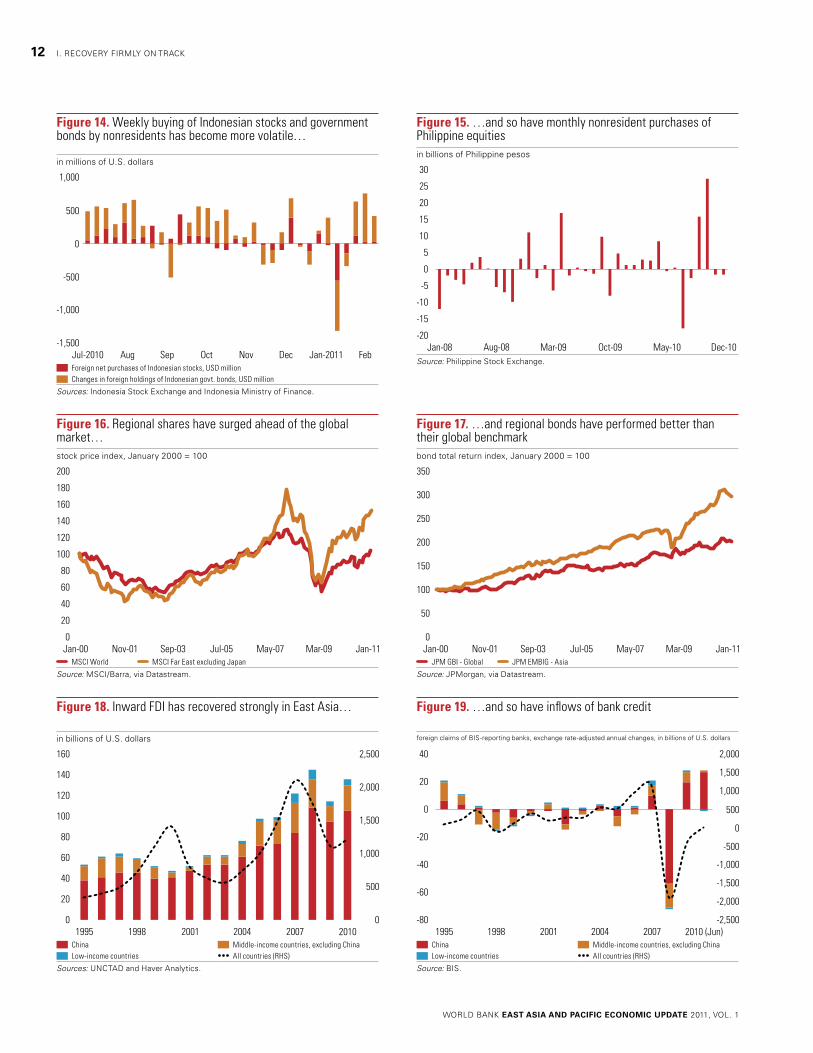
figure 19. …and so have inflows of bank credit
foreign claims of BIS-reporting banks, exchange rate-adjusted annual changes, in billions of U.S. dollars
China Middle-income countries, excluding ChinaLow-income countries All countries (RHS)
Source: BIS.
figure 14. Weekly buying of Indonesian stocks and government bonds by nonresidents has become more volatile…
in millions of U.S. dollars
Foreign net purchases of Indonesian stocks, USD millionChanges in foreign holdings of Indonesian govt. bonds, USD million
Sources: Indonesia Stock Exchange and Indonesia Ministry of Finance.
figure 15. …and so have monthly nonresident purchases of Philippine equitiesin billions of Philippine pesos
Source: Philippine Stock Exchange.
1,000
500
-1,500
0
-500
-1,000
Jul-2010 FebAug Sep Oct Nov Dec Jan-2011
302520
-20-15
50
1510
-5-10
Jan-08 Dec-10May-10Oct-09Mar-09Aug-08
figure 16. Regional shares have surged ahead of the global market…stock price index, January 2000 = 100
MSCI World MSCI Far East excluding Japan
Source: MSCI/Barra, via Datastream.
figure 17. …and regional bonds have performed better than their global benchmarkbond total return index, January 2000 = 100
JPM GBI - Global JPM EMBIG - Asia
Source: JPMorgan, via Datastream.
200180160
020
10080
140120
6040
Jan-00 Nov-01 Sep-03 Jul-05 May-07 Mar-09 Jan-11
350
300
250
0
100
50
200
150
Jan-00 Nov-01 Sep-03 Jul-05 May-07 Mar-09 Jan-11
figure 18. Inward FDI has recovered strongly in East Asia…
in billions of U.S. dollars
China Middle-income countries, excluding ChinaLow-income countries All countries (RHS)
Sources: UNCTAD and Haver Analytics.
160
140
120
0
60
40
20
100
80
1995 20101998 2001 2004 2007
2,500
2,000
1,500
1,000
500
0
40
20
0
-80
-60
-20
-40
1995 2010 (Jun)1998 2001 2004 2007
2,000
1,500
1,000
500
-2,500
0
-500
-1,000
-1,500
-2,000
WORLD BANK EAST ASIA AND PACIFIC ECONOMIC UPDATE 2011, VOL. 1
12 I. RECOVERY FIRMLY ON TRACK

Recent equity market highs for the region on average are still below pre-crisis peaks, underscoring the high volatility of equity prices and capital inflows. The equity market has almost tripled since March 2009 though it is still below the peak reached in late 2007. In four years, the regional equity index fell 72 percent before rebounding by 220 percent, a degree of exceptional volatility driven in large part by capital inflows.
Inflows of foreign direct investment and bank flows have also recovered. FDI inflows to East Asia held up well during the crisis, declining in 2009 only to 2007 levels before recovering in 2010 (Figure 18). Cross-border credits from foreign banks have also returned, in particular to China and the middle-income countries (Figure 19). Foreign banks, which pulled back from the region at the onset of the global financial crisis and are still retrenching globally, have steadily rebuilt their assets in the region.
Outward investment by East Asian residents has also strengthened substantially. China, Malaysia, and Thailand have become significant sources of FDI in foreign markets. China ranked fifth among the world’s top FDI investors in 2008, with FDI outflows of $44 billion in 2009 and $20 billion in the first half of 2010 (compared with $75 billion by Japan, which ranks third globally). Malaysia and Thailand each invested $4 billion a year abroad. As a result of sustained outward flows, net capital inflows into emerging East Asia were less than half of gross inflows at about 2 percent of regional GDP in 2009.
Net capital inflows are still dwarfed by current account surpluses across East Asia. The current account surplus accounts for the bulk of foreign currency liquidity into China (Figure 20). In the region’s other middle-income countries, capital account deficits (including errors and omissions flows) in 2005-09 turned into a surplus in 2010 (Figure 21).
figure 20. Capital inflows are an increasingly important source of exchange rate pressure in China…in billions of U.S. dollars
Current account Capital and financial account, including errors and omissions
Sources: IMF and Haver Analytics.
figure 21. …and in the other middle-income countries of the regionin billions of U.S. dollars
Current account Capital and financial account, including errors and omissions
Sources: IMF and Haver Analytics.
600
500
400
300
-100
0
200
100
1995 20101998 2001 2004 2007
100
80
60
40
-40
-20
20
0
1995 20101998 2001 2004 2007
SECURING THE PRESENT, SHAPING THE FUTURE
I. RECOVERY FIRMLY ON TRACK 13
II. fIghtIng InflatIon haS become a key Short-term PrIorIty
Despite buoyant growth last year and the resumption of strong private-sector-led expansion, governments in East Asia have moved only gradually away from their emergency monetary and fiscal measures and back to their pre-crisis policies. This has been complicated by the unprecedented high levels of capital inflows to the region, the rapid increase in food and commodity prices, and an increase in consumer price inflation. Given concerns that higher policy interest rates would encourage interest-sensitive inflows and, by helping to appreciate currencies, hurt competitiveness, the monetary authorities in most countries in the region were willing to wait for more evidence that increases in food and commodity prices were permanent. As a result, there was only modest monetary policy tightening in many countries, which contributed to substantially higher inflation rates and inflation expectations. Evidence that price shocks are not temporary is now plentiful. Tighter monetary policies, including higher policy rates, are needed across the region in varying degrees to pre-empt the recent rise in food and other prices from exacerbating inflation expectations. At the same time, governments need to allow their discretionary fiscal stimulus packages to lapse. Those countries whose governments have underinvested in public infrastructure will need to reverse this by reallocating spending, often away from untargeted subsidies for food and fuel, by improving revenue collection, or by encouraging the private sector to develop public infrastructure.
Inflation is on the rise
Consumer price inflation has risen faster than expected since late 2010 due to the surge in food and commodity prices, robust domestic demand, and limited monetary tightening. Inflation is above targets or official projections in China, Indonesia, and Korea and is above the government’s comfort level in several other countries. Overheating contributed to a surge in inflation to double digits in Mongolia and Vietnam, as did a cumulative 18 percent devaluation against the U.S. dollar in the latter country since November 2009. Twelve-month inflation surged also in Indonesia to 7 percent, due to large increases in prices for rice amplified by only timid policy actions to withdraw monetary accommodation. Inflation has risen in the rest of the region to almost mid-single digits, including in China and the Philippines, but growth above potential makes further increases likely.
Food prices—a key driver of inflation throughout the region—have risen significantly because of higher international prices for cereals and oil, booming domestic demand, and a range of local factors. The pace of increases in food prices quickened in most countries during 2010, with the 12-month increase in food prices up by 10 percentage points or more in Mongolia, Indonesia, Vietnam, and China. In Cambodia and the Philippines, by contrast, food prices have been well-contained, thanks to a strong rice harvest in the former and much larger than expected rice stocks in the latter. Meanwhile, global food prices have surged since mid-2010, leaving them 10 percent higher for the year on average than in 2009. Maize and wheat prices are up by 84 percent and 67 percent respectively since the middle of 2010 and are near their 2008 peak. While rice prices fell by 12 percent on average in 2010, recent increases have meant that prices are now more than double the level that prevailed in the first seven years of the 2000s. Moreover, an increasing concern is that worsening prospects for wheat as a result of a drought in key wheat-growing provinces in China will have a substantial ripple effect on rice prices. With over 50 percent of global rice supplies coming from Thailand and Vietnam while Indonesia and the Philippines have a high risk of contingent imports, the rice market remains highly exposed. Further increases in rice and other food prices could have severe negative effects on vulnerable populations in several countries in East Asia.
WORLD BANK EAST ASIA AND PACIFIC ECONOMIC UPDATE 2011, VOL. 1
14

The country-specific factors that have been driving food prices have varied. In Mongolia, the 15 percent surge in food prices in December from a year earlier was largely due to the increase in meat prices after last year’s devastating dzud (extreme winter weather) and an outbreak of foot and mouth disease. In Indonesia, ongoing weather problems caused local rice prices to increase by about 30 percent during 2010. In China, grain prices have risen strongly. But, vegetable prices were the main driver of food inflation in 2010 due to bad weather and supply bottlenecks before giving way to faster increases in meat and other food prices so far in 2011. And in Vietnam, the devaluation of the currency has increased the price of imported food (in other words, wheat, animal products, and sugar) and animal feed, as the increased prices for Vietnam’s rice (up by about 7 percent during 2010), coffee (prices more than doubled during last year), and shrimp exports have also filtered through to the domestic market. Twelve-month food inflation amounted to 16 percent in December, up from 6.6 percent a year earlier.
In contrast, rice prices in Cambodia remained largely unchanged during 2010 because of high paddy production. The Pacific Islands—especially those that rely heavily on food imports—are most at risk. Since movements in global food prices affect Pacific retail prices with a three to six month lag, local prices have yet to move in any meaningful way. Kiribati, Samoa, Tonga, and Tuvalu were hardest hit by the 2008 food crisis and remain relatively more vulnerable
figure 22. Inflation is trending up…
percent change y-y; dotted line plots median inflation
Vietnam Thailand Median
Sources: National sources, CEIC and Bank staff calculations.
figure 23. …with food inflation leading and core inflation picking up since late 2010 …percent change year-on-year
CPI Core Food
Sources: National sources, CEIC and Bank staff calculations.
30
25
20
15
10
-10
-5
5
0
12/06 3/07 6/07 9/07 12/07 3/08 6/08 9/08 12/08 3/09 6/09 9/09 12/09 3/10 6/10 9/10 12/10
25
20
15
-5
0
10
5
Jan-07 Oct-07 Jul-08 Apr-09 Jan-10 Oct-10
figure 24. …but with substantial variation across countries
change in 12-month inflation between December 2010 and December 2009
Change food inflation Change headline inflation
Source: CEIC.
-5 0 5 10 15 20 25
Cambodia
Vietnam
Philippines
Indonesia
Thailand
Malaysia
China
Mongolia
figure 25. International prices for cereals have surged
international prices, in dollars per ton
Rice Wheat Maize
Sources: National sources, CEIC and Bank staff calculations.
350
300
250
200
0
50
150
100
Jan-07 Jul-07 Jul-08 Jan-09 Jan-10 Jan-11Jan-08 Jul-09 Jul-10
SECURING THE PRESENT, SHAPING THE FUTURE
II. FIGHTING INFLATION HAS BECOME A KEY SHORT-TERM PRIORITY 15
today. Within the Pacific region, Fiji, Samoa, and Kiribati are most sensitive to rising wheat prices as wheat is a more important component of the diet in these countries than the rest of the Pacific.
The surge in international fuel prices has not fully translated into increases in domestic prices because of various price controls across the region. Several countries, including Indonesia, Malaysia, and Vietnam, subsidize domestic fuel prices. The government in Indonesia is considering whether to extend subsidies that are currently scheduled to be lifted by May 2011. While such measures temporarily relieve the pressure that higher international prices put on the poor, they ultimately create a persistent and much larger fiscal burden because these measures are poorly targeted and misused. Reducing and eliminating these subsidies, for example, by replacing them with a much smaller and targeted scheme of support, will be both less expensive and fairer.
These short-term developments and considerations need not distract from tackling the longer term challenges of ensuring food security. Box 3 discusses this issue.
Monetary policy is tightened
Central banks have tightened their monetary policies gradually and at different speeds across the region, but in most countries the pace needs to accelerate. Thus far, central banks have proceeded gradually due to concerns that higher interest rates may stymie growth in credit and output while the outlook for the high-income economies is still fragile. Strong exchange rate appreciation during 2010 also helped to limit inflation pressures, albeit by hampering competitiveness. And with food and commodity prices having been well-contained through mid-2010 and overall inflation having been subdued in some countries, many policymakers considered this gradual approach to be appropriate. This meant that output gaps were closing faster than had earlier been predicted and inflation rose more quickly, leaving policy interest rates below current and projected inflation in the majority of countries.
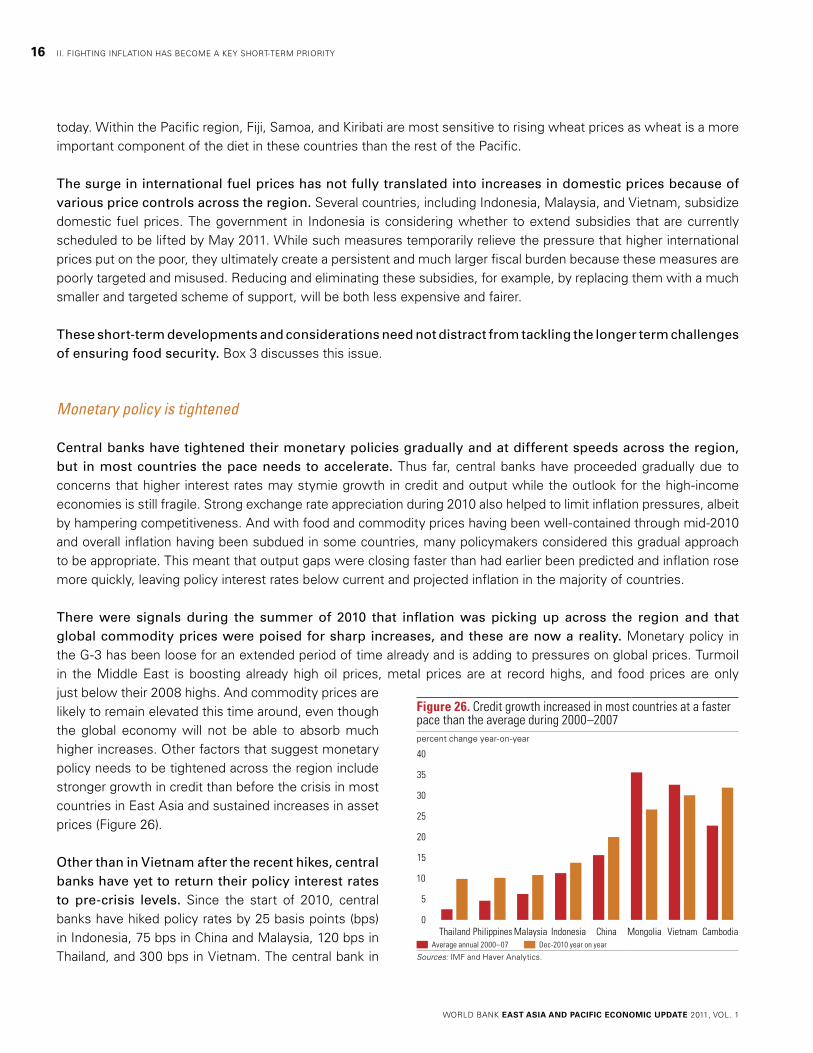
There were signals during the summer of 2010 that inflation was picking up across the region and that global commodity prices were poised for sharp increases, and these are now a reality. Monetary policy in the G-3 has been loose for an extended period of time already and is adding to pressures on global prices. Turmoil in the Middle East is boosting already high oil prices, metal prices are at record highs, and food prices are only just below their 2008 highs. And commodity prices are likely to remain elevated this time around, even though the global economy will not be able to absorb much higher increases. Other factors that suggest monetary policy needs to be tightened across the region include stronger growth in credit than before the crisis in most countries in East Asia and sustained increases in asset prices (Figure 26).
Other than in Vietnam after the recent hikes, central banks have yet to return their policy interest rates to pre-crisis levels. Since the start of 2010, central banks have hiked policy rates by 25 basis points (bps) in Indonesia, 75 bps in China and Malaysia, 120 bps in Thailand, and 300 bps in Vietnam. The central bank in
figure 26. Credit growth increased in most countries at a faster pace than the average during 2000–2007percent change year-on-year
Average annual 2000–07 Dec-2010 year on year
Sources: IMF and Haver Analytics.
40
35
30
25
20
0
5
15
10
IndonesiaMalaysiaPhilippinesThailand China Mongolia Vietnam Cambodia
WORLD BANK EAST ASIA AND PACIFIC ECONOMIC UPDATE 2011, VOL. 1
16 II. FIGHTING INFLATION HAS BECOME A KEY SHORT-TERM PRIORITY
Box 3. The rising challenge of food security
International food prices are higher and more volatile. Volatility of international grain price was twice as high during 2005–2010 as during 1990–2005. Swings in prices affect producers, especially smallholders, for whom the debt burden rises when prices go down. Consumers, especially the poor, see their safety nets eroded during price peaks and find it increasingly difficult to prepare for future swings because of limited incomes and saving instruments. And even temporary shortages of food, especially of critical nutrients, can lead to permanent damages for children and young adults.
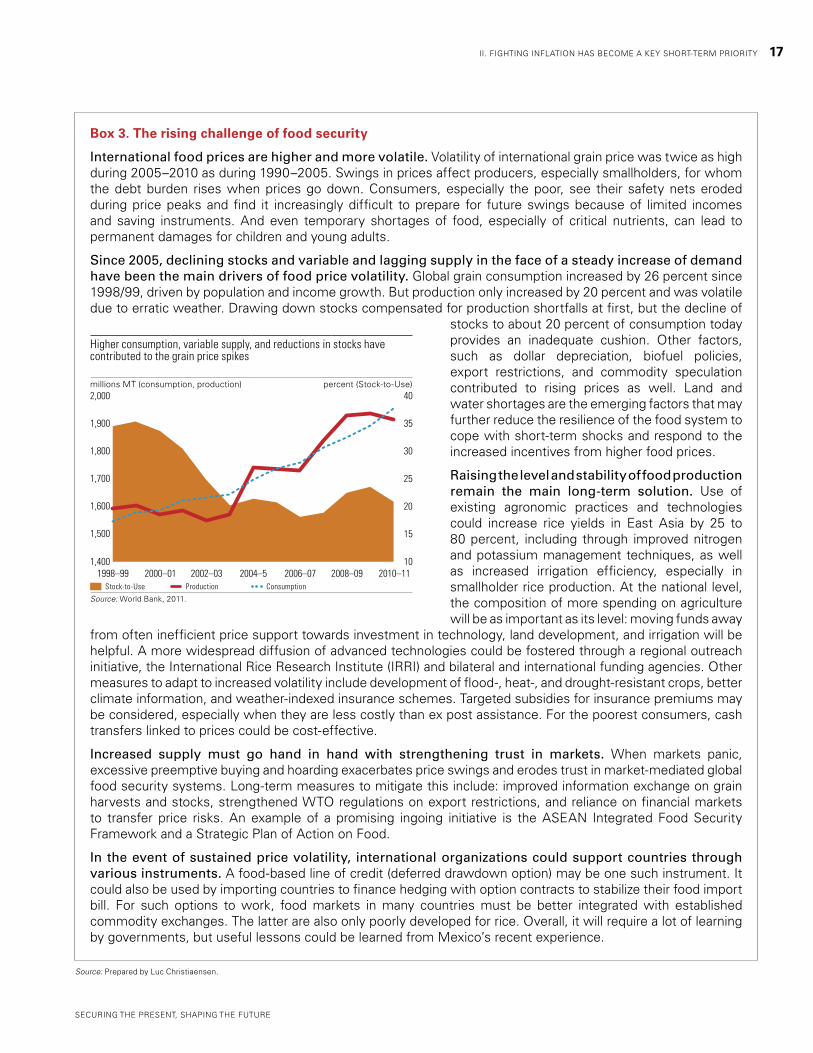
Since 2005, declining stocks and variable and lagging supply in the face of a steady increase of demand have been the main drivers of food price volatility. Global grain consumption increased by 26 percent since 1998/99, driven by population and income growth. But production only increased by 20 percent and was volatile due to erratic weather. Drawing down stocks compensated for production shortfalls at first, but the decline of
stocks to about 20 percent of consumption today provides an inadequate cushion. Other factors, such as dollar depreciation, biofuel policies, export restrictions, and commodity speculation contributed to rising prices as well. Land and water shortages are the emerging factors that may further reduce the resilience of the food system to cope with short-term shocks and respond to the increased incentives from higher food prices.
Raising the level and stability of food production remain the main long-term solution. Use of existing agronomic practices and technologies could increase rice yields in East Asia by 25 to 80 percent, including through improved nitrogen and potassium management techniques, as well as increased irrigation efficiency, especially in smallholder rice production. At the national level, the composition of more spending on agriculture will be as important as its level: moving funds away
from often inefficient price support towards investment in technology, land development, and irrigation will be helpful. A more widespread diffusion of advanced technologies could be fostered through a regional outreach initiative, the International Rice Research Institute (IRRI) and bilateral and international funding agencies. Other measures to adapt to increased volatility include development of flood-, heat-, and drought-resistant crops, better climate information, and weather-indexed insurance schemes. Targeted subsidies for insurance premiums may be considered, especially when they are less costly than ex post assistance. For the poorest consumers, cash transfers linked to prices could be cost-effective.
Increased supply must go hand in hand with strengthening trust in markets. When markets panic, excessive preemptive buying and hoarding exacerbates price swings and erodes trust in market-mediated global food security systems. Long-term measures to mitigate this include: improved information exchange on grain harvests and stocks, strengthened WTO regulations on export restrictions, and reliance on financial markets to transfer price risks. An example of a promising ingoing initiative is the ASEAN Integrated Food Security Framework and a Strategic Plan of Action on Food.
In the event of sustained price volatility, international organizations could support countries through various instruments. A food-based line of credit (deferred drawdown option) may be one such instrument. It could also be used by importing countries to finance hedging with option contracts to stabilize their food import bill. For such options to work, food markets in many countries must be better integrated with established commodity exchanges. The latter are also only poorly developed for rice. Overall, it will require a lot of learning by governments, but useful lessons could be learned from Mexico’s recent experience.
Source: Prepared by Luc Christiaensen.
Higher consumption, variable supply, and reductions in stocks have contributed to the grain price spikes
millions MT (consumption, production) percent (Stock-to-Use)
Stock-to-Use Production Consumption
Source: World Bank, 2011.
2,000
1,900
1,800
1,700
1,400
1,600
1,500
40
35
30
10
15
25
20
1998–99 2000–01 2002–03 2004–5 2006–07 2008–09 2010–11
SECURING THE PRESENT, SHAPING THE FUTURE
II. FIGHTING INFLATION HAS BECOME A KEY SHORT-TERM PRIORITY 17

the Philippines has kept its policy rates unchanged since mid-2009, even while growth surged to a 30-year high, and the bank revised up its inflation projections. The central bank in China has supplemented increases in policy rates with seven increases in minimum required reserves to 19.5 percent of gross deposits, lifting the requirement to a level similar to that in Brazil where inflation is running at twice China’s rate. The central bank in China also issued instructions in January 2011 to several large state-owned banks to stop lending, supplementing it with other micro-prudential regulations.
The modest extent of monetary tightening has done little to contain credit expansion so far. Credit growth has quickened since the start of 2010 compared with the average pace during 2000-2007 in most countries (Figure 26). At one extreme, in the Philippines, credit is rising at the fastest pace in a decade at about 10 percent a year. At the other extreme, in a clear sign of overheating, credit rose by 30 percent or more during 2010 in Vietnam and Mongolia, substantially faster than nominal GDP growth.
Exchange rate appreciation slows
The region’s policymakers have responded to the surge in capital inflows by a combination of exchange rate appreciation, exchange market intervention, and measures to deter inflows and encourage outflows. The region’s currencies rose strongly last year, but the pace of appreciation for most of the recipients of the largest capital inflows has slowed since late 2010, as foreign long-term interest rates increased substantially and non-residents became concerned about higher inflation in East Asia. The currencies of the low-income countries continued to appreciate in real effective terms in part due to higher inflation, while there has been limited real depreciation in middle-income countries since September 2010 (Figure 27). In contrast with the other countries in the region, Vietnam’s dong has weakened substantially in nominal terms because of four devaluations amounting to 18 percent cumulatively since November 2009 through February 2011.
Increased exchange market intervention led to a surge in foreign exchange reserves. While foreign exchange reserves have increased the most in China, accumulation has also been rapid in other countries (Figure 28). In all countries in the region, reserves are now much higher than their pre-crisis levels. For developing East Asia on
figure 27. Real effective exchange rates have appreciated since the crisis low, but this trend is easing or reversingappreciation, in percent
Crisis low (varies by country)–Sep 2010 Sep 2010–Jan 2011/Dec 2010
Sources: IMF and BIS.Note: (+) denotes appreciation.
figure 28. Foreign exchange reserves have soared reflecting central bank interventionsannual change in foreign reserves minus gold, in billions of U.S. dollars
Indonesia Philippines Malaysia Thailand China (right side)
Source: World Bank staff calculations.
30
25
20
15
10
-5
5
0
Indonesia Malaysia PhilippinesThailandChina CambodiaMongolia Lao PDR Vietnam 1995 20091997 1999 2001 2003 2005 2007
100
80
60
40
-40
-20
20
0
500450400350300250200150100500
WORLD BANK EAST ASIA AND PACIFIC ECONOMIC UPDATE 2011, VOL. 1
18 II. FIGHTING INFLATION HAS BECOME A KEY SHORT-TERM PRIORITY
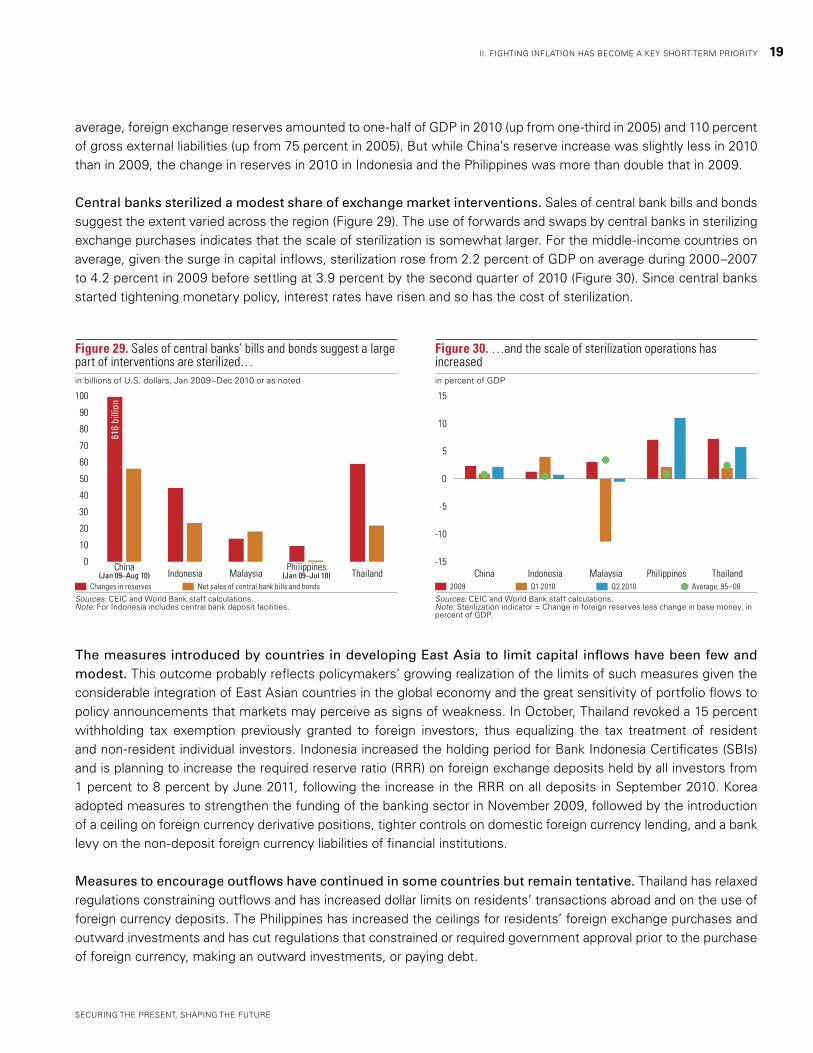
average, foreign exchange reserves amounted to one-half of GDP in 2010 (up from one-third in 2005) and 110 percent of gross external liabilities (up from 75 percent in 2005). But while China’s reserve increase was slightly less in 2010 than in 2009, the change in reserves in 2010 in Indonesia and the Philippines was more than double that in 2009.
Central banks sterilized a modest share of exchange market interventions. Sales of central bank bills and bonds suggest the extent varied across the region (Figure 29). The use of forwards and swaps by central banks in sterilizing exchange purchases indicates that the scale of sterilization is somewhat larger. For the middle-income countries on average, given the surge in capital inflows, sterilization rose from 2.2 percent of GDP on average during 2000–2007 to 4.2 percent in 2009 before settling at 3.9 percent by the second quarter of 2010 (Figure 30). Since central banks started tightening monetary policy, interest rates have risen and so has the cost of sterilization.
The measures introduced by countries in developing East Asia to limit capital inflows have been few and modest. This outcome probably reflects policymakers’ growing realization of the limits of such measures given the considerable integration of East Asian countries in the global economy and the great sensitivity of portfolio flows to policy announcements that markets may perceive as signs of weakness. In October, Thailand revoked a 15 percent withholding tax exemption previously granted to foreign investors, thus equalizing the tax treatment of resident and non-resident individual investors. Indonesia increased the holding period for Bank Indonesia Certificates (SBIs) and is planning to increase the required reserve ratio (RRR) on foreign exchange deposits held by all investors from 1 percent to 8 percent by June 2011, following the increase in the RRR on all deposits in September 2010. Korea adopted measures to strengthen the funding of the banking sector in November 2009, followed by the introduction of a ceiling on foreign currency derivative positions, tighter controls on domestic foreign currency lending, and a bank levy on the non-deposit foreign currency liabilities of financial institutions.
Measures to encourage outflows have continued in some countries but remain tentative. Thailand has relaxed regulations constraining outflows and has increased dollar limits on residents’ transactions abroad and on the use of foreign currency deposits. The Philippines has increased the ceilings for residents’ foreign exchange purchases and outward investments and has cut regulations that constrained or required government approval prior to the purchase of foreign currency, making an outward investments, or paying debt.
figure 29. Sales of central banks’ bills and bonds suggest a large part of interventions are sterilized…in billions of U.S. dollars, Jan 2009–Dec 2010 or as noted
Changes in reserves Net sales of central bank bills and bonds
Sources: CEIC and World Bank staff calculations.Note: For Indonesia includes central bank deposit facilities.
1009080706050
0
2010
4030
Indonesia Malaysia Philippines(Jan 09–Jul 10) ThailandChina
(Jan 09–Aug 10)
616
bill
ion
figure 30. …and the scale of sterilization operations has increasedin percent of GDP
2009 Q1 2010 Q2 2010 Average, 95–08
Sources: CEIC and World Bank staff calculations.Note: Sterilization indicator = Change in foreign reserves less change in base money, in percent of GDP.
15
10
5
-15
-5
-10
0
Indonesia Malaysia Philippines ThailandChina
SECURING THE PRESENT, SHAPING THE FUTURE
II. FIGHTING INFLATION HAS BECOME A KEY SHORT-TERM PRIORITY 19

The efficacy of the measures continues to be mixed. Non-residents’ share of Indonesian SBIs fell sharply by 13 percentage points when the one-month holding period on the SBIs was introduced in May 2010. Since then, foreign ownership of the bills has climbed by more than 10 percentage points. Meanwhile, the external debt of domestic and foreign banks in Korea remained under $120 billion in 2010 compared with a high of $160 billion before the global economic and financial crisis, but it is hard to attribute the outcome to the measures taken.
Currency appreciation—especially with the pause since late 2010—has not hampered the recovery, although exporters’ margins have been affected. Exchange market intervention has limited the extent to which nominal exchange rates across the region have strengthened, but that has been largely offset by higher inflation. The result has been still substantial real appreciation compared with the level during the trough of the crisis. These developments are further affected by the different degrees to which countries have allowed nominal exchange rates to be flexible and the extent to which capital accounts are open. These issues need to be discussed in the context of ASEAN and ASEAN+6, in which member countries could fashion a common approach to these regional challenges. At home, countries might find it useful to adopt further prudential requirements to ensure that capital inflows do not unduly burden domestic banks. Smaller loan-to-value and loan-to-income ratios, increased reserve requirements, pro-cyclical capital adequacy ratios, enhanced rules for valuing real estate collateral, and other measures will help to sustain domestic financial and macroeconomic stability.
Fiscal deficits are declining
Fiscal deficits narrowed by nearly 1 percent on average in 2010 throughout developing East Asia, thanks to buoyant revenues and some spending restraint. Concerns about the strength of the global recovery, however, and adherence to earlier spending commitments have meant that policymakers have been withdrawing fiscal stimulus measures only very gradually. The median deficit in developing East Asia narrowed to 3.3 percent in 2010 as a result of these policies but was still double the level in 2007 (Figure 31). Compared with other countries, the 2010 deficit is similar to that in developing Latin America but is substantially lower than the deficit of 4.4 percent in the other developing regions and the 10 percent deficit in the U.S.
In most countries, the bulk of the adjustment in 2010 was due to more buoyant revenues helped by broad-based economic growth. In Malaysia, by contrast, revenues declined in line with oil-related receipts based, as is customary, on the average oil price during the previous year.2 In the Philippines, structural weaknesses in the tax administration dampened revenue gains despite one of the fastest growth rates on record, resulting in only modest fiscal consolidation (Figure 32). Although all countries have begun reversing the fiscal stimulus measures introduced in 2008-2009, additional outlays have meant that spending in nominal terms has fallen only in Malaysia due to reductions in subsidies and in Korea.
Government debt is estimated to have declined in 2010 in most countries relative to output. Debt levels turned out to be lower than earlier expected as a result of favorable fiscal outcomes and strong growth (Figure 33). Fiscal sustainability risks are limited in most countries, but some countries have more challenges. Vietnam, for example, was downgraded by all ratings agencies in 2010 because of concerns about macroeconomic policies and developments. Debt in Malaysia jumped by 12 percentage points of GDP in 2009 but did not decline in 2010 despite
2 In Malaysia, oil revenues (including Petronas dividends) account for 40 percent of government revenues. Oil-related payments to the budget are based on the average oil price during the preceding year. Oil prices in 2009 were lower than in 2008 and in 2010 on average.
WORLD BANK EAST ASIA AND PACIFIC ECONOMIC UPDATE 2011, VOL. 1
20 II. FIGHTING INFLATION HAS BECOME A KEY SHORT-TERM PRIORITY

buoyant GDP growth. This underlines the need for Malaysia to promote fiscal adjustment not only through revenue growth as in the past but also through expenditure cuts in line with the government’s plan to phase out several subsidies in 2011 and 2012.
National budgets for 2011 show that there is a continued cautious movement away from fiscal stimulus measures because of concerns about the pace of the global recovery and a renewed determination to increase government spending on infrastructure. At the time when the 2011 budgets were being prepared, policymakers were expecting weak import demand from the high-income economies. Meanwhile, thanks to their strong balance sheets and reinforced by better-than-expected revenues, the government in most countries opted to err on the side of caution. In some countries, moreover, governments have identified lagging investment in public infrastructure—in many cases below the levels that prevailed prior to the 1997-98 Asian financial crisis—as a critical constraint to growth. As a result, the governments of China, Indonesia, and Thailand have budgeted for larger fiscal deficits in 2011 (Figure 34).
figure 31. Fiscal balances improved throughout East Asia in 2010, largely due to stronger revenues in percent of GDP; change in the fiscal balance in 2010 relative to 2009; a plus denotes an improvement
GDP Spending Revenues Change balance
Sources: Datastream and World Bank staff calculations.
figure 32. Revenues grew faster than output in most countries other than the Philippines and Fiji, 2010growth in 2010 nominal GDP and revenues, in percent
Nominal GDP Nominal revenues
Sources: Datastream and World Bank staff calculations.
5
4
3
2
1
0
-1
-4
-2
-3
IndonesiaMalaysiaPhilippines ThailandChina Fiji KoreaCambodia
30
25
20
15
0
10
5
IndonesiaPhilippines Thailand ChinaFijiKorea Cambodia
figure 34. Fiscal deficits in 2011 are likely to be smaller or little changed in most countries, in contrast to budget plans that call for an increasein percent of GDP
2009 2010 2011
Sources: Datastream and World Bank staff calculations.
figure 33. Government debt burdens declined in most middle-income countries due to strong growth
in percent of GDP
2008 2009 2010 /1 2010 /2
Sources: Datastream and World Bank staff calculations. 1/ 2010 actual; 2/ 2010 projection as of October 2010.
IndonesiaMalaysia PhilippinesThailand ChinaCambodia Vietnam
4
2
0
-2
-4
-10
-6
-8
70
60
50
40
30
0
20
10
Indonesia Malaysia PhilippinesChina Thailand Vietnam
SECURING THE PRESENT, SHAPING THE FUTURE
II. FIGHTING INFLATION HAS BECOME A KEY SHORT-TERM PRIORITY 21

Past experience suggests some of the planned capital spending by governments is unlikely to materialize. Moreover, revenue projections in the 2011 budgets have also tended to be cautious. Fiscal deficits in 2011 are more likely to decline across most countries in the region, even in some of those that budget plans call for an increase. Thailand is an exception, where the favorable fiscal outcomes in 2010 and a possible election in the first half of 2011 have prompted the government to recently propose a supplementary budget to take advantage of higher-than-budgeted revenues. Nevertheless, the authorities remain committed to a primary surplus by 2016.
The increased use of subsidies to counter rising food and fuel prices presents an important risk to the fiscal outlook. Many East Asian governments have responded to higher food and energy prices by using fiscal policy as a buffer to protect consumers and firms. Thailand extended diesel subsidies and will continue to cap prices on liquefied petroleum gas for household and transport use (55 percent of total usage). China responded to the recent drought in major wheat-producing provinces with direct subsidies to farmers. The Korean government froze electricity and gas prices during the first half of 2011 among other measures. Indonesian policymakers do not intend to raise electricity tariffs in 2011 and there are talks to delay a plan approved last year to reduce the use of subsidized fuel starting in April. There is a risk that Malaysia may not raise domestic fuel prices further. Additional increases in food or fuel prices will not only exacerbate the cost of these policies but may also prompt governments to adopt new measures.
WORLD BANK EAST ASIA AND PACIFIC ECONOMIC UPDATE 2011, VOL. 1
22 II. FIGHTING INFLATION HAS BECOME A KEY SHORT-TERM PRIORITY

Part II. Shaping the future: SuStaining incLuSive growth
east asia’s stellar performance in recent decades has elevated its global economic weight and markedly increased its influence in global institutions. further rapid and sustained growth and global recognition will depend on how countries in the region harness emerging opportunities and tackle multiple challenges. the most critical ones include the need to pursue further regional integration to take advantage of a rapidly growing china and to deal with rising inequality and social exclusion. countries in the region also need to build innovative and disaster-resilient cities, ensure environmental sustainability, and adapt to the effects of climate change. at the same time, given east asia’s increased stakes in an efficient and stable global system, it will need to contribute its fair share toward global public goods, including by helping maintain open trading systems, tackling global imbalances, building a stable yet efficient international financial architecture, and mitigating the effects of climate change.
SECURING THE PRESENT, SHAPING THE FUTURE
23

III. the changIng global envIronment and the rISe of eaSt aSIa
East Asia faces a different global environment than the high-income economies did during their rise after World War II. In contrast to the closed capital accounts, limited flows of portfolio capital, and fixed exchange rates of the post-World War II era, increased volatility in all of these variables is probably one of the most important global challenges today. Moreover, commodity prices are on the rise after a century-long decline.
Yet, developing countries account for a growing share of global output and growth and “South-South” trade is the fastest growing component of global trade. East Asia is at the leading edge of this transformation change. Its companies are becoming increasingly global, and its workforce more innovative. But with increased economic weight come new responsibilities. East Asia’s successful export-oriented growth strategy was based in no small part on a relatively open international trading environment and significant levels of foreign investment -- all made possible by a framework of global rules and supporting institutions. Going forward, it will be in East Asia’s interest not just to benefit from such global public goods, but to actively support and improve them. In addition to the international trading environment, this would also include efforts to improve the international financial architecture and global economic governance and help address the risks of climate change.
The rise of developing countries: opportunities and challenge
Until the early 19th century, China’s economy was the largest in the world and the economies of developing East Asia together were larger than today’s high-income economies combined measured in purchasing power parity terms.3 Over the following century, the share of global output of both China and developing East Asia declined dramatically amid extraordinary disruptions. Starting in the 1960s, however, developing economies led by East Asia began growing faster than the high-income economies, and today their share of global output is one-third at market prices and one-half in PPP terms (Table 3, Figure 35, Figure 36, and Box 4). What is more, the margin between the growth rates of developed countries and those of developing countries has widened in recent years, even as business cycles have become more synchronized. Developing countries are decoupling in trend terms but are becoming more tightly integrated, and therefore more coupled, in cyclical terms.
If developing countries continue to grow at their current rate, their share of the global economy will climb to one-half in current prices in the 2020s, and at about the same time China will become the largest economy in the world. Developing countries will account for as large a share of global fixed investment, trade and investment flows as high-income economies. The role of China will be key: in fact, the rise of China will offer exceptional
3 Maddison, Angus, http://www.theworldeconomy.org/MaddisonTables/MaddisontableB-18.pdf.
table 3. The share of developing countries in global GDP is rising steadilyin percent of GDP
Sources: World Bank, IMF, Consensus Economics, and World Bank staff estimates.Note: Low appreciation: 0.8 percent a year vs. the U.S. dollar, high appreciation is 1.5 percent a year. See chapter IV.
2010 2030 2030 (current prices)
(2010 prices) low high
High income 66.4 52.4 49.1 40
U.S. 23.6 20.5 19.2 15.7
Other 42.8 31.9 29.9 24.4
Low & middle income 33.6 47.6 50.9 60
China 9.5 17.1 18.8 23.6
India 2.3 4.6 5.1 6.7
Other 21.9 25.9 27 29.7
WORLD BANK EAST ASIA AND PACIFIC ECONOMIC UPDATE 2011, VOL. 1
24

opportunities to other countries in East Asia to upgrade their patterns of growth and move up the value chain. There are also likely to be large spillovers to the rest of the world in terms of growth, capital flows and commodity prices.
The rise of developing countries and the shift in relative global economic power is likely to result in a world without a dominant economic pole. Whether this is a “multi-polar” world, or a “no-polar” world will have profound implications for the global economy. Although a multi-polar world does not automatically mean more stability, such a world may be more likely to sustain a cooperative spirit and adherence to the values that have made recent progress possible is likely to continue. Moreover, the global risks of a substantial growth slowdown in one growth pole will be smaller if there are other powerful sources of global economic expansion. A “no-polar” world, by contrast, will likely be dominated by less cooperative large countries and economic blocks, with a risk of a lapse into regionalism that may turn around some or much of the progress accomplished by globalization over the last half a century.
Nevertheless, the U.S., the EU, and Japan will remain the wealthiest large economies in terms of per capita income, but their economic size will have diminished relative to some developing countries. For the first time in modern
figure 35. The share of developing countries in global GDP began rising anew in the late 1950s…in percent of global output measured in 1990 constant Geary-Khamis dollars
Developing East Asia G-7 All developing countries
Sources: Angus Maddison
figure 36. …as growth in developing economies surpassed that in high-income economiesin percent per year, average for the decades
Developing East Asia G-7 All developing countries World
Sources: Datastream and World Bank staff calculations
90
80
70
60
50
40
30
0
20
10
1500 1700 1870 1913 1950 1970 1990 2001 2005 20072003 1970s 1980s 1990s 2000s
9
6
0
4
2
8
figure 37. Per capita GDP in constant dollars has risen in all regions on average…per capita GDP in constant 2000 dollars
East Asia Latin America Middle East & North AfricaSub-Saharan Africa South Asia
Sources: Datastream and World Bank staff calculations.
figure 38. …but relative to high-income economies, has increased steadily only in developing East Asia per capita GDP in constant 2000 dollars, in percent of high-income economies
Latin America Middle East & North Africa East Asia
Sources: Datastream and World Bank staff calculations.
6,000
5,000
4,000
3,000
0
2,000
1,000
1960 1963 1966 1969 1972 1975 1978 1981 1984 1987 1990 1993 1996 1999 2002 2005 2008
25
20
15
0
10
5
1970 1972 1974 1978 1980 1986 1988 1990 1992 1994 1996 1998 2000 20081976 1982 1984 2002 2004 2006
SECURING THE PRESENT, SHAPING THE FUTURE
III. THE CHANGING GLOBAL ENVIRONMENT AND THE RISE OF EAST ASIA 25
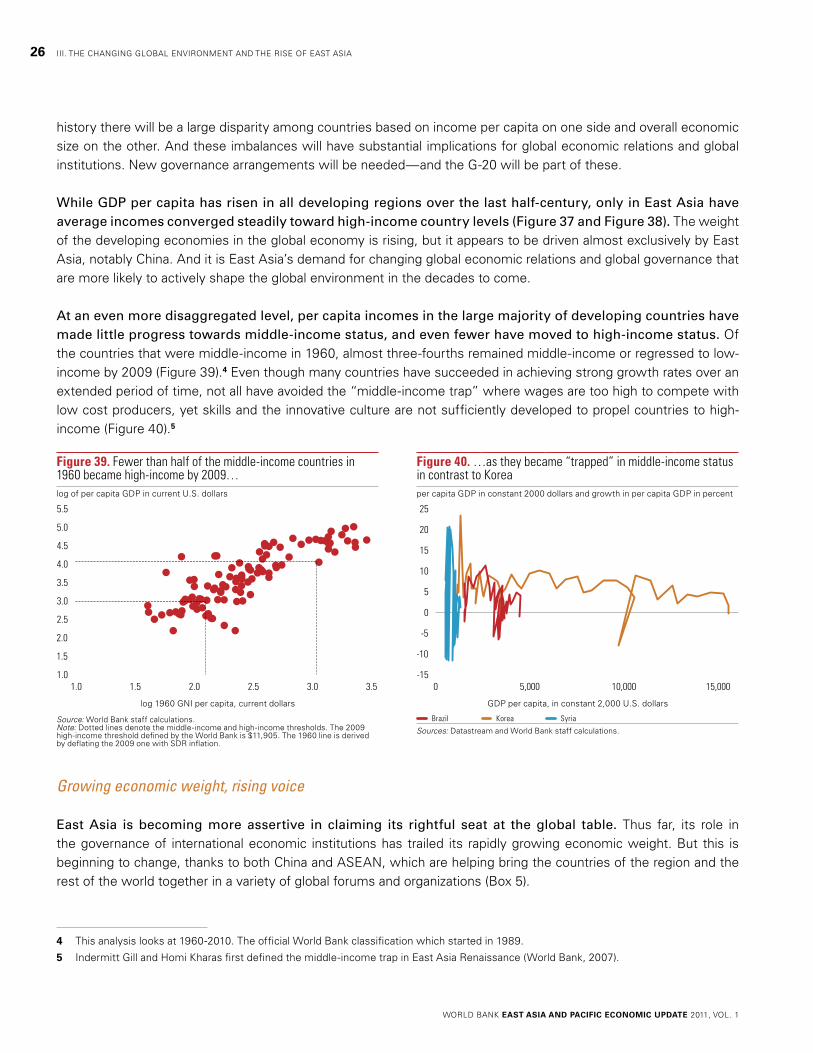
history there will be a large disparity among countries based on income per capita on one side and overall economic size on the other. And these imbalances will have substantial implications for global economic relations and global institutions. New governance arrangements will be needed—and the G-20 will be part of these.
While GDP per capita has risen in all developing regions over the last half-century, only in East Asia have average incomes converged steadily toward high-income country levels (Figure 37 and Figure 38). The weight of the developing economies in the global economy is rising, but it appears to be driven almost exclusively by East Asia, notably China. And it is East Asia’s demand for changing global economic relations and global governance that are more likely to actively shape the global environment in the decades to come.
At an even more disaggregated level, per capita incomes in the large majority of developing countries have made little progress towards middle-income status, and even fewer have moved to high-income status. Of the countries that were middle-income in 1960, almost three-fourths remained middle-income or regressed to low-income by 2009 (Figure 39).4 Even though many countries have succeeded in achieving strong growth rates over an extended period of time, not all have avoided the “middle-income trap” where wages are too high to compete with low cost producers, yet skills and the innovative culture are not sufficiently developed to propel countries to high-income (Figure 40).5
Growing economic weight, rising voice
East Asia is becoming more assertive in claiming its rightful seat at the global table. Thus far, its role in the governance of international economic institutions has trailed its rapidly growing economic weight. But this is beginning to change, thanks to both China and ASEAN, which are helping bring the countries of the region and the rest of the world together in a variety of global forums and organizations (Box 5).
4 This analysis looks at 1960-2010. The official World Bank classification which started in 1989.
5 Indermitt Gill and Homi Kharas first defined the middle-income trap in East Asia Renaissance (World Bank, 2007).
figure 39. Fewer than half of the middle-income countries in 1960 became high-income by 2009…log of per capita GDP in current U.S. dollars
log 1960 GNI per capita, current dollars
Source: World Bank staff calculations. Note: Dotted lines denote the middle-income and high-income thresholds. The 2009 high-income threshold defined by the World Bank is $11,905. The 1960 line is derived by deflating the 2009 one with SDR inflation.
5.5
5.0
4.5
4.0
3.5
3.0
2.5
1.0
2.0
1.5
1.0 1.5 2.0 2.5 3.0 3.5
figure 40. …as they became “trapped” in middle-income status in contrast to Koreaper capita GDP in constant 2000 dollars and growth in per capita GDP in percent
GDP per capita, in constant 2,000 U.S. dollars
Brazil Korea Syria
Sources: Datastream and World Bank staff calculations.
25
20
15
10
5
0
-15
-5
-10
0 5,000 10,000 15,000
WORLD BANK EAST ASIA AND PACIFIC ECONOMIC UPDATE 2011, VOL. 1
26 III. THE CHANGING GLOBAL ENVIRONMENT AND THE RISE OF EAST ASIA

Box 4. Korea: From low-income to high-income in two generations
The Korean economy stands out in its development journey. One of the poorest countries in the world in the early 1950s, Korea is now a member of the OECD. The heavily aid-dependent country became a donor country for the first time. Agriculture as a share of GDP has plummeted, while industry has more than doubled as the export sector has grown rapidly. Korea’s industrial strengths include plenty of world-class brand names in, for example, automobiles, electronics, LCD, semi-conductors, and shipbuilding. While this transformation has not been without its share of failures and problems, such as the 1997-98 Asian financial crisis, Korea has demonstrated remarkable resiliency.
Korea’s impressive economic performance is attributable to a combination of openness, macroeconomic stability, market-based resource allocation, and capable government. More specifically:
Building on relatively favorable initial conditions in terms of human resources and institutions, Korea •adopted an export-oriented industrialization strategy. This strategy played a key role in the country’s economic development not just by increasing exports but by continuously moving up the value chain through competition and innovation in international markets. This transformation was the result of a government-business partnership. • The government initiated the multi-year development plans and adopted an array of measures that supported business groups, including the sharing of investment risks. In turn, business groups, the chaebols, actively engaged in industrial upgrading and technological development. The export performance of private firms was used as a selection criterion for further government support. Korea’s outlays on R&D were significantly enhanced initially through government-established •research institutes and subsequently through private sector activities. Korea also expanded access to education, thus helping to train a skilled and creative workforce. Finally, Korea has been ready and flexible enough to change course when it encountered new realities •and challenges. Responding to the increasing complexity of the economy, the government’s role shifted from direct to indirect planning. More importantly, Korea used economic shocks and crises to rebalance its strategies to cope with evolving development challenges. The wide range of market-oriented reforms implemented after the 1997-98 Asian financial crisis is one example.
The Korean experience highlights the importance of establishing a well-functioning performance-based reward mechanism in resource allocation. For Korea, export performance in the competitive global market was a prerequisite for government support. Investment in human resources and technological capacity were an integral part of the country’s development strategy. Finally, to sustain high growth, Korea was able to adopt new paths and strategies when new challenges emerged.
Source: Prepared by Chul Ju Kim.
figure 41. Korea’s GDP per capita has converged fast to the levels of high-income economies…
GDP per capita, in percent of U.S. levels, 1960–2010
GDP per capita (2000 US$) Ratio to U.S. (RHS)
Source: World Bank Development Indicators.
figure 42. …reflecting to a large extent a dedication to education and innovation
enrollment rates, in percent
Middle school High school Tertiary
Source: World Bank Development Indicators.
20,000 50
16,000 40
12,000 30
8,000 20
0 0
4,000 10
1960 1970 1980 1990 2000
10090807060504030
0
2010
1965 1970 1975 1980 1985 1990 1995 2000 2005 2009
SECURING THE PRESENT, SHAPING THE FUTURE
III. THE CHANGING GLOBAL ENVIRONMENT AND THE RISE OF EAST ASIA 27

Box 5. Taking a seat at the table: The emerging role of East Asia in global economic governance
The East Asia and the Pacific region has not only emerged as a strong economic power but also has initiated shifts in global economic governance. Countries from the East Asia and Pacific region are emerging as strong powers in international financial organizations, such as the Bretton Woods institutions, and in multilateral settings such as the G20. In the aftermath of the global economic crisis, the worldwide recognition of the sheer size of China’s economy and its role in the global recovery have led to a wider acknowledgement that the policies adopted in large emerging markets matter for global economic stability. This has made it essential that China be brought more fully into discussions of international economic policy coordination, previously the domain largely of G7 finance ministers.
But while China has been an important force behind the emergence of East Asia in global economic governance, it has not been the only country in the region whose political weight and influence has been enhanced. To some extent, this reflects the ability of other developing countries to play a significant part in the crisis response, both financially and in policy terms. Their contribution took a variety of forms, including coordinated fiscal stimuli, a commitment to avoid imposing trade restrictions that could have derailed the recovery, and direct financial contributions to the crisis response. For example, in response to the G20’s call to triple IMF resources, Korea, China, and Singapore were among the group of countries that put in place bilateral lending arrangements with the IMF. China and the Philippines have joined the newly expanded and reformed New Arrangement to Borrow (NAB), which already included Korea, Malaysia, Singapore, Thailand, and the Hong Kong Monetary Authority.
However, emerging markets were not prepared to assume a greater share of the financial burden without a greater voice in formulating the crisis response. The emergence of the G20 as the pre-eminent forum for discussions of global economic policy coordination was one part of the answer. Reflecting the fact that most leading emerging markets (and the largest East Asian economies) were represented in the G20, it became the preferred forum for managing the response to the crisis. The presidency of the G20 passed to Korea in the midst of the crisis, providing the country with a high profile and strategic platform for contributing to the setting of global priorities. The Korean government chose to focus its presidency of the G20 on shared growth built on nine key pillars—infrastructure, human resource development, trade, private investment and job creation, food security, growth with resilience, financial inclusion, the mobilization of domestic resources, and knowledge sharing. Their status as an “emerged” economy added valuable credibility to its efforts to balance the concerns and interests of both high-income and developing countries. At the same time, China has played a major role in launching a debate on fundamental reform of the international monetary system, which is continuing to be at the center of G20 attention under the presidency of France.
Reforms of the voting system at the Bretton Woods institutions are reflecting a broad acceptance of the need for a more fundamental realignment of voting power. Important reforms of voting power at the World Bank and the International Monetary Fund were adopted in 2010. At the World Bank, as a result of the two phases of reforms to increase the voice of developing regions (2008 and 2010), the voting power of the countries in the East Asia and Pacific region has increased substantially. Increased voice has come with higher financial responsibility to the World Bank. And as the global economic clout of East Asia continues to rise, prospects are good that the political weight of the region is likely to increase. What this means in practice will be determined by the extent to which countries in the region are able to articulate shared policy interests. In this regard, the policy agendas of APEC and ASEAN are likely to be indicators of the broader international policy agenda for which the region will advocate in the future.
Source: Prepared by Jeff Chelsky.
WORLD BANK EAST ASIA AND PACIFIC ECONOMIC UPDATE 2011, VOL. 1
28 III. THE CHANGING GLOBAL ENVIRONMENT AND THE RISE OF EAST ASIA

A more populous, more urban, and older world
The world’s population is set to rise by another 1.4 billion by 2030, with most of the increase due to occur in the developing world. The population of high-income economies has broadly stabilized, and East Asia’s will plateau by 2030 (Figure 43). It is the least developed countries, in particular those in Sub-Saharan Africa, that will account for the bulk of the global population increase in the long term. The implications of this shift will be profound.
The large and growing size of the working age population in developing countries is continuing for now but is projected to level off by 2030 in all developing regions other than in Sub-Saharan Africa. The rise of the working age population (16–64 years old) relative to the total population—an increase that leads to the so-called “demographic dividend”—results from the well understood and documented sharp decline in mortality before fertility rates decline. This decade will mark the end of the demographic dividend in the high-income economies, with the working age population peaking at about 65 percent of the total population of these countries. The end of the demographic dividend is likely to come in East Asia by 2030 or even earlier (Figure 44).6 As will be explored in Chapter VI, this is likely to result in slower per capita growth rates. But countervailing policies to encourage saving, extend working lives, and improve human capital are likely to help offset most of the potential decline.
The experience of Korea and Japan suggest that ageing is unlikely to slow growth because of lower savings rates. Population ageing in both countries does not appear to have resulted in meaningful declines in the national saving rates—even as household saving rates fell (Figure 45 and Figure 46).7 And the employment rates in Korea—defined as those of working age who are in the labor force—surged by 3.5 percentage points between 1999 and 2009, largely due to the increased participation of women. The employment of older workers also rose by about 1.5 percentage points.
6 Birdsall, Nancy, Allen C. Kelley and Steven W. Sinding, eds., 2001.
7 Kim, Cul Ju, Eye on East Asia No. 4, “Demographic Change and Household Savings in Japan and Korea: Implications for China,” www.worldbank.org/eapeye.
figure 43. Global population continues to increase, thanks to developing countries outside East Asia 1950–2050in millions
East Asia Advanced Rest of the world
Sources: UN population database.
10,0009,0008,0007,0006,0005,0004,0003,000
0
2,0001,000
1950 1960 1970 1980 1990 2000 2010 2020 2030 2040 2050
figure 44. The demographic dividend is coming to an end, except in Sub-Saharan Africa: 1950–2050dependency ratio: working-age population, 16–64, to the rest of the population
EU-U.S. Developing Asia Sub-Saharan Africa
Sources: UN urbanization database.
1950 1960 1970 1980 1990 2000 2010 2020 2030 2040
2.2
2.0
1.8
1.6
1.0
1.4
1.2
2050
SECURING THE PRESENT, SHAPING THE FUTURE
III. THE CHANGING GLOBAL ENVIRONMENT AND THE RISE OF EAST ASIA 29

Commodity prices are on the rise
The recent surge in prices for food and commodities, coming two years after the food and fuel crisis of 2008, serves as a reminder that higher prices are unlikely to be a temporary phenomenon. In real terms, deflated by prices for manufactures, energy prices have risen inexorably since 2000, followed at a much more modest pace by food prices (Figure 47). Whether the start of the new millennium marks the end of a century-long decline in real commodity prices has yet to be seen, but chances are better than even that an upward correction is inevitable given the rapid industrialization and urbanization taking place in developing countries.8 Since 2000, food prices are up almost three-fold in real terms, oil prices up almost two-fold, and metals have surged by more than half. In nominal terms, price increases have also reflected a decade of loose monetary policy, growing demand for maize and sugar for biofuels, and, at times, speculative buying.
8 World Bank, 1994, Global Economic Prospects, p. 14.
figure 46. …as was also the case in Korea
in percent of GDP
Gross Household Corporate
Sources: Bank of Korea, as in Eye on East Asia No.4, Chul Ju Kim, www.worldbank.org/eapeye.
figure 45. In Japan, rising corporate saving partly offset falling household saving to limit the decline in overall saving…
in percent of GDP
Gross Household Corporate
Sources: Cabinet Office of Japan, as in Eye on East Asia No.4, Chul Ju Kim, www.worldbank.org/eapeye.
45
0
35
30
25
20
15
10
5
1980 20081984 1988 1992 1996 20042000
40
40
0
35
30
25
20
15
10
5
1980 20081984 1988 1992 1996 20042000
figure 47. Commodity prices have been on an upward and volatile trend since the turn of the century
1960=100, real commodity prices
Energy Metals and mineral Food
Sources: World Development Indicators, World Bank.
250
200
150
0
50
100
1960 20081963 1966 1969 1972 1975 1978 1981 1984 1987 1990 1993 1996 1999 2002 2005 2011
figure 48. Per capita use of copper, aluminum, and other non-ferrous metals appears to peak at about $25,000 per capita GDP PPPPer capita copper consumption in kg, 1980–2009
GDP per capita, 2005 PPP U.S. dollars
Sources: World Development Indicators, World Bank.
30
25
20
15
0
10
5
0 10,000 20,000 30,000 40,000 50,000
WORLD BANK EAST ASIA AND PACIFIC ECONOMIC UPDATE 2011, VOL. 1
30 III. THE CHANGING GLOBAL ENVIRONMENT AND THE RISE OF EAST ASIA

The surge in China’s demand for commodities has been unprecedented. Driven by investment, including in metal-intensive infrastructure and housing, China accounted for almost all of the increase in global copper and aluminum demand during 1999–2009 and more than 40 percent of global oil demand. As a share of global consumption, China now accounts for nearly 40 percent of global copper demand, four times as large as a decade ago. China’s aluminum consumption is up 10 times from 1992.
China’s infrastructure and housing needs are likely to support continued strong demand for metals and other raw materials. China’s demand is likely to be even more front-loaded than international experience thus far suggests. Historically, metal consumption has risen with per capita income and tended to peak at about $25,000 PPP when the service sector dominated value added (Figure 48). If historical patterns are followed, China (with GDP per capita in PPP terms lower than $10,000) is likely to dominate global commodity demand for decades. Indeed, China’s demand for commodities could be steeper than precedent might indicate, suggesting at least a decade during which global demand will severely strain production capacity. China’s urban population is about 53 percent of the country’s total, well below the 78 percent level in Mexico. At current rural-urban migration rates, it will take China probably until about 2025 to increase its urban population to 75 percent, which will mean another several hundred million people living in cities with concomitant increases in demand for infrastructure, housing, and durable consumer goods.
Projections for global energy demand show developing countries playing an equally large role, again led by China. Recent projections suggest that China will account for more than one-third of the increase in global energy demand through 2035 and India for another 18 percent, with other non-OECD countries accounting for almost all of the remaining increase.9 Even though these projections assume a doubling of the demand for renewable energy to 14 percent, fossil fuels will still account for half of overall demand. How to ensure that there is sufficient energy for development while creating more livable cities that are crucial for sustained growth is a topic that will be discussed in Chapter VIII.
The role of East Asia
East Asia’s rapidly rising economic heft comes with new opportunities and responsibilities. Sustaining solid macroeconomic foundations at home and ensuring the conditions for strong and inclusive growth remain a core part of these responsibilities. At the same time, whether global economic expansion remains robust over the long term will depend increasingly on East Asia’s active role in ensuring that the rules governing global commerce and international economic relations contribute to prosperity for all.
9 International Energy Agency, 2010, World Energy Outlook.
SECURING THE PRESENT, SHAPING THE FUTURE
III. THE CHANGING GLOBAL ENVIRONMENT AND THE RISE OF EAST ASIA 31

Iv. regIonal IntegratIon and the role of chIna for regIonal ProSPerIty
China’s rapid and sustained economic expansion over the last three decades has been without precedent, lifting hundreds of millions from poverty at home and providing an increasingly stronger engine of growth globally. The country’s rise has provided a strong boost to the process of regional integration, with a rapid increase in intraregional trade—including for commodities and final products—and capital flows. As China’s wages are rising, there may in time be room for relocation of production toward other East Asian countries, although this process will take quite some time. Chinese investment in the region and beyond is rising steadily, and China’s prominence in global affairs suggests regional issues will receive a global audience. There are substantial risks, however, stemming from China’s exceptionally diversified output and export mix—much like the U.S.—that is in direct competition with countries in East Asia in foreign markets.
Regional integration is becoming a key driver of regional growth
Deeper regional integration will provide a further impetus to growth in East Asia and the Pacific. This boost will be especially timely given the likelihood that growth in high-income economies will be subdued after the global economic crisis. As barriers to the movement of goods, services, capital, and labor within the region are reduced further, countries that have integrated spectacularly with the world will integrate further among themselves, facilitating specialization and economies of scale and scope. The regional market for goods and services will provide opportunities that so far have been less than fully realized.
And regional integration will allow East Asia to benefit from China’s dynamism. Fewer barriers between countries within the region will allow for stronger links with China. Over the last decade, trade in goods—both for final consumption and for further processing—with China has been growing faster for most countries in the region than with the rest of the world. Deeper regional integration should facilitate stronger trade in services, thus adding a powerful impetus to the development of the countries’ higher-value-added service sector that has thus far lagged behind manufacturers at home—and the service sectors in other large emerging markets, including India. Allowing for a larger role for the service sectors will lead to gains in others sectors domestically and abroad and help support rebalancing efforts in some East Asian economies, most importantly in China.
Market-driven integration will support efforts to strengthen institutions and arrangements for more comprehensive regional economic cooperation. ASEAN (including its manifestations as ASEAN+3, ASEAN+6, and the East Asia Summit) has taken the lead in Southeast Asia, starting with the ASEAN Free Trade Area (AFTA) established in 1993. This was followed by ASEAN’s commitment to create a single ASEAN Economic Community by 2015 and the free trade agreement between ASEAN on the one hand and China and India on the other. A dialogue under the Asia-Pacific Economic Cooperation (APEC) is also well-advanced.
Further impetus to financial integration—a part of the integration of services—and the strengthening of the region’s financial safety net has been provided by the Chiang Mai Initiative Multilateralization (CMIM). This is an arrangement among the ASEAN+3 that came into effect in March 2010. The CMIM converted the system of bilateral swap arrangements between the individual ASEAN countries on one side and China, Korea, and Japan on the other and the $2 billion swap arrangements between the ASEAN countries (ASA) into a single $120 billion multilateral swap arrangement for balance of payments support. The maximum amount available for each country
WORLD BANK EAST ASIA AND PACIFIC ECONOMIC UPDATE 2011, VOL. 1
32

to draw on is a multiple of its original contribution, ranging from $11.2 billion for Indonesia, Malaysia, Singapore, and Thailand to $0.2 billion for Lao PDR.
China’s global and regional role surged since 1978
Over the last three decades, China’s sustained rapid growth and outward-oriented economic policy have helped to transform the country, the region, and the world. Real GDP growth in China averaged 10 percent a year during 1978–2010. In 2010, China became the world’s second largest economy, representing about 9.5 percent of global GDP at market exchange rates. Regional production networks in East Asia grew substantially in the last few decades and are largely centered on China. As a result, China is now the world’s largest exporter, second largest importer, and the focus for manufacturing activity in many sectors.
China’s strong growth and export orientation are the result of many external and domestic factors. A supportive global environment for much of this period including the structural shift to more globalized forms of industrial production has been critically important. China’s accession to the WTO in 2001, and associated changes in tariffs and other policies were especially crucial for deepening its global links, as has been the country’s gradual opening up to foreign investment.10 Domestically, growth has been spurred by phased landmark economic reforms and by an impressive deepening of domestic market integration both through policy reforms and improvements in infrastructure and logistics.11
China’s growth has been investment-oriented and industry-led. So far, the investment rate has been higher in China than in almost any other country, and the production structure is geared heavily towards industry (Figure 49).
This pattern of growth has served the economy well in many respects but has also contributed to some imbalances. The emphasis on capital deepening and industry in China has accentuated the gap that existed for a long time between productivity and wage growth. Thus, the share of wage income in GDP declined and along with it fell the share of consumption. This pattern of growth has limited the absorption of surplus agricultural labor and contributed to rising rural-urban income inequality. It has also been particularly intensive in energy and natural resources and has been tough on the environment.
While successful in several regards, government policies have accentuated these imbalances. Policies have encouraged saving and investment, with government spending for a long time geared towards investment in physical
10 The liberalization brought about by WTO accession was substantial. The average tariff rate was reduced from 43.2 percent in 1992 to around 9.8 percent in 2009.
11 For more discussion of factors behind China’s past performance, see Vincelette et al. (2011).
figure 49. China’s rise has depended more than elsewhere on high investment in percent of GDP
Share of industry in value added (percent)
Sources: World Development Indicators, NBS (for China) and staff estimates.
50
45
40
35
30
25
10
20
15
10 20 30 40 50 60
China (2010)
China (2005)
Malaysia(1970)
US
India (2009)
South Korea
Japan (1990)
Japan (1980)
Malaysia(1980)
SouthKorea
Japan Malaysia (1980)
Malaysia
Indonesia
Thailand
SECURING THE PRESENT, SHAPING THE FUTURE
IV. REGIONAL INTEGRATION AND THE ROLE OF CHINA FOR REGIONAL PROSPERITY 33

infrastructure more than in health and education, and were initially tilted towards richer, coastal areas. Industrialization and exports were promoted via easy access to cheap credit for large industrial firms, the under-pricing of key inputs—notably energy, natural resources, land, and the environment—and exchange rate policy. Meanwhile, service development received less attention.
This growth model, and the resulting imbalances, also strongly influenced how China’s economy interacted and affected the rest of the world. This interaction occurred in three main dimensions that involved China as a large and growing producer and exporter of manufactures, a diversified importer of commodities, intermediate inputs, and final goods, and, during the last decade, as a large net saver.12 We look at each of these dimensions in turn.
China’s exports have grown dramatically, turning the country into the world’s largest exporter. Since 1978, exports have increased 163 times in nominal U.S. dollar terms, or 17.2 percent a year on average. Since 2000, exports have risen 5.3 times in real terms (Figure 50).
As China has become a dominant global production center in many industries, manufactures comprise around 95 percent of its exports (Figure 51). In 2010, China’s exports of manufactures were equally split between “processing” and “non-processing” activities, with electronics and light manufactures together accounting for over 60 percent of all exports.13 These are the products of which China is a significant net exporter. The important role of processing trade reflects China’s emergence as a central player in many global and regional production chains, including in textiles and apparel, automobiles, and electronics.14 The productivity gains allowed by this dynamic and flexible form of production have helped to keep Chinese producers competitive despite headwinds from the post-2005 currency appreciation, large increases in real wages, and the global economic crisis.
12 In contrast, China has so far had much less impact on the world as a service exporter and as a source of outward FDI. This is gradually changing but from a low base.
13 “Processing” trade refers to exports that are processed/assembled, often along the coast and under a specific customs regime, using a large share of imports.
14 For more on the growth of the processing trade in China, see Zeng (2011).
figure 51. Exports are dominated by manufactures
in percent of total, 2010
Sources: CEIC, World Bank staff estimates.
Electronics36%
Machinery and equipment13%
Light manufactures24%
Metal/materialproducts
16%Chemical products6%
Primary products5%
figure 50. China’s trade has risen dramatically
in billions of U.S. dollars 2000 prices, seasonally adjusted
China exports of goods China imports of goods
Sources: CEIC, World Bank staff estimates.
2001 20102002 2003 2004 2005 2006 2007 20092008
140
120
100
80
60
0
40
20
WORLD BANK EAST ASIA AND PACIFIC ECONOMIC UPDATE 2011, VOL. 1
34 IV. REGIONAL INTEGRATION AND THE ROLE OF CHINA FOR REGIONAL PROSPERITY

China’s imports have also grown rapidly but they are much more diverse. Since 1978, China’s imports have increased 128 times in nominal U.S. dollar terms, or by 16.4 percent a year. Since 2000, China’s import volumes grew 4.4 times. In 2009 and 2010, driven by stimulus, China’s continued import growth was an important contributor to global growth at a critical time.
Finally, China has increasingly affected the world as a net saver. Investment rose from an already high 35.1 percent of GDP in 2000 to 48.6 percent in 2010, but gross national savings rose even more—from 36.8 percent of GDP to about 54.2 percent over the same period. As a result, China’s current account surplus jumped from $20.5 billion in 2000 to about $330 billion in 2010 (Figure 52). Given capital controls, most of the surplus savings were intermediated abroad by the public sector, largely in developed country securities. Thus, China’s foreign reserves rose rapidly, reaching $2.85 trillion, about 24 months of imports and 50 percent of GDP at end-2010 (Figure 53).
China’s economy through 2030: sustained albeit moderating growth
Assuming significant reform progress continues, China’s economy is likely to sustain robust but slowing growth through 2030. The structure of the economy will change in line with plans for a more balanced pattern of investment and economic activity, but investment will remain a powerful source of growth. China’s global weight will rise, becoming the largest economy in the world before the end of the 2030s, albeit with per capita income still lagging the high-income economies.
The shift in the growth and investment patterns towards services and consumption was a key objective of China’s 11th five-year plan and continues to feature prominently in the 12th five-year plan. Achieving the goals of this rebalancing requires putting more emphasis on channeling resources to sectors that should grow in the new setting and more permanent urbanization, with migrants taking their families along with them and living like urban citizens.15 A successful transformation would mean more labor-intensive growth, with a larger role played by services. A higher share of wages and household income in GDP would increase the role played by consumption in the
15 For a more detailed elaboration of the reform agenda for meeting these two objectives, see the World Bank China Quarterly Updates of June 2009, March 2010, and November 2010.
figure 52. China’s large current account surplus is a recent phenomenon…in billions of U.S. dollars in percent of GDP
Current account Share of GDP (RHS)
Sources: CEIC and World Bank staff estimates.
500450400350300250
-500
10050
200150
2001 2001 2001 2002 2002 2002 2003 2003
12
10
8
6
4
2
-6
-4
0
-2
figure 53. …as is the surge in foreign exchange reserves
in billions of U.S. dollars in billions of U.S. dollars
Monthly increase of FX reserve (RHS) Headline foreign exchange reserve
Sources: CEIC and World Bank staff estimates.
3,000
2,500
2,000
1,500
0
1,000
500
140120100806040200
-60
-20-40
2001 20102002 2003 2004 2005 2006 2007 20092008
SECURING THE PRESENT, SHAPING THE FUTURE
IV. REGIONAL INTEGRATION AND THE ROLE OF CHINA FOR REGIONAL PROSPERITY 35

economy in an economically sustainable way and ameliorate the pressures for current account surpluses. Such growth would also reduce urban-rural inequality and make growth less intensive in energy, raw materials, and resources and thus less detrimental to the environment.
The scenario through 2030 that we have developed in this chapter assumes substantial rebalancing along the lines presented above. Under the scenario, potential output growth is estimated to moderate to 6.8 percent in 2016–20 and to 5.1 percent in 2026–30, half the pace seen during 1978–2009 period (Table 4).
Despite substantial rebalancing, the contribution of capital accumulation to growth will remain sizeable in the medium term. The investment to GDP ratio is likely to decline only gradually as many investment plans and projections are still in the pipeline and China actually still needs a lot of capital—the capital stock per worker amounts to 14 percent of the U.S. level.
Other factors are likely to affect potential growth gradually. Demographic projections suggest overall employment will start to shrink in 2015. Human capital per worker will continue to rise gradually. TFP growth will moderate to a still relatively high rate. Other salient features of the projections include:
a rise in the share of consumption in GDP, with more urbanization and urban job creation and higher wage •pressure boosting the share of wages and household income in GDPa decline in the relative importance of industry and a rise in that of services•a decrease in the overall saving rate by enterprises, the government, and households •a lower external surplus, despite lower investment•higher rural productivity and incomes, and less urban-rural inequality.•growth less intensive in energy and primary commodities, with lower pollution.•
China’s economy and its living standards in international perspective in 2030
China’s weight in the global economy is likely to double to 17 percent from 2010 to 2030 in constant prices. China will probably contribute around one-fourth of overall real global GDP growth through 2030.
table 4. Slowing but still strong growth through 2030
percent change unless indicated otherwise
Sources: NBS and World Bank staff estimates.Note: Methodology as in Kuijs and Wang (2006), but with human capital. */ This is influenced by the dramatic increase in investment in 2009.
1978–1994
1995–2009
2010–2015
2010–2020
2021–2025
2026–2030
Potential GDP 9.9 9.9 8.7 6.8 5.7 5.1
Employment 3.3 1.0 0.2 -0.5 -0.5 -0.5
Labor productivity 6.4 8.8 8.5 7.3 6.3 5.6
From TFP growth 2.8 3.0 2.6 2.4 2.2 2.0
From higher H/L 0.5 0.6 0.5 0.5 0.5 0.5
From higher K/L ratio */ 3.0 5.1 5.4 4.4 4.0 3.2
Memoranda
Investment (% of GDP, average) 30.0 37.4 44.2 41.2 38.5 37.0
K/L (as a share of U.S., 2005 USD) 4.0 8.3 16.7 23.1 29.1 35.0
GDP pc (2000 prices), share of U.S. … 4.4 8.9 12.8 17.0 21.8
table 5. China’s evolving economic structure under the baseline scenario
in percent of GDP unless indicated otherwise
Sources: CEIC and World Bank estimates.
1990 2000 2010 2020 2030
Investment 25.9 34.1 45.3 40.0 37.0
Consumption 64.8 62.0 48.6 57.0 61.0
Industry 41.3 45.9 46.9 43.0 38.0
Tertiary sector 31.5 39.0 43.0 50.0 57.0
Employment in agriculture (%) 60.1 50.0 38.1 26.0 15.0
Employment in services (%) 18.5 27.5 34.1 44.0 55.0
Urbanization rate (%) 26.4 36.2 47.0 61.0 71.0
WORLD BANK EAST ASIA AND PACIFIC ECONOMIC UPDATE 2011, VOL. 1
36 IV. REGIONAL INTEGRATION AND THE ROLE OF CHINA FOR REGIONAL PROSPERITY
China’s future share of global output in current prices depends on exchange rate projections. Given the uncertainty over the pace of appreciation of the real exchange rate (RER) in the coming decade, consider two long-term paths. The lower bound assumes a real appreciation of 0.8 percent a year vis-a-vis the U.S. dollar, the average observed in a broad sample of countries during 1970–1996. The upper bound assumes 3 percent appreciation a year, broadly in line with Japan during 1965–1990 and South Korea during 1970-1996. Depending on the extent of RER appreciation, China’s share in global GDP in 2030 will be in the range of 19–24 percent and that of the other developing countries in the range of 51–60 percent at current market prices.
China’s future living standards can be compared with other countries’ current living standards. Under the scenario outlined above, China’s per capita GDP will reach $5,000 in constant 2000 dollars by 2020 (similar to Turkey and Malaysia in 2009) and $8,240 by 2030. To compare at current prices and market exchange rates, China’s per capita GDP will rise from 9.4 percent of the U.S. level in 2010 to 25–39 percent in 2030.
China’s rising regional and global role
The implications of the developments described in the previous section will be profound for the region and the world. Consider the following broad implications.
The favorable prospects for China augur well for further expansion of total and intra-regional trade. Globally, China’s trade volumes are likely to grow more slowly than during the pre-crisis period, partly because of more subdued growth prospects in traditional markets and partly due to saturation effects. Intra-regional trade is likely to increase.
While rebalancing might shift the composition of China’s imports, these shifts would be at the margin and dominated by the expansion of overall volumes. Relative to a “business as usual” scenario, China would import fewer commodities and intermediate inputs and more consumer goods. However, the structure of China’s economy contains significant inertia and is likely to change only gradually even with strong reforms. Even after such shifts, a growing China would continue to expand industrial output as well as its capital stock and to increase its overall demand for commodities.
China looks well placed to retain or enhance its position in many global or regional production chains that are likely set for further consolidation. This reflects China’s increasingly diversified manufacturing base and the likely emergence of large domestic firms with a skilled labor force and R&D capability.
Any shift in industrial production away from its current coastal locations is likely to be gradual. As China moves up the value chain and rebalances its economy and as its real wages continue to rise, some of its export-oriented enterprises are considering moving to new locations. This will create opportunities for low-cost countries in the region and for China’s inland areas. With effective distances having been drastically narrowed due to improved rail and road links, inland provinces such as Sichuan, Anhui, and Henan have already emerged as meaningful export production centers. Going forward, this process is likely to be gradual, including due to the resilience of the existing production areas. The specific pattern of wage increases across countries and within China will affect the degree to which such industrial transfer occurs within China vis-à-vis moving to other countries.
SECURING THE PRESENT, SHAPING THE FUTURE
37

Substantial gains for China and the region could be achieved from stronger service exports. While China’s service trade is growing rapidly, it still only constitutes 11 percent of China’s total external trade, only half the figure for global trade on average. Expanded services trade would allow China to diversify its export base and provide its producers with necessary services, especially backbone services. Within East Asia, it would expand choices for users of such services while enhancing competition for their producers.
There is immense scope for further increase in China’s outward FDI. China’s non-financial outward FDI rose from $2.7 billion in 2002 to $47.8 billion in 2009, but this still amounts to less than 1 percent of GDP. So far, this expansion has been led by state-owned enterprises, often in resource sectors, with a negligible role played by private firms. This is likely to change, spurring increased investment in the region and boosting regional integration.
China’s financial integration with the rest of the world so far has been limited by capital controls, barriers to entering the financial sector, and the modest expansion abroad of Chinese banks. A phased opening is underway in several of these dimensions. Deeper financial integration will allow households to earn more on their savings, increase the efficiency of domestic financial institutions through competitive pressures, and give firms access to more financial resources and instruments. Such changes could also have macroeconomic effects by expanding options for portfolio allocation. At present, most of China’s excess savings are being intermediated abroad as official reserves held in securities of developed economies. Easing controls could allow a larger part of China’s savings to finance development in East Asia and the Pacific, and possibly affect specific exchange rates. However, opening up to the global financial system will also increase risks as China’s financial system would become more exposed and opportunities for risk taking by financial institutions and firms would increase. Thus, it will be imperative to strengthen regulatory and supervisory institutions. The dangers inherent in uncontrolled capital movements indicate that the removal of constraints on capital account transactions should be gradual.
WORLD BANK EAST ASIA AND PACIFIC ECONOMIC UPDATE 2011, VOL. 1
38 VI. RISING INEQUALITY WITH HIGH GROWTH AND FALLING POVERTY

v. how wIll ageIng affect eaSt aSIa’S growth?
East Asia’s rapid growth benefitted substantially from its young population. The demographic dividend that the region enjoyed accounted for as much as one-third of economic growth over the last several decades in some countries. The decline in fertility rates and the ageing population in some of the large economies now however have brought an end to this demographic dividend. But the effects on economic growth are likely to be asymmetrical and much smaller than during the previous decades. It will adversely affect growth, but only modestly due to offsetting factors, including increased labor force participation of those in working age and longer working lives than in the past. While ageing will increase fiscal and health costs, the impact will vary based on the size and role of government and will also be mitigated by behavioral changes and corrective policies.
Rapidly shifting demographics will become increasingly important in shaping economic developments in East Asia and the Pacific. Under current projections, dependency ratios across East Asia are likely to increase sharply over the next thirty-forty years.16 These shifts are likely to completely reverse the favorable demographics over the last half a century, when dependency ratios in East Asia fell by one-third to as much as half while the share of the working age population grew (Figure 54 through Figure 57). While behavioral changes, policies and increased saving will likely offset pat of the negative demographics, it appears that growth rates for the larger economies in the region will be affected negatively over the long term.
Ageing impacts growth
The end of declining dependency ratios is likely to have a negative impact on growth. Favorable demographics are estimated to have contributed about 15–44 percent to the rise in per capita incomes over the last decades in East Asia, with the average for developing East Asia close to 25 percent.17 And working-age population and per capita incomes were strongly correlated throughout East Asia over the last several decades.
Over the next 30-40 years, the share of working age population to total population in East Asia will fall by 10 to 20 percentage points or more. Capital per worker will rise substantially, however, helping—together with changing personal attitudes and policies—limit the declines in per capita incomes. In the absence of such offsetting factors per-capita incomes would fall by nearly one-third.18
Ageing is not all: countervailing factors, behavioral changes, and policies
Several factors at least partly offset the impact of ageing on growth and make the impact of demographic changes asymmetrical. While favorable demographics of a young population fifty years ago had a significant positive impact on growth, unfavorable demographics of an ageing population will have a much less important negative impact. Among the most important countervailing factors, are behavioral changes in the population in response to ageing. These can partly offset the rise in dependency ratios by increasing labor force participation rates for working
16 The dependency ratio is the ratio of those ages 15 and below and those older than 64 relative to the rest of the population.
17 Bloom and Williamson (1998), Kelley and Schmidt (2005).
18 The analysis uses the following equation: (GDP/Population)=(GDP/Labor) x( Labor/Working-age-population)x (Working-age-population)/(Population).
SECURING THE PRESENT, SHAPING THE FUTURE
39

age and older ages, the latter extending working lives, increasing productivity through education and urbanization and capital deepening if households increase their savings rates in anticipation of longer life expectancy. In fact, some empirical estimates of the impact of ageing on growth in high-income economies suggest that ageing has a negative but statistically insignificant effect on growth.19
In the NIEs, for example, employment rates averaged 75 percent of the working age population over the last decade. Countries in developing East Asia have lower employment rates, and thus have scope for further increases. Another offsetting factor will be the continuation or even the increase of the high rates of labor productivity growth seen in the past decade. Assuming the offsetting factors of employment rates of 75 percent throughout East Asia, and productivity growth on par with that observed in the past decades (9 percent in China and 4 percent in Thailand, Malaysia, and for the region as a whole), ageing will reduce per capita income growth rates by at most 0.5 percentage points a year on average in these countries. Relative to a scenario of no demographic change, incomes will be
19 Bloom, et al. (2008).
figure 54. Dependency ratios are on the rise after half a century of decline…number of population younger than 16 and older than 64 relative to the rest of the population
China Korea Malaysia Thailand
Sources: UN World Population Prospects and World Bank staff calculations.
figure 56. …and the increase in the share of the elderly
population older than 64 relative to the total
China Korea Malaysia Thailand
Source: UN Population Projections.
figure 55. …reflecting a reduction in the working age population, …working age to total population
China Korea Malaysia Thailand
Source: UN Population Projections.
figure 57. …as the share of the young is bottoming out
population younger than 16 relative to the total
China Korea Malaysia Thailand
Source: UN Population Projections.
1.0
0.8
0.6
0.4
0
0.2
1960 1965 1970 1975 1980 1985 1990 1995 2000 2005 2010 2015 2020 2025 2030 2035 2040 2045 2050
1950 196519701975198019851990199520002005201020152020202520302035204020452050
0.5
0.45
0.4
0.35
0.3
0.25
0.2
0.1
0.15
19551960
0.9
0.8
0.7
0.5
0.6
1990 20502000 2010 2020 2030 2040
1950 196519701975198019851990199520002005201020152020202520302035204020452050
0.4
0.35
0.3
0.25
0.2
0.15
0.1
0
0.05
19551960
WORLD BANK EAST ASIA AND PACIFIC ECONOMIC UPDATE 2011, VOL. 1
40 V. HOW WILL AGEING AFFECT EAST ASIA’S GROWTH?

10 percent lower on average in 2030 and about 17 percent lower than in 2050. In the event, that productivity growth rates and employment rates are lower than envisaged; the slowdown in per capita growth rates will be greater.
Negative growth impact from rising fiscal and health costs of aging
There is however another set of factors that will increase the impact of ageing on growth. These arise from ageing-related fiscal and health costs that can crowd out productive investments. Their actual impact will depend on the level of development and the pension and health care systems prevalent in the country.
At present, countries in developing East Asia have relatively moderate pension penetration and replacement ratios. However many have already begun the process of increasing access to social insurance systems and can be expected to experience a rapidly increasing share of the population eligible to receive a pension compared to current levels over the next two-three decades. Increases of as much as five times for the middle-income countries and more than ten times for the lower-income ones are possible.
As societies age, health care costs are likely to rise substantially due to several factors. Firstly, per capita expenditures for healthcare are strongly correlated with age. Secondly, access to services and coverage through social insurance financing tends to rise with income growth. Thirdly, the rapid development of medical technology creates an autonomous cost-push factor as health providers aim to provide improved diagnostics and cures.
Simulations of the impact of ageing on health costs suggest a sustained escalation. If observed patterns of access to health care and the levels of relative spending by age are assumed health outlays are projected to rise from the current level of 3 to 7 percent of GDP to more than 10 percent over the next decades (Table 6). Unlike pensions, however, experience with health care has shown health care consumption grows disproportionately faster than income growth. This creates the potential for expenditures to increase far beyond the impact of ageing and access. If the experience of OECD countries is taken into account (where health care spending is estimated to have increased by 1.28 percent for each 1 percent of per capita GDP growth), expenditure estimates can potentially reach extremely high levels ranging from 17 to 33 percent of GDP.
The role of government policies
Government policies will have an important bearing on the impact of ageing on growth. Policies that could help mitigate the negative effect include measures to encourage a longer working life through delays in retirement, flexible old-age pension schemes, and adjustments in the premiums and benefits in pension systems. The
table 6. Health Spending is projected to rise sharply
in percent of GDP
Sources: UN World Population Prospects and World Bank staff calculations.Note: The classifications refer to an assessment of health systems. Middle-income maturing includes data on China and Malaysia, middle- and low-income developing includes Thailand, Indonesia, Vietnam, and PNG.
2009/2010 2030 2050 2070
Ageing only
Middle income maturing*/ 5.0 7.4 10.3 12.7
Middle and low income, developing*/ 4.0 5.7 7.2 8.4
Ageing and access
Middle income maturing 5.0 8.0 11.6 14.5
Middle and low income, developing 4.0 6.2 9.3 12.9
Ageing, access, and cost growth
Middle income maturing 5.0 10.1 19.7 33.6
Middle and low income, developing 4.0 7.8 15.4 28.9
SECURING THE PRESENT, SHAPING THE FUTURE
V. HOW WILL AGEING AFFECT EAST ASIA’S GROWTH? 41

organization of health care delivery and the financing mechanisms can have very significant effects on overall costs. An active approach to old-age and increased access to preventive health care will ameliorate the effects of ageing by compressing the years of morbidity. Other policies that encourage more labor force participation through flexible working arrangement and improvements in child care systems will also help in this regard.
Another vital policy that will help is migration. A well-managed labor migration strategy will help ameliorate the impending labor shortages in some countries arising from these demographic changes, while providing opportunities for countries with excess labor to provide migrant workers and benefit from greater remittance flows (Box 6).
Box 6. Advancing labor mobility in East Asia: One scheme at a time
East Asia and the Pacific is one of the most integrated regions in the world in terms of goods and capital flows. The integration of labor markets within the region is lagging, as the legal flows of both skilled and unskilled people remain relatively small. The ASEAN declaration on migration has sought to give this issue priority by focusing the agenda on enhancing the mobility of skilled workers through a framework of regional accreditation of skills and supporting the mobility of unskilled workers by encouraging labor-sending and receiving countries to work together. The latter is considered particularly important because of its potential to reduce joblessness and poverty. Rising pressures to attract labor provide the opportunity to explore labor mobility for East Asia’s poor. Labor mobility is also one of the most contentious issues, with the popular perception often one of ill-managed illegal flows of labor accompanied by the social ills of wage depression, overstayers and anecdotes of worker abuse. If more progress is to be made in opening up labor markets to the poor, then mechanisms need to be found to address the concerns of labor-sending and receiving countries.
One such mechanism is the bilateral agreement (BLA) between countries to institute a temporary movement of persons (TMP) scheme. Such schemes have been instituted globally before but many of them failed. The failures teach valuable lessons, however, on how to design and implement such schemes. Indeed, a few best practice schemes now exist within East Asia with Singapore, Philippines and the Pacific islands demonstrating how sound policy and good institutional support can deliver results for all. Some of these lessons are:
Get the scheme design right by paying attention to the four Cs: cost, circularity, choice of workers 1. and commercial viability. Attention to the fixed costs of moving for the poor is paramount - the higher the costs, the longer it will take to recoup them. A circular scheme which allows multiple access opportunities to employment is likely to discourage overstaying and encourage workers to invest in skills. The appropriate choice of qualifications for the type of work selected is important. And linking access to foreign labor markets to commercial considerations rather than to inflexible quotas can reduce the social tide from turning against foreign workers.
Sending and receiving countries need to work together. 2. This entails attention on the sending country side to maintaining sound recruitment regulations, procedures and oversight, timely information dissemination to the workforce about foreign labor markets, their rights and obligations, pre-departure training, portability of benefits (if available) and repatriation procedures if they become necessary. Similarly, on the receiving country side, employers and support institutions need to be aware of their respective roles in recruitment, the contractual obligations of the work agreement, wages and any allowable deductions that have been negotiated in the BLAs such as airfare or other levies.
Measure the development impact of TMP schemes to gain wide support from the stakeholders 3. involved. This can be done through a systematic collection of data from a sample of migrants. Such efforts can be expensive and are of a long term nature, but can be justified since they generate evidence on the benefits and offer insights on which programs are working well and which ones need modifications.
Source: Manjula Luthria.
WORLD BANK EAST ASIA AND PACIFIC ECONOMIC UPDATE 2011, VOL. 1
42 V. HOW WILL AGEING AFFECT EAST ASIA’S GROWTH?

vI. rISIng InequalIty wIth hIgh growth and fallIng Poverty
Inequality is on the rise in several countries in East Asia, most notably in China. The good news is that poverty declined rapidly at the same time. The bad news is that rising inequality is contributing to social tensions and those left behind represent a significant waste of human potential. An important driver of inequality in East Asia has been the change in the sectoral composition of growth away from agriculture and toward industry and services, driven in part by increased global integration. Policies that broaden access to higher levels of education, facilitate labor mobility, and connect leading and lagging regions will serve to simultaneously stem rising inequality and accelerate the pace of economic development and poverty reduction.
Inequality is rising
The unprecedented decline in poverty in East Asia and the Pacific during the past three decades has been accompanied by an increase in income inequality in several countries. Inequality has increased most dramatically in China but has also risen in countries as varied as Indonesia, Mongolia, Vietnam, and Cambodia even while inequality has tended to decline in many Latin American countries (Figure 58 and Figure 59). The Gini coefficient, which measures inequality, amounts to 48.2 percent in China, 45 percent in the Philippines, and 40 percent in Thailand, all higher rates than those that prevail in most countries in Eastern Europe and South Asia.20
As a result, the region’s policymakers are increasingly concerned about inequality and social mobility in their countries. While the region has less rigid social stratification than South Asia and while there is less inequality than in Latin America and Africa, policymakers fear that large and growing inequality, if left unaddressed, will polarize society, lead to social tensions, and eventually undermine the growth process itself. In the Philippines, the richest
20 Cross-country comparisons are fraught with difficulties as some use income based measures while others use consumption based measures. Definitions of consumption across space and time can also be different. Hence the figures above provides a rough approximation of economic inequality across countries.
figure 58. Inequality is high and rising in some countries…
changes in Gini coefficients
Start of period End of period
Sources: National Household Income and Expenditure Surveys, and East Asia Poverty Database.Note: The start and end dates are: China (1989–2004), Philippines (1997–2006), Cambodia (2004–07), Thailand (1998–2009), Vietnam (1998–2008), Indonesia (1999–2009), Lao PDR (1997–2008), Mongolia (2002–07), Timor-Leste (2001–07).
figure 59. …and exceeds levels in Eastern Europe and South Asia….Gini coefficients in the mid to late 2000s
Gini coefficient in mid to late 1990sAfrica East Asia East Europe & Central AsiaLatin America Middle East & North Africa South Asia
Sources: Povcalnet, SEDLAC, and East Asia Poverty Database.
60
50
40
30
-
20
10
Indonesia Timor-LestePhilippines ThailandChina Cambodia MongoliaLao PDRVietnam 20 30 40 50 60
60
55
50
45
40
35
20
30
25
Rising Inequality
Falling Inequality
SECURING THE PRESENT, SHAPING THE FUTURE
43

20 percent of the population outspend the poorest 20 percent by about nine times, in Cambodia by about eight times, and in Thailand by about seven times (Figure 60). Asset inequalities are probably larger. Such large disparities, especially when perceived to be generated in ways lacking legitimacy, have the potential to weaken social cohesion and fuel social strife. Further, if increasing inequality dampens the pace of poverty reduction, as it has already started doing in China, it can exacerbate the already stark differences between the poor and the non-poor. Rapidly rising inequality is particularly unsettling in transition countries with recent, more egalitarian pasts, as the unfolding of these disparities is likely to be much more apparent than in other countries.
Of special concern are inequalities in access to basic human services that affect current wellbeing and have the potential to cause long-term harm. Access to proper health care in the early stages of childhood, for example, can have lasting effects on both physical and mental development. These effects can, in turn, affect children’s future productivity, earnings, and economic well-being. Poorer households in Cambodia, Vietnam, Indonesia, and the Philippines have significantly less access to primary care and experience higher under-five mortality rates than better-off households (Figure 61).
Concern about inequality has led several governments in the region to take action. Countries such as China are now deliberately pursuing policies to promote more “harmonious” social outcomes, and even historically unequal countries such as the Philippines have recently launched social transfer programs aimed at reducing disparities in access to basic education and health.
While markets lead to inequality based on effort, skills, and innovation, international experience suggests that there is considerable diversity in growth and inequality paths across countries. Public policies can play an important role in shaping those pathways. China’s experience offers little support for the view that there is an aggregate trade-off between inequality and growth. While it is true that inequality has tended to rise over time, the periods of more rapid growth were not accompanied by more rapid increases in inequality: periods of falling inequality (1981–85 and 1995–98) were those with the highest growth in average household income.21 Similarly,
21 Ravallion (2010).
figure 60. Disparities in expenditures between the richest and the poorest 20 percent are largein 2005 U.S. dollars PPP
Richest 20% Poorest 20%
Sources: Various Household Income and Expenditure Surveys, and East Asia Regional Poverty Monitoring Database.
Indonesia2009
Timor-Leste2007
Philippines2006
Thailand2009
China2008
Cambodia2007
Mongolia2008
Lao PDR2008
Vietnam2008
20181614121086
0
42
3.80
0.84
4.65
0.78
6.00
1.14
6.68
1.09
8.08
2.10
7.00
0.87
8.59
0.91
9.61
1.61
18.16
2.55
figure 61. Under-five mortality rates are higher for poorer groups
mortality per 1,000 births
expenditure quintileCambodia 2000 Indonesia 2002–03 Philippines 2003 Vietnam 2002
Source: World Bank staff estimates based on Health Nutrition and Population Statistics.
Low High2nd 3rd 4th
160
120
0
80
40
WORLD BANK EAST ASIA AND PACIFIC ECONOMIC UPDATE 2011, VOL. 1
44 VI. RISING INEQUALITY WITH HIGH GROWTH AND FALLING POVERTY

Brazil, a country with historically high levels of income inequality, experienced declines since the mid-1990s alongside modest growth.22
Changing economies, changing wage premia, and rising inequality
One factor driving changes in income distribution in East Asia is the realignment of activity away from agriculture and towards industry and services. During the last decade, growth in industry and services far outpaced growth in agriculture in all of the countries in the region. In China, growth in the industry and services sectors has generally outpaced agricultural growth rates for the last 25 years.23
Skill premiums are rising across the region and are now contributing to increased inequality. The skill premium is still rising because the growing demand for skills is not being matched by increasing supply (Figure 62 and Figure 63). This is particularly true for China, Cambodia, Mongolia and Vietnam. In Mongolia, skills shortages have been amplified by emigration of skilled labor. In Indonesia, the Philippines, and Thailand, demand for skills is also on the rise but only moderately more than the availability of skilled workers.
Rising skills premiums mean that completing primary school is no longer enough to enable a worker to get a job. Inequalities in educational attainment in secondary and tertiary schooling have become an increasingly important source of eventual unequal incomes. Jobs are increasingly going to higher-skilled workers throughout the region, effectively leaving behind those with no advanced training. In China, a junior high school education and, in some instances, a senior high school education has become a de facto prerequisite for accessing any non-farm work, particularly in urban areas.24 While the region has made immense progress in making primary education accessible to all, access to post-secondary education is still uneven. In Thailand, for example, there is near equality in primary and secondary education, but post-secondary enrollment is even less equal than household consumption expenditures
22 Ferreira et al. (2008).
23 Ravallion and Chen (2007).
24 Ravallion (2010).
figure 62. The proportion of worker with skills have mostly increased…proportion of total workers with secondary education or more
China Indonesia Mongolia Vietnam
Source: Gropello, E. and C. Sakellariou, 2010.
figure 63. …as has the wage premium due to secondary educationreturns to post secondary education
China Indonesia Mongolia Vietnam
Source: Gropello, E. and C. Sakellariou, 2010.
0.9
0.8
0.7
0.6
0.5
0.4
0
0.3
0.2
0.1
1998 20071999 2000 2001 2002 2003 2004 2005 2006
0.8
0.7
0.6
0.5
0.4
0.3
-0.1
0.2
0.1
0
1998 20071999 2000 2001 2002 2003 2004 2005 2006
SECURING THE PRESENT, SHAPING THE FUTURE
VI. RISING INEQUALITY WITH HIGH GROWTH AND FALLING POVERTY 45

(Figure 64). In the rest of the region, there are important differences in secondary school enrollment between urban and rural areas, particularly in Cambodia, Indonesia, and Lao (Figure 65).
In China, the concentration of growth in urban areas is beginning to create a rural-urban divide in employment and earning possibilities. This development was exacerbated until recently by the much more rapid development that occurred in coastal areas than in inland areas (Figure 66 and Figure 67).25 As a result, most of income inequality in China (40 percent) is now accounted by rural-urban differences in income levels (Figure 68). However, in many of the other countries in the region including Timor-Leste, Lao PDR, Cambodia, Thailand, and Vietnam, intra-rural inequality predominates. Exceptions include Indonesia, the Philippines, and Mongolia where intra-urban inequality accounts for a major portion of total inequality. Nonetheless, it remains a fact that the poorest households in the region continue to rely on agriculture for their livelihoods while the wealthiest are more likely to be employed in the service sector (Figure 69). If productivity growth in agriculture lags and if the poor are less able than others to take advantage of new employment opportunities in growing sectors, then rural-urban inequality is also likely to increase in other countries in the region as well.
A lack of infrastructure linking urban areas with rural areas and other barriers to labor mobility have further accentuated inequality in some countries. For example, the hukou system of household registration in China means that people living in rural areas are not able to take advantage of the economic opportunities in urban areas. A lack of infrastructure linking the rural hinterland with production networks in coastal and other geographically favored areas means that firms and businesses located in rural areas face cost disadvantages when competing in both national and global markets.26 Public investments in infrastructure that increase geographical accessibility therefore have the potential to reduce inter-regional inequality. In fact, a slight reduction in inland-coastal disparity was detectable after 2000 in China when the government significantly increased infrastructure investments to connect the remoter western regions to the eastern coast
25 Fan S., R. Kanbur, and X. Zhang, 2010.
26 Zhang and Zhang (2003).
figure 64. Access to post secondary education in Thailand is even more unequal than incomeLorenz curve of gross school enrollment
cumulative % population in school age from poorest to richestEquality line Senior secondary Post-secondary Expenditure
Source: Thailand Socioeconomic Survey 2009.
0 10.2 0.4 0.6 0.8
1 1
0.8 0.8
0.6 0.6
0 0
0.2 0.2
0.4 0.4
cum
ulat
ive
% p
opul
atio
n in
sch
ool
from
poo
rest
to ri
ches
t
cum
ulat
ive
% e
xpen
ditu
res
from
poo
rest
to ri
ches
t
figure 65. Enrollment in secondary schools is uniformly lower in rural areasschool enrollment rate of 16–18 years old, in percent
Rural Urban
Source: East Asia Regional Poverty Database.
Indonesia2009
Timor-Leste2007
Philippines2006
Thailand2009
Cambodia2008
Mongolia2007
Lao PDR2008
Vietnam2006
10090807060504030
0
2010
WORLD BANK EAST ASIA AND PACIFIC ECONOMIC UPDATE 2011, VOL. 1
46 VI. RISING INEQUALITY WITH HIGH GROWTH AND FALLING POVERTY

Is rising inequality in East Asia inevitable?
Rapid technological progress and the continuing export orientation of East Asian countries means that the composition of growth of East Asian economies will continually change. The extent to which people are able to move between regions and sectors to take advantage of new and emerging sources of growth will determine how income and wealth are shared across the population. This will largely depend on how smoothly labor and other factor markets function to provide necessary information, signals, and incentives to all segments of the population. As segmentation and roadblocks in labor markets will increasingly exacerbate inequality, the quality of labor market policies pursued by governments in the region will matter even more.
Further technological progress will mean that all economic activities are likely to be skill-intensive in the future. Hence access to higher post-secondary education will have an important bearing on how inequality unfolds in the region. Public investments that increase access to quality secondary and post-secondary education will therefore
figure 66. Inland-coastal disparity in China has increased with global integration…trade ratio inland-coastal disparity index
Trade ratio Inland coastal disperity
Source: Fan S., R. Kanbur, and X. Zhang, 2010.
figure 67. …but regional inequality appears to be declining
Gini Coefficient and Theil Index
Gini Theil
Source: Fan S., R. Kanbur, and X. Zhang, 2010.
1950 20101960 1970 1980 1990 2000
80 4
70
60
3
503
402
302
0 0
20 1
10 1
1950 2000 20101960 1970 1980 1990
25
20
15
10
40
35
30
0
5
figure 68. Rural-urban inequality contributes most to total inequality in Chinadecomposition of Thiel Index by sectors
Rural-urban inequality Intra-rural inequalityIntra-urban inequality Theil index (RHS)
Source: East Asia Regional Poverty Monitoring Database, the World Bank.
figure 69. The poorest generally depend on agriculture
percent of households depending on agriculture as main occupation
Agriculture Industry Services
Source: East Asia Regional Poverty Monitoring Database, the World Bank.Note: Q1 and Q5 refer to the first and fifth quintile, respectively.
Indonesia2009
Timor-Leste2007
Philippines2006
Thailand2009
China2003
Cambodia2008
Mongolia2007
Lao PDR2008
Vietnam2006
100 0.4090 0.3580
0.3070
0.25600.2050
0.1540
0.1030
0.05
0 0
2010
IndonesiaTop
Philippines ThailandCambodiaBottom
MongoliaLao PDR Vietnam
10090807060504030
0
2010
Top Top Top Top Top TopBottom Bottom Bottom Bottom Bottom Bottom
SECURING THE PRESENT, SHAPING THE FUTURE
VI. RISING INEQUALITY WITH HIGH GROWTH AND FALLING POVERTY 47

be critical to ensuring that poor who face credit and other constraints to financing higher education are able to acquire the necessary skills to compete in the market place.
Internal migration will continue to be an important equalizing force in most countries. Industrial and service sectors will continue to expand as East Asian economies mature. This will mean that future growth centers will more likely be in bigger cities and in regions with favorable geography. Ability to migrate to these locations to either work or start a business will be critical for raising the income levels of those that live in less advantageous locations. Impediments to migration, whether ethnic, social, economic, regulatory, or geographic, will only accentuate inequality.
However, reducing regional disparities cannot be accomplished just through migration. First, level playing fields in accessing basic opportunities in health and education will be needed to ensure that inequality does not reflect deeper social or geographic exclusion. Provision of basic public services will therefore have to be spatially blind in this respect. There will also be many cases when infrastructural investments to connect towns, provinces and regions will provide lagging regions the cost advantage to compete. Fresh approaches will therefore be needed to identify the resource endowments and comparative advantage of each region. Fresh approaches will also be needed to assess which infrastructure investments will yield the highest payoffs in terms of increasing access to and integration with key markets, both domestic and international. Innovative ways must also be found to create institutions that promote and facilitate sustainable economic activities in less favorable locations.
Finally, social protection policies will be needed to assist the poorest and the most vulnerable. In some cases, short-term social transfers may be needed to help the poor to acquire the skills that they need to compete in new and emerging markets.
WORLD BANK EAST ASIA AND PACIFIC ECONOMIC UPDATE 2011, VOL. 1
48 VI. RISING INEQUALITY WITH HIGH GROWTH AND FALLING POVERTY

vII. InnovatIon for Stronger ProductIvIty growth
Faster growth in productivity is the key driver of economic growth in East Asia, especially as demographics become less favorable and countries move through middle-income status. Innovation, that is the transmission, absorption and commercialization of new ideas, will be crucial for this productivity growth. To innovate, firms need adequately educated and skilled workers, who can absorb and use innovative knowledge and processes. And both workers and companies need to be together for ideas to be transmitted and implemented. Cities therefore will need to become the true crucibles of innovation by exploiting the proximity of companies and workers, acting as knowledge exchanges, and providing capital for innovative but risky projects.
Productivity growth is lagging in most countries in the region
The middle-income countries of East Asia other than China have recorded slower productivity growth than countries with similar incomes in other regions. This slowdown appears to have accelerated since the 1997–98 Asian financial crisis (Figure 70). Boosting the pace of productivity growth will be crucial for the middle-income countries to move to high-income status.
Behind the aggregate slowdown, there is a substantial diversity in productivity across countries. This diversity reflects a variety of factors. Of those that are firm-specific, the level of innovation efforts a firm undertakes is the most important determinant of total factor productivity. Empirical evidence confirms that firms that spend on research and development have approximately 18 percent higher TFP than firms that do not, and product innovation is associated with 6 percent higher TFP. Indicators of access to more advanced technology—such as having internationally-recognized quality certifications or using foreign-licensed technology—similarly show higher TFP for more advanced firms.
Without educated workers, ideas would not emerge, get transmitted, adopted or implemented. One of the two most important determinants of firm-level innovation in East Asia is the education of workers. Other factors, such as the general investment climate, the regulatory system, crime rates, and restrictiveness of labor laws are also
figure 71. Innovation and education have the biggest impact on productivity in East Asiaimpact of constraints on TFP, in percent change
Micro (1–10 employees) Small (11–50 employees)Medium (51–200 employees) Large (200+ employees)
Sources: Enterprise Surveys and Dutz and O’Connell (2011).Note: Knowledge spillovers denote a composite factor that combines different ways of innovation transmission: introduction of new products, use of internet, etc.
141210864
201816
02
Regs &Corruption Education Knowledge &
Through TradeKnowledgeSpilloversFinanceCrime &
SecurityLaborRegs Infra
figure 70. Output per worker in East Asia’s middle-income countries other than China grew more slowly than in other regionsGDP per worker, constant 2000 dollars
Developing East Asia Developing East Asia excluding China ChinaMiddle income Lower middle income
Source: Bloom and Finlay (2009).
5,000
4,000
3,000
0
1,000
2,000
1991 1992 1993 1995 1996 1999 2000 2001 2002 2003 2004 20081994 1997 1998 2005 2006 2007
SECURING THE PRESENT, SHAPING THE FUTURE
49

important but are less significant (Figure 73). Availability and accessibility of financing also plays a role, especially for smaller firms. These are followed by regulations creating a competitive environment, and availability of innovation financing. This chapter turns to these components of innovation framework in more detail, after discussing the role of cities in facilitating innovation.
The middle-income countries other than China in the region are falling behind their peers on frontier innovation. Thailand and Malaysia, for example, have patens per capita that are below the average for their income group, and certainly are far below Korea during its take off. China, by contrast, is building up its technological capacity, as reflected in the fast growing number of patents issued by U.S. Patent Office (USPTO), and is now above its peers based on per-capita income (Figure 75).
figure 73. Firm-level innovation is heavily dependent on knowledge spillovers and education…cumulative absolute percentage impact on innovation
Micro (1–10 employees) Small (11–50 employees)Medium (51–200 employees) Large (200+ employees)
Sources: Enterprise Surveys and World Bank staff calculations.
40
30
20
70
60
50
0
10
Regs &Corruption Education Knowledge &
Through TradeKnowledgeSpilloversFinanceCrime &
SecurityLaborRegs Infra
figure 72. Competition with South Asia has intensified in all goods categories, except automotiveshare of overlapping trade values between South East Asia and India, percent
1995 2006
Source: Yusuf and Nabeshima (2010).Note: Technology classification is based on Lall (2000).
706050403020
1009080
010
Electronic& electrical
Otherlow-
technology
Textiles,garments,footware
AutomotivePrimaryproducts
Agriculture-based
Engineeringproducts
Otherresource-based
Otherhigh-
technologyProcessindustry
figure 74. Firms in East Asia innovate less on some measures
in percent
% of establishments using foreign-licensed technology% of establishments introducing a new product % of establishments using internet
Source: Brahmbhatt and Hu, 2010.
figure 75. Number of patents per capita in Thailand and Malaysia is lower than in Korea during its take-offpatents per 100,000 population
Log (GDP per capita)Korea Malaysia Thailand Philippines ChinaIndonesia Regression relation between patents and per capita income
Source: Brahmbhatt and Hu, 2010.
Latin AmericaSouth Asia East AsiaSub-SaharanAfrica
East Europe& Central Asia
Middle East &North Africa
80
70
60
50
40
30
0
20
10
0.20.180.160.140.120.1
-0.02
0.080.060.040.02
-1E-16
6.4 8.4 8.96.9 7.4 7.9
WORLD BANK EAST ASIA AND PACIFIC ECONOMIC UPDATE 2011, VOL. 1
50 VII. INNOVATION FOR STRONGER PRODUCTIVITY GROWTH

Innovation happens in cities
Innovation cannot happen in isolation. Without knowledge spillovers, firm-level innovation by large firms would have been 40 percent lower, and in the absence of knowledge transfers through trade, it would have been 10 percent lower. Larger firms are better able to benefit from access to global knowledge, while smaller firms needed to locate close to large firms to catch up. For example, for small firms the use of information and telecommunications technology in their vicinity is more important than their own efforts.
Strong economic growth in East Asia has been accompanied by rapid urbanization. Cities in East Asia absorb 2 million new residents every month and are projected to triple their built-up areas in the coming two decades. The pace of urbanization between 1980 and 2009 is comparable to that in today’s advanced economies during their rise in the nineteenth century, when they were at similar levels of per-capita income, but that pace is four times that of the high-income countries right now (Figure 76). By 2050, the total urban population of developing East Asia is expected to more than triple to about 70 percent from 1980, with urban dwellers set to increase by 640 million from 2009.
Industrial development that drove growth in East Asia during the last decades has been an exclusively urban phenomenon. In 1980, the urban population in China was 29 percent of the total living in 189 cities. This rose to 50 percent (counting migrants) in 2008 with 651 cities. Most of these cities are home to large manufacturers. For example, Tianjin (China) derives more than half of its growth from industry, facilitated by determined efforts to improve education at all levels. Enrollment rates in tertiary education, for example, grew from 9.9 percent in 2001 to 22.9 percent in 2007.27
In Chinese cities, the employment share in manufacturing, urban clustering, and access to international market are highly correlated with urban productivity. Proximity to Beijing, Shanghai or Hong Kong, China is as important to a city’s success in terms of urban productivity (Figure 78). It is links to markets that explain success, not city size.28 Indeed, 76 percent of urban exports of China are generated in cities with 2.5 million people or more.
27 Yusuf and Nabeshima 2010b, page 51.
28 Similar evidence is found in Brazil during 1970-2000 where city growth was primarily driven by market potential for goods, inter-city transport costs, and the population concentration in nearly towns and villages (Da Mata, et al., 2007).
figure 76. In some countries, urbanization rates doubled since 1980 change in urbanization rate, percentage points
1980–2000 2000–09 2009–25 (projected) 2025–50 (projected)
Sources: UN World Urbanization Prospects, 2009, and WDR 2009.
figure 77. In the middle-income countries, foreign firms innovate more than domestic firmspercent of firms innovating
Domestic Foreign Foreign-Dom Gap (RHS)
Sources: Enterprise Surveys, Dutz and O’Connell (2011).
0 2010 30 40 50 60
ThailandVietnam
Philippines
IndonesiaChina
Canada1880–1900
United Kingdom1830–50
MongoliaCambodia
Lao PDR
Indonesia 2003China 2003Philippines 2003Thailand 2007China 2002
Cambodia 2003Malaysia 2002
LaoPDR 2006 Korea, Rep. 2005
100 2590 2080
1570
1060
550
0
40
-5
30
- -10
2010
Malaysia 2007 Vietnam2005Thailand 2004 Mongolia 2004
SECURING THE PRESENT, SHAPING THE FUTURE
VII. INNOVATION FOR STRONGER PRODUCTIVITY GROWTH 51
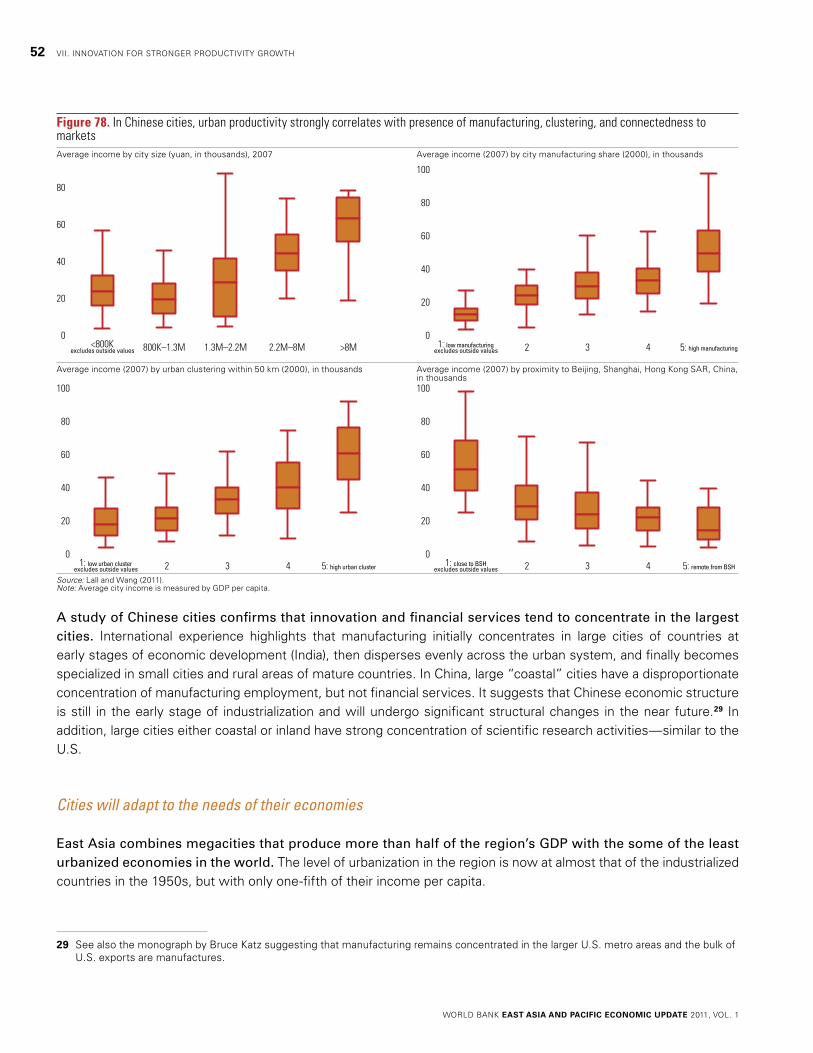
A study of Chinese cities confirms that innovation and financial services tend to concentrate in the largest cities. International experience highlights that manufacturing initially concentrates in large cities of countries at early stages of economic development (India), then disperses evenly across the urban system, and finally becomes specialized in small cities and rural areas of mature countries. In China, large “coastal” cities have a disproportionate concentration of manufacturing employment, but not financial services. It suggests that Chinese economic structure is still in the early stage of industrialization and will undergo significant structural changes in the near future.29 In addition, large cities either coastal or inland have strong concentration of scientific research activities—similar to the U.S.
Cities will adapt to the needs of their economies
East Asia combines megacities that produce more than half of the region’s GDP with the some of the least urbanized economies in the world. The level of urbanization in the region is now at almost that of the industrialized countries in the 1950s, but with only one-fifth of their income per capita.
29 See also the monograph by Bruce Katz suggesting that manufacturing remains concentrated in the larger U.S. metro areas and the bulk of U.S. exports are manufactures.
figure 78. In Chinese cities, urban productivity strongly correlates with presence of manufacturing, clustering, and connectedness to marketsAverage income by city size (yuan, in thousands), 2007 Average income (2007) by city manufacturing share (2000), in thousands
Average income (2007) by urban clustering within 50 km (2000), in thousands Average income (2007) by proximity to Beijing, Shanghai, Hong Kong SAR, China, in thousands
Source: Lall and Wang (2011).Note: Average city income is measured by GDP per capita.
40
20
80
60
0
2.2M–8M >8M1.3M–2.2M800K–1.3M<800Kexcludes outside values
4 5: high urban cluster321: low urban clusterexcludes outside values
40
20
80
60
0
100
40
20
80
60
0excludes outside values
100
4 5: high manufacturing321: low manufacturing
4 5: remote from BSH321: close to BSHexcludes outside values
40
20
80
60
0
100
WORLD BANK EAST ASIA AND PACIFIC ECONOMIC UPDATE 2011, VOL. 1
52 VII. INNOVATION FOR STRONGER PRODUCTIVITY GROWTH

In the next 20 years, continuing urbanization will raise several additional challenges in East Asia. Well-integrated economies have cities that spur growth in the rest of the economy through product and factor market connections. As urbanization continues, livability in the large cities tends to come under stress, and the trade-off between growth and congestion becomes more prominent. For smaller cities, integration with the world economy and with production networks becomes more important, especially through links already established by large clusters.
Livability and other factors make it likely that more than 60 percent of the projected increase in urban population in East Asia will settle in smaller cities with fewer than one million inhabitants. Some of the cities and clusters in the middle-income countries, such as Bangkok, Kuala-Lumpur, Zhangzhou and other interior cities of China, will also need to take advantage of the agglomeration economies and move up the value chain while competing with the large cities for educated workers and industrial locations. Connectivity to large cities will become a priority, given that growth is defined by linkages to international markets. Such improved connectivity will also reduce congestion in large cities and may mitigate inequality (see Chapter VI).
For all countries, but especially for the low-income ones, it is time to make irreversible decisions. Cities such as Manila, Hanoi, and HCMC will need to provide basic services and bring livability to a minimum level to set the trend for the century. Once each of these cities decides on a development path, whether it is low-carbon, high or low density, it will be hard to reverse. This reinforces the need for urban planning and investments in infrastructure for these cities.
In the future, two different trends might still emerge that depend on the developments of the East Asia’s production networks. The emergence of these networks was driven by reductions in transportation and communication costs, as well as large inflows of FDI and the substantial presence of multinational corporations in the region.
Developing East Asia can continue to catch up with the region’s advanced economies in terms of industrialization. However, even during the recent boom, no new clusters have emerged in South East Asia. Apart from deepening industrial agglomerations in China, Hanoi and Haiphong, HCMC and Danang clusters in Vietnam, most of the developments in manufacturing happened though the deepening of the exiting linkages, subsectors, and markets.
Education ensures absorption capacity
The importance of education for innovation lies in the ability of skilled workers to better absorb and retain knowledge and ideas.30 As the technology becomes more skill biased and competitive pressures intensify, entrepreneurs and managers need more than secondary level education and they must employ larger numbers of skilled workers, some with higher degrees.31 Indeed, more technologically advanced and innovating firms hire on
30 This section is based on World Bank (forthcoming) Flagship on Tertiary Education in East Asia and Pacific, and Yusuf and Nabeshima (2010c).
31 This has been noted by Glaeser (2007) and Berry and Glaeser (2005). More highly educated entrepreneurs hire workers with a higher level of skills because of the nature of the businesses they start.
SECURING THE PRESENT, SHAPING THE FUTURE
VII. INNOVATION FOR STRONGER PRODUCTIVITY GROWTH 53

average more skilled workers (Figure 79 and Figure 80). As economies move up the ladder of technology and the gap between them and the front runners’ narrows, the need for education and skills at all levels grows.32
Demand for tertiary education graduates has been generally on the rise in the region. The steep increase in tertiary education premiums in Cambodia, Vietnam, and China, together with gradually rising tertiary education workers, indicates growing demand (Figure 82, Figure 83, and Figure 84).33
Enrollment in tertiary education in the middle-income countries in the region is low compared to the OECD countries, but it is at par with the world average for similar income levels. More than enrollment rates, it is the quality of education and the level of practical skills that matter for the capacity to innovate (Figure 84). The importance
32 Vandenbussche, Aghion and Meghir (2006) draw attention to the greater returns from investment in skills and research as a country approaches the technological frontier.
33 World Bank (forthcoming).
figure 79. No country transited to high income without higher educationpercent
Sources: Enterprise Surveys, World Bank (forthcoming), Almeida (2009b).
figure 80. Innovators hire more tertiary educated workers
share of workers with higher education, in percent
Sources: Enterprise Surveys, World Bank (forthcoming), Almeida (2009b).
100
80
60
-
40
20
- 10,000 20,000 30,000 40,000 50,000 70,00060,000
CambodiaLao PDRIndonesia
China
Philippines
ThailandMongolia
Korea
Hong Kong SAR, China
Japan
Finland
New Zealand Australia
United States
DenmarkIceland
SwedenBelgium
France
UKAustria
Ireland
Switzerland
Netherlands
SpainItaly
OECD
Europe & Central Asia
Upper middle income
Middle East & North AfricaMiddle income
Sub-Saharan AfricaLow income
60
50
40
30
0
20
10
0 10 20 30 40 50 60
IDN
KOR
PHLTHA
CHNMYS
VNM KHM
figure 81. Science scores in the middle-income countries are lower than world averageeighth-grade TIMSS scores for science
Reading Science 2007 International average
Sources: WDI and World Bank Staff calculations.Note: TIMSS denotes Trends in International Mathematics and Science Study.
figure 82. Dynamics of wage premiums for tertiary educated workers show strong demand, especially in the low income countrieswage premium for tertiary educated workers in comparison to primary educated
1990s 2000s
Source: Di Gropello and Sakellariou (2009).Note: Different years are used.
600
500
400
300
200
100
0IndonesiaMalaysia PhilippinesThailandHong Kong
SAR, ChinaKoreaSingapore Taiwan,China
Shanghai,China Japan United
StatesIndonesiaVietnam Philippines ThailandChinaCambodia Mongolia
1.6
1.4
1.2
1.0
0.8
0.6
0
0.4
0.2
WORLD BANK EAST ASIA AND PACIFIC ECONOMIC UPDATE 2011, VOL. 1
54 VII. INNOVATION FOR STRONGER PRODUCTIVITY GROWTH

of this is reconfirmed by the performance of East Asian students in mathematics: in the middle-income countries scores are lower than the international average (Figure 81). For example, Thailand does not innovate as its enrollment rates or income per capita suggest based on international evidence, indicating issues with the quality of education or its transfer to productive skills base.34 And even with high enrollment in tertiary schools in Thailand and in the presence of unemployment, it still takes up to 7.5 weeks to fill a skilled vacancy.
Links to universities, entrepreneurship and competition are also transmission channels
The technology nexus supported by strong linkages between industry and universities is an essential part of a modern innovation framework. While large firms depend mostly on their own research and development for innovative activities, small- and medium-size firms exploit knowledge created in the industry and in universities.35
Improving university quality can increase the absorptive capacity of entrepreneurs and strengthen innovation framework, especially in middle-income countries. Only 9 out of the 50 best universities in the world are in East Asia.36 Only Korea, Singapore and Japan have numbers of scientific articles per capita that are comparable to those of industrialized countries. The middle-income countries in the region, except China have substantially fewer published scientific articles per capita than comparable countries in other regions, such as Mexico, Brazil, or South Africa.
The geographic proximity of universities and corporate research is important, but once it is established the curricula need to also be tailored to the industry needs. There are several ways by which universities can influence innovative capacity of firms in addition to educating and encouraging entrepreneurship (Table 7).
Firms that face strong competition are much more likely to innovate than those reporting no such pressure. The innovative activity of small- and medium-sized firms tends to be greater where there is a strong presence of knowledge spillovers. Clusters are formed by entrepreneurs, and so positive economic returns must be linked to
34 See Thailand Economic Monitor, November 2010.
35 Audretsch and Feldman (1994).
36 According to the Times Higher Education Supplement.
figure 83. It is increasingly harder to hire educated graduates that fit the job, except in Malaysiatime to fill professional vacancies, weeks
Previous year Most recent year
Source: World Bank (forthcoming).
figure 84. Even with high enrollment and substantial unemployment, it is hard to fill skilled vacanciestime to fill professional vacancies, weeks unemployment of tertiary graduates, percent
Time to fill skilled vacancies - most recent Unemployment of tertiary graduatesEnrollment rate (right axis)
Source: World Bank (forthcoming).
8
7
0
1
6
5
4
3
2
IndonesiaPhilippines Thailand MalaysiaMongolia
14
12
0
10
8
6
4
2
60
50
40
30
20
10
0IndonesiaVietnam Philippines ThailandChinaCambodia Malaysia Mongolia
SECURING THE PRESENT, SHAPING THE FUTURE
VII. INNOVATION FOR STRONGER PRODUCTIVITY GROWTH 55

entrepreneurial activity. Entrepreneurial activity is determined by the number of startup rates (especially for SMEs), population density, population growth, skill and human capital levels of the labor force (high share of skilled workers), low unemployment, and the average establishment size has negative impact on startup rates. Start-up rates and exit rates have been shown to contribute positively to productivity growth, controlling for imperfect competition and extent of scale economies. Reflected in the number of procedures required to start a business, firms in East Asian countries are facing better competition now than in 2004.
table 7. Channels to enhance knowledge spillovers
Source: Porter (2008), cited from Yusuf and Nabeshima (2010c).
Licensing Spin-offs Technology transfer offices
Technology brokers Science parks Incubators
Support for graduate entrepreneurship Research contracts and consultancy Collaborative research
External training Mobility programs for research staff Student placement in enterprises
Technology centers Technology networks Venture capital funds
Cluster initiatives
WORLD BANK EAST ASIA AND PACIFIC ECONOMIC UPDATE 2011, VOL. 1
56 VII. INNOVATION FOR STRONGER PRODUCTIVITY GROWTH

vIII. energy SecurIty, envIronmental SuStaInabIlIty, and clImate change
The East Asia and Pacific region is facing fundamental challenges related to environmental sustainability, energy security, and climate change. Carbon dioxide emissions per capita have more than tripled in the region over the past 20 years, making East Asia’s cities among the world’s most polluted. Some of the largest emitters of greenhouse gases on the planet are in the region and will need to embrace policies to mitigate the impact of the pace and pattern of their growth on climate change. At the same time, the region will need more energy than in the past. Most of this energy will come from coal even as the region’s dependence on oil and gas imports increases. Unsurprisingly, then, the adoption of green technologies has become one of the highest medium-term priorities in the region to achieve all three objectives—energy security, environmental sustainability, and mitigation of climate change effects. Finally, the East Asia and the Pacific region also has to deal with the impact of climate change. This report examines only one aspect of this broad agenda. Given rapid ongoing urbanization, and the rising extent and cost of natural disasters, increasing the resilience of large and small cities to extreme climate events, rising sea levels, and other natural hazards has emerged as a major medium-term challenge.
Ensuring environmental sustainability
As a result of fast economic growth and rapid urbanization, energy consumption has more than tripled over the past three decades and is projected to more than double over the next two. East Asia is also home to some of the world’s most polluted cities (Figure 85 and Figure 86). East Asia needs an energy future that not only enhances the region’s energy security, but also contributes to improving the local and global environment. Such a sustainable energy future requires a low-carbon growth path with least abatement costs, compared to a continuation of current policies (Box 7). It can be done by leapfrogging to a low-carbon urbanization model that focuses on clean energy supply, compact city design, enhanced public transport, green buildings, and clean vehicles. The first step is to increase energy efficiency. The second step requires a four-fold increase in the share of low-carbon technologies in power generation (renewable energy and nuclear) from the current 17 percent to 50 percent in 2030. This requires a net additional average investment of $80 billion per year from now to 2030, or an average 0.8 percent of GDP. The third is the need to build low-carbon cities. Consider each in turn.
figure 85. Energy consumption surged in East Asia and Pacific, due to fast growth and urban industrialization1980–2004, in million tons of oil equivalent
East Asia Latin America Middle East & North AfricaSouth Asia Sub-Saharan Africa
Sources: WDI and Wang and others, 2011.
figure 86. East Asian cities already have relatively high pollution levelsGHG emission per capita
Sources: Wang and others 2011 based on data from World Bank: Cities and Climate Change: an Urgent Agenda, 2010b.
1980 1986 1992 1998 2004
2,500
2,000
1,500
0
1,000
500
ChinaJakartaBeijing
BangkokTianjin
ShanghaiHong Kong SAR, China
StockholmTokyo
SingaporeLondon
New York CityLos Angeles
0 5 10 15
SECURING THE PRESENT, SHAPING THE FUTURE
57

Box 7. The choice of energy future in East Asia
Sustaining economic growth without compromising the environment is the greatest energy challenge facing East Asia and the Pacific over the next two decades. Emissions of local air pollutants and CO2 will double by 2030, if current policies simply continue. China will continue to rely heavily on coal, which already meets 70 percent of its energy demand. And the other large countries in the region plan to significantly expand the role of coal. But coal is the most polluting fuel. As a result, the expansion of coal use will increase local air pollution and acid rain, and exacerbate climate change.
Energy security concerns will be heightened over rising price volatility and exposure to supply disruptions. By 2030, if business as usual continues, imports of oil and gas will grow across the region. China is expected to import 75 percent of its oil and half of its gas by 2030. Malaysia and Vietnam are projected to switch from net energy exporters to net importers. Thailand and Philippines are expected to import 60-70 percent of their energy.
Energy efficiency
Market-based pricing reforms are fundamental to an efficient, sustainable, and secure energy sector. The energy price is crucial to stimulating energy efficiency improvements, discouraging energy waste, mitigating rebound effects, and encouraging clean fuels. Governments need to (i) remove fossil fuel subsidies (in 2007, fossil fuel subsidies in East Asia and Pacific amounted to $70 billion, close to the estimated $80 billion in net financing required for a sustainable energy path);37 (ii) internalize environmental costs through appropriate use of a fuel tax and/or a carbon tax; and (iii) provide incentives to invest in end-use energy efficiency to overcome the first-cost barriers, such as investment subsidies, soft loans, consume rebate, and tax credit.
Pricing and fiscal policies should go hand in hand with regulations and their strict enforcement. Regulation is one of the most cost effective measures to improve energy efficiency. Mandatory economy-wide energy-intensity targets, appliance standards, building codes, industry performance targets (energy consumption per unit of output), and fuel-efficiency standards are among the most cost-effective measures. However, weak enforcement of regulations
37 IEA 2008.
figure 87. CO2 emissions will double for all countries by 2030
in million tons of CO2
East Asia 5 China Indonesia Thailand Malaysia Vietnam Philippines
Source: World Bank (forthcoming).
2010 2015 2020 2025 2030
16,000
14,000
12,000
10,000
8,000
6,000
0
4,000
2,000
China accounts for 85% of CO2
2010 2015 2020 2025 2030
2,500
2,000
1,500
0
1,000
500
WORLD BANK EAST ASIA AND PACIFIC ECONOMIC UPDATE 2011, VOL. 1
58 VIII. ENERGY SECURITY, ENVIRONMENTAL SUSTAINABILITY, AND CLIMATE CHANGE

It is technically and economically feasible for CO2 emissions to peak by 2025 in East Asia, provided that there are political will, institutional capacity, and transfer of financing and technologies from developed countries (Figure 88 and Figure 89). By 2030, CO2 emissions could reach 9.2 Gt under such a Sustainable Energy Development scenario (SED), 37 percent below the business-as-usual scenario (REF).
This low-carbon path can substantially reduce energy costs, improve public health, and enhance energy security. The savings from energy efficiency, many renewable energy technologies, and nuclear power can largely pay for their additional upfront investment. The environment can be substantially improved, with a 50 percent reduction in damage costs by 2030 (Figure 90). Energy security will also be improved by increasing fuel diversity and reducing imports (Figure 91). Renewable energy can hedge against fossil fuel price volatility.
However, improving environmental sustainability and enhancing energy security have trade-offs. Adopting the most efficient coal-fired power plants and installing pollution abatement equipment can mitigate local air pollution but will mean higher up-front costs. In the long term, the future role of coal in a carbon-constrained world will increasingly depend on widespread use of carbon capture and storage (CCS)—a promising technology that is yet to be proven on a large scale.
Box 7. (continued)
Source: World Bank 2010a.
figure 89. Power generation will need to shift dramatically from coal to renewable energy and nuclear
Coal Gas OilNuclear Hydro Non-hydro renewables
figure 88. CO2 emissions could peak by 2025, and energy efficiency and low-carbon technologies can fill the gap
REF Energy efficiency Low-carbon technology SED
0 6030 70 80 90 10040 5010 20
2007
2030 SED
2030 REF
Coal 37%
Coal 69%
Coal 73%
2009 2012 2015 2018 2021 2024 2027 2030
16
14
12
10
8
6
0
4
2
figure 91. Energy imports in 2030figure 90. Local environmental damage costs in 2030
1,200
1,000
800
600
400
-600
200
-200
REF SED
-
-400
140
120
100
80
60
0
40
20
REF SED
SECURING THE PRESENT, SHAPING THE FUTURE
VIII. ENERGY SECURITY, ENVIRONMENTAL SUSTAINABILITY, AND CLIMATE CHANGE 59

is a concern in many East Asia and Pacific countries. A champion institution, such as a dedicated national agency for energy efficiency, can coordinate multiple stakeholders, implement energy efficiency programs, and raise public awareness. But it requires adequate resources, ability to engage multiple stakeholders, independence in decision-making and credible monitoring of results.38
Low-carbon technologies
Scaling up renewable energy requires a combination of financial incentives, a fossil fuel tax, or carbon tax to provide a level playing field. Additional financial incentives could include reducing capital and operating costs through investment or production tax credits; improving revenue streams with carbon credits; and providing financial support through concessional loans and guarantees. But an effective regulatory framework will be essential to scale up renewable energy. International experience demonstrates three ingredients for success: (i) adequate tariff levels with long-term power purchase agreements; (ii) mandatory access to the grid for independent power producers; and (iii) incremental costs between renewable energy and fossil fuels, if any, to be passed through to consumers.
Nuclear power is another significant option for mitigating climate change, but it is limited by four problems.39 These are relatively high costs, risks of nuclear weapons proliferation, uncertainties about waste management, and public concerns about reactor safety. Current international safeguards are inadequate to meet the security challenges of expanded nuclear deployment. But the next generation of nuclear reactor designs offer improved safety characteristics and better economics than the reactors currently in operation.
Low-carbon cities
The speed and scale of urbanization in East Asia presents an unrivalled opportunity to build low-carbon cities. As East Asia urbanizes further, its urban population is expected to increase from 46 percent to 60 percent by 2030.40 CO2 emissions per capita in East Asian cities, such as Bangkok, Beijing, and Shanghai, are already among the highest in the world (Figure 92).
Building a low-carbon city requires clean energy supply, compact urban designs, efficient buildings, public transport, and clean vehicles. Smart urban planning—higher density, more spatially compact, and more mixed-use urban design that allows growth near city centers and transit corridors to prevent urban sprawl—can substantially reduce energy demand and
38 ESMAP 2008.
39 Since 1982, the World Bank has not funded nuclear power plants, or any assets related to nuclear power (fueling, decommissioning, transmission lines from nuclear plants, and others.)
40 UNFPA, 2007.
figure 92. East Asian cities should avoid the high carbon growth pathcarbon dioxide emissions, 2005 (metric ton per person)
Source: World Bank: Cities and Climate Change: an Urgent Agenda, 2010b.
25
20
15
0
10
5
20 6030 70 80 90 10040 50
Russian Federation
Nigeria
India
JapanGermany
Korea, Rep.
Brazil
UnitedStates
China
Higher Carbon Growth Path?
Lower Carbon Growth Path?
WORLD BANK EAST ASIA AND PACIFIC ECONOMIC UPDATE 2011, VOL. 1
60 VIII. ENERGY SECURITY, ENVIRONMENTAL SUSTAINABILITY, AND CLIMATE CHANGE

CO2 emissions (Figure 93). More efficient vehicles (meeting, say, the EU’s fuel economy standards), coupled with urban planning, public transport, and pricing policies can reduce energy use and emissions in the transport sector by 38 percent by 2020. Shifts to mass transit also have large development benefits of time savings in traffic, less congestion, and reduced local air pollution.
Rapid urbanization demands more resilient cities
Climate change complicates East Asia’s quest for continued rapid growth. Living with the consequences of a changing climate—the adaptation agenda—is as important as the mitigation agenda. And nowhere is the adoption and implementation of an adaptation agenda more important than in East Asia’s urban centers, the concentration of increasingly larger share of output and population. These agglomerations are under the grave threat of extreme weather events, rising sea levels and other natural hazards—some of which, such as earthquakes, are not climate-related.
East Asia covers half the earth’s surface area and is home to 59 percent of the world’s population, but it has experienced over 70 percent of the world’s natural disasters and sustained 82 percent of total disaster fatalities. Its population represents 85 percent of all people affected by disasters since 1997,41 and the exposure of populations to natural disasters is likely to double by 2050.
Climate change increases these risks, and East Asian cities face the brunt of climate change impacts due to their concentration of people and physical assets. These high risks also reflect the coastal location of many East Asian cities. East Asia is home to four of the top 10 most vulnerable cities in terms of exposed population: Guangzhou, Shanghai, Ho Chi Minh City, and Osaka-Kobe. Indeed, the countries of East Asia and the Pacific have the highest annual estimated cost of adapting to climate change amongst all six geographical regions in the world (Table 8).42 The coastal population of five countries in the region is highly vulnerable to sea level rise (Figure 94).43
41 EM-DAT: The Centre for Research on the Epidemiology of Disasters (CRED) International Disaster Database.
42 World Bank (2010), “The Economics of Adaptation to Climate Change: Synthesis Report”.
43 Prasad, N., F. Ranghieri, F. Shah, Z. Trohanis, E. Kessler, and R. Sinha. 2009.
figure 93. Low-carbon city comprehensive framework
Sources: Wang and others 2011.
Sustainable Life Style
UrbanForm
EnergyEfficiency
PublicTransport
RenewableEnergy
EconomicStructure
figure 94. The urban population in low elevation coastal areas is highly vulnerable to a rise of the sea level, 2000in millions
Source: Adapted from Prasad, N. et al., 2009.
90
80
70
60
50
40
30
0
20
10
Indonesia Vietnam PhilippinesThailandChina
SECURING THE PRESENT, SHAPING THE FUTURE
VIII. ENERGY SECURITY, ENVIRONMENTAL SUSTAINABILITY, AND CLIMATE CHANGE 61

In the short term, a risk-audit of critical infrastructure will help set priorities. Hazard proofing of infrastructure can prove effective, especially when warning times are short (Box 8). Appropriate codes can reduce the debilitating impacts of disasters on human safety and welfare. A fiscal risk audit can help assess the fiscal impact of natural disasters and the efficacy of existing budget instruments. Finally, ethnically and culturally appropriate multi-media communication strategies for natural hazards will help make all stakeholders are aware of the risks and of measures to reduce the risks.
In the medium-term (3–5 years) strengthening of early warning systems is a cost-effective measure for improving resilience. Every dollar invested in meteorological and hydrological services produces a significant economic return. The adoption and effective enforcement of risk-based land use planning can help control development in hazardous zones. Cities can also adopt comprehensive, end-to-end, emergency preparedness that includes pre-event mitigation, emergency warning, evacuation, and shelter areas and greening of infrastructure like permeable pavements and green spaces that reduce run-off and flooding. Resilience of existing public buildings (especially hospitals and schools) can be strengthened through a phased and fully funded retrofitting program. Titling program targeted at poor, informal communities have empirically been shown to improve risk mitigating investments in private housing. And other possible medium-term policy actions include the redesign of urban drainage infrastructure, and the development of a comprehensive disaster risk financing and insurance strategy, with a particular focus on the protection of public budgets against natural disasters (reserves, contingent credit, and aggregate insurance).
In the longer-term (5–10 years), the reduction of poverty will help reduce climate and disaster risks. Being poor dramatically increases one’s vulnerability to natural hazards.
table 8. Countries at risk from climate change effects
Source: World Bank staff.Note: Blue shade indicates countries in East Asia and Pacific.
Flood Storm Coastal 1m Coastal 5m
Bangladesh Philippines All low-lying Island States All low-lying Island States
China Bangladesh Vietnam Netherlands
India Madagascar Egypt Japan
Cambodia Vietnam Tunisia Bangladesh
Mozambique Moldova Indonesia Philippines
Lao PDR Mongolia Mauritania Egypt
Pakistan Haiti China Brazil
Sri Lanka Samoa Mexico Venezuela
Thailand Tonga Myanmar Senegal
Vietnam China Bangladesh Fiji
Benin Honduras Senegal Vietnam
Rwanda Fiji Libya Denmark
WORLD BANK EAST ASIA AND PACIFIC ECONOMIC UPDATE 2011, VOL. 1
62 VIII. ENERGY SECURITY, ENVIRONMENTAL SUSTAINABILITY, AND CLIMATE CHANGE

Box 8. Understanding risk and building urban resilience
Reducing the risk from natural hazards embodies four sequential actions:
1. Avoid the hazard, if possible
2. Provide credible information on hazard risk in cities
3. Withstand the effects of the hazard, and
4. Prepare for and recover from its impacts.
Avoid the hazardEven the natural hazards that cannot be prevented do not need to translate into a loss of life and property. Avoiding building in vulnerable areas is one way to avoid risk. Better identification and delineation of floodways and flood-prone areas, and implementation of appropriate land use planning and regulatory tools could lead to development patterns where fewer people, building stock, and supporting infrastructure are put at risk.
Provide credible information on hazard risk in citiesMandatory disclosure of risks is very effective in changing consumer behavior. Individual investment in mitigation increases with economic density, as people have more to lose with disruptions due to natural hazard events. Similarly, Early Warning Systems (EWS) save lives and have huge paybacks relative to cost. For example, the Jakarta Flood EWS has a strong focus on community capacity building and ensures the coordination of activities between front line providers (NGOs, community organizations) and local governments.
Withstand the Hazard’s Effects We live in “yesterday’s cities”. Many of the urban patterns we see today—roads, buildings, land ownership—reflect decisions of the past. One way to break out of this policy inertia is to explicitly allow city designs to evolve in response to new information. Another cost-effective way to ensure resilience is to retrofit buildings and ensure the survivability of infrastructure. An additional vulnerability of infrastructure that needs to be addressed is the interdependent nature of these systems.
Prepare for and Recover from the Hazard Even with rigorous preparation and planning, shocks are inevitable and therefore a framework for preparation and robust recovery after the event is necessary. This includes investing in institutional capacity, emergency preparedness, early warning systems, emergency communication systems, and urban search and rescue equipment. Related to this, cities and national governments need to design comprehensive catastrophe financing strategies that includes multiple sources of financing (both “on-balance sheet” and “off-balance sheet”) and risk transfer to the private sector through mandatory insurance programs.
SECURING THE PRESENT, SHAPING THE FUTURE
VIII. ENERGY SECURITY, ENVIRONMENTAL SUSTAINABILITY, AND CLIMATE CHANGE 63

country PageS and key IndIcatorS
c a mbodI a
Population 14.7 million
Population growth 1.7 percent
Surface area 181,040 sq. km.
Capital Phnom PenhSource: World Development Indicators.
Driven by exports, the Cambodian economy achieved a stronger than expected recovery in 2010, with estimated GDP growth at 6.7 percent. The strength of this recovery is driven by three factors. First, agriculture growth (5.3 percent growth in 2010) benefitted from a particularly good harvest. Second, two of Cambodia’s traditional growth drivers rebounded faster than expected. Garment exports registered a 24 percent growth in 2010 after shrinking 20 percent during the 2009 crisis. Similarly, footwear export industry also saw a nearly 60 percent expansion over the same period. As a result, some 55,300 new jobs have been created by both industries in 2010, recovering most of the jobs lost during the 2009 economic downturn. Tourism also rebounded strongly, with a 16 percent increase in tourist arrival (to 2.5 million tourists) and a 14 percent increase in tourism receipts (to $1.8 billion). The stronger than expected rebounded resulted from (i) strong growth in Asia, the source of 72 percent of tourist arrivals; (ii) depreciation of the dollar, driving competitiveness gains; and (iii) structural improvements (such as the prospect of more favorable rules of origin for garment exports to the EU; and gradual improvement in industrial relations). Third, Cambodia initiated some diversification of its production and export base, with the volume of milled rice exported almost tripling in 2010. This diversification was in particular supported
by a recovery in foreign investment with a 16 percent growth in registered investment capital. It is noted that the other traditional source of growth, construction and real estate, recovered much more mildly, with only a 10 percent growth in approved construction applications in 2010.
Growth is expected to remain strong in 2011, at 6.5 percent. Cambodia’s exports are expected to remain strong partly as a result of the relaxed rule of origin of the European Union on preferential tariffs for least-developed countries export to the EU markets which became effective on January 1, 2011. That said, overall export growth may be constrained by the profile of the global recovery. Consumption would pick up as the recovery takes hold, while investment would benefit from a continued rebound in FDI and credit to the private sector.
The current account widened in 2010 and is expected to be reduced in 2011. The widening of the current account deficit in 2010 (-13.4 percent of GDP) was largely driven by the trade deficit, as both imports and exports recovered strongly. As export and tourism growth continues to firm up, the current account balance would be reduced 13.1 percent of GDP in 2011.
Net capital inflows also increased in 2010, financing the external shortfall and resulting in a further increase in foreign exchange reserves. During the first nine months of 2010, net capital inflows rose by about $0.3 billion from a year earlier, reflecting a pickup in inflows of foreign direct investment and larger loans from foreign banks. It is expected that FDI would reach 5.4 percent of GDP in 2010 and 6.0 percent in 2011. Foreign exchange reserves continued to increase, to $2.7 billion at the end of 2010, equivalent to approximately 4 months of imports. Reserves amounted to 56 percent relative to the stock of broad money and 74 percent relative to gross external debt.
Despite price hikes in other countries in the region and a rapid domestic recovery, Cambodia consumer price inflation dwindled to 3.1 percent in 2010 (from 5.3 percent in 2009). Core inflation fell from 4.5 percent
WORLD BANK EAST ASIA AND PACIFIC ECONOMIC UPDATE 2011, VOL. 1
64
to 1.0 percent over this period. The exchange rate remained relatively stable, appreciating about 3 percent against the U.S. dollar, in the year ending 2010.
The financial sector started to recover with growth of credit to private sector gradually gaining momentum in 2010. Bank liquidity surged, as deposits—including those financed from remittances—rose to a high of $4.3 billion by the year ending 2010. The loan-to-deposits-ratio increased very slightly to 74 percent (up from 73 percent in Dec 2009) as lending opportunities remained limited. Most lending over the past 12 months was directed to low risk sectors, mainly retail/wholesale trades, tourism related activities (hotel/restaurants) and some manufacturing. Fourteen percent growth of net foreign assets and a nearly 30 percent expansion of credit to private sector were recorded in 2010 with a more robust prospect anticipated for 2011. Despite the tripling of capital requirements (effective January 1, 2011), the number of banks in Cambodia rose to 35 by the end of 2010 with total assets of $6.4 billion (with 8 larger banks accounting for 75 percent these assets), reflecting markets’ views on Cambodia’s growth potential.
The Royal Government of Cambodia started to unwind the expansionary policy that was introduced in 2009 to mitigate the negative impacts of the global financial crisis. The revenue effort, while low by international standards, rebounded in 2010 after a downturn in 2009 and is estimated to have reached 12.9 percent of GDP, nearly a percentage point above the budget plan. The growing revenue in 2010 was led by VAT, excise and import duties collections. The tax base is being broadened through a doubling of the road tax on vehicles, the introduction of a tax on property, and the shift to ad-valorem tax for import duty on some petroleum products. Anti-smuggling efforts have also been stepped up in recent months especially in log/timber smuggling. In the meantime, customs reform is ongoing with plans to roll out its ASYCUDA customs automated system from the current 5 functional sites to another 17 sites in the coming years. Expenditure at the same time is estimated at 18.6 percent of GDP with a fiscal deficit of 5.7 percent of GDP (down from
8.1 percent of GDP in 2009). This resulted from tighter control of wage bill expenditures (e.g. freezing new recruitment and promotion of civil service except in the education and health sectors) and cuts in non-essential recurrent expenditures (e.g. overseas trips, carrying out civil census to remove phantom civil servants from payroll).
The Government plans to keep the fiscal deficit at around 5.7 percent of GDP in 2011. Greater domestic revenue mobilization and continued high concessional borrowing would enable a continued high level of capital expenditure spending. It will also enable the implementation of elements of the “paddy production and rice export policy”, approved in 2010, including a Credit Guarantee scheme worth $37 million (to provide guarantee to companies or agencies that access credit from commercial banks for rice purchase particularly during the harvest season), an increase by $7.3 million of the capital of the Rural Development Bank, and an increase of $18 million for the Agriculture Support and Development Fund (which supports short-term credits to farmers and medium-term credits to rice millers). An important objective—which will require fiscal consolidation beyond the adopted 2011 budget—will be to rebuild the cash deposits that were used in response to the 2009 global crisis. This will require continued efforts to increase the fiscal space, in particular through domestic revenue mobilization.
SECURING THE PRESENT, SHAPING THE FUTURE
COUNTRY PAGES AND KEY INDICATORS 65

Cambodia Key Economic Indicators 2007 2008 2009 2010e 2011f 2012f
Year Year Year Year Year Year
Output, Employment and PricesReal GDP (% change y-y) 10.2 6.7 -2.0 6.7 6.5 6.5Domestic demand (% change y-y) 7.6 6.5 1.8 4.0 5.0 5.0Industrial production index (2000=100) 246 256 249 263 277 295
(% change y-y) 8.4 4.1 -2.5 5.7 5.1 6.5Consumer price index (% change y-y) 14.0 12.5 5.3 3.1 5.0 5.0Public SectorGovernment revenues (% GDP) 11.9 12.0 11.5 12.9 13.2 13.6Government expenditures (% GDP) 14.8 14.8 19.6 18.6 18.9 19.2Government balance (% GDP) -2.9 -2.9 -8.1 -5.7 -5.7 -5.6Foreign Trade, BOP and External DebtTrade balance (millions US$) -1,343 -1,801 -1,574 -1,600 -1,740 -1,966Exports of goods (millions US$) 4,089 4,708 4,302 5,200 5,876 6,640
(% change y-y) 10.7 15.2 -8.6 20.9 13.0 13.0Key export (% change y-y) 1/ 8.1 3.3 -19.0 24.0 8.0 8.0Imports of goods (millions US$) 5,432 6,509 5,876 6,800 7,616 8,606
(% change y-y) 13.8 19.8 -9.7 15.7 12.0 13.0Current account balance (millions US$) 2/ -705 -1,280 -1,203 -1,570 -1,660 -1,700
(% GDP) -8.1 -12.4 -11.6 -13.4 -13.1 -12.2Foreign direct investment (millions US$) 866 795 511 622 777 971External debt (millions US$) 3/ 2,555 2,808 3,054 3,514 3,839 4,220
(% GDP) 29.2 27.3 29.5 30.0 30.2 30.3Short-term debt (millions US$) 218 218 218 218 218 218Debt service ratio (% exports of g&s) 1.0 1.0 1.2 1.0 1.0 1.0Foreign exchange reserves, gross (millions US$) 1,616 2,164 2,367 2,653 2,860 3,003
(months of imports of g&s) 3.0 3.4 4.0 3.9 3.8 3.6Financial MarketsDomestic credit (% change y-y) 70.7 51.1 19.9 35.3 30.0 30.0Short-term interest rate (% p,a,) 4/ 16.0 15.8 15.0 15.0 .. ..Exchange rate (Riel/US$, eop) 4,003 4,081 4,169 4,053 ,, ,,Real effective exchange rate (2000=100) 95.1 111.7 111.3 108.0 .. ..
(% change y-y) 3.0 17.4 -0.4 -2.9 .. ..
Memo: Nominal GDP (millions US$) 8,754 10,286 10,361 11,713 12,701 13,932
Sources: National data sources, IMF, and World Bank staff estimates,
e = estimatep = projection1/ Garments2/ Excludes official transfers3 / IMF figures for 2010 onward4/ One-year US$ loans
WORLD BANK EAST ASIA AND PACIFIC ECONOMIC UPDATE 2011, VOL. 1
66 COUNTRY PAGES AND KEY INDICATORS
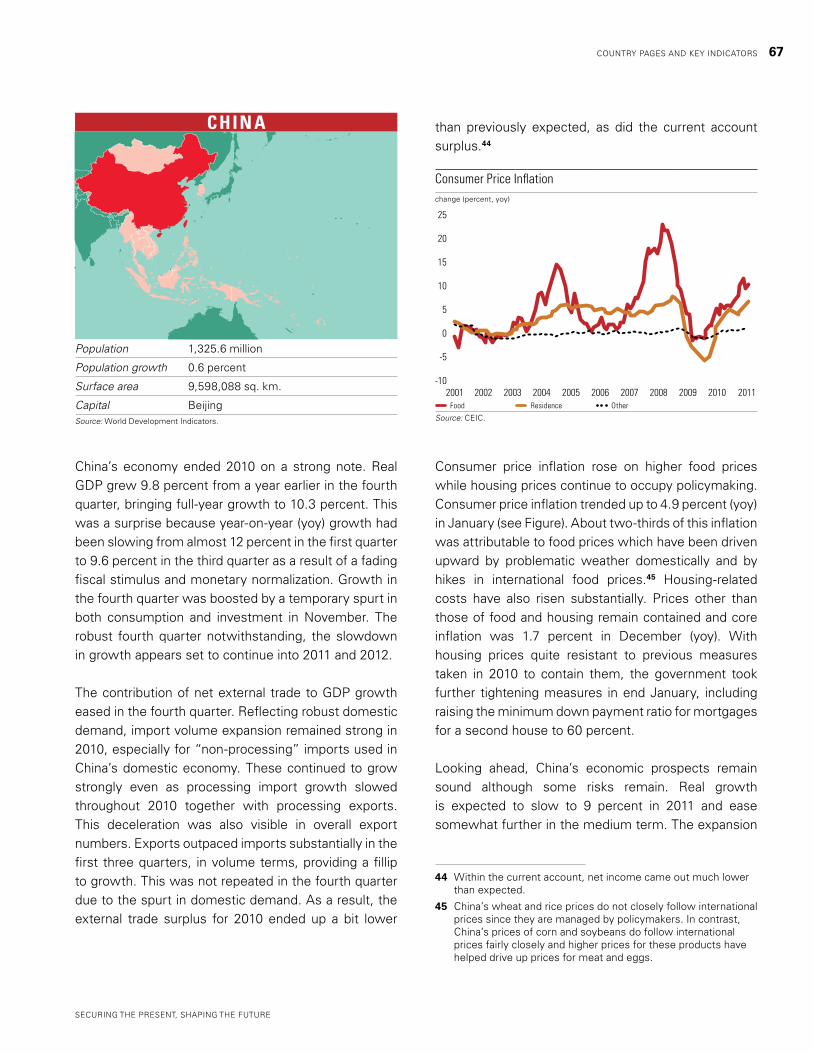
chIn a
Population 1,325.6 million
Population growth 0.6 percent
Surface area 9,598,088 sq. km.
Capital BeijingSource: World Development Indicators.
China’s economy ended 2010 on a strong note. Real GDP grew 9.8 percent from a year earlier in the fourth quarter, bringing full-year growth to 10.3 percent. This was a surprise because year-on-year (yoy) growth had been slowing from almost 12 percent in the first quarter to 9.6 percent in the third quarter as a result of a fading fiscal stimulus and monetary normalization. Growth in the fourth quarter was boosted by a temporary spurt in both consumption and investment in November. The robust fourth quarter notwithstanding, the slowdown in growth appears set to continue into 2011 and 2012.
The contribution of net external trade to GDP growth eased in the fourth quarter. Reflecting robust domestic demand, import volume expansion remained strong in 2010, especially for “non-processing” imports used in China’s domestic economy. These continued to grow strongly even as processing import growth slowed throughout 2010 together with processing exports. This deceleration was also visible in overall export numbers. Exports outpaced imports substantially in the first three quarters, in volume terms, providing a fillip to growth. This was not repeated in the fourth quarter due to the spurt in domestic demand. As a result, the external trade surplus for 2010 ended up a bit lower
than previously expected, as did the current account surplus.44
Consumer price inflation rose on higher food prices while housing prices continue to occupy policymaking. Consumer price inflation trended up to 4.9 percent (yoy) in January (see Figure). About two-thirds of this inflation was attributable to food prices which have been driven upward by problematic weather domestically and by hikes in international food prices.45 Housing-related costs have also risen substantially. Prices other than those of food and housing remain contained and core inflation was 1.7 percent in December (yoy). With housing prices quite resistant to previous measures taken in 2010 to contain them, the government took further tightening measures in end January, including raising the minimum down payment ratio for mortgages for a second house to 60 percent.
Looking ahead, China’s economic prospects remain sound although some risks remain. Real growth is expected to slow to 9 percent in 2011 and ease somewhat further in the medium term. The expansion
44 Within the current account, net income came out much lower than expected.
45 China’s wheat and rice prices do not closely follow international prices since they are managed by policymakers. In contrast, China’s prices of corn and soybeans do follow international prices fairly closely and higher prices for these products have helped drive up prices for meat and eggs.
Consumer Price Inflationchange (percent, yoy)
Food Residence Other
Source: CEIC.
2001 2002 20042003 20062005 20082007 20102009 2011
25
20
-10
-5
15
10
5
0
SECURING THE PRESENT, SHAPING THE FUTURE
COUNTRY PAGES AND KEY INDICATORS 67

should remain supported by healthy corporate and infrastructure investment and industrialization. Consumption should be buoyed by rising real wages and employment growth in the labor market. Growth may ease further, however, as global growth decelerates and the domestic macroeconomic stance is normalized further.
Inflation is unlikely to escalate but expectations matter and there are risks. Food prices are unlikely to continue to rise at the recent pace and inflation is unlikely to escalate as core inflation remains in check. The ability to absorb commodity input price shocks in China is enhanced by the capacity for rapid productivity growth46 and by rising wages which help reduce the real impact of price shocks in food and fuel. Moreover, core inflation has been low to start with because of the rapid productivity growth in industry. Nonetheless, with inflation expectations now having risen substantially and with the labor market less loose than it used to be, macroeconomic policy will need to play an important role in limiting the spill-over of food prices into other prices and wages. A less easy monetary stance would also help slow down property price increases.
Further normalization of the macroeconomic stance is needed to guard against risks. In addition to inflation and asset prices, other risks include the quality of banks’ portfolios and non-performing loans in particular. The authorities are broadly on track to normalize the overall monetary stance. As part of this process, they have started to raise interest rates, with three increases since October 2010, and have increased required reserves. International liquidity may at times pose challenges to monetary policy, but these should be more manageable in China than in emerging markets that are smaller or have more open capital accounts. Nonetheless, measures can be taken to enhance protection against unwanted capital flows.
46 Kim And Kuijs, 2007. Raw Material Prices, Wages, And Profitability In China’s Industry—How Was Profitability Maintained When Input Prices And Wages Increased So Fast?, World Bank China Research Paper No. 8
A mild withdrawal of stimulus is expected for 2011. The preliminary target for the 2011 fiscal deficit is 2 percent of GDP compared to the 2.3 outcome on a cash basis in 2010. Such a fiscal stance seems broadly appropriate, given the robust macroeconomic outlook.
The preparations for the 12th Five Year Plan (2011–2015) call for focus on structural issues and reforms. Changing the growth pattern is rightly a key target. The need to rebalance so that growth is led more by domestic demand, and by the service sector, seems stronger now than 5 years ago, in part because the international environment is less favorable. Such rebalancing will not happen by itself—this will require significant policy adjustment. Recent China Quarterly Updates discuss different elements of the reform agenda.
Private sector development should be a key area of focus. The November 2010 China Quarterly Update discussed policies that would help boost private sector development, focusing on opening up sectors and reducing entry barriers, addressing investment climate constraints, and supporting research and development and innovation by the private sector. Further progress in energy conservation and renewable energy calls for further rebalancing the pattern of growth, energy pricing reforms, more market-based mechanisms, lower cost of renewable energy, and accelerated development and diffusion of new energy technologies.
WORLD BANK EAST ASIA AND PACIFIC ECONOMIC UPDATE 2011, VOL. 1
68 COUNTRY PAGES AND KEY INDICATORS

China Key Economic Indicators2008 2009 2010e 2011f 2012f 2010 2010 2011
Year Year Year Year Year Q1 Q2 Q3 Q4 Oct Nov Dec Jan
Output, Employment and PricesReal GDP (% change y-y) 9.6 9.2 10.3 9.0 8.5 11.9 10.3 9.6 9.8 .. .. .. ..Industrial production index /1 .. .. .. .. .. .. .. .. .. .. .. .. ..
(% change y-y) 9.9 8.7 .. .. .. 19.8 16.0 13.5 13.3 13.1 13.3 13.5 ..Unemployment (%) 2/ 4.2 4.3 4.1 .. .. 4.2 4.2 4.1 .. .. .. .. ..Real wages (% change y-y) 10.4 12.4 .. .. .. .. .. .. .. .. .. .. ..Consumer price index (% change y-y) 5.9 -0.7 3.3 4.7 3.4 5.2 6.8 4.5 5.7 4.4 5.1 4.6 4.9Public SectorGovernment revenues (% GDP) 19.5 20.1 20.9 21.1 21.5 .. .. .. .. .. .. .. ..Government expenditures (% GDP) 19.9 22.4 22.5 22.8 23.0 .. .. .. .. .. .. .. ..Government balance (% GDP) -0.8 -2.8 -1.6 -1.7 -1.5 .. .. .. .. .. .. .. ..Domestic public sector debt (% GDP) /3 17.0 18.0 19.0 .. .. .. .. .. .. .. .. .. ..Foreign Trade, BOP and External DebtTrade balance (billions US$) 297.3 198.2 184.5 173.2 207.0 14.5 41.2 65.6 63.1 27.1 22.9 13.1 6.5Exports of goods (billions US$) 1,429 1,202 1,578 1,744 1,878 316.1 389.1 429.8 443.5 136.0 153.3 154.1 150.7
(% change y-y) 4/ 17.3 -15.9 31.3 10.5 7.7 28.7 40.9 32.2 24.9 22.8 34.9 17.9 37.7Key export (% change y-y) 5/ 16.8 -15.7 31.4 .. .. 28.3 40.8 32.5 25.2 23.0 35.0 18.6 ..Imports of goods (billions US$) 1,131 1,003 1,393 1,570 1,671 301.6 347.8 364.2 380.3 108.8 130.4 141.1 144.3
(% change y-y) 4/ 18.4 -11.3 38.9 12.7 6.4 64.7 44.1 27.4 29.5 25.4 37.9 25.6 51.4Current account balance (billions US$) 436.1 297.1 306.2 321.2 332.2 .. .. .. .. .. .. .. ..
(% GDP) 9.6 6.0 5.2 4.9 5.3 .. .. .. .. .. .. .. ..Foreign direct investment (billions US$) /6 108.3 94.1 105.7 .. .. 45.6 121.1 198.7 279.4 92.0 116.4 168.3 120.3External debt (billions US$) 390.2 428.6 .. .. .. .. .. .. .. .. .. .. ..
(% GDP) 8.6 8.6 .. .. .. .. .. .. .. .. .. .. ..Short-term debt (billions US$) 226.3 259.3 .. .. .. .. .. .. .. .. .. .. ..Debt service ratio (% exports of g&s) 1.8 2.87 .. .. .. .. .. .. .. .. .. .. ..Foreign exchange reserves, gross (billions US$) 1,952 2,405 2,853 3,120 3,574 2,453 2,460 2,654 2,853 2,767 2,774 2,853 ..
(months of imports of g&s) 20.7 28.8 24.6 23.8 25.7 97.6 84.9 87.5 90.0 25.4 21.3 20.2 ..Financial MarketsDomestic credit (% change y-y) 15.9 31.7 19.9 .. .. 21.8 18.2 18.5 19.9 19.3 19.8 19.9 18.5Short-term interest rate (% p.a.) 7/ 2.8 2.8 3.3 .. .. 2.8 2.8 2.8 3.3 2.8 2.8 3.3 3.3Exchange rate (RMB/US$, eop) 6.84 6.83 6.65 .. .. 6.83 6.82 6.75 6.65 6.67 6.66 6.65 ..Real effective exchange rate (2000=100) 110.3 104.7 109.7 .. .. 105.2 108.3 108.9 109.7 107.4 107.9 109.7 ..
(% change y-y) 12.9 -5.0 4.7 .. .. -7.2 2.3 2.4 4.7 0.2 1.5 1.8 ..Stock market index (Dec. 19, 1990=100)/8 1,821 3,277 2,808 .. .. 3,109 2,398 2,656 -159 2,979 2,820 2,808 ..
Memo: Nominal GDP (billions US$) 4,521 4,990 5,879 7,013 8,206 .. .. .. .. .. .. .. ..
Source: National data sources.
f = forecast1/ Annual data are not comparable with the quarterly and monthly data. Annual data cover all industrial enterprises while the quarterly and monthly ones only refer to those enterpriseswith sales value above RMB 5.0 million.2/ Official urban unemployment only, not including laid-off workers3/ Includes treasury bonds, policy financial bonds and other financial bonds (end-period outstanding)4/ Nominal growth rate5/ Manufactured exports6/ Gross FDI utilized7/ Central Bank loans to financial institutions, less than 20 days8/ Shanghai Stock Exchange A-Share Price Composite
SECURING THE PRESENT, SHAPING THE FUTURE
COUNTRY PAGES AND KEY INDICATORS 69
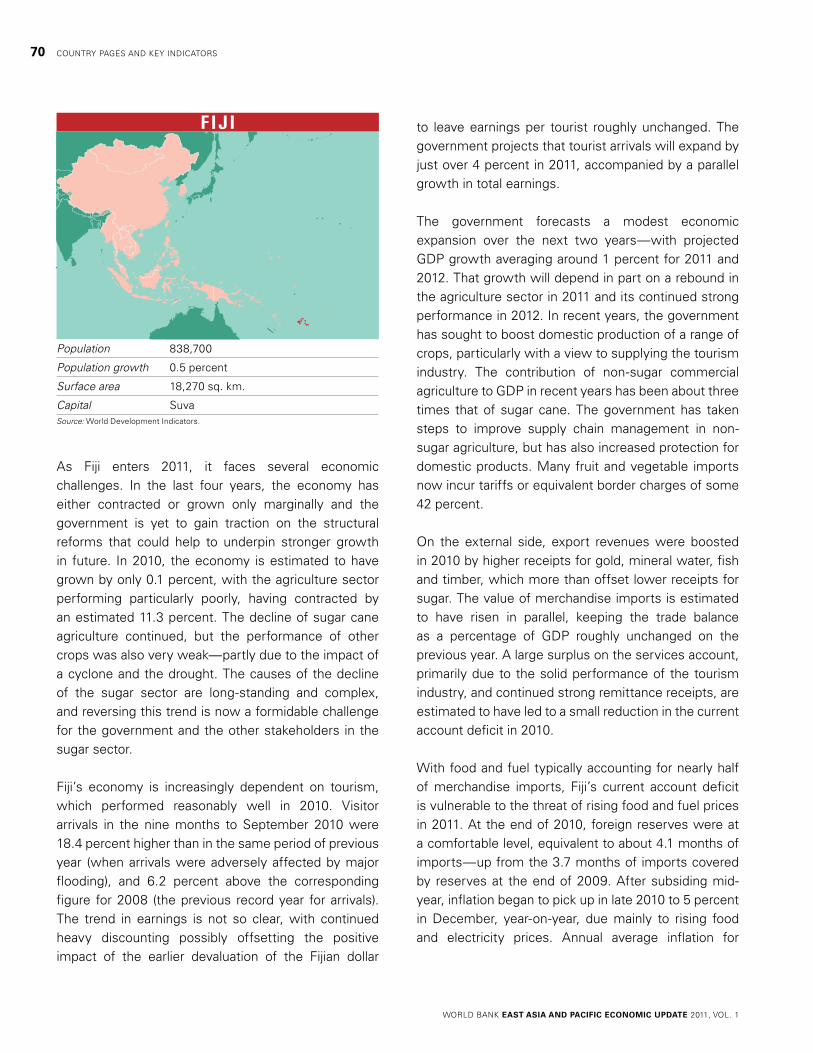
f I j I
Population 838,700
Population growth 0.5 percent
Surface area 18,270 sq. km.
Capital SuvaSource: World Development Indicators.
As Fiji enters 2011, it faces several economic challenges. In the last four years, the economy has either contracted or grown only marginally and the government is yet to gain traction on the structural reforms that could help to underpin stronger growth in future. In 2010, the economy is estimated to have grown by only 0.1 percent, with the agriculture sector performing particularly poorly, having contracted by an estimated 11.3 percent. The decline of sugar cane agriculture continued, but the performance of other crops was also very weak—partly due to the impact of a cyclone and the drought. The causes of the decline of the sugar sector are long-standing and complex, and reversing this trend is now a formidable challenge for the government and the other stakeholders in the sugar sector.
Fiji’s economy is increasingly dependent on tourism, which performed reasonably well in 2010. Visitor arrivals in the nine months to September 2010 were 18.4 percent higher than in the same period of previous year (when arrivals were adversely affected by major flooding), and 6.2 percent above the corresponding figure for 2008 (the previous record year for arrivals). The trend in earnings is not so clear, with continued heavy discounting possibly offsetting the positive impact of the earlier devaluation of the Fijian dollar
to leave earnings per tourist roughly unchanged. The government projects that tourist arrivals will expand by just over 4 percent in 2011, accompanied by a parallel growth in total earnings.
The government forecasts a modest economic expansion over the next two years—with projected GDP growth averaging around 1 percent for 2011 and 2012. That growth will depend in part on a rebound in the agriculture sector in 2011 and its continued strong performance in 2012. In recent years, the government has sought to boost domestic production of a range of crops, particularly with a view to supplying the tourism industry. The contribution of non-sugar commercial agriculture to GDP in recent years has been about three times that of sugar cane. The government has taken steps to improve supply chain management in non-sugar agriculture, but has also increased protection for domestic products. Many fruit and vegetable imports now incur tariffs or equivalent border charges of some 42 percent.
On the external side, export revenues were boosted in 2010 by higher receipts for gold, mineral water, fish and timber, which more than offset lower receipts for sugar. The value of merchandise imports is estimated to have risen in parallel, keeping the trade balance as a percentage of GDP roughly unchanged on the previous year. A large surplus on the services account, primarily due to the solid performance of the tourism industry, and continued strong remittance receipts, are estimated to have led to a small reduction in the current account deficit in 2010.
With food and fuel typically accounting for nearly half of merchandise imports, Fiji’s current account deficit is vulnerable to the threat of rising food and fuel prices in 2011. At the end of 2010, foreign reserves were at a comfortable level, equivalent to about 4.1 months of imports—up from the 3.7 months of imports covered by reserves at the end of 2009. After subsiding mid-year, inflation began to pick up in late 2010 to 5 percent in December, year-on-year, due mainly to rising food and electricity prices. Annual average inflation for
WORLD BANK EAST ASIA AND PACIFIC ECONOMIC UPDATE 2011, VOL. 1
70 COUNTRY PAGES AND KEY INDICATORS
2010 was 5.5 percent, compared to 3.7 percent in the previous year.
Indicators of investment activity in Fiji have remained weak. Uncertainty in respect of the political situation in Fiji is likely to continue to constrain investment in the near term. In the seven months to July 2010, imports of investment goods were 5 percent lower than in the same period of the previous year. In the ten months to October 2010, bank lending for investment purposes was 1.1 percent lower than the previous year. Overall, private sector credit growth has also remained subdued, with growth of only 2.2 percent in October 2010 compared with the same period of 2009. Although the construction sector is estimated to have expanded modestly in 2010, the government is forecasting a significant contraction in 2011.
The government is budgeting for a deficit equivalent to 3.5 percent of GDP for 2011, after an estimated deficit of 3.8 percent in 2010. On the revenue side, a substantial increase in the revenue share of GDP—by about 2 percentage points—is budgeted, primarily due to an increase in the VAT rate from 12.5 to 15 percent in 2011. Even without this rate increase, VAT receipts were estimated to be significantly higher in 2010 than in the previous year, due to a combination of inflation, improved compliance and increased consumption. A number of tariffs and equivalent border charges have also been increased in 2011. In addition, the government has introduced a 10 percent capital gains tax in 2011.
On the expenditure side, the government is continuing its efforts to reduce the proportion of the budget going to the civil service wage bill, with wage and partial hiring freezes in place. In 2010, wages and salaries as a share of current expenditure are estimated to have been 43.7 percent (compared to 47.5 percent the previous year), and are budgeted to fall to 41 percent in 2011. It will be important for the government to ensure that core functions and services receive priority among competing human resource demands and are kept sufficiently well staffed to operate effectively. In addition, efforts to ensure that the partial hiring freeze is implemented effectively will need to be strengthened,
in order to support the achievement of civil service reform objectives. Under capital expenditure, the largest item in the 2011 budget is a FJD110 million allocation to the Fiji Sugar Corporation (FSC) for restructuring purposes. This represents nearly 6 percent of total expenditure and around half of the projected budget deficit. Restructuring FSC and the wider sugar industry has proven very challenging in the past.
Persistent deficits in recent years have caused steady and significant increases in Fiji’s public debt, most of which is domestic and held primarily by the Fiji National Provident Fund. In 2010, Fiji’s public debt is estimated to have reached 57.6 percent of GDP (compared to 49.9 percent in 2007). In September 2011, Fiji will have a $150 million global bond due (4.5 percent of GDP), which the government is seeking to re-finance. Persistent losses by a few large public enterprises and government-owned corporations have also caused an increase in the contingent liabilities of the government in recent years. In 2010, contingent liabilities are estimated to have been 33.5 percent of GDP (compared to 24.8 percent in 2006). Over the last five years, the Fiji Electricity Authority and FSC have increased the government’s contingent liabilities by FJD 240 million and FJD 164 million, respectively (together accounting for nearly two-thirds of the increase in the government’s contingent liabilities between 2006 and 2010).
SECURING THE PRESENT, SHAPING THE FUTURE
COUNTRY PAGES AND KEY INDICATORS 71

Fiji Key Economic Indicators2007 2008 2009 2010e 2011f 2012f
Year Year Year Year Year Year
Output, Employment and PricesGDP (% change y-y) -0.9 0.2 -3.0 0.1 1.3 0.7Tourist arrivals (thousands) 540 585 542 630 650 665
(% change y-y) -1.6 8.4 -7.3 16.2 3.2 2.3Unemployment rate (%) 8.6 7.7 9.4 .. .. ..Consumer price index (% change y-y) 4.3 6.6 6.8 5.0 3.3 3.0Public SectorGovernment revenues (% GDP) 25.4 25.7 24.8 24.8 27.3 27.4Government expenditures (% GDP) 27.4 25.5 29.4 28.6 30.9 29.6Government balance (% GDP) -2.1 0.2 -4.6 -3.7 -3.6 -2.3Domestic public sector debt (% GDP) 42.6 42.4 45.8 47.2 48.5 48.8Foreign Trade, BOP and External DebtTrade balance (millions US$) -842 -1.108 -670 -726 -789 -817Exports of goods (millions US$) 787 944 625 694 750 761
(% change y-y) 8.0 19.9 -33.8 11.1 8.1 1.5Key export (% change y-y) 1/ -7.5 35.5 -38.7 -47.7 5.8 0.0Imports of goods (millions US$) 1,629 2,052 1,295 1,421 1,540 1,578
(% change y-y) 0.2 26.0 -36.9 9.7 8.4 2.5Current account balance millions US$) -462 -640 -230 -215 -265 -291
(% GDP) -13.6 -18.0 -7.9 -6.9 -8.1 -8.9Foreign direct investment (millions US$) 343 320 127 169 160 166Total external debt (millions US$) 461 449 501 531 531 540
(% GDP) 13.5 12.6 17.3 17.0 16.3 16.6Short-term debt (millions US$) 210 210 210 .. .. ..Debt service ratio (% exports of g&s) 2/ 2.3 3.4 3.0 2.6 12.5 3.4Foreign exchange reserves, gross (millions US$) 3/ 519 317 565 660 .. ..
(months of imports g&s) 2.9 1.4 3.9 4.2 .. ..Financial MarketsDomestic credit (% change y-y) 4/ 2.8 11.2 0.2 1.9 .. ..Short-term interest rate % p.a.) 4.5 0.3 7.11 7.5 .. ..Exchange rate (FJ$/US$, eop) 1.6 1.8 1.9 1.9 .. ..Real effective exchange rate (2000=100) 99.4 102 90.5 87.7 .. ..
(% change y-y) 1.7 2.6 -11.3 -3.1 .. ..
Memo: Nominal GDP (millions US$) 3,405 3,565 2,903 3,131 3,259 3,255
Source: National data sources.
e = estimatef = forecast1/ Sugar.2/ Rise in debt service ratio in 2011 reflects the maturity of the US$150 million global bond, which may be refinanced.3/ Includes foreign assets of non-bank financial institutions.4/ Domestic credit to the private sector.
WORLD BANK EAST ASIA AND PACIFIC ECONOMIC UPDATE 2011, VOL. 1
72 COUNTRY PAGES AND KEY INDICATORS

Indone SI a
Population 228.2 million
Population growth 1.2 percent
Surface area 1,904,570 sq. km.
Capital JakartaSource: World Development Indicators.
Since the middle of 2010, Indonesia has seen a marked rise in domestic inflation and continues to be affected by movements in international commodity prices and capital flows. The pick-up in inflation, driven by food prices, and concerns over the monetary policy response, have been accompanied with a recent downward correction in asset prices and in nonresident holdings of Indonesian local currency assets. Such holdings rose substantially during 2010. Nonetheless, growth remained robust, rising to 6.1 percent for 2010 as a whole. The trade balance was boosted by international
commodity prices, with the overall balance of payment inflows reaching record highs for the year. Fiscal policy continues to be restrained, with the 2010 deficit well below the revised budget figure.
Inflation started rising in mid 2010 as consumer prices largely due to food supply shocks and reflecting an accommodating policy stance (see Figure). Headline inflation reached 7 percent year-on-year in December, outside the central bank’s target band of 4 to 6 percent. Supply-side disruptions were seen in key food items, such as rice and spices. Raw food prices grew 16 percent year on year (yoy) while grain prices were up 27 percent (dominated by the 30 percent rise for rice). Upward pressures on food prices are likely to continue at least until the harvest season at the end of the first quarter of 2011.
The rise in food price inflation risks a reversal of recent gains in poverty reduction. The wedge between the World Bank’s poverty basket inflation and the overall CPI increased to its highest level since the series began in 2002. This reflects the fact that current food price increases particularly affect the poor and brings the risk of increased poverty numbers in 2011. The Government has responded to rising food prices with a number of measures. For example, the National Logistics Agency has been given the mandate to procure more rice on the international market (although actual imports remain considerably below the mandated level). Steps are also being taken to simplify import procedures for food commodities, including removing various import tariffs. The Government’s rice for the poor program has also been extended through 2011 with a planned increased in the frequency of such transfers. The Government is also considering direct assistance to help farmers cope with extreme weather, for example, in the form of cash transfers.
The Bank of Indonesia (BI) adjusted its policy rate in February 2011 in response to rising inflation. The 25 basis point increase to 6.75 percent, which was the first change since August 2009, followed the sharp rise in local bond yields after the inflation numbers for December came through. Policymakers have indicated
Rice price increases in Indonesia have contributed to higher headline and poverty basket inflationchange (percent, yoy)
Food Inflation Poverty Basket inflation */ Headline inflation
Source: CEIC and World Bank.Note: */ Poverty Basket Inflation calculated by World Bank.
24
18
0
12
6
Jan-08 Jul-08 Jan-09 Jul-09 Jan-10 Jul-10 Jan-11
SECURING THE PRESENT, SHAPING THE FUTURE
COUNTRY PAGES AND KEY INDICATORS 73

that further Rupiah appreciation may also be used to help curb inflationary pressures. These moves follow other earlier liquidity tightening measures including increases in reserve requirements. Credit growth has recovered to just over 20 percent, below the peaks of almost 40 percent in late 2008, and is increasingly for working capital loans.
The surge in capital inflows that Indonesia saw over 2010 has moderated recently. Portfolio flows (particularly purchases of domestic government bonds) accounted for the larger portion of such inflows. In December, BI announced further macro-prudential measures as part of its response to these inflows, including raising foreign currency reserve requirements. More recently, concerns over inflation, and BI’s policy response, contributed to outflows of non-resident holdings of Indonesian assets (although to date these are limited compared with inflows over 2010). Profit-taking, along with push-side factors such as the recovery in the U.S., are also likely to have played a role. Domestic equity and bond prices have weakened in 2011 to date with local equities down 6 percent and local currency bond yields up 170 basis points to 8.2 percent (similar levels to those seen in May 2010).
The real economy continued to consolidate its recovery during the first three quarters of 2010. While growth in quarter three was slightly lower than expected at 5.8 percent year-on-year (yoy), growth in quarter four came in very strongly at 6.9 percent. Growth for 2010 as a whole reached 6.1 percent. Private consumption was supported earlier in the year by high consumer confidence and relatively low and stable inflation for most of the first half of the year. In the second half of the year, on a quarterly-growth basis, there was some weakening in private consumption’s growth contribution. This was offset by substantial gains for investment spending, driven by machinery equipment investment, in part likely reflecting expectations of sustained demand for production going forward. Government consumption also played an important role in the second half of the year, after subtracting from growth in the first half of 2010 as a result of slow disbursements and the unwinding of the fiscal
stimulus. Net exports also contributed strongly in the final quarters of 2010.
On the production side, domestically-focused sectors (such as communications and transport and retail trade) continue to make the most significant contributions to growth. Anecdotal reports suggest that some subsectors had reached capacity constraints by mid-2010 (although BI’s third quarter 2010 survey of business indicated an average capacity utilization rate of 72 percent across a sample of firms in manufacturing, mining and quarrying, agriculture and electricity, gas and water). Manufacturing growth, which was lagging the rest of the economy, showed a strong quarterly growth performance in the fourth quarter. Agricultural output was affected by unusual weather patterns and, for some sectors, smaller crop area thus resulting in a modest contribution to growth.
Both the trade balance and financial account contributed to rising balance of payments inflows. Inflows on the capital and financial account in 2010 were $26 billion up from $5 billion in 2009. In addition to portfolio inflows, there has also been a recovery in foreign direct investment (for example attracted by the Government’s electricity generation crash construction program). Financial inflows have more than offset the narrowing in the current account to $6.3 billion in 2010, down from $10.7 billion in 2009. The trade surplus improved toward end-2010, primarily reflecting strong commodity prices and agricultural exports. These inflows contributed to the rise in foreign reserves to $96 billion at end-2010, $36 billion above the pre-crisis peak of July 2008.
The budget deficit in 2010 was lower than expected, at 0.6 percent of GDP, significantly below the Revised Budget deficit of 2.1 percent. Revenue realization was 102 percent of the revised Budget level and expenditures a disappointing 93 percent, somewhat reversing the improving trend in budget realization of previous years. The Government approved a series of measures in August 2010 (new procurement regulation and new and more flexible guidelines on both virement procedures and budget authority appointments) to accelerate budget disbursements. However, their effect
WORLD BANK EAST ASIA AND PACIFIC ECONOMIC UPDATE 2011, VOL. 1
74 COUNTRY PAGES AND KEY INDICATORS

is likely to be seen more in 2011. They will be important in determining whether the rise in capital expenditures is achieved as set out in the Budget (which targets a 1.8 percent of GDP deficit). On subsidy reform, the Government has announced plans to exclude all private 4-wheel vehicles from purchasing subsidized fuel, starting in mid 2011 and in the Jakarta area, gradually extending to the whole of Indonesia in the next few years. Low fiscal deficits and strong nominal GDP growth have helped the downward trajectory for government debt-to-GDP (contributing to the January 2011 Moody’s upgrade of Indonesia’s sovereign rating to one notch below investment grade).
Despite the solid real sector performance, near-term risks to the outlook remain sizeable, for example, in terms of the risk of food inflation spilling over into inflation expectations and the headline rate. Indonesia still remains vulnerable to adverse shocks to international investor sentiment. These may come from both external and domestic sources, for example, related to perceptions of macro policy management. Further measures to shift inflows towards longer-term flows can help to mitigate this risk, particularly policies to enhance incentives for foreign direct investment. Looking to the medium-term outlook, the main uncertainty is whether the policies required to boost growth to 7 percent are adopted and implemented. This risk provides both upside and downside potential around the baseline outlook. Coordinated action will be required to address Indonesia’s infrastructure needs, to address the investment climate-related constraints on growth, to enhance the creation of quality employment, and to ensure that the benefits of growth continue to be shared across the population.
SECURING THE PRESENT, SHAPING THE FUTURE
COUNTRY PAGES AND KEY INDICATORS 75

Indonesia Key Economic Indicators2008 2009 2010 2011f 2012f 2010 2010 2011
Year Year Year Year Year Q1 Q2 Q3 Q4 Oct Nov Dec Jan
Output, Employment and PricesReal GDP (% change y-y) 1/ 6.0 4.6 6.1 6.4 6.7 5.6 6.1 5.8 6.9 .. .. .. ..Domestic demand (% change y-y) 7.5 5.4 5.2 6.5 7.2 4.0 4.6 6.2 5.9 .. .. .. ..Industrial production index (2000=100) 127.2 128.8 132.7 .. .. 129.9 133.0 135.8 139.4 139.5 138.5 140.3 ..
(% change y-y) 3.0 1.3 4.4 .. .. 4.3 4.3 3.7 5.4 4.9 4.6 6.8 ..Unemployment (%) 8.4 7.9 7.1 .. .. .. .. .. .. .. .. .. ..Real wages (% change y-y) 2/ -1.9 0.2 .. .. .. -4.6 .. .. .. .. .. .. ..Consumer price index (% change y-y) 11.1 2.8 7.0 6.0 6.2 3.4 5.0 5.8 7.0 5.7 6.3 7.0 7.0Public SectorGovernment revenues (% GDP) 19.8 15.5 16.0 15.4 15.1 .. .. .. .. .. .. ..Government expenditures (% GDP) 19.9 17.0 16.6 16.2 16.2 .. .. .. .. .. .. .. ..Government balance (% GDP) -0.1 -1.6 -0.6 -0.9 -1.1 .. .. .. .. .. .. .. ..Domestic public sector debt (% GDP) 13.9 16.5 14.1 12.6 11.7 .. .. .. .. .. .. .. ..Government debt (% GDP) 29.2 31.1 26.2 23.8 22.1 .. .. .. .. .. .. .. ..Foreign Trade, BOP and External DebtTrade balance (billions US$) 22.9 30.1 31.1 46.3 50.3 7.0 7.0 7.8 9.3 2.3 2.6 3.7 2.0Exports of goods (billions US$) 3/ 139.6 119.6 158.2 180.8 197.5 35.1 37.4 39.7 46.0 14.4 15.6 16.8 14.5
(% change y-y) 18.3 -14.3 32.2 14.3 9.2 45.0 33.0 26.9 27.7 17.6 45.1 25.7 24.7Key export (% change y-y) 4/ 27.5 -35.5 .. .. .. .. .. .. .. .. .. .. ..Imports of goods (billions US$) 3/ 116.7 89.5 127.1 134.5 147.2 28.0 30.5 31.9 36.7 12.1 13.0 13.1 12.5
(% change y-y) 36.9 -27.7 42.0 5.8 9.4 53.5 46.4 29.6 42.2 28.5 47.6 27.1 32.2Current account balance (billions US$) 0.1 10.2 6.3 2.3 2.7 2.1 1.6 1.4 1.2 .. .. .. ..
(% GDP) 0.0 1.9 0.9 0.3 0.3 1.3 0.9 0.7 0.7 .. .. .. ..Foreign direct investment (billions US$) 3.4 2.6 9.8 9.9 10.7 2.5 2.3 1.6 3.4 .. .. .. ..External debt (billions US$) 155.1 172.9 200.1 .. .. .. .. .. .. .. .. .. ..
(% GDP) 30.4 32.1 28.1 .. .. .. .. .. .. .. .. .. ..Foreign exchange reserves, gross (billions US$) 51.6 66.1 96.2 .. .. 71.8 76.3 86.6 96.2 91.8 92.8 96.2 95.3
(months of imports of g&s) 4.3 7.1 7.5 .. .. 7.0 6.8 7.3 7.5 .. .. .. ..Financial MarketsDomestic credit (% change y-y) 33.0 16.1 17.5 .. .. 10.1 16.9 20.3 22.2 21.6 22.1 22.8 ..Short-term interest rate (% p.a.) 5/ 8.7 7.1 6.5 .. .. 6.5 6.5 6.5 6.5 6.5 6.5 6.5 6.5Exchange rate (Rupiah/US$, ave) 9,757 10,354 9,078 ,, ,, 9,272 9,092 8,972 8,977 8,928 9,013 8,991 9,057Real effective exchange rate (2000=100) 142.3 142.4 161.3 .. .. 158.3 163.4 163.4 160.1 159.3 160.0 160.9 159.8
(% change y-y) 8.7 0.0 13.3 .. .. 22.6 15.0 11.4 5.6 5.3 5.9 5.6 1.9Stock market index (Aug. 1988=100) 6/ 2,088 2,014 3,095 .. .. 2,646 2,894 3,217 3,623 3,635 3,531 3,704 3,409
Memo: Nominal GDP (billions US$) 510.2 539.4 711.7 839.9 989.2 161.9 174.1 185.9 186.1 .. .. .. ..
Source: National data sources.
f = forecast1/ Using base-year 2000 national accounts2/ Wages in manufacturing3/ Annual and quarterly data are on a BOP basis while monthly data are on a customs basis4/ Crude oil and gas5/ Policy rate: one-month Bank Indonesia Certificates6/ Jakarta Composite, period average
WORLD BANK EAST ASIA AND PACIFIC ECONOMIC UPDATE 2011, VOL. 1
76 COUNTRY PAGES AND KEY INDICATORS

l ao Pdr
Population 6.2 million
Population growth 1.8 percent
Surface area 236,800 sq. km.
Capital VientianeSource: World Development Indicators.
Lao PDR’s real GDP growth will remain robust in 2011 with projected growth of 8.6 percent compared to 8.4 percent in 2010. Natural resources47 and manufacturing sectors48 are expected to drive growth this year. The expected growth in the garment exports (by about 15-20 percent in this year) is due to the EU relaxation in raw material sourcing requirement and increased orders by key garment producers. The service sector also shows signs of improvement, particularly the transport and tourism sectors (hotels and restaurants) and retail trading. Agriculture (fishery, livestock and crops) is expected to benefit from the recent increase in regional demand and higher food prices. Out of 8.6 percent growth in 2011, about 3.6 percentage points come from the resource sectors49, about 1 percentage point each from manufacturing and
47 Hydropower (with full operation of NT2, new operations of Nam Ngum 2 and Nam Lik 1-2) and sustained mining extraction (copper and gold output expansion by Sepon and Phubia projects).
48 Based on steady growth in cement and construction materials, as well as the garment and food and beverage industries.
49 Almost 3 percentage points come from the electricity sector (out of which around 1.3 percentage points come from NT2 and the rest from Nam Ngum 2 and Nam Lik 1-2). About 0.6 percentage points come from the mining sector - mostly copper and gold.
agriculture, 0.5 percentage points from construction and 2.5 percentage points from services.
The headline inflation, year on year (yoy), has declined notably in recent months down to 5.8 percent in December supported by lower food prices. Food prices in Lao PDR do not follow the global trend due to the subsistence nature of food production and relatively limited food exports and imports. The headline inflation which climbed up to more than 8 percent during August–September 2010 has dropped to 5.8 percent in December 2010 as food inflation (especially locally-produced sticky rice, meat and vegetables) declined during and after the wet season harvest to 8.8 percent in December from 14.2 in September. Government’s actions partly contributed to lower food inflation by balancing the supply and demand for food (using rice reserves) in markets, a stable exchange rate policy and temporarily ban on rice exports from the country. Core inflation also decreased from 3.6 percent (yoy) in August to 2.4 percent in December. The annualized inflation is about 6 percent in 2010 and projected at around 5–6 percent in 2011. Although recent global food prices have limited impacts on Lao inflation, the recent rise in energy (fuel) prices is likely to put inflationary pressures on the country—a net importer of fuel.
The budget deficit is expected to drop to 2.8 percent in FY10/11 from 5.7 percent of GDP in FY09/10 due to tightened expenditure (for both current and capital spending) and projected higher revenue (especially resource tax revenues). Domestic revenue is expected to increase to 14.4 percent of GDP in FY10/11 from 13.3 percent in FY09/10 following anticipated transfers of taxes, royalties and dividends from the resource sectors as a result of higher commodity prices. The total revenue (including grants) is expected to increase to 18.3 percent of GDP from 17.5 percent in FY09/10 driven by higher non-project grants (about 3.3 percent of GDP). Overall spending is expected to decline to 21.1 percent of GDP in FY10/11 from 22.3 percent in FY09/10. This is due to the phasing out of quasi-fiscal spending (domestically funded capital expenditure) and a decline in recurrent spending (due to the completion of major events, such as the South East Asia Games
SECURING THE PRESENT, SHAPING THE FUTURE
COUNTRY PAGES AND KEY INDICATORS 77

and the 450th Anniversary of the Vientiane Capital). The wage bill is expected to remain stable this fiscal year while an increase (in nominal terms) for compensations and transfers is budgeted to support expansion of public services to remote areas, especially for social sectors.
Lao export earnings are projected to soar in 2011 driven by higher commodity prices and increased regional demand. Lao exports grew rapidly by almost 43 percent (in nominal terms) in 2010 (boosting total merchandise exports to about $2 billion) and are projected to grow by nearly 30 percent in 2011 driven largely by resource exports (electricity and copper). Resource export growth (in nominal terms) is estimated at 59 percent in 2010 and about 32 percent in 2011. Imports rose by about 11 percent in 2010 and are expected to grow by 20 percent in 2011 driven by higher imports of capital and consumption goods as well as the rise in petrol prices. Although the trade balance is expected to improve slightly, the current account deficit is projected to widen to about 10.4 percent in 2011 from about 9 percent in 2010 mainly due to larger transfers of profits and debt service payments abroad by large resource projects. The capital account surplus is projected to increase from 10 percent of GDP in 2010 to 15 percent in 2011 with a corresponding surge of new investment especially from large resource mega projects such as the Hongsa Lignite power plant, the expansion of the Phubia Mining gold production facility, and other small and medium-sized hydro power projects.
Net foreign assets and foreign reserves picked up by the end of 2010 after continuous decline during the preceding two quarters. Foreign exchange reserves, recorded at $531 million, dropped sharply by 18 percent (yoy) in the third quarter. Nevertheless, they started to bounce back in the fourth quarter following transfers of operational expenditures and taxes payments of foreign companies and some new foreign investments were made. As a result, foreign reserves reached more than $730 million by end-2010 (covering 3.1 months of imports of goods and services). Net foreign assets have also followed a similar pattern with a rebound of more than 10 percent (quarter on quarter) in the fourth quarter. Reserves and net foreign assets are expected
to build up in coming months along with stronger investment inflows and larger tax profits payments from mining projects.
The kip has depreciated marginally against the U.S. dollar by 0.2 percent during the past three months (November–January) while appreciating significantly by 3.3 percent against the Thai baht in the same period. The Government pursues to achieve a delicate balance of stabilized exchange rate vis-a-vis major currencies (with an objective of ±5 percent of fluctuations per annum).
Credit growth is expected to decelerate for the second consecutive year in 2011 while risks remain. Credit growth continued to decelerate from 85 percent (yoy) at end-2009 to around 40 percent by end-2010 and is projected to slow further to about 30-35 percent in 2011. The phase out of Bank of Laos direct lending to projects has contributed to the decline in credit growth. In the meantime, credit to private sector continues to expand. The share of credit to GDP is estimated at 25 percent in 2010 and is projected to rise to about 30 percent 2011. Non-performing loans accounted a low 3 percent of GDP at end 2010 but nevertheless require close monitoring in an environment of relatively weak banking supervision.
Structural reforms have been progressing on different fronts. The treasury reform continues to gain pace with good progress being achieved in consolidation of spending units’ accounts into the National Treasury and the launch of the pilot of Treasury zero-balance account at the Bank of Lao PDR and its provincial branches. The Government has started implementation of the new public investment management mechanism, which includes allocation norms for the capital budget. The application of the formula has resulted in a public investment program allocation more favorable to poorer provinces. With regard to regional and global integration, a Prime Minister’s decree on Import and Export of Goods, which will introduce “national treatment” and “most favored nation” principles into Lao Law, is under the Government’s review and approval. This decree is the last piece of requirement for WTO accession. The
WORLD BANK EAST ASIA AND PACIFIC ECONOMIC UPDATE 2011, VOL. 1
78 COUNTRY PAGES AND KEY INDICATORS

preparation of Trade Facilitation Strategy and Action Plan, which envisages improved coordination among concerned agencies and strengthened institutional set up for trade facilitation issues, has progressed well.
Lao PDR Key Economic Indicators2007 2008 2009 2010e 2011f 2012f
Year Year Year Year Year Year
Output. Employment and PricesReal GDP (% change y-y) 7.4 7.5 7.5 8.4 8.6 7.6Consumer price index (% change y-y) 4.5 7.6 0.1 6.0 5.5 5.0Public Sector 1/Government balance (% GDP) 2/ -2.7 -2.6 -6.7 -5.7 -2.8 -2.5Foreign Trade, BOP and External DebtTrade balance (millions US$) -817 -1.033 -988 -642 -614 -484Exports of goods (millions US$) 1,215 1,451 1,436 2,052 2,605 2,840
(% change y-y) 12.5 19.4 -1.0 42.9 27.0 9.0Key export (% change y-y) 2.6 16.6 3.8 45.0 29.3 9.1Imports of goods (millions US$) 2,032 2,484 2,424 2,693 3,219 3,324
(% change y-y) 36.7 22.2 -2.4 11.1 19.5 3.2Current account balance (millions US$) -812 -1.019 -857 -702 -912 -1,020
(% GDP) -19.0 -18.2 -14.0 -9.2 -10.4 -10.4Foreign direct investment (millions US$) 838 976 774 761 1,088 1,285External debt (millions US$) 4,386 5,360 6,028 6,227 6,721 7,295
(% GDP) 100.6 96.4 101.5 91.5 92.1 94.6Debt service ratio (% exports of g&s) 12.5 10.4 15.6 16.2 14.0 12.6Foreign exchange reserves, gross (millions US$) 3/ 531 636 623 735 1,047 1,232
(months of imports of g&s) 3.1 3.2 2.9 3.1 3.7 4.2Financial MarketsDomestic credit (% change y-y) 13.9 68.6 98.3 39.8 .. ..Short-term interest rate (% p.a.) 4/ 13.0 10.5 7.0 7.0 .. ..Exchange rate (Kip/US$, ave) 9,603 8,635 8,516 8,235 8,029 ..Real effective exchange rate (2000=100) 105.3 124.7 116.6 .. .. ..
(% change y-y) -0.8 18.4 -6.5 .. .. ....
Memo: Nominal GDP (millions US$) 4,275 5,601 6,107 7,615 8,777 9,810
Source: National data sources.
e = estimatef = forecast1/ Fiscal year basis2/ After grants3/ Excluding gold4/ Treasury bill rate
SECURING THE PRESENT, SHAPING THE FUTURE
COUNTRY PAGES AND KEY INDICATORS 79

m a l aySI a
Population 27 million
Population growth 1.7 percent
Surface area 329,740 sq. km.
Capital Kuala LumpurSource: World Development Indicators.
Real growth returned to historical levels following a rapid rebound in the fourth quarter of 2009 and the first quarter of 2010. Subsequently, economic expansion sputtered in the third quarter on a seasonally adjusted sequential basis before rising strongly in the fourth quarter. For 2010 as a whole, growth amounted to 7.2 percent.
After playing a key role in the post-crisis recovery, domestic demand stalled temporarily. This was driven primarily by public consumption expenditure, which fell by an adjusted 11.5 percent on the earlier quarter on the back of fiscal consolidation efforts. In addition, gross fixed investment came to a halt, reflecting a combination of public expenditure cutbacks as well as uncertainties about future economic prospects. On the bright side, however, private consumption remained vibrant, supported by the recovery in employment, strength in commodity prices, and uninterrupted consumer lending.
On the external front, key factors included the renewed weakness in external demand, the softening of global inventory adjustment, and the withdrawal of policy support in most large economies. The last quarters saw a negative contribution of external demand to growth, but this has tapered off somewhat. In the third quarter,
for example, import demand significantly weakened, reflecting a lower demand for parts and components and uncertainty about export orders. In sharp contrast to consumer sentiment, business conditions indices have deteriorated significantly.
Higher-frequency indicators suggest marginal improvements as of late 2010. Following a four-month contraction, industrial production grew again slightly in October and November (when measured on a seasonally-adjusted and three-month moving average basis). Export-oriented industries continue to be outperformed by domestic-oriented ones, although for the first time in seven months, goods exports expanded again in November. This is reinforcing improvements in the trade balance as intermediate imports remain sluggish.
Against the backdrop of relative macro stability and the recent rise in public indebtedness, fiscal consolidation efforts have intensified. The federal deficit stood at 4.5 percent of GDP for the first nine months of 2010, compared to 5.4 percent for the same period in 2009 and 7 percent for 2009 as a whole. Contributing factors were the more rapid decline in spending than revenue as well as the rebound in nominal GDP. Development expenditures remained roughly unchanged, but operating spending was cut back by some 3 percent. The service tax was raised and broadened and a property gains tax was introduced, along with more stringent public procurement guidelines. July 2010 saw a small decline in energy and sugar subsidies. Initially planned for 2010, the introduction of a GST was postponed.
Inflationary pressure is rising but remains moderate. Consumer price inflation stood at around two percent in October and November 2010, which is higher than the first half average of 1.4 percent and 1.9 percent in the third quarter. Higher prices are seen as supply driven rather than the result of excess demand. Food prices registered the largest increase as a result of the combination of higher international food prices and mid-year subsidy cuts. Transport prices increased in line with the overall consumer price index.
WORLD BANK EAST ASIA AND PACIFIC ECONOMIC UPDATE 2011, VOL. 1
80 COUNTRY PAGES AND KEY INDICATORS

Monetary policy continued to re-normalize. Between March and July 2010, the overnight policy rate was raised by 75 basis points to the current level of 2.75 percent, which compares to a pre-crisis level of 3.50 percent. While policy normalization helps to avoid domestic financial imbalances and mounting price pressures, widening growth performance and interest rate differentials between advanced economies and Malaysia have attracted large capital inflows and associated ringgit appreciation (some 8.3 percent over 2010 against the U.S. dollar and in comparable magnitude on a real effective basis).
Despite the gradual rise in average cost of lending, household loan growth for the purchase of residential property accelerated in late 2010. Manufacturing credits also picked up in recent months, but remain comparatively sluggish relative to before the crisis. Financial soundness indicators remain strong. Early January, the central bank has signaled the possibility of further tightening coupled with the deployment of macro-prudential tools. In November 2010, Bank Negara Malaysia implemented a maximum of loan-to-value ratio of 70 percent to third housing financing facility to moderate speculative activities in certain segments of the property market.
After three quarters of deficit, the balance of payments recorded a small surplus in the third quarter of 2010. The surplus resulted largely from an improvement in the current account but the reduced role of errors and omissions, primarily relating to the reevaluation of the ringgit value of international reserves, was also notable. Financial account deficits resumed in quarter three. Although foreign direct investment (FDI) and portfolio inflows increased in line with more stable macroeconomic conditions and equity markets, FDI outflows jumped to a historical high of RM 23.5 billion. These outward investments were attributed to Malaysian firms in the services sectors (finance/insurance, business services, and wholesale/retail trade) and oil and gas industry. International reserves amounted to $107 billion as of mid-January 2011 or close to nine months of retained imports and over four times the short-term external debt.
Looking ahead, GDP growth is expected to forecast at 4.8 percent in 2011 and 5.7 percent in 2012. The driver of growth will likely remain domestic private demand, which is expected to be dampened by fiscal consolidation and external demand uncertainty. Inventory restocking should moderate, with private consumption and, perhaps to a lesser extent, private fixed investment filing in that slack.
The pace of fiscal consolidation is expected to be gradual, with official forecasts suggesting a decline in the deficit from 5.6 to 5.4 percent during this year. Fiscal consolidation may speed up if the private sector demand turns out stronger than the government anticipated.
Modest export growth coupled with more rapid import growth in 2011 is likely to reduce the current account surplus further. The near-term export outlook remain uncertain as confirmed by leading indicators such as Singapore purchasing manager index and U.S. inventory/shipment ratio of durable goods. The trend is positive overall. Leading indicators by Malaysia’s Department of Statistics surged in October 2010 to their highest level in six months.
Downside risks relate to the external environment, particularly with respect to euro area concerns and fiscal imbalances in advanced economies more generally. Policy-induced moderation in China and other emerging East Asian economies may also dampen exports along with private consumption growth. Large subsidy cuts and rising international commodity prices could also hold back consumer spending. Upside risks relate chiefly to the Government of Malaysia’s recently announced Economic Transformation Program, where bolder-than-expected implementation efforts could help raise confidence and investment.
SECURING THE PRESENT, SHAPING THE FUTURE
COUNTRY PAGES AND KEY INDICATORS 81

Malaysia Key Economic Indicators2008 2009 2010 2011f 2012f 2010 2010 2011
Year Year Year Year Year Q1 Q2 Q3 Q4 Oct Nov Dec Jan
Output, Employment and PricesReal GDP (% change y-y) 4.6 -1.7 7.2 4.8 5.7 10.1 8.9 5.3 4.8 .. .. .. ..Industrial production index (2000=100) 108.1 99.7 107.2 .. .. 105.1 108.1 107.4 108.4 110.2 106.3 108.6 ..
(% change y-y) 0.7 -7.7 7.5 .. .. 11.0 11.1 4.3 4.2 3.1 5.4 4.2 ..Unemployment (%) 3.3 3.7 3.3 .. .. 3.7 3.4 3.2 3.1 2.9 3.1 3.2 ..Consumer price index (% change y-y) 5.4 0.6 1.7 2.4 2.5 1.3 1.6 1.9 2.0 2.0 2.0 2.2 2.4Public SectorGovernment balance (% GDP) /1 -4.8 -7.0 -4.5 -5.5 -5.0 -5.6 -3.8 -4.1 -4.6 .. .. .. ..Domestic public sector debt (% GDP) 1/ 39.6 53.4 52.9 55.6 56.2 51.6 52.2 51.9 52.9 .. .. .. ..Foreign Trade, BOP and External DebtTrade balance (billions US$) 45.3 31.4 34.0 .. .. 11.6 7.2 7.1 8.2 2.2 2.9 3.1 ..Exports of goods (billions US$) 209.7 154.5 198.6 .. .. 47.1 48.5 50.3 52.7 17.7 16.7 18.3 ..
(% change y-y) 19.1 -26.3 26.0 .. .. 40.8 33.2 23.1 7.0 11.2 5.3 4.6 ..Key export (% change y-y) 2/ -3.8 -13.9 22.1 .. .. 46.4 27.7 16.4 -2.1 3.9 -4.1 -6.2 ..Imports of goods (billions US$) 164.4 115.1 164.5 .. .. 35.5 41.3 43.2 44.5 15.5 13.8 15.2 ..
(% change y-y) 12.0 -30.0 32.9 .. .. 45.4 42.7 29.9 13.7 23.5 6.1 11.5 ..Current account balance (billions US$) 38.8 31.4 .. .. .. 9.0 6.0 6.3 .. .. .. .. ..
(% GDP) 17.5 16.7 14.7 13.8 13.3 16.6 8.7 10.4 .. .. .. .. ..Foreign direct investment (billions US$) 7.2 1.6 .. .. .. 1.5 1.8 2.0 .. .. .. .. ..External debt (billions US$) 66.4 62.4 .. .. .. 65.0 68.4 72.1 .. .. .. .. ..
(% GDP) 29.9 33.2 .. .. .. 29.9 29.9 29.7 .. .. .. .. ..Short-term debt (billions US$) 22.4 22.8 .. .. .. 21.4 22.3 25.6 .. .. .. .. ..Debt service ratio (% exports of g&s) 3.1 6.8 .. .. .. 8.0 7.3 8.2 .. .. .. .. ..Foreign exchange reserves, gross (billions US$) 91.4 96.7 106.5 .. .. 96.4 96.2 100.0 106.5 104.8 104.8 106.5 108.1
(months of imports of g&s) 3/ 7.4 9.8 8.5 .. .. 8.1 7.0 8.5 8.5 6.8 7.6 7.0 ..Financial MarketsDomestic credit (% change y-y) 4.1 4.8 10.0 .. .. 6.5 8.8 11.8 12.8 12.4 13.2 12.8 ..Short-term interest rate (% p.a.) 4/ 3.5 2.1 2.6 .. .. 2.2 2.5 2.8 2.8 2.8 2.8 2.8 ..Exchange rate (Ringgit/US$, eop) 3.46 3.42 3.13 .. .. 3.27 3.26 3.09 3.13 3.11 3.16 3.13 3.08Real effective exchange rate (2000=100) 5/ 103.3 99.9 108.9 .. .. 104.9 110.5 111.2 108.9 109.4 108.7 108.6 ..
(% change y-y) 0.8 -3.3 9.0 .. .. 0.2 6.2 9.6 5.7 6.3 5.4 5.5 ..Stock market index (Apr. 4, 1986=100) 6/ 877 1,273 1,519 .. .. 1,321 1,314 1,464 1,519 1,506 1,485 1,519 1,520
Memo: Nominal GDP (billions US$) 222.2 194.7 237.6 .. .. 54.4 57.4 60.7 65.1 .. .. .. ..
Sources: National data sources, World Bank staff estimates.
f = forecast1/ Federal government only2/ Electronics3/ Excludes services imports4/ One-month interbank rate5/ World Bank staff estimate6/ KLSE Composite
WORLD BANK EAST ASIA AND PACIFIC ECONOMIC UPDATE 2011, VOL. 1
82 COUNTRY PAGES AND KEY INDICATORS

mongol I a
Population 2.6 million
Population growth 0.9 percent
Surface area 1,566,500 sq. km.
Capital UlaanbaatarSource: World Development Indicators.
Mongolia’s economy continues to recover with most sectors rebounding strongly from the sharp drop in output in late 2008 and early 2009. Preliminary estimates suggest that real GDP grew 6.1 percent in 2010, following a contraction of 1.3 percent in 2009. The agriculture sector is still feeling the impact of last winter’s ‘dzud’ which wiped out one-fifth of the livestock.
A perfect storm is gathering with inflation, created by a combination of external and internal pressures. The headline 12-month inflation rate in Ulaanbaatar rose to 14 percent year-on-year (yoy) from 1.9 percent at the end of 2009. Global monetary policies and food supplies, and rising food inflation in China and Russia, from which Mongolia imports several food products such as vegetables and grain, suggest that continued inflationary pressures can be expected from the external environment. Domestically, Mongolia’s booming economy is running into capacity constraints, while the adverse impact of the dzud continues to be felt through high meat prices. Finally, the 2011 budget approved a large increase in public spending, including substantial cash handouts to the population. Hence, we expect continued strong upward pressure on prices during 2011.
Mongolia’s public finances recorded a balanced budget for 2010, supported by the economic rebound and buoyant commodity prices. However, the recently approved 2011 Budget envisages a steep increase in government spending, together with a sharp rise in the deficit to an unprecedented 9.9 percent of GDP. It sets the record of the largest budget in the history of Mongolia amounting to more than half of GDP. The fiscal stimulus should compound already existing inflationary pressures and is inconsistent with the budget guidelines set out in the Medium Term Budget Framework approved last summer, which sets out a ceiling on the deficit of 5 percent. It also goes against the spirit of the new Fiscal Stability Law and will make it difficult to make the transition to a cyclically-adjusted fiscal deficit of no more than 2 percent of GDP starting 2013.
The exchange rate against the U.S. dollar has been appreciating back to the pre-crisis level and by the end of year had appreciated by nearly 14 percent in real terms against the U.S. dollar compared to December 2009. Projections for 2011 point to a continued real exchange rate appreciation, given the current macroeconomic policy stance. Without policy action, this will have negative implication the non-mineral export and import-competing sectors. Foreign exchange reserves reached a new peak of over $2 billion at the end of 2010 (about 30 percent of GDP). The trade deficit has begun to widen due to rising fuel, transport equipment and machinery imports related to the construction of the Oyu Tolgoi mine and associated infrastructure projects. As a result, the current account deficit widened to around 9.8 percent of GDP in the third quarter of 2010, after narrowing to 7.4 percent in the previous quarter on a four-quarter rolling sum basis.
In the banking sector, non-performing loans and loans in arrears still stand high at 16 percent of total outstanding loans in December. Rising inflation is rapidly bringing real interest rates down and average real MNT deposit rates are already negative. However, MNT deposits continue to rise fuelled by currency appreciation expectations and supported by the deposit guarantee law. There is a significant increase in private overseas
SECURING THE PRESENT, SHAPING THE FUTURE
COUNTRY PAGES AND KEY INDICATORS 83

borrowing. This development merits close monitoring by the central bank: they are likely to be unhedged, and could leave borrowers vulnerable to unexpected reversals in capital inflows. It is vital that the banking restructuring reforms, driven by the need to improve bank balance sheets, move forward in order to strictly and consistently enforce the existing regulatory policies.
The latest informal labor markets survey conducted in December 2010 revealed a reduction in number of casual workers by about 40 percent compared to September due to the seasonal closure of construction labor markets, and reduced outdoor sales activities due to cold weather. Workers’ real informal market wages on average decreased by about 30 percent from September to December 2010. Reduced job opportunities during the winter months, combined with rising inflation, explain the decline in real wages of the most vulnerable in society.
Mongolia has made significant progress in improving budget transparency, but there is still considerable room for improvement vis-à-vis public investment management. Parliament is expected to debate critical public finance issues in its spring session that would improve the public investment planning and budgeting system. On the agenda are the draft Integrated Budget Law (IBL) and the Law on Development Policy and
Planning, as well as a revised law on public procurement, as well as the implementation of public-private partnerships (PPPs). Mongolia also plans to establish a Development Bank during 2011. The Bank will use a portion of the proceeds from the Fiscal Stability Fund to finance its long term infrastructure needs.
The economic recovery is becoming more broad-based…
% of GDP, yoy
Agriculture Mining ManufacturingConstruction Wholesale & retail trade Transport & communicationGross Domestic Product
Sources: NSO, WB staff estimates.
…but inflation continues to rise reflecting both demand side and supply side pressures% yoy, Ulaanbaatar
Energy and fuels Meat, milk and cheese Bread, flour and cerealsOther food Core inflation excluding all food and energyCPI Inflation
Sources: NSO, WB staff estimates.
Q3-08 Q4-08 Q1-09 Q2-09 Q3-09 Q4-09 Q1-10 Q3-10Q2-10
108
-10
6420
-2-4-6-8
45
35
25
15
-5
5
Jan-07 May-09Sep-07 May-08 Jan-09 Sep-09
WORLD BANK EAST ASIA AND PACIFIC ECONOMIC UPDATE 2011, VOL. 1
84 COUNTRY PAGES AND KEY INDICATORS

Mongolia Key Economic Indicators2007 2008 2009 2010e 2011f 2012f
Year Year Year Year Year Year
Output, Employment and PricesReal GDP (% change y-y) 10.2 8.9 -1.3 6.1 10.3 7.6Industrial production index 110.4 113.4 109.7 .. .. ..
(% change y-y) 10.4 2.7 -3.3 .. .. ..Unemployment (%) 2.8 2.8 3.3 3.3 3.2 3.2Consumer price index (% change y-y) 14.1 23.2 1.9 14.3 20.0 12.0Public SectorGovernment revenues (% GDP) 35.3 37.6 35.5 37.3 52.1 38.9Government expenditures (% GDP) 37.9 33.1 30.3 37.3 42.2 35.0Government balance (% GDP) 2.7 -4.5 -5.2 0.0 -9.9 -3.9Non-mineral government balance (% GDP) -13.4 -15.5 -12.9 -12.2 -7.5 ..Domestic public sector debt (% GDP) 0.5 0.0 6.3 22.7 30.4 ..Total public sector debt (% GDP) 36.5 31.0 49.4 43.0 .. ..Foreign Trade, BOP and External DebtTrade balance (millions US$) -52 -613 -195 -378 .. ..Exports of goods (millions US$) 1,949 2,535 1,876 2,899 3,825 4,083
(% change y-y) 26.1 30.0 -26.0 54.5 31.9 6.7Key export (% change y-y) 1/ 27.7 3.0 -39.9 53.6 .. ..Imports of goods (millions US$) 2,003 3,147 2,070 3,165 4,874 5,190
(% change y-y) 32.2 57.1 -34.2 52.9 54.0 6.5Current account balance (millions US$) 265 -722 -409 -589 -1,301 -1,437
(% GDP) 6.3 -12.9 -9.0 -9.6 -15.1 -13.6Foreign direct investment (millions US$) 360 836 496 1,400 1,130 548External debt (millions US$) 1,529 1,601 1,977 2,176.0 2,252 ..
(% GDP) 36.1 31.0 43.3 30.8 .. ..Short-term debt (millions US$) 2/ 0 0 0 0 0 ..Debt service ratio (% exports of g&s) 3/ 2.0 2.0 3.7 .. .. ..Foreign exchange reserves, gross (millions US$) 1,001 658 1,328 2,091 .. ..
(month of imports of g&s) 3.8 3.0 4.3 7.6 .. ..Financial MarketsDomestic credit (% change y-y) 78.4 52.5 -7.6 47.1 .. ..Short-term interest rate (% p.a.) 4/ 8.4 9.8 .. .. .. ..Exchange rate (Tugrik/US$, eop) 1,170 1,268 1,443 1,259 .. .. Real effective exchange rate (2000=100) 104.8 124.4 100.6 .. .. ..
(% change y-y) -5.5 -18.2 15.6 -13.7 .. ..Stock market index (Dec. 2000=100) 5/ 2,048 1,182 1,229 1,872 .. ..
Memo: Nominal GDP (millions US$) 4,235 5,607 4,574 6,125 8,630 ..
Sources: Bank of Mongolia, National Statistical Office, Ministry of Finance, IMF and World Bank staff estimates.
e = estimatef = forecast1/ Copper concentrate2/ Short-term public and publicly-guaranteed (PPG) debt3/ On PPG debt4/ Yield on 14-day bills until 2006 and on 7-day bills for 2007 onward5/ Top-20 index
SECURING THE PRESENT, SHAPING THE FUTURE
COUNTRY PAGES AND KEY INDICATORS 85

Pa P ua ne w guIne a
Population 6.4 million
Population growth 2.0 percent
Surface area 462,840 sq. km.
Capital Port MoresbySource: World Development Indicators.
Papua New Guinea’s strong economic performance continued in 2010, supported by resurgent minerals production and investment in new projects. GDP is expected to have expanded by 7 percent, following 5.5 percent growth in 2009. After contracting 1.8 percent in 2009, minerals output is estimated to have expanded by 5.4 percent in 2010, despite strikes affecting major mines in the first months of the year. Activity in the non-minerals sector also accelerated, expanding overall by 8.2 percent in 2010 following 5.3 percent growth in 2009, according to Treasury’s estimates. This upturn was led by sectors most linked to minerals production and the growing income streams they are generating. Construction, manufacturing and retail trade all recorded 20 to 30 percent increases in the nominal value of sales from the first quarter to the second quarter, according to the most recently published Bank of PNG (BPNG) survey. Activity in the transportation and communications sector, which benefited from deregulation earlier in the decade, is estimated at have grown by near 16 percent in 2010—about half the rate in 2009.
The large PNG-liquefied natural gas (PNG-LNG) project moved towards full construction phase, but suffered temporary disruptions due to landowner actions. Construction of the $15 billion project’s first phase is
scheduled to complete by mid-2014, although there are risks of this slipping. Local landowners have slowed or temporarily halted construction work at various sites in recent months. These interventions generally relate to alleged grievances regarding payment of land use compensation and business development grants by the central government to landowner groups. The central government has started distributing funds and has announced spending plans in anticipation of the PNG-LNG revenues. It contributed PGK 89 million in seed capital to 16 landowner companies in late December, as part of the PGK 120 million License-Based Benefit Sharing Agreement, to assist landowners in LNG project areas to participate in associated businesses. Other announcements include a PGK 157 million plan to build a national broadband network, piggybacking on the PNG LNG fiber-optic cable.
The strong growth in construction and investment activity is creating capacity constraints and inflationary pressures. The PNG-LNG is the largest of a range of significant construction projects, but most of its costs will be on imported goods and services, with the government estimating only 4.5 percent or $675 million will be retained in the local economy, mostly between 2011 and 2013. But the project is generating a greater momentum. Supply limits are being reached in particular sectors, such as property in Port Moresby and Lae, skilled labor, construction equipment and shipping facilities. Businesses with looser budget constraints—generally the minerals investors themselves—are able to secure supplies and skilled labor by bidding up prices. Established firms, including the public sector, face growing difficulty in retaining staff. But not all households are enjoying an increase in wages and find accommodation costs consuming more of their incomes. Increases in demand and prices are generating a lagged supply response, for example significant investments in new hotel rooms and apartments.
Strong price pressures are concentrated in particular sectors, with overall official inflation near historical averages. The CPI increased by 7.2 percent in the year to the December quarter 2010 but the acceleration was
WORLD BANK EAST ASIA AND PACIFIC ECONOMIC UPDATE 2011, VOL. 1
86 COUNTRY PAGES AND KEY INDICATORS

due to a more-than doubling in betel nut prices; other consumer prices increased by a little over 5 percent over the same period, near the average of the past half-decade. Food prices increased by 5.6 percent in the year to quarter four; meat & fish recorded the largest increases. Apart from the rise in oil prices in the first months of 2011, PNG’s consumers have thus far remained insulated from the increase in global commodity prices. Underlying inflation has been more persistent, with the trimmed mean measure at 5.7 percent in the year to the September quarter. PNG’s inflation has shifted to being domestically-driven, caused by capacity constraints in the face of the large increases in demand, in contrast with the historical pattern of inflation outbreaks being due to rising import prices. Anecdotes suggest that second round impacts of these tighter market conditions are yet to emerge—for example, higher wage demands reflect tightness in skilled labor markets rather than workers requesting higher wages in anticipation of faster price growth—although a lack of survey data makes such assessments difficult. This inflation is particularly challenging to manage. Tightening monetary policy to the extent required to reduce aggregate price pressures could lead to seriously weakening sectors already suffering from increased competition for inputs from the minerals sectors. Reducing prices of imported items by allowing the exchange rate to appreciate would have a similar effect, particularly impacting cash crop exporters and manufacturers focusing on the domestic market as imports become more competitive. This makes prudent management of government expenditure key to addressing aggregate demand pressures.
The government has returned fiscal policy to a neutral stance, after the significant slippages from the medium-term fiscal strategy (MTFS) in 2009. The 2011 Budget is near balance, following an estimated deficit of 2.7 percent of GDP in 2010 and 8 percent in 2009 (adjusting for trust fund transactions). The 2010 and 2011 budget positions are consistent with the MTFS. In the first eleven months of 2010 the central government recorded a higher-than-expected overall surplus, of PGK 1,574 million, which it used to reduce debt. Total government debt fell to PGK 6.5 billion or
26 percent of GDP at the end of Q3. The budget for 2011 (33.4 percent of GDP) allocates a large share of funds to education, health and infrastructure. The government has also re-engaged in the tax and tariff reform agenda. This year’s budget adjusts housing benefits tax exemption rates to better target those with greatest needs. It also sets out a modest tariff reform program, building on the 2007 Tariff Review, that will reduce ‘prohibitive’ and ‘protective’ tariff rates towards the intermediate rate of 15 percent by the second half of this decade. The Budget extinguishes some superannuation liabilities and other arrears, following several years when these liabilities were allowed to mount. But the composition of government spending is as important as the overall fiscal stance, as the budget papers discuss. The Development Budget continues its trend increase relative to recurrent spending, with the latter again falling in real terms. Development spending needs to address current capacity constraints, without adding unduly to demand pressures. This may mean sequencing construction-heavy activity later in the medium-term development plan, when it could potentially offset waning demand from the private sector. Financing may be more challenging than envisaged when the development plan was drafted: the Budget projects a small decline in real revenues by 2015 as current minerals production is set to decline before the LNG project becomes active; in comparison the medium-term plan projects an increase in revenue.
The 2011 Budget takes important steps to ensuring that PNG can continue its recent macroeconomic stability even as the importance of volatile minerals revenues grows. Natural resource projects monetize a country’s existing natural wealth, and the scale of the PNG-LNG project places a premium on ensuring that future generations benefit from this wealth. This can be done through saving part of the revenue for future generations, and through investing in the country’s productive physical and human capacity. The 2011 Budget proposes creating three funds, two of which are to be for these purposes. Natural resource revenues are especially volatile and unpredictable, as the wide swings in oil prices over recent years demonstrate. The third fund seeks to protect PNG’s public finances and
SECURING THE PRESENT, SHAPING THE FUTURE
COUNTRY PAGES AND KEY INDICATORS 87
economy from these fluctuations by saving revenues when prices are high for supporting public spending when prices are weak. The Budget proposes placing the three funds offshore. This will reduce the pressure on the Kina to appreciate, protecting the competitiveness of PNG’s crash crop farmers and nascent manufacturing sector. It will also limit the impact on the already excessive liquidity in the banking system, and improve the effectiveness of monetary policy at smoothing fluctuations in the economy. But achieving these goals requires getting the details of the funds’ design right. This will be a politically and technically challenging task and has been assigned to a high-level working group through 2011.
BPNG slightly tightened the stance of monetary policy, to address high liquidity in the banking system. BPNG maintained the Kina facility rate at 7.0 percent through January, for the thirteenth month. It did, however, increase the cash reserve ratio from 3.0 percent to 4.0 percent in October, to absorb ongoing high liquidity in the banking system. The move led to a modest immediate rise in bank bill rates from the 2.4 percent for one-month and 2.9 percent for 3-month tenors in September to rates tens of basis points higher by November, although by January yields had fallen below even these levels; 10-year government bond yields remained near 9 percent. Foreign reserves continued to rise, exceeding $3 billion by December 2010, approaching 10 months of imports. The Kina appreciated by 2.7 percent to 2.65 per U.S. dollar from end August to late January 2011, although it depreciated by 1.3 percent between August and November 2010 in real effective terms.
Optimism continues to surround PNG’s medium-term economic outlook, but the risks are significant, as the government recognizes. Growth is expected to slow only modestly from recent strong rates, towards 5 percent in 2011 and 2012. Consumer prices risk accelerating in 2011 and 2012. The completion of the Household Income and Expenditure Survey and recalibration of the CPI expected later in 2011 and 2012 will give a better indication of Papua New Guineans’ cost of living and real spending power. The 25 percent boost to GDP
generated by the LNG project by 2015 is contingent on construction being able to proceed on schedule. And before it comes on-stream, public finances will be pressured by declining revenues as existing mines age and oil wells are depleted. Ensuring that the LNG project is translated into sustained improvements in Papua New Guineans’ quality of life requires a robust set of mechanisms such as the Sovereign Wealth Funds currently being contemplated to manage revenues, as well as reforms to improve the effectiveness with which government spending translates into public services. Progress on these fronts could be challenged by intensive factional bargaining within the governing coalition, and the demands of campaigning for the national elections scheduled for 2012.
WORLD BANK EAST ASIA AND PACIFIC ECONOMIC UPDATE 2011, VOL. 1
88 COUNTRY PAGES AND KEY INDICATORS

Papua New Guinea Key Economic Indicators2007 2008 2009 2010e 2011f 2012f
Year Year Year Year Year Year
Output, Employment and PricesReal GDP (% change y-y) 7.2 6.7 5.5 7.5 5.5 5.5Tourist arrivals (thousands) 104.1 115.0 123.0 .. .. ..
(% change y-y) 34.0 10.4 7.0 .. .. ..Consumer price index (% change y-y) 0.9 10.7 6.9 6.0 8.0 5.0Public SectorGovernment revenues (% GDP) 36.9 30.5 19.3 29.7 33.4 31.6Government expenditures (% GDP) 28.4 30.0 27.3 32.4 33.4 30.6Government balance (% GDP) 8.8 2.7 -8.0 -2.7 0.0 1.0Domestic public sector debt (% GDP) 18.4 18.9 19.6 17.2 14.5 14.7Foreign Trade, BOP and External DebtTrade balance (millions US$) 2,193 2,675 1,187 83 -2,098 -1,441Exports of goods (millions US$) 4,822 5,823 4,617 5,742 6,391 6,199
(% change y-y) 11.5 20.8 -20.7 24.4 11.0 -3.0Key export (% change y-y) 1/ 4.8 16.0 -17.5 30.4 13.5 0.0Imports of goods (millions US$) 2,629 3,148 3,430 5,660 8,489 7,640
(% change y-y) 32.0 19.7 9.0 65.0 50.0 -10.0Current account balance (millions US$) 208 805 -541 -2,202 -3,123 -2,457
(% GDP) 3.3 10.0 -6.8 -25.0 -35 -20Foreign direct investment (millions US$) 462.7 -31.0 764.0 1,137.0 1,322.0 1,322.0External debt (millions US$) 1,978 2,042 2,127 2,273 2,382 3,562
(% GDP) 31.2 25.5 26.9 25.8 26.7 29Short-term debt (millions of US$) 2/ 48 44 72 93 ..Debt service ratio (% exports of g&s) 8.3 5.1 7.0 5.7 5.2 5Foreign exchange reserves, gross (millions US$) 2,087 1,988 2,571 3,000 3,300 3,500
(months of imports of g&s) 4.2 4.4 5.6 3.8 4.7 5.5Financial MarketsDomestic credit (% change y-y) 5.5 31.3 30.2 25.2 17.0 15.0Short-term interest rate (% p.a.) 4.4 5.9 7.2 .. .. ..Exchange rate (Kina/US$, eop) 2.8 2.7 2.7 2.5 2.5 2.5Real effective exchange rate (2000=100) 96.5 109.4 118.0 113.0 .. ..
(% change y-y) -4.4 13.4 7.8 -4.2 .. ..
Memo: Nominal GDP (millions US$) 6,339 8,009 7,907 8,809 8,922 12,284
Sources: National data sources, IMF, and World Bank staff estimates.
e = estimatef = forecast1/ Gold2/ Banking system short-term external debt only
SECURING THE PRESENT, SHAPING THE FUTURE
COUNTRY PAGES AND KEY INDICATORS 89

PhIl IPPIne S
Population 90.3 million
Population growth 1.8 percent
Surface area 300,000 sq. km.
Capital ManilaSource: World Development Indicators.
The Philippine economy re-ignited in the last quarter of 2010, pushing annual GDP growth to rates not seen in over 30 years. After a brief softening of activity in the third quarter of 2010, real GDP growth rose 3 percent quarter in the fourth quarter in seasonally adjusted terms. For 2010 as a whole, growth amounted to 7.3 percent, the highest since 1976, and in sharp contrast with the 1.1 percent expansion in 2009. Growth was broad-based with private consumption, investment, and net exports all contributing. On the supply side, the economy was propelled by two relatively balanced engines: industry
and services. Following four quarters of decline—due to weather-related factors—agriculture also expanded and contributed 1.1 percentage points to overall GDP growth in Q4. Growth is expected to normalize to 5 percent in 2011 and improve to 5.4 percent in 2012, with downside risks arising from rising global food and fuel prices and upside risk from better investment prospects.
In spite of the remarkable rebound, the unemployment rate remains structurally high and growth continues to bypass many of the poor. The unemployment rate is above 7 percent while underemployment continues to affect one-fifth of the labor force. Moreover, the latest official poverty data showed that an additional 3.3 million citizens became poor in the Philippines (net basis) between 2003 and 2009, pushing the poverty headcount to 23 million from 20 million in 2003 (Figure left). Even with real growth in GDP per capita reaching 2.7 percent between 2003 to 2009, the distribution of the gains from growth have eluded the bottom fourth of the Filipino population. A bright spot amidst these generally depressing poverty numbers is that they point to some distributional improvement within the rank of the poor: measures of the depth of poverty as well as the income distribution of the poor improved between 2006 and 2009 (Figure right).
The ranks of the poor and poverty incidence rose again ...though distributional poverty measures improved 1/poverty incidence, 2003–09 other poverty measures, 2003–09
Magnitude of poor Poverty incidence Magnitude of substinence Poverty gap Severity of poverty Income gap (RHS)
Source: National Statistical Coordination Board (NSCB).Note: 1/ Income gap (IG): the average income shortfall (expressed in proportion to the poverty line) of families with income below the poverty threshold. Poverty gap (PG): total income shortfall (expressed in proportion to the poverty line) of families with income below the poverty threshold, divided by the total number of families. Both IG and PG are measures of the depth of poverty. Severity of poverty: the total of the squared income shortfall (expressed in proportion to the poverty line) of families with income below the poverty threshold, divided by the total number of families. It is a poverty measure which is sensitive to the income distribution among the poor—the worse this distribution is, the more severe poverty is (NSCB).
24 27
23 26.5
22 26
18 24
21 25.5
20 25
19 24.5
2003 2006 2009
19.8
22.223.1
11 28
9
7
27
1 24
5
3
26
25
2003 2006 2009
8.89.9 9.4
WORLD BANK EAST ASIA AND PACIFIC ECONOMIC UPDATE 2011, VOL. 1
90 COUNTRY PAGES AND KEY INDICATORS

Consumer price inflation was 3.8 percent in 2010, well within the central bank’s target of 3.5–5.5 percent. Domestic price pressures from the fuel and electricity price hikes last year were offset by the strong peso. More recently, there was an upside inflation surprise as transportation and food price inflation became visible again in January 2011. Inflation is expected to rise to 4.8 percent in 2011, within the top of the Bangko Sentral ng Pilipinas’ (BSP) target band of 3 to 5 percent in 2011 percent. The distribution of risks on inflation is tilted upwards, as global food and fuel supply shocks could return and would push headline inflation outside of the target band and possibly spill over into core inflation. Monetary policy is projected to tighten gradually in the second half of 2011 as demand pressures are limited and inflation expectations remain within the BSP target band.
The country’s external position continued to strengthen thanks to a consistently strong current account and, lately, by improvements in the capital and financial account. The third quarter 2010 overall balance of payments surplus grew to 7.2 percent of GDP, pushing the year-to-date surplus to 4.9 percent of GDP (one percentage point higher than in the same period in 2009). The strong third quarter performance mainly stemmed from a continued steady performance on the current account (5.9 percent of GDP) and a boost in the capital and financial account (2.7 percent of GDP). The latter’s performance was due to the large repayments of loans by non-residents, net loan availments by local banks and private corporations and, to a lesser extent, net placements by non-residents of their currency and deposits in local banks. Direct and portfolio investment to the Philippines remained relatively muted compared to bank lending. With improving economic fundamentals, Philippine debt papers have been priced competitively and were oversubscribed in recent issues. Moreover, Standard and Poor’s upgraded its rating of Philippine debt paper by one notch to BB, while Moody’s revised its outlook from stable to positive.
The national government deficit fell below target as the national government significantly tightened second half spending amid lower than expected revenue
growth. After a weak tax buoyancy and a significant fiscal stimulus undertaken in the first-half of the year threatened to push the annual fiscal deficit significantly beyond the budgeted target, the new government decisively controlled expenditures in the second half of 2010 thanks to measures taken to improve expenditure efficiency and effectiveness. As a result, the 2010 fiscal deficit which reached 3.6 percent50 of GDP was tighter than the budgeted 4.1 percent. The new administration plans not to impose new tax laws in its first 18 months and is relying on the improvement of tax and customs administration to beef up tax collection.51
For the first time in 11 years, the 2011 Budget was enacted prior to the start of the budget year. Timely passage of the budget will allow the government to front-load a significant amount of the expenditure program, especially infrastructure spending, in the first three quarters of the year. As expected, key provisions of the president’s proposed budget were left untouched by Congress despite earlier opposition. These include the more than two-fold increase in the budget for the Conditional Cash Transfer Program (to cover about half of the poor households) and the 19 percent increase in the budget for basic education; these programs are expected to help curb the rising poverty incidence in the country. In addition, several inefficient programs such as the Food for School Program were retired. To ensure that future budgets will be passed on time, the Executive has advanced the budget calendar by three months. To improve budget efficiency and transparency, the Executive has begun the groundwork in establishing a program evaluation system and has scaled-up the number of programs to be evaluated in preparation for the 2012 Budget. Budgetary support to government corporations is also being evaluated via
50 Preliminary government estimate.
51 Notable measures include strengthening the large taxpayer office, institutionalizing a performance management system, improving the VAT refund system, establishing a multi-lane system in customs, and stricter enforcement of tax laws. Alongside administrative reforms, the Executive is pursuing the passage of the fiscal incentives rationalization and fiscal responsibility bills to plug future leakages in the tax system.
SECURING THE PRESENT, SHAPING THE FUTURE
COUNTRY PAGES AND KEY INDICATORS 91

a program to improve performance monitoring in key state owned enterprises.
To sustain early achievements, the Aquino Administration needs to secure its revenue base to expand socially relevant expenditures, and strengthen the investment climate. To markedly raise revenues, tax policy measures are needed to supplement ongoing administrative efforts. Key tax policy measures that would quickly raise revenues and improve social outcomes are increases in the excise tax rates of alcohol, tobacco, and petroleum. Additional measures could include—after fixing the deficient VAT refund process—increasing the VAT rate and further broadening its base, possibly coupled with some reduction in the income tax rates. To expand investment in a sustainable fashion and improve the prospects of public-private partnerships, the government needs to address long standing infrastructure bottlenecks (especially power supply), strengthen governance, and improve the business environment.
WORLD BANK EAST ASIA AND PACIFIC ECONOMIC UPDATE 2011, VOL. 1
92 COUNTRY PAGES AND KEY INDICATORS

Philippines Key Economic Indicators2008 2009 2010 2011f 2012f 2010 2010 2011
Year Year Year Year Year Q1 Q2 Q3 Q4 Oct Nov Dec Jan
Output, Employment and PricesReal GDP (% change y-y) 1/ 3.7 1.1 7.3 5.0 5.4 7.8 8.2 6.3 7.1 .. .. .. ..Industrial production index (1994 = 100) 84.8 74.7 .. .. .. 81.0 90.9 94.5 .. 98.8 101.6 .. ..
(% change y-y) 0.3 -11.9 .. .. .. 31.1 27.4 21.3 .. 14.9 16.8 .. ..Unemployment (%) 2/ 7.4 7.5 7.3 .. .. 7.3 8.0 6.9 7.1 .. .. .. ..Nominal wages (% change y-y) 3/ 5.3 2.2 2.9 .. .. 0.0 0.0 5.8 5.8 5.8 5.8 5.8 5.8Real wages (% change y-y) 3/ -1.6 0.6 -1.1 .. .. -4.0 -4.4 1.7 2.7 3.5 2.0 2.2 1.8Consumer price index (% change y-y) 9.3 3.2 3.8 4.8 4.5 4.2 4.2 3.8 2.9 2.8 3.0 3.0 3.5Public SectorGovernment balance (% GDP) 4/ -1.5 -4.1 -3.7 -3.5 -2.9 -7.0 -3.1 -3.2 .. .. .. .. ..Domestic public sector debt (% GDP) 5/ 31.5 35.1 .. .. .. .. .. .. .. .. .. .. ..Foreign Trade, BOP and External DebtTrade balance (billions US$) 6/ -12.9 -8.9 .. .. .. -2.3 -2.4 -1.5 .. -0.1 -0.8 -0.7 ..Exports of goods (billions US$) 6/ 48.3 37.6 .. .. .. 11.1 12.2 14.4 .. 4.8 4.1 4.2 ..
(% change y-y) -2.5 -22.1 .. .. .. 43.5 34.3 41.3 .. 27.4 11.5 26.5 ..Key export (% change y-y) 7/ -7.2 -21.2 .. .. .. 51.3 37.9 46.7 .. 35.0 7.1 17.5 ..Imports of goods (billions US$) 6/ 61.1 46.5 .. .. .. 13.4 14.6 15.9 .. 4.9 4.9 4.9 ..
(% change y-y) 5.6 -24.0 .. .. .. 34.0 26.0 30.1 .. 28.4 35.3 25.2 ..Current account balance (billions US$) 8/ 3.6 8.8 9.9 9.4 8.0 1.8 2.5 2.7 .. .. .. .. ..
(% GDP) 2.2 5.5 5.2 4.2 3.2 4.3 5.5 5.9 .. .. .. .. ..Foreign direct investment (billions US$) 1.3 1.6 0.9 2.0 3.0 0.3 0.1 0.3 .. .. .. .. ..External debt (billions US$) 9/ 53.9 53.3 .. .. .. 57.0 57.3 59.8 .. .. .. .. ..
(% GDP) 34.5 32.1 .. .. .. 30.1 31.0 30.7 .. .. .. .. ..Short-term debt (billions US$) 9/ 7.0 4.0 .. .. .. 5.2 5.5 5.7 .. .. .. .. ..Debt service ratio (% exports of g&s) 9.7 10.3 .. .. .. 10.3 9.0 9.6 .. .. .. .. ..Foreign exchange reserves, gross (billions US$) 9/ 37.6 44.2 62.4 72.1 83.1 45.6 48.7 53.8 62.4 57.2 60.6 62.4 63.6
(months of imports of g&s) 10/ 9.0 8.7 10.3 10.2 10.7 8.5 9.0 8.9 10.3 9.4 10.0 10.3 10.5Financial MarketsDomestic credit (% change y-y) 11/ 16.8 7.4 8.7 .. .. 8.6 8.5 9.4 8.7 9.0 8.0 8.7 ..Short-term interest rate (% p.a.) 12/ 5.5 4.5 4.2 .. .. 4.2 4.2 4.2 4.2 4.2 4.3 4.3 ..Exchange rate (Peso/US$, ave) 44.5 47.7 45.1 .. .. 46.0 45.5 45.3 43.6 43.4 43.5 44.0 44.2Real effective exchange rate (2000=100) 128.6 125.2 .. .. .. 129.4 133.1 .. .. .. .. .. ..
(% change y-y) 13/ 5.7 -2.6 .. .. .. 1.6 5.6 .. .. .. .. .. ..Stock market index (Jan. 2, 1985=100) 14/ 2,631 2,468 3,524 .. .. 3,031 3,265 3,627 4,180 4,215 4,187 4,139 4,062
Memo: Nominal GDP (billions US$) 166.6 161.1 188.6 223.1 251.6 42.2 46.0 45.1 55.7 .. .. .. ..
Source: National data sources.
f = forecast1/ The GDP series has a break in 2000.2/ New methodology. Figures are based on the 2000 census.3/ Non-agriculture minimum wage, National Capital Region4/ IMF Government Financial Statistics (GFS) basis5/ Total public sector domestic debt6/ Central bank data, Balance-of-payments basis7/ Electronics and other electronics8/ Estimates9/ Central bank data, % of annual GDP for quarterly figures10/ Based on end-of-period gross international reserves11/ Based on Depository Corporations Survey12/ Interbank call rate13/ World Bank staff estimates14/ PSEi Composite, period average for annual figures
SECURING THE PRESENT, SHAPING THE FUTURE
COUNTRY PAGES AND KEY INDICATORS 93

Sm a l l PacIf Ic ISl a ndS
The small, remote economies of Vanuatu, Samoa, Tonga, Kiribati and Tuvalu (the “Pacific Islands”) are highly vulnerable to external shocks. Most are still in the process of recovering from the combined effects of the global economic crisis and the natural disasters affecting the region in the last two years. If food prices continue to rise in 2011, this will pose a particular challenge for the Pacific Islands, which are heavily dependent on imported food. If oil prices also continue to rise, the effect will be compounded, not only through direct energy costs but also by exacerbating the already high transport costs faced by these remote economies. During the earlier global food and fuel crisis, inflation peaked at just below 20 percent in Samoa and Kiribati.
Among the Pacific Islands, Vanuatu’s economy continues to be the strongest performer, with GDP growth estimated to have been 3 percent in 2010. While this represents a downward revision to earlier forecasts, due to the lower-than-expected growth of all major sectors, it remains a solid result in the context of a difficult external environment. The tourism sector, a key driver of the Vanuatu economy, did not continue the growth exhibited in 2009, but more-or-less maintained the gains made in that peak year. Tourism earnings during the peak September quarter were estimated to be higher than during the same period in 2009, largely due to the depreciation of the vatu against the Australian dollar—by far Vanuatu’s biggest tourist market. The government is estimated to have posted a modest deficit in 2010, with tax revenue in the first three quarters of 2010 keeping pace with that received in the same period of 2009, but expenditure—mainly development expenditure—higher than the previous year. The fiscal deficit in 2009 stood at just under 1 percent of GDP.
A rebound in tourist arrivals is expected to underpin higher overall economic growth in 2011, with the government forecasting growth of 4.2 percent. The agricultural sector is also projected by the government to grow strongly, boosted by continued high commodity prices for Vanuatu’s key exports. Major projects in
the construction sector should also support growth, but Vanuatu still faces the challenge of replacing the stimulus to the economy that has been provided by Millennium Challenge Account-funded infrastructure projects over the last half decade. Private sector credit growth continues to be strong—at just under 12 percent in the year to October 2010—with asset quality continuing to improve over the same period. In recent months, however, loans to individuals and households have driven private sector credit growth, with loans to businesses contracting. At this stage, inflationary pressures remain weak, with headline inflation of 2.3 percent and underlying inflation of –1.6 percent in the September quarter, relative to the same period in 2009.
Samoa’s economy is now beginning to recover from the combined effects of the earlier global food and fuel crisis, the global economic crisis, and the devastating tsunami of late 2009. After contracting by nearly 5 percent in the 2008/09 fiscal year, the economy is estimated to have grown by 0.6 percent in 2009/10. The tourism sector—whose infrastructure was severely damaged by the tsunami—contracted in 2009/10, but the major reconstruction program instituted in the wake of the tsunami provided a stimulus to the economy and the economy was also boosted by the expansion of a major manufacturing plant. Primarily as a result of the reconstruction program, but also in consequence of falling tax revenues, Samoa’s budget is estimated to have recorded a deficit of 8.1 percent of GDP in 2009/10. Samoa’s monetary policy stance has remained accommodative.
In 2010/11, the government projects that Samoa’s economy will grow by 2.6 percent. Continued implementation of the reconstruction program is expected to play an important role in supporting this growth. To fund this reconstruction program, the government has budgeted for a deficit equivalent to 9 percent of GDP in 2010/11, to be financed mainly through concessional loans. Available indicators suggest that the tourism sector remains subdued. In the first four months of the 2010/11 fiscal year, tourist arrivals were 4 percent below the same period in 2009/10,
WORLD BANK EAST ASIA AND PACIFIC ECONOMIC UPDATE 2011, VOL. 1
94 COUNTRY PAGES AND KEY INDICATORS

with tourism earnings 2 percent lower. Remittances, which are critical to the Samoan economy (typically equal to about 30 percent of GDP), are also somewhat subdued—but this may simply be reflecting the extraordinary response of remittances to the tsunami of September 2009. In the first four months of the 2010/11 fiscal year remittances were 4 percent below the same period in 2009/10 (when the tsunami occurred), in local currency terms. After a period of contraction in 2009, private sector credit has begun to expand, and in the year to October 2010 grew by 4 percent. Although inflation remains moderate, it is beginning to pick up, with headline inflation reaching 4.1 percent in October 2010 compared to the same period in 2009, and underlying inflation reaching 3.4 percent.
Tonga’s recovery from the combined effects of the earlier global food and fuel crisis, the global economic crisis, and a series of natural disasters that affected the country in 2009 and 2010, is yet to gain traction. After contracting by 0.4 percent in the 2008/09 fiscal year, the economy is estimated to have contracted by a further 1.2 percent in 2009/10. The key reason for the weak performance of the domestic economy has been the sharp decline in remittances that Tonga has experienced during the global economic crisis. In pa’anga terms, remittances fell by 13.6 percent in FY2008/09, and a further 10.2 percent in FY2009/10. Thus far in FY2010/11, remittance receipts have remained flat. Remittances were the equivalent of only 22 percent of GDP in 2009/10, down from 31 percent of GDP in 2007/08. As a result of falling tax revenues and increased construction expenditure financed by two loans from China’s EXIM Bank, Tonga’s budget deficit was 4.8 percent of GDP in 2009/10. Without budget support grants from donors, the deficit would have been 6.1 percent of GDP. Tonga’s monetary policy stance has remained accommodative.
In 2010/11, the government projects that Tonga’s economy will grow by 1.4 percent, but achieving this expansion will be difficult if remittances and private sector credit remain subdued. By the beginning of the 2010/11 fiscal year, the earlier decline in remittances appeared to have bottomed-out, and remittances
began to rise again. Remittances are still lower than the previous year, however, with remittances in October 2010 some 3.7 percent below the same period in 2009. Private sector credit continues to contract, and in October 2010 was 10.3 percent below the same period in 2009. Although inflation remains moderate, it is beginning to pick up with headline inflation reaching 4.8 percent in October 2010 compared to the same period in 2009. As a result of continued weak tax revenues and a further increase in construction expenditure, Tonga’s budget deficit is expected to be around 4.8 percent of GDP (or 9.2 percent of GDP in the absence of anticipated donor budget support grants). The loans contracted to finance the increased construction expenditure are causing a sharp increase in Tonga’s level of indebtedness, with public debt projected to reach 58.5 percent of GDP in the next fiscal year.
The economies of Kiribati and Tuvalu are both estimated to have begun to recover in 2010, after experiencing modest contractions in 2009. Government expenditure in both countries depends, to a significant extent, on revenues from trust funds—the asset bases and returns from which were severely affected by the global financial crisis. Seafarers’ remittances, an important source of income for households in both countries, were also negatively affected by the global downturn. The contraction in global trade reduced demand for seafarers from Kiribati and Tuvalu and consequently their remittance receipts. Kiribati is estimated to have grown by around 1 percent in 2010, with a smaller—perhaps marginal—rate of growth in Tuvalu. Both face significant challenges ahead to sustain economic growth, not least due to shortfalls in financing critical government expenditure and in adapting to the impacts of climate change (see the Box on climate change adaptation in Kiribati).
Financing critical government expenditure is an immediate challenge for Tuvalu in 2011, because the reserve funds available to the government to finance deficits are likely to be insufficient to enable the government to maintain recent levels of expenditure this year. Government expenditure has risen steadily over the last half decade, with the primary cause of the
SECURING THE PRESENT, SHAPING THE FUTURE
COUNTRY PAGES AND KEY INDICATORS 95

increase being subsidies and transfers—particularly transfers for health treatment abroad. Although revenues had also been expanding, resulting in a reduction in the deficit, this trend reversed shared in 2010. To address the current shortfall, expenditure rationalisation and increased donor support may both be required in 2011. A reduction in government expenditure is, however, likely to have a negative effect on Tuvalu’s economic growth in 2011.
The challenge of climate change adaptation in Kiribati
Kiribati is one of the most vulnerable countries in the world to the effects of climate change and sea level rise. With a population of just over 98,000, it consists of 33 low-lying atoll islands spread over a vast area of 3.5 million square kilometers of ocean. Nearly half of the population lives in South Tarawa, a highly dense area with a population growth of 3 percent per year. At current rates, the national population will increase by 55 percent by 2025, placing even greater challenges on a fragile environment.
Most of the land in Kiribati is less than 3 metres above sea level and on average only a few hundred metres wide, rendering retreat options untenable. The islands are exposed to periodic storm surges and to droughts, and are becoming increasingly vulnerable due to high population concentration, accelerated coastal development, and environmental degradation. Estimates suggest that by 2050, some 25–54 percent of areas in Bikenibeu, South Tarawa, and 55–80 percent of Buariki, North Tarawa, could become inundated.
Climate change and sea level rise could also severely affect the main Tarawa groundwater lens, increase the epidemic potential for dengue fever, decrease agricultural productivity, and divert critical tuna resources from Kiribati waters. Moreover, climate change is threatening the marine ecosystems around Kiribati, in particular through impacts on the coral reefs surrounding the islands, with implications for subsistence and small-scale commercial near shore fisheries, failure of the reef to act as an effective buffer of wave energy, and increased island instability as sediment resources decline.
Overall, in the absence of adaptation, Kiribati could face economic damages due to climate change and sea level rise by 2050 equivalent to 17–34 percent of its 1998 GDP. Recognising the seriousness of the challenge, the government initiated the Kiribati Adaptation Program (KAP), aimed at reducing Kiribati’s vulnerability to climate change, climate variability and sea level rise. The KAP involves mainstreaming climate change adaptation into national economic planning and the operational plans of all government ministries, diagnosing climate-related problems, designing cost-effective adaptation measures, and implementing these across vulnerable areas of Kiribati. At present, Kiribati is piloting investments for the protection of key coastal assets in South Tarawa (the road, airport and hospital) and the protection of freshwater supplies—Kiribati’s two areas of greatest vulnerability. Community consultation and participation is a cornerstone of the KAP, particularly given that some of the components of adaptation rely on community awareness, behavioural change and private investments.
WORLD BANK EAST ASIA AND PACIFIC ECONOMIC UPDATE 2011, VOL. 1
96 COUNTRY PAGES AND KEY INDICATORS

Sol omon ISl a ndS
Population 506,967
Population growth 2.3 percent
Surface area 28,900 sq. km.
Capital HoniaraSource: World Development Indicators.
Real GDP growth recovered in 2010 from the previous year’s external and domestic shocks. The economy is estimated to have expanded by more than 5 percent in 2010 after contracting about 2.3 percent in 2009. The overall production index returned to its mid-2008 levels in the third quarter of 2010. Improved external conditions aided the recovery, although the unsustainable logging sector and aid inflows remain the economy’s main drivers. Logging production has been more resilient than expected and reached record levels in late 2010, with 16 percent more logs, worth 46 percent more, exported in the third quarter of 2010 compared with a year earlier. Even with this recovery, however, incomes barely kept pace with the pace of population growth which amounts to about 2.3 percent a year according to the recently-released 2009 census.
By the third quarter of 2010 exports exceeded their pre-crisis peaks. The resurgence in logging explains the increase, although volumes for other exports improved with greater demand. Various sectoral factors contributed as well—agricultural production recovered after the 2009’s floods, better boats and the reopening of a tuna cannery supported fishing activity, and improved inter-island shipping services helped cocoa farmers more efficiently transport crops to processors and exporters. International prices for
Solomon Islands’ cash crops were buoyant (with the exception of cocoa). These factors and improved government finances all supported domestic demand. Improved external financing conditions and the ongoing benefits of sectoral liberalization attracted investment in telecommunications and mining, with ongoing boosts to these sectors’ output.
Consumer prices in Honiara were flat or falling through mid-2010, and higher global food prices are yet to have an impact. Overall consumer prices grew only 0.5 percent from a year earlier in October 2010, and local prices were particularly weak. In October, imported food prices were 6 percent lower than a year before, although a little higher than mid-year, and local food prices have followed a similar pattern. Movements in global food prices affect retail prices in the Pacific nations with a 3-6 month lag, the time it takes for the goods to pass through wholesale and shipping chains. And many of the global food prices that rose in mid-2010 are not relevant for most households in the Solomons, particularly outside the capital Honiara. Rice is the key imported food item in the diets of urban households who still rely on traditional carbohydrates, particularly in rural areas—one third of poorer rural households’ total spending is on tubers. Far more important are movements in fuel prices. The dispersed and remote distribution of the population and very limited local production means increases in fuel prices affect all goods. Again there are several months’ lag between an increase in global benchmark oil prices and higher fuel costs for local shipping and motorists. By January 2011, the late 2010 increase in global oil prices was beginning to appear in Honiara prices, prompting, for example, a 30 percent increase in taxi fares.
Government finances ended 2010 with a surplus of 4.2 percent of GDP (SBD 193 million) compared with an earlier expected deficit of 5.3 percent. The differences are due to both stronger revenues (7 percent more than projected, in part due to higher logging-related receipts) and spending 16 percent below budget, with the development budget particularly under-spent. The government reports having settled all valid accounts and arrears in 2010, an improvement on previous years. The
SECURING THE PRESENT, SHAPING THE FUTURE
COUNTRY PAGES AND KEY INDICATORS 97

government has recently started to post spending and revenue outturns, and other information on the Ministry of Finance’s website, a welcome development
Solomon Islands now has a much stronger cash reserves position. The 2010 surplus and the disbursement of SBD 157 million of EU budget support reinforced cash reserves and represents a significant improvement from just two years ago, when cash balances had fallen to dangerously low levels. The 18-month IMF standby agreed in May 2010 has provided a framework to address these issues. The first assessment found the program successfully progress against its targets, and the second tranche of financing was released in November, taking total disbursements to $9.66 million. Government debt continued to decline, taking the country to ‘yellow light’ status under the Honiara debt rescheduling agreements. Government debt fell to SBD 1,347 million (29.3 percent of GDP) in November 2010. At these levels the government is now able to access concessional financing.
Monetary conditions eased, with continuing excess liquidity in the banking system, while foreign exchange reserves rose further. The average interest rate on commercial loans declined from over 15 percent in June to 13.6 percent by December 2010 and net interest margins fell as time deposit rates recorded a small increase over this period. Yet private credit growth remained very weak—the stock of commercial loans has declined since mid-2009. Total liquidity in the banking system rose by 7.6 percent to SBD 839 million in November, driven by a continuous rise in largely unsterilized inflows (largely from foreign direct investment and donor support). The SBD remained near 8.1 per U.S. dollar, implying some modest appreciations against major trading partner currencies. Foreign exchange reserves rose to $257 million or 9.5 months of imports, a significant strengthening from the less-than 3 months’ cover in early 2009. To remove some of the liquidity, the central bank resumed auctioning short-term paper (the 28 day ‘Bokolo Bill’, named after a type of traditional shell currency) with a SBD 20 million auction at the start of February. The Central Bank of Solomon Islands (CBSI) hopes that
these will help to lay the path for establishing a policy interest rate, and to compliment the 56 day and longer Treasury bills which the government largely uses for cash management purposes.
The economic outlook is for growth to strengthen to as much as 7 percent in 2011. Key to this will be the first production and exports from the Goldridge mine, which are expected by March 2011. Logging activity has been surprisingly strong, raising questions about both the sustainability and quality of growth. Given its highly unsustainable pace, the consensus expectation remains for a sharp decline in logging by mid-decade. Private sector investment and activity may be further boosted by the planned release of a third mobile phone operators’ license in the second quarter of 2011. The license would include an option to install 3G technology, which allows the use of smart phones and mobile internet.
Important reforms in public financial management, state owned enterprises and utilities, and telecommunications are supporting improvements in service delivery, growth, and public administration. However the full benefits of policy reform have yet to be realized, in good measure due to the challenges to administrative and policy continuity created by political uncertainty. The 2011 budget has been delayed by several months, with government relying on special provisions to extend funding through the first third of 2011. The August 2010 elections produced a coalition with a shifting parliamentary majority. The effect of chronic political uncertainty in Solomon Islands on policy continuity and government effectiveness has given rise to increased demand for political reform among the public and a newly energized media.
WORLD BANK EAST ASIA AND PACIFIC ECONOMIC UPDATE 2011, VOL. 1
98 COUNTRY PAGES AND KEY INDICATORS

Solomon Islands Key Economic Indicators2007 2008 2009 2010e 2011f 2012f
Year Year Year Year Year Year
Output, Employment and PricesGDP (% change y-y) 10.7 7.3 -2.2 5.4 5.5 5.0Tourist arrivals 15,169 18,321 18,050 .. .. ..
(% change y-y) 63.6 20.8 -1.5 .. .. ..Consumer price index (% change y-y) 10.9 18.1 1.8 1.0 5.0 4.0Public SectorGovernment revenues (% GDP) 42.1 45.2 45.3 52.1 52.0 50.0Government expenditures (% GDP) 40.8 45.5 43.1 47.1 49.7 48.5Government balance (% GDP) 1.3 -0.3 2.2 5.0 2.3 1.5Domestic public sector debt (% GDP) 10.1 9.1 8.0 6.4 5.2 4.0Foreign Trade, BOP and External DebtTrade balance (millions US$) -75 -69 -62 -128 -90 -81Exports of goods (millions US$) 160 193 157 209 274 301
(% change y-y) 41.6 21.1 -18.8 33.0 31.0 10.0Key export (% change y-y) 1/ 27.0 10.1 -20.0 25.0 5.0 -10.0Imports of goods (millions US$) 235 262 219 337 364 382
(% change y-y) 33.7 11.7 -16.5 54.0 8.0 5.0Current account balance millions US$) -48 -106 -139 -180 -150 -130
(% GDP) -8.2 -16.4 -21.1 -24.0 -19.0 -15.0Foreign direct investment, net (millions US$) 11 13 10 16 18 15Total external debt (millions US$) 173 164 146 .. .. ..
(% GDP) 32.1 25.4 22.2 19.4 18.0 17.0Debt service ratio (% exports of g&s) 5.8 9.7 8.9 9.1 9.1 8.0Foreign exchange reserves, gross (millions US$) 2/ 121 90 146 266 305 320
(months of imports g&s) 3.9 3.5 4.2 5.6 6.4 6.9Financial MarketsDomestic credit (% change y-y) 3/ 53.3 26.5 -4.2 1.0 5.0 5.0Exchange rate (SBD$/US$, eop) 7.7 8.0 8.1 8.1 8.1 8.1Real effective exchange rate (2005=100) 106.5 114.2 119.9 .. ..
(% change y-y) -0.9 7.2 5.0 .. ..
Memo: Nominal GDP (millions US$) 586 646 657 765 827 900
Source: National data sources and IMF.
e = estimatef = forecastn.i. = no issues1/ Logs2/ Includes foreign assets of non-bank financial institutions3/ Domestic credit to the private sector
SECURING THE PRESENT, SHAPING THE FUTURE
COUNTRY PAGES AND KEY INDICATORS 99

t h a Il a nd
Population 67.4 million
Population growth 0.6 percent
Surface area 513,120 sq. km.
Capital BangkokSource: World Development Indicators.
The Thai economy closed 2010 on a strong note, supported by both domestic and external demand. GDP was up 4.8 percent from the previous quarter on a seasonally-adjusted annualized (SAAR) basis, following two quarters of mild contraction. For 2010 as a whole, GDP expanded by 7.8 percent from 2009. For 2011, the high base set by the rebound leads to year-on-year growth of 3.7 percent, but quarterly growth is expected to accelerate from the average 0.6 percent recorded between the second and fourth quarters of 2010 to 4.9 percent in 2011. Despite tailwinds from domestic and regional demand, growth is not expected to return to potential until 2012 due to the substantial linkages between Thailand and advanced economies, which are still expected to under-perform in 2011.
Exports of goods and services outperformed expectations in 2010. Although a slowdown was expected in the second half of 2010 following the sharp rebound (and inventory restocking) of late 2009 and early 2010, merchandise exports remained firm and even expanded in the fourth quarter, helped by higher demand for agricultural products and vehicles. Service exports also performed well against the backdrop of the political turmoil of April and May, and by December tourist arrivals were already at a new historical high. External demand is likely to remain supportive in 2011
thanks to vehicle exports to ASEAN and Oceania, and fast-growing demand from East Asia for both goods and services. (As an indication, tourist arrivals from China were up 45 percent in 2010—nearly four times the overall rate of increase). Nevertheless, because the recovery in advanced economies (which account for 70 percent of global import demand) is still expected to proceed at a modest pace, growth in external demand will remain below historical averages.
Domestic private demand picked up following three years of sluggish growth. Private consumption expanded by 5 percent in 2010 after averaging only 2 percent over a three-year period (2006-2009), while private investment grew by 14 percent. The strength in external demand supported investment growth as manufacturers shrugged off the political impasse and expanded the capacity of existing plants. Higher commodity prices boosted agricultural incomes, which propped up consumption in the provinces. In addition, the monetary policy “medicine” of low interest rates worked, with credit growth reaching 12 percent (year-on-year) in the fourth quarter compared to a pre-crisis peak of 11 percent. The combination of higher agricultural incomes and accommodative monetary policy helped boost demand for domestically-produced durable goods. The auto sector, in particular, expanded production by over 50 percent in 2010, helped by strong exports but also by domestic sales (up 55 percent for the year). Domestic demand will remain supportive in 2011 thanks to still-low interest rates, favorable external conditions (especially firm prices for agricultural commodities) and expansionary fiscal policy. A larger acceleration of domestic demand growth is unlikely because of rising interest rates, uncertainties on the external environment and domestic political risks (2011 is expected to be an election year).
Current inflation remains benign, but concerns about the outlook are on the rise along with food and energy prices. Headline inflation was stable at around 3 percent in 2010, while core inflation closed the year at 1.4 percent—well-below the Bank of Thailand’s inflation target of core inflation between 0.5 and 3 percent. The difference between core and headline measures can
WORLD BANK EAST ASIA AND PACIFIC ECONOMIC UPDATE 2011, VOL. 1
100 COUNTRY PAGES AND KEY INDICATORS

be explained primarily by the increase in food prices, which were up 6 percent in 2010. This was the result of supply shocks (severe flooding in October, earlier droughts and pest infestations), as well as a broader global trend. Actual price increases do not fully reflect price pressures, as the Ministry of Commerce has been keeping a lid on prices of a number of widely-consumed products through “moral suasion”. The Ministry of Commerce estimates removal of these soft price controls may add as much as 1.7 percentage points to the annual consumer price index. The government also announced a renewal of subsidies to diesel oil, which affects the prices of a number of goods through its role in transportation. Concerns about a pass-through of persistent food price increases to core inflation expectations have led the Bank of Thailand to begin normalizing interest rates in July. Interest rates were raised three times in the past six months and are currently at 2.25 percent. There are also concerns about the closing output gap, but capacity utilization in domestically-oriented sectors remains slightly below pre-crisis levels, and lending rates have remained high despite the low policy rate (Thai banks have relatively high interest margins).
SECURING THE PRESENT, SHAPING THE FUTURE
COUNTRY PAGES AND KEY INDICATORS 101
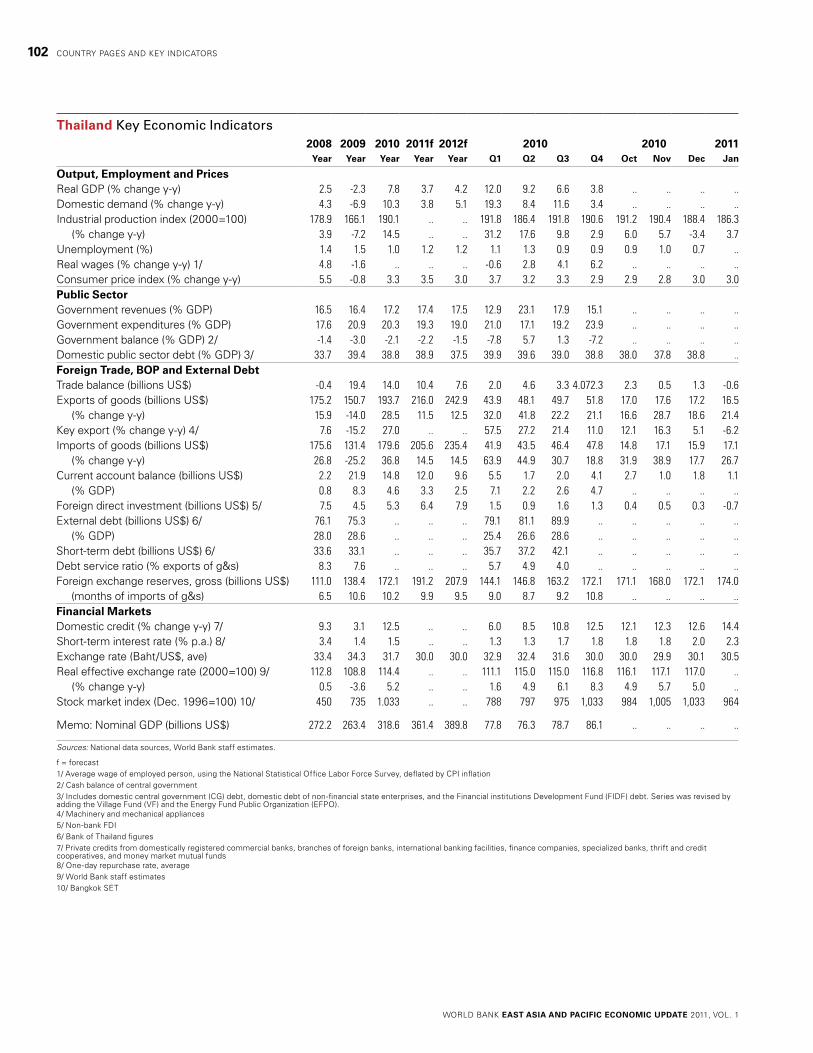
Thailand Key Economic Indicators2008 2009 2010 2011f 2012f 2010 2010 2011
Year Year Year Year Year Q1 Q2 Q3 Q4 Oct Nov Dec Jan
Output, Employment and PricesReal GDP (% change y-y) 2.5 -2.3 7.8 3.7 4.2 12.0 9.2 6.6 3.8 .. .. .. ..Domestic demand (% change y-y) 4.3 -6.9 10.3 3.8 5.1 19.3 8.4 11.6 3.4 .. .. .. ..Industrial production index (2000=100) 178.9 166.1 190.1 .. .. 191.8 186.4 191.8 190.6 191.2 190.4 188.4 186.3
(% change y-y) 3.9 -7.2 14.5 .. .. 31.2 17.6 9.8 2.9 6.0 5.7 -3.4 3.7Unemployment (%) 1.4 1.5 1.0 1.2 1.2 1.1 1.3 0.9 0.9 0.9 1.0 0.7 ..Real wages (% change y-y) 1/ 4.8 -1.6 .. .. .. -0.6 2.8 4.1 6.2 .. .. .. ..Consumer price index (% change y-y) 5.5 -0.8 3.3 3.5 3.0 3.7 3.2 3.3 2.9 2.9 2.8 3.0 3.0Public SectorGovernment revenues (% GDP) 16.5 16.4 17.2 17.4 17.5 12.9 23.1 17.9 15.1 .. .. .. ..Government expenditures (% GDP) 17.6 20.9 20.3 19.3 19.0 21.0 17.1 19.2 23.9 .. .. .. ..Government balance (% GDP) 2/ -1.4 -3.0 -2.1 -2.2 -1.5 -7.8 5.7 1.3 -7.2 .. .. .. ..Domestic public sector debt (% GDP) 3/ 33.7 39.4 38.8 38.9 37.5 39.9 39.6 39.0 38.8 38.0 37.8 38.8 ..Foreign Trade, BOP and External DebtTrade balance (billions US$) -0.4 19.4 14.0 10.4 7.6 2.0 4.6 3.3 4.072.3 2.3 0.5 1.3 -0.6Exports of goods (billions US$) 175.2 150.7 193.7 216.0 242.9 43.9 48.1 49.7 51.8 17.0 17.6 17.2 16.5
(% change y-y) 15.9 -14.0 28.5 11.5 12.5 32.0 41.8 22.2 21.1 16.6 28.7 18.6 21.4Key export (% change y-y) 4/ 7.6 -15.2 27.0 .. .. 57.5 27.2 21.4 11.0 12.1 16.3 5.1 -6.2Imports of goods (billions US$) 175.6 131.4 179.6 205.6 235.4 41.9 43.5 46.4 47.8 14.8 17.1 15.9 17.1
(% change y-y) 26.8 -25.2 36.8 14.5 14.5 63.9 44.9 30.7 18.8 31.9 38.9 17.7 26.7Current account balance (billions US$) 2.2 21.9 14.8 12.0 9.6 5.5 1.7 2.0 4.1 2.7 1.0 1.8 1.1
(% GDP) 0.8 8.3 4.6 3.3 2.5 7.1 2.2 2.6 4.7 .. .. .. ..Foreign direct investment (billions US$) 5/ 7.5 4.5 5.3 6.4 7.9 1.5 0.9 1.6 1.3 0.4 0.5 0.3 -0.7External debt (billions US$) 6/ 76.1 75.3 .. .. .. 79.1 81.1 89.9 .. .. .. .. ..
(% GDP) 28.0 28.6 .. .. .. 25.4 26.6 28.6 .. .. .. .. ..Short-term debt (billions US$) 6/ 33.6 33.1 .. .. .. 35.7 37.2 42.1 .. .. .. .. ..Debt service ratio (% exports of g&s) 8.3 7.6 .. .. .. 5.7 4.9 4.0 .. .. .. .. ..Foreign exchange reserves, gross (billions US$) 111.0 138.4 172.1 191.2 207.9 144.1 146.8 163.2 172.1 171.1 168.0 172.1 174.0
(months of imports of g&s) 6.5 10.6 10.2 9.9 9.5 9.0 8.7 9.2 10.8 .. .. .. ..Financial MarketsDomestic credit (% change y-y) 7/ 9.3 3.1 12.5 .. .. 6.0 8.5 10.8 12.5 12.1 12.3 12.6 14.4Short-term interest rate (% p.a.) 8/ 3.4 1.4 1.5 .. .. 1.3 1.3 1.7 1.8 1.8 1.8 2.0 2.3Exchange rate (Baht/US$, ave) 33.4 34.3 31.7 30.0 30.0 32.9 32.4 31.6 30.0 30.0 29.9 30.1 30.5Real effective exchange rate (2000=100) 9/ 112.8 108.8 114.4 .. .. 111.1 115.0 115.0 116.8 116.1 117.1 117.0 ..
(% change y-y) 0.5 -3.6 5.2 .. .. 1.6 4.9 6.1 8.3 4.9 5.7 5.0 ..Stock market index (Dec. 1996=100) 10/ 450 735 1.033 .. .. 788 797 975 1,033 984 1,005 1,033 964
Memo: Nominal GDP (billions US$) 272.2 263.4 318.6 361.4 389.8 77.8 76.3 78.7 86.1 .. .. .. ..
Sources: National data sources, World Bank staff estimates.
f = forecast1/ Average wage of employed person, using the National Statistical Office Labor Force Survey, deflated by CPI inflation2/ Cash balance of central government3/ Includes domestic central government (CG) debt, domestic debt of non-financial state enterprises, and the Financial institutions Development Fund (FIDF) debt. Series was revised by adding the Village Fund (VF) and the Energy Fund Public Organization (EFPO).4/ Machinery and mechanical appliances5/ Non-bank FDI6/ Bank of Thailand figures7/ Private credits from domestically registered commercial banks, branches of foreign banks, international banking facilities, finance companies, specialized banks, thrift and credit cooperatives, and money market mutual funds8/ One-day repurchase rate, average9/ World Bank staff estimates10/ Bangkok SET
WORLD BANK EAST ASIA AND PACIFIC ECONOMIC UPDATE 2011, VOL. 1
102 COUNTRY PAGES AND KEY INDICATORS

t Imor-l e S t e
Population 1.1 million
Population growth 3.2 percent
Surface area 14,870 sq. km.
Capital DiliSource: World Development Indicators.
Timor-Leste has seen rapid economic growth in the past three years, though inflationary pressures are starting to rise. Fiscal policy continues to be highly expansionary in response to development needs, including a 55 percent increase in planned spending for 2011 compared to the revised 2010 budget. Petroleum receipts in 2010 were strong, and Petroleum Fund (PF) savings are now in excess of $7 billion (over ten times the estimated non-oil GDP in 2010), providing an important buffer against potential shocks. Medium-term economic prospects are strong, and hinge on not only the quantity, but importantly the quality, of government spending. Risks include inflationary pressures; the timing of new oil and gas discoveries; and the expected decline in UN presence over the coming two years.
The economy continues to grow rapidly on the back of government spending. Growth in 2009 was estimated at 12.9 percent, with some moderate slowdown expected in 2010 due to a fall in agricultural output resulting from extended rains. Government spending, however, picked up rapidly in the second half of 2010 and other indicators (e.g. electricity consumption, credit growth) also point to strong demand in the economy. These developments are starting to contribute to poverty reduction and improved social outcomes. The recent census and labor force survey however show that the
population and employment activity have gradually concentrated in Dili in recent years. The government’s efforts to stimulate economic opportunities across the country are therefore important to help reduce vulnerability to shocks.
With strong growth there are also price pressures, with headline inflation rising to 8 percent in the year to December 2010. This was largely driven by the rise in international commodity prices. Food prices in Timor-Leste rose by over 10 percent in the year to December 2010. The rise in fuel prices have contributed to increased transportation costs (6 percent in the year to December 2010). The real effective exchange rate depreciated in the third quarter due to a weakening of the U.S. dollar against the currencies of Timor-Leste’s major trading partners, which will have further contributed to inflation. Aside from exogenous factors, however, rapid fiscal expansion including infrastructure spending is likely to be putting pressure on domestic supply networks. House building costs have consistently risen over the past twelve months, reaching 8 percent in the year to December 2010.
Credit to the private sector picked up very slightly in the last quarter of 2010, though it has remained flat in the last three years. Non-performing loans rose quickly in 2010, from around 30 percent of total loans and advances in 2009 to around 40 percent in December 2010. This is associated with a relative increase in lending to the construction sector (and reduced lending to other sectors), resulting from a ramping up of government spending on infrastructure. This does not pose systemic risk. Deposits have increased significantly in the last quarter from $261 million to $303 million. The spread between lending and deposit rates remains high at around 10-15 percent. Efforts are under way to improve access to finance by strengthening risk management, including the recent development of a credit information reporting system by the Banking and Payments Authority.
The trade deficit remains large, but declined slightly in the third quarter of 2010. Helped by a rise in international prices, coffee exports increased following a sharp drop
SECURING THE PRESENT, SHAPING THE FUTURE
COUNTRY PAGES AND KEY INDICATORS 103

in production in the first half of 2010. Official statistics show that production also bounced back quite sharply in third quarter of 2010. Imports slowed down in the third quarter but they are likely to have picked up again at the end of the year as execution of the government’s budget improved.
The overall balance of payments is strong thanks to petroleum receipts, which were close to $2.2 billion in 2010. This was higher than projected in the revised 2010 budget, and was thanks to higher international oil prices. But the increase was also due to improved tax collection on petroleum profits resulting from better enforcement. Despite a decline in U.S. Treasury bond yields in the third quarter of 2010, the overall investment performance of the PF was stronger than the same period last year. In September 2010, the government appointed Schroeders Investment Management Ltd. to invest 4 percent of the PF into equities. The government is further exploring options to diversify PF assets, including through amendments to the PF Law, with the aim of securing higher returns over the longer-term.
Fiscal policy remains highly expansionary. In 2010, the government increased spending appropriations from $660 million to $838 million. After a slow start, government spending picked up in the last quarter reaching nearly $748 million at the end of the budget year. The non-oil deficit is large, financed entirely by withdrawals from the PF, which exceeded Estimated Sustainable Income for 2010 by nearly $300 million. However, non-petroleum revenue collection is gradually improving, reflecting strengthened tax administration and enforcement capacity. The final 2011 budget approved by Parliament on 28 January is around $1.31 billion and envisages a major scaling up of capital spending, which is close to half the budget. The government is introducing several institutional changes, including the establishment of infrastructure and human capital funds, to try and accelerate capital spending whilst addressing weaknesses in project design and implementation.
The 2011 budget provides a strong indication of priorities for the government’s upcoming Strategic
Development Plan. The government envisages a heavily frontloaded investment strategy to address major infrastructure, skills, and other structural gaps. The objective is to create the conditions to generate a strong private sector supply response. This will depend critically on the prioritization and quality of investment, but also on absorptive capacity, both macroeconomic and administrative.
WORLD BANK EAST ASIA AND PACIFIC ECONOMIC UPDATE 2011, VOL. 1
104 COUNTRY PAGES AND KEY INDICATORS
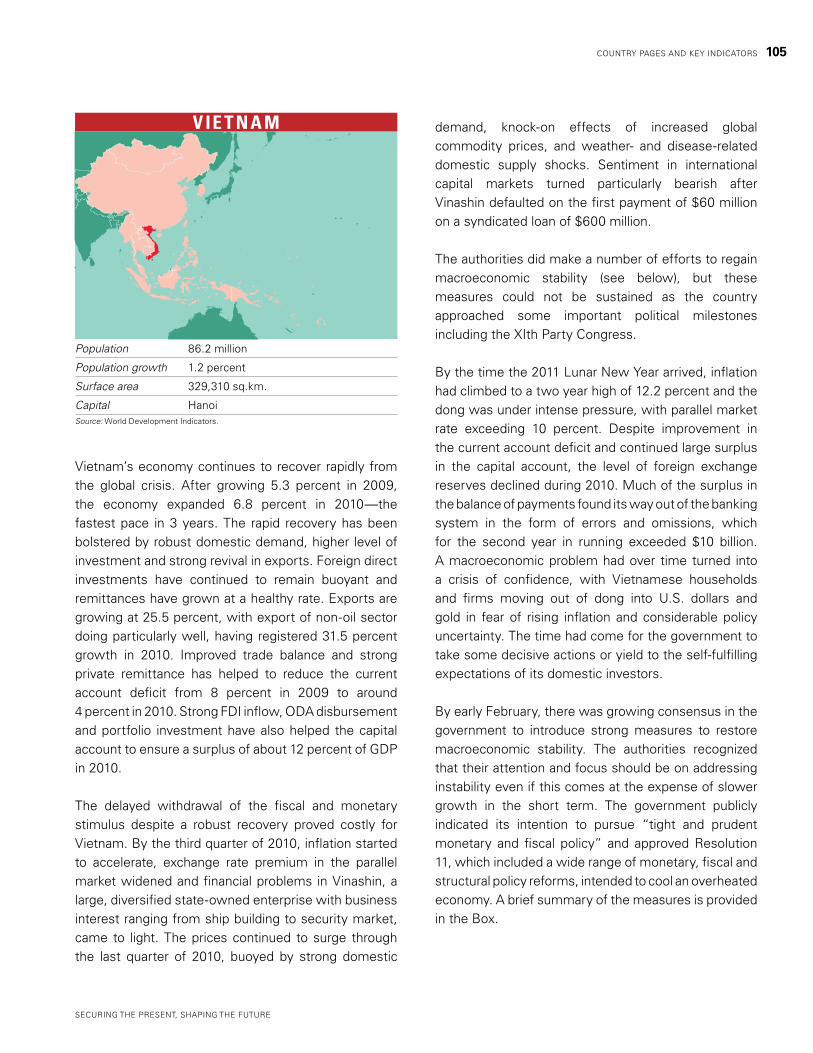
v Ie t n a m
Population 86.2 million
Population growth 1.2 percent
Surface area 329,310 sq.km.
Capital HanoiSource: World Development Indicators.
Vietnam’s economy continues to recover rapidly from the global crisis. After growing 5.3 percent in 2009, the economy expanded 6.8 percent in 2010—the fastest pace in 3 years. The rapid recovery has been bolstered by robust domestic demand, higher level of investment and strong revival in exports. Foreign direct investments have continued to remain buoyant and remittances have grown at a healthy rate. Exports are growing at 25.5 percent, with export of non-oil sector doing particularly well, having registered 31.5 percent growth in 2010. Improved trade balance and strong private remittance has helped to reduce the current account deficit from 8 percent in 2009 to around 4 percent in 2010. Strong FDI inflow, ODA disbursement and portfolio investment have also helped the capital account to ensure a surplus of about 12 percent of GDP in 2010.
The delayed withdrawal of the fiscal and monetary stimulus despite a robust recovery proved costly for Vietnam. By the third quarter of 2010, inflation started to accelerate, exchange rate premium in the parallel market widened and financial problems in Vinashin, a large, diversified state-owned enterprise with business interest ranging from ship building to security market, came to light. The prices continued to surge through the last quarter of 2010, buoyed by strong domestic
demand, knock-on effects of increased global commodity prices, and weather- and disease-related domestic supply shocks. Sentiment in international capital markets turned particularly bearish after Vinashin defaulted on the first payment of $60 million on a syndicated loan of $600 million.
The authorities did make a number of efforts to regain macroeconomic stability (see below), but these measures could not be sustained as the country approached some important political milestones including the XIth Party Congress.
By the time the 2011 Lunar New Year arrived, inflation had climbed to a two year high of 12.2 percent and the dong was under intense pressure, with parallel market rate exceeding 10 percent. Despite improvement in the current account deficit and continued large surplus in the capital account, the level of foreign exchange reserves declined during 2010. Much of the surplus in the balance of payments found its way out of the banking system in the form of errors and omissions, which for the second year in running exceeded $10 billion. A macroeconomic problem had over time turned into a crisis of confidence, with Vietnamese households and firms moving out of dong into U.S. dollars and gold in fear of rising inflation and considerable policy uncertainty. The time had come for the government to take some decisive actions or yield to the self-fulfilling expectations of its domestic investors.
By early February, there was growing consensus in the government to introduce strong measures to restore macroeconomic stability. The authorities recognized that their attention and focus should be on addressing instability even if this comes at the expense of slower growth in the short term. The government publicly indicated its intention to pursue “tight and prudent monetary and fiscal policy” and approved Resolution 11, which included a wide range of monetary, fiscal and structural policy reforms, intended to cool an overheated economy. A brief summary of the measures is provided in the Box.
SECURING THE PRESENT, SHAPING THE FUTURE
COUNTRY PAGES AND KEY INDICATORS 105
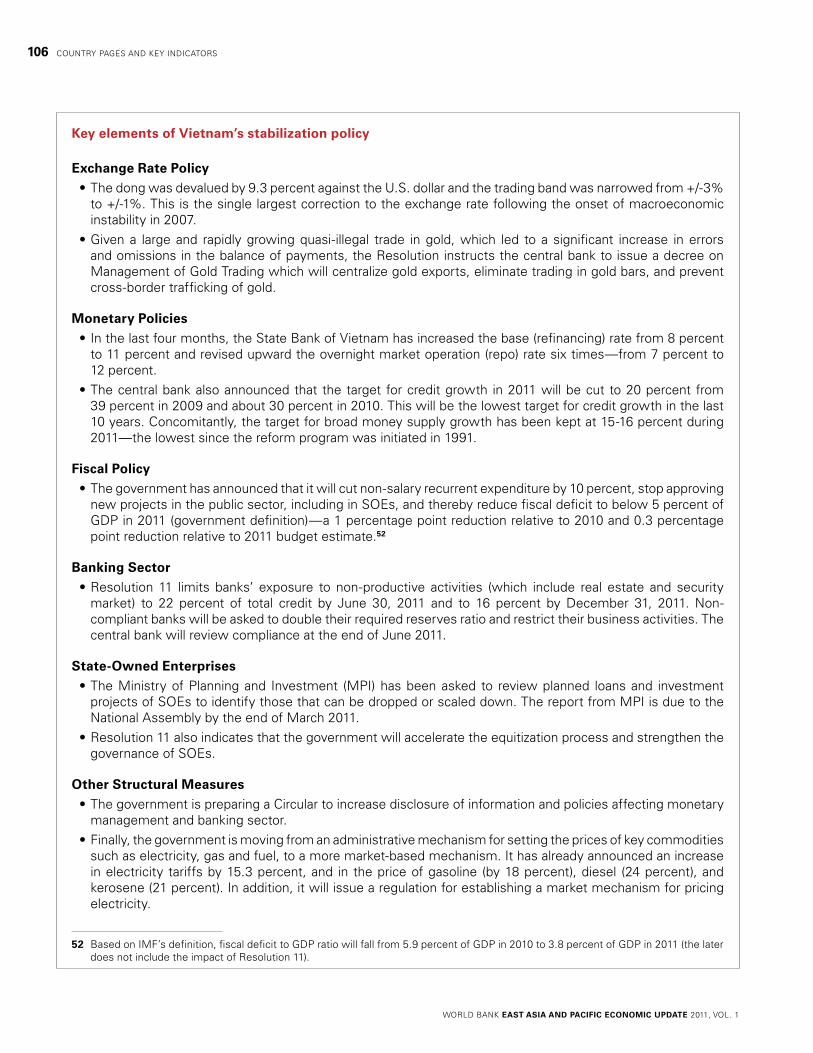
Key elements of Vietnam’s stabilization policy
Exchange Rate Policy •The dong was devalued by 9.3 percent against the U.S. dollar and the trading band was narrowed from +/-3% to +/-1%. This is the single largest correction to the exchange rate following the onset of macroeconomic instability in 2007. •Given a large and rapidly growing quasi-illegal trade in gold, which led to a significant increase in errors and omissions in the balance of payments, the Resolution instructs the central bank to issue a decree on Management of Gold Trading which will centralize gold exports, eliminate trading in gold bars, and prevent cross-border trafficking of gold.
Monetary Policies •In the last four months, the State Bank of Vietnam has increased the base (refinancing) rate from 8 percent to 11 percent and revised upward the overnight market operation (repo) rate six times—from 7 percent to 12 percent. •The central bank also announced that the target for credit growth in 2011 will be cut to 20 percent from 39 percent in 2009 and about 30 percent in 2010. This will be the lowest target for credit growth in the last 10 years. Concomitantly, the target for broad money supply growth has been kept at 15-16 percent during 2011—the lowest since the reform program was initiated in 1991.
Fiscal Policy •The government has announced that it will cut non-salary recurrent expenditure by 10 percent, stop approving new projects in the public sector, including in SOEs, and thereby reduce fiscal deficit to below 5 percent of GDP in 2011 (government definition)—a 1 percentage point reduction relative to 2010 and 0.3 percentage point reduction relative to 2011 budget estimate.52
Banking Sector •Resolution 11 limits banks’ exposure to non-productive activities (which include real estate and security market) to 22 percent of total credit by June 30, 2011 and to 16 percent by December 31, 2011. Non-compliant banks will be asked to double their required reserves ratio and restrict their business activities. The central bank will review compliance at the end of June 2011.
State-Owned Enterprises •The Ministry of Planning and Investment (MPI) has been asked to review planned loans and investment projects of SOEs to identify those that can be dropped or scaled down. The report from MPI is due to the National Assembly by the end of March 2011. •Resolution 11 also indicates that the government will accelerate the equitization process and strengthen the governance of SOEs.
Other Structural Measures •The government is preparing a Circular to increase disclosure of information and policies affecting monetary management and banking sector. •Finally, the government is moving from an administrative mechanism for setting the prices of key commodities such as electricity, gas and fuel, to a more market-based mechanism. It has already announced an increase in electricity tariffs by 15.3 percent, and in the price of gasoline (by 18 percent), diesel (24 percent), and kerosene (21 percent). In addition, it will issue a regulation for establishing a market mechanism for pricing electricity.
52 Based on IMF’s definition, fiscal deficit to GDP ratio will fall from 5.9 percent of GDP in 2010 to 3.8 percent of GDP in 2011 (the later does not include the impact of Resolution 11).
WORLD BANK EAST ASIA AND PACIFIC ECONOMIC UPDATE 2011, VOL. 1
106 COUNTRY PAGES AND KEY INDICATORS

In absence of a persuasive strategy to deal with macroeconomic turbulence, Vietnam’s economy has lurched from one episode of instability to another during the last 3 years. The recent policy announcement is an important step in the right direction to break this cycle of boom and gloom and restore the country’s image as one of the most attractive destinations of foreign investment in the region. Recently announced measures have been widely discussed and debated within the government and have the broad support of line ministries as well as key finance and budget committees in the National Assembly. The international financial markets have also reacted favorably to the recent announcement, with Vietnam’s sovereign spreads steadily declining over the past few days (see adjacent figure). This augurs well for successful implementation.
While the outlook for the next few months remains extremely challenging, the recent policy shift has reduced some of the downside risks. The hike in fuel and electricity prices, rising global commodity prices, and depreciation of the dong, however, would add fresh impetus to inflation in the near-term. But core inflation should start to decline on account of the tighter monetary and fiscal policies. A declining and stable core inflation rate, along with improved external balance, should gradually help to stabilize the foreign exchange market. Through its 2011 budget, and recent government resolution, the authorities have indicated their intention to further consolidate the fiscal accounts and gradually reduce the fiscal deficit to pre-crisis levels. Vietnam’s public debt is likely to remain sustainable if the current economic recovery continues to take hold and the authorities maintain a declining path for fiscal deficit. While stabilization policies would slow down growth in the near-term, if successfully implemented, they will help Vietnam to regain its pre-crisis growth potential in the medium-term.
Sovereign bond spreadbasis points
Vietnam EMBI Global Emerging Markets
Source:
450
400
350
200
300
250
7/1/10 2/24/118/5/10 9/2/10 10/7/10 11/4/10 12/2/10 1/6/11
SECURING THE PRESENT, SHAPING THE FUTURE
COUNTRY PAGES AND KEY INDICATORS 107

Vietnam Key Economic Indicators2007 2008 2009 2010e 2011f 2012f
Year Year Year Year Year Year
Output, Employment and PricesReal GDP (% change y-y) 8.5 6.2 5.3 6.8 6.3 6.7Industrial production index
(% change y-y) 16.7 13.9 7.6 14.0 13.0 13.5Unemployment (%) 1/ 4.6 4.7 4.6 4.4 4.0 4.0Consumer price index (% change y-y) 12.6 19.9 6.5 11.8 9.5 6.5Public SectorGovernment balance, official (% GDP) 2/ -0.7 1.2 -5.1 0.1 -1.0 -1.0Government balance, general (% GDP) 3/ -2.5 -1.2 -9.0 -4.4 -3.9 -3.8Public sector debt (% GDP) 4/ 44.6 42.9 51.2 52.8 53.4 52.7Foreign Trade, BOP and External DebtTrade balance (billions US$) -10.4 -12.8 -8.3 -7.1 -7.4 -7.8Exports of goods (billions US$) 48.6 62.7 57.1 72.2 84.8 99.5
(% change y-y) 21.9 29.1 -8.9 26.4 17.5 17.3Key export (% change y-y) 4/ 2.7 23.1 -40.2 -23.0 -5.0 -5.0Imports of goods (billions US$) 58.9 75.5 65.4 79.3 92.3 107.3
(% change y-y) 38.3 28.1 -13.3 21.2 16.4 16.3Current account balance (billions US$) -7.0 -10.8 -6.1 -4.0 -4.4 -4.5
(% GDP) -9.8 -11.9 -6.6 -3.8 -3.8 -3.6Foreign direct investment (billions US$) 6.6 9.3 6.9 7.1 7.2 7.3External debt (billions US$) 23.0 30.2 38.8 44.5 49.6 52.9
(% GDP) 32.4 33.4 41.6 42.5 43.1 42.3Debt service ratio (% exports of g&s) 2.8 2.6 4.5 3.2 3.2 3.5Foreign exchange reserves, gross (billions US$) 6/ 21.0 23.0 14.1 12.4 .. ..
(months of imports of g&s) 3.0 3.8 1.9 1.5 .. ..Financial MarketsDomestic credit (% change y-y) 53.9 25.4 39.6 28.6 20.0 20.0Short-term interest rate (% p.a.) 7/ 7.8 8.1 10.7 13.0 .. ..Exchange rate (Dong/US$, eop) 16.003 17.486 18.479 19.498 .. ..Real effective exchange rate (2000=100) 106.0 125.9 116.1 117.4 .. ..
(% change y-y) 9.5 18.8 -7.8 1.1 .. ..Stock market index (Jul. 2000=100) 8/ 927 316 495 485 .. ..
Memo: Nominal GDP (billions US$) 71 90 93 105 115 125
Sources: Vietnam Government Statistics Office, State Bank of Vietnam, IMF, and World Bank staff estimates.
e = estimatef = forecast1/ Urban areas2/ Excludes off-budgetary items3/ Includes off-budgetary items4/ Public and publicly-guaranteed debt5/ Crude oil6/ Based on IMF International Financial Statistics (IFS) as of September 20107/ Three-month deposit, end-of-period8/ Ho Chi Minh Stock Index
WORLD BANK EAST ASIA AND PACIFIC ECONOMIC UPDATE 2011, VOL. 1
108 COUNTRY PAGES AND KEY INDICATORS
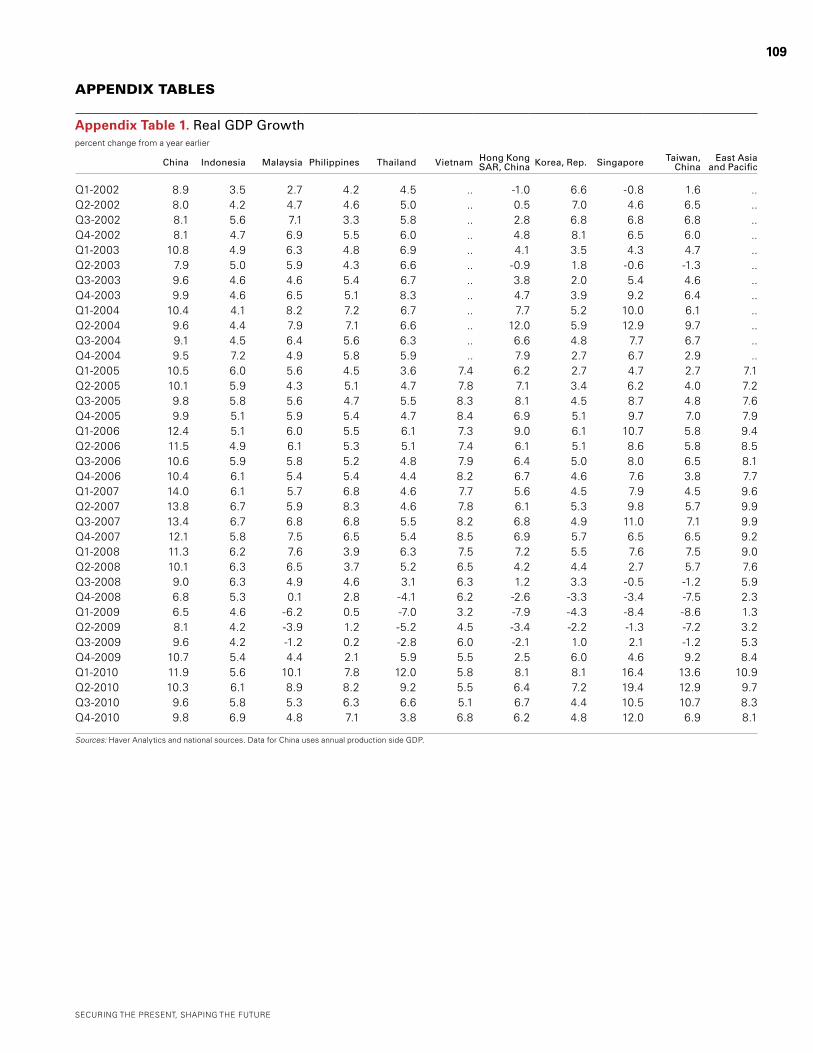
aPPendix tables
Appendix Table 1. Real GDP Growthpercent change from a year earlier
China Indonesia Malaysia Philippines Thailand Vietnam Hong Kong SAR, China Korea, Rep. Singapore Taiwan,
ChinaEast Asia
and Pacific
Q1-2002 8.9 3.5 2.7 4.2 4.5 .. -1.0 6.6 -0.8 1.6 ..Q2-2002 8.0 4.2 4.7 4.6 5.0 .. 0.5 7.0 4.6 6.5 ..Q3-2002 8.1 5.6 7.1 3.3 5.8 .. 2.8 6.8 6.8 6.8 ..Q4-2002 8.1 4.7 6.9 5.5 6.0 .. 4.8 8.1 6.5 6.0 ..Q1-2003 10.8 4.9 6.3 4.8 6.9 .. 4.1 3.5 4.3 4.7 ..Q2-2003 7.9 5.0 5.9 4.3 6.6 .. -0.9 1.8 -0.6 -1.3 ..Q3-2003 9.6 4.6 4.6 5.4 6.7 .. 3.8 2.0 5.4 4.6 ..Q4-2003 9.9 4.6 6.5 5.1 8.3 .. 4.7 3.9 9.2 6.4 ..Q1-2004 10.4 4.1 8.2 7.2 6.7 .. 7.7 5.2 10.0 6.1 ..Q2-2004 9.6 4.4 7.9 7.1 6.6 .. 12.0 5.9 12.9 9.7 ..Q3-2004 9.1 4.5 6.4 5.6 6.3 .. 6.6 4.8 7.7 6.7 ..Q4-2004 9.5 7.2 4.9 5.8 5.9 .. 7.9 2.7 6.7 2.9 ..Q1-2005 10.5 6.0 5.6 4.5 3.6 7.4 6.2 2.7 4.7 2.7 7.1Q2-2005 10.1 5.9 4.3 5.1 4.7 7.8 7.1 3.4 6.2 4.0 7.2Q3-2005 9.8 5.8 5.6 4.7 5.5 8.3 8.1 4.5 8.7 4.8 7.6Q4-2005 9.9 5.1 5.9 5.4 4.7 8.4 6.9 5.1 9.7 7.0 7.9Q1-2006 12.4 5.1 6.0 5.5 6.1 7.3 9.0 6.1 10.7 5.8 9.4Q2-2006 11.5 4.9 6.1 5.3 5.1 7.4 6.1 5.1 8.6 5.8 8.5Q3-2006 10.6 5.9 5.8 5.2 4.8 7.9 6.4 5.0 8.0 6.5 8.1Q4-2006 10.4 6.1 5.4 5.4 4.4 8.2 6.7 4.6 7.6 3.8 7.7Q1-2007 14.0 6.1 5.7 6.8 4.6 7.7 5.6 4.5 7.9 4.5 9.6Q2-2007 13.8 6.7 5.9 8.3 4.6 7.8 6.1 5.3 9.8 5.7 9.9Q3-2007 13.4 6.7 6.8 6.8 5.5 8.2 6.8 4.9 11.0 7.1 9.9Q4-2007 12.1 5.8 7.5 6.5 5.4 8.5 6.9 5.7 6.5 6.5 9.2Q1-2008 11.3 6.2 7.6 3.9 6.3 7.5 7.2 5.5 7.6 7.5 9.0Q2-2008 10.1 6.3 6.5 3.7 5.2 6.5 4.2 4.4 2.7 5.7 7.6Q3-2008 9.0 6.3 4.9 4.6 3.1 6.3 1.2 3.3 -0.5 -1.2 5.9Q4-2008 6.8 5.3 0.1 2.8 -4.1 6.2 -2.6 -3.3 -3.4 -7.5 2.3Q1-2009 6.5 4.6 -6.2 0.5 -7.0 3.2 -7.9 -4.3 -8.4 -8.6 1.3Q2-2009 8.1 4.2 -3.9 1.2 -5.2 4.5 -3.4 -2.2 -1.3 -7.2 3.2Q3-2009 9.6 4.2 -1.2 0.2 -2.8 6.0 -2.1 1.0 2.1 -1.2 5.3Q4-2009 10.7 5.4 4.4 2.1 5.9 5.5 2.5 6.0 4.6 9.2 8.4Q1-2010 11.9 5.6 10.1 7.8 12.0 5.8 8.1 8.1 16.4 13.6 10.9Q2-2010 10.3 6.1 8.9 8.2 9.2 5.5 6.4 7.2 19.4 12.9 9.7Q3-2010 9.6 5.8 5.3 6.3 6.6 5.1 6.7 4.4 10.5 10.7 8.3Q4-2010 9.8 6.9 4.8 7.1 3.8 6.8 6.2 4.8 12.0 6.9 8.1
Sources: Haver Analytics and national sources. Data for China uses annual production side GDP.
SECURING THE PRESENT, SHAPING THE FUTURE
109

Appendix Table 2. Real GDP and Components of Aggregate Demandpercent change from a year earlier
Indonesia Malaysia Philippines Thailand Hong Kong SAR, ChinaKorea, Rep. Singapore Taiwan,
China S.E. Asia NIEs
GDP 2005 5.7 5.3 5.0 4.6 7.1 4.0 7.4 4.7 5.2 4.92006 5.5 5.8 5.3 5.1 7.0 5.2 8.7 5.4 5.4 5.82007 6.3 6.5 7.1 5.0 6.4 5.1 8.8 6.0 6.1 5.92008 6.0 4.7 3.7 2.5 2.3 2.3 1.5 0.7 4.4 1.82009 4.6 -1.7 1.1 -2.3 -2.7 0.2 -0.8 -1.9 1.0 -0.92010 6.1 7.2 7.3 7.8 6.8 6.1 14.5 10.8 7.0 8.3
Private Consumption 2005 4.0 9.1 4.8 4.6 3.0 4.6 3.6 2.9 5.3 3.82006 3.2 6.8 5.5 3.2 5.9 4.7 3.5 1.5 4.3 3.92007 5.0 10.5 5.8 1.8 8.5 5.1 6.4 2.1 5.4 4.92008 5.3 8.5 4.7 2.9 2.4 1.3 3.2 -0.9 5.2 1.02009 4.9 0.7 4.1 -1.1 0.6 0.2 0.2 1.1 2.4 0.52010 4.6 6.6 5.3 4.8 5.8 4.1 4.2 3.7 5.2 4.3
Fixed Investment 2005 10.9 5.0 -6.6 10.5 4.1 1.9 -1.7 2.7 6.7 2.12006 2.6 7.5 3.9 3.9 7.1 3.4 17.0 0.1 4.2 4.22007 9.3 9.4 10.9 1.5 3.4 4.2 19.6 0.6 7.5 4.42008 11.9 0.7 2.7 1.2 1.0 -1.9 13.5 -12.4 5.3 -2.92009 3.3 -5.6 -0.4 -9.2 -3.9 -0.2 -2.9 -11.0 -2.3 -3.92010 8.5 9.4 17.1 9.4 8.1 6.2 5.1 23.7 10.3 11.2
Exports of Goods & Services
2005 16.6 8.3 4.8 4.2 10.6 7.8 20.7 7.8 9.6 9.32006 9.4 6.6 13.4 9.1 9.4 11.4 9.7 11.4 9.4 10.92007 8.5 4.1 5.5 7.8 8.3 12.6 20.1 9.6 6.9 11.82008 9.5 1.6 -2.0 5.1 2.6 6.6 -29.7 0.9 4.8 1.22009 -9.7 -10.4 -13.4 -12.5 -10.1 -0.8 20.4 -8.7 -11.2 -2.52010 14.9 9.8 25.6 11.7 16.8 14.1 38.0 25.6 14.8 19.9
Sources: Haver Analytics, national data sources, and World Bank staff estimates. Regional averages are 2000 US$ GDP weighted.
Appendix Table 3. East Asia: Merchandise Export Growthin U.S. dollars, percent change from a year earlier
2008 2009 2010 Q1 2010 Q2 2010 Q3 2010 Q4 2010 Oct-10 Nov-10 Dec-10 Jan-11
East Asia and Pacific (10) 13.6 -16.2 29.8 33.4 36.9 28.8 22.5 21.6 27.4 18.8 31.0China 17.4 -15.9 31.4 28.7 40.9 32.3 24.9 22.9 35.0 17.9 37.6S.E. Asia 15.0 -16.6 29.6 31.3 39.4 30.7 24.0 16.9 27.6 21.4 18.0
Indonesia 20.1 -15.0 35.5 54.7 36.9 27.7 28.9 17.6 45.1 26.1 24.7Malaysia 13.4 -21.1 26.3 40.9 33.2 23.1 13.2 11.2 14.6 14.0 13.7Philippines -2.7 -21.7 33.8 43.0 33.3 39.9 21.7 27.4 11.5 26.5 ..Thailand 14.3 -13.6 28.6 34.1 39.3 23.2 20.9 17.4 27.6 18.1 19.4Vietnam 29.2 -10.1 26.9 2.8 33.7 36.8 34.2 23.9 41.7 37.2 38.4
NIEs 9.3 -16.2 28.3 36.6 33.5 25.9 20.2 22.6 19.5 0.0 30.3Hong Kong SAR, China 5.3 -12.2 22.5 25.8 23.9 27.4 14.2 13.8 16.6 12.2 27.3Korea, Rep. 13.6 -13.9 28.3 35.8 33.1 22.7 23.8 27.6 21.4 22.6 45.4Singapore 12.9 -20.2 30.5 38.4 36.5 27.4 22.5 28.2 19.4 20.1 27.4Taiwan, China 3.7 -20.5 35.0 53.4 47.0 27.2 20.2 20.8 21.0 18.8 15.7
Source: Haver Analytics.
WORLD BANK EAST ASIA AND PACIFIC ECONOMIC UPDATE 2011, VOL. 1
110 APPENDIX TABLES

Appendix Table 4. East Asia and the Pacific: GDP Growth Projectionspercent change form a year earlier
Forecast Forecast
2002 2003 2004 2005 2006 2007 2008 2009 2010 2011 2012
East Asia and Pacific 7.0 6.7 7.9 8.0 9.1 10.1 6.3 4.8 9.2 7.2 7.1Developing East Asia 7.9 8.8 9.0 9.8 10.9 12.3 8.4 7.4 9.6 8.2 7.9
China 9.1 10.0 10.1 11.3 12.7 14.2 9.6 9.2 10.3 9.0 8.5Indonesia 4.5 4.8 5.0 5.7 5.5 6.3 6.0 4.6 6.1 6.4 6.7Malaysia 5.4 5.8 6.8 5.3 5.8 6.5 4.6 -1.7 7.2 4.8 5.7Philippines 4.3 5.0 6.4 5.0 5.3 7.1 3.7 1.1 7.3 5.0 5.4Thailand 5.3 7.1 6.3 4.6 5.1 5.0 2.5 -2.3 7.8 3.7 4.2Vietnam 7.1 7.3 7.8 8.4 8.2 8.5 6.2 5.3 6.8 6.3 6.7Cambodia 6.5 8.5 10.3 13.3 10.8 10.2 6.7 -2.0 6.7 6.5 6.5Fiji 3.2 1.0 5.3 0.7 1.9 -0.9 0.2 -3.0 0.1 1.3 0.7Lao PDR 5.9 6.1 6.4 7.1 8.5 7.4 7.5 7.5 8.4 8.6 7.6Mongolia 4.2 6.1 10.8 7.3 8.6 10.2 8.9 -1.3 6.1 10.3 7.6Papua New Guinea -0.2 2.2 2.7 3.4 2.3 7.2 6.7 5.5 7.5 5.5 5.5Solomon Islands -2.8 6.5 8.0 5.0 6.9 10.7 7.3 -2.2 5.4 5.5 5.0Timor-Leste 2.4 0.1 4.2 6.2 -5.8 8.4 12.8 12.9 .. .. ..
East Asia NIEs 5.6 3.2 6.0 4.9 5.8 5.9 1.8 -0.9 8.2 4.6 4.9
Sources: World Bank data and staff estimates.
Appendix Table 5. Regional Aggregates for Poverty Measures in East Asia $1.25-a-day $2-a-day
Mean Consumption (2005 PPP$/month)
Headcount Index (%)
Number of Poor (million)
Headcount Index (%)
Number of Poor (million)
Population (million)
East Asia and Pacific1990 49.16 54.7 873.3 79.8 1,273.7 1,595.91993 54.55 50.8 845.3 75.8 1,262.1 1,664.91996 67.01 36.0 622.3 64.1 1,108.1 1,728.71999 70.76 35.5 635.1 61.8 1,104.9 1,788.42002 85.65 27.6 506.8 51.9 954.1 1,837.02005 106.85 16.8 316.2 38.7 728.7 1,884.4East Asia and Pacific excluding China1990 72.98 39.2 180.5 66.0 304.4 460.81993 73.84 42.6 207.3 68.0 330.9 486.41996 85.81 35.0 178.8 61.5 314.2 511.21999 82.96 35.2 188.1 62.7 335.2 534.72002 89.76 25.5 142.1 54.0 300.8 556.62005 100.98 19.0 110.2 44.8 259.5 579.9South East Asia (Indonesia, Malaysia, Philippines, Thailand)1990 77.05 38.6 120.3 65.1 202.9 311.81993 82.24 37.8 124.2 63.8 209.8 328.71996 96.46 29.5 101.6 56.2 193.9 344.91999 91.12 31.8 114.8 59.2 213.6 361.12002 97.84 21.3 80.3 49.9 188.4 377.32005 107.30 17.0 66.8 42.2 166.0 393.8Lower-Income East Asia (Cambodia, Lao PDR, PNG, Vietnam)1990 58.57 41.2 34.6 69.5 58.4 84.11993 43.53 60.5 54.4 83.6 75.2 90.01996 47.82 55.1 52.7 80.6 77.1 95.71999 54.43 47.3 47.4 75.3 75.6 100.32002 60.87 41.0 42.6 69.1 71.9 104.12005 79.14 26.1 28.4 53.8 58.6 108.8
Source: World Bank PovcalNet.
SECURING THE PRESENT, SHAPING THE FUTURE
APPENDIX TABLES 111

Appendix Table 6. East Asia: Exchange Rateslocal currency per U.S. dollar, end-of-period
China Indonesia Malaysia Philippines Thailand Vietnam Hong Kong SAR, China Korea, Rep. Singapore Taiwan,
China Japan
Jan-2008 7.19 9,291 3.24 40.65 33.03 15,971 7.80 943.9 1.42 32.20 106.36Feb-2008 7.11 9,051 3.19 40.36 31.87 15,931 7.78 937.3 1.39 30.95 104.73Mar-2008 7.02 9,217 3.19 41.87 31.51 16,105 7.79 991.7 1.38 30.41 100.10Apr-2008 7.00 9,234 3.16 42.19 31.74 16,116 7.80 999.7 1.36 30.45 104.08May-2008 6.95 9,318 3.24 43.88 32.46 16,246 7.81 1,031.4 1.37 30.41 105.66Jun-2008 6.86 9,225 3.27 44.76 33.52 16,842 7.80 1,043.4 1.36 30.35 106.40Jul-2008 6.86 9,118 3.26 44.14 33.54 16,755 7.80 1,008.5 1.37 30.59 107.99Aug-2008 6.85 9,157 3.39 45.69 34.17 16,525 7.81 1,081.8 1.42 31.52 109.10Sep-2008 6.85 9,378 3.46 46.92 34.02 16,575 7.77 1,187.7 1.43 32.13 104.30Oct-2008 6.86 10,995 3.56 48.75 34.99 16,813 7.75 1,291.4 1.48 33.00 98.30Nov-2008 6.87 12,151 3.62 48.88 35.47 16,974 7.75 1,482.7 1.51 33.30 95.25Dec-2008 6.86 10,950 3.46 47.49 34.93 17,433 7.75 1,257.5 1.44 32.86 90.75Jan-2009 6.86 11,355 3.61 47.08 34.93 17,475 7.76 1,368.5 1.51 33.80 89.60Feb-2009 6.84 11,980 3.69 48.24 36.05 17,475 7.76 1,516.4 1.54 34.95 97.55Mar-2009 6.84 11,575 3.65 48.42 35.52 17,756 7.75 1,377.1 1.52 33.92 98.10Apr-2009 6.85 10,713 3.56 48.70 35.30 17,784 7.75 1,348.0 1.48 33.23 97.60May-2009 6.82 10,340 3.51 47.55 34.38 17,784 7.75 1,272.9 1.45 32.65 96.50Jun-2009 6.81 10,225 3.52 48.31 34.02 17,801 7.75 1,284.7 1.45 32.82 95.95Jul-2009 6.82 9,920 3.52 48.12 34.04 17,815 7.75 1,240.5 1.44 32.82 95.33Aug-2009 6.82 10,060 3.52 48.91 34.01 17,823 7.75 1,244.9 1.44 32.92 92.70Sep-2009 6.83 9,681 3.47 47.59 33.55 17,841 7.75 1,188.7 1.41 32.20 89.77Oct-2009 6.82 9,545 3.41 47.73 33.43 17,862 7.75 1,200.6 1.40 32.54 91.38Nov-2009 6.83 9,480 3.39 46.75 33.21 18,485 7.75 1,167.4 1.38 32.19 86.75Dec-2009 6.83 9,400 3.42 46.36 33.36 18,472 7.76 1,167.6 1.40 32.03 92.06Jan-2010 6.82 9,365 3.41 46.74 33.15 18,472 7.77 1,156.5 1.40 31.99 89.85Feb-2010 6.84 9,335 3.41 46.26 33.09 18,925 7.76 1,158.4 1.41 32.09 89.25Mar-2010 6.83 9,115 3.27 45.22 32.37 19,080 7.77 1,130.8 1.40 31.82 93.25Apr-2010 6.83 9,012 3.19 44.64 32.32 18,960 7.77 1,115.5 1.37 31.42 94.06May-2010 6.83 9,180 3.25 46.21 32.53 18,980 7.79 1,200.2 1.40 32.23 91.30Jun-2010 6.84 9,083 3.26 46.42 32.44 19,065 7.79 1,210.3 1.40 32.28 88.60Jul-2010 6.85 8,952 3.19 45.81 32.28 19,095 7.77 1,187.2 1.36 32.05 86.50Aug-2010 6.86 9,041 3.14 45.18 31.30 19,485 7.78 1,189.1 1.36 32.10 84.25Sep-2010 6.85 8,924 3.09 43.90 30.40 19,485 7.76 1,142.0 1.32 31.33 83.40Oct-2010 6.86 8,928 3.11 43.18 29.98 19,495 7.76 1,126.6 1.30 30.78 80.58Nov-2010 6.86 9,013 3.16 44.26 30.21 19,498 7.77 1,157.3 1.32 30.85 84.15Dec-2010 6.86 8,991 3.08 43.89 30.15 19,498 7.78 1,138.9 1.29 30.37 81.18Jan-2011 6.87 9,057 3.06 44.09 31.15 19,498 7.80 1,114.3 1.29 29.30 81.73
Sources: Haver Analytics, Datastream.
WORLD BANK EAST ASIA AND PACIFIC ECONOMIC UPDATE 2011, VOL. 1
112 APPENDIX TABLES

Appendix Table 7. East Asia: Foreign Exchange Reserves Excluding Goldin billions of U.S. dollars
China Indonesia Malaysia Philippines Thailand Hong Kong SAR, China Korea, Rep. Singapore Taiwan,
China Total
Des-1997 107.0 19.3 27.0 10.1 37.8 63.8 33.2 76.8 88.0 463.1Des-1998 142.8 17.4 20.8 7.3 26.3 92.8 20.4 71.3 83.5 482.5Des-1999 149.2 23.5 25.6 9.3 28.8 89.7 52.0 75.1 90.3 543.4Des-2000 157.7 27.3 30.6 13.3 34.1 96.2 74.0 77.0 106.2 616.4Des-2001 168.3 29.4 29.5 13.1 32.0 107.5 96.1 80.2 106.7 662.9Des-2002 215.6 28.0 30.5 13.5 32.4 111.2 102.8 75.7 122.2 731.7Des-2003 291.1 32.0 34.2 13.3 38.1 111.9 121.3 82.2 161.7 885.9Des-2004 408.2 36.3 44.6 13.7 41.1 118.4 155.3 96.2 206.6 1,120.3Des-2005 614.5 36.3 66.4 13.1 48.7 123.5 199.0 112.6 241.7 1,455.9Des-2006 821.5 34.7 70.2 15.9 50.7 124.2 210.3 116.2 253.3 1,697.1Des-2007 1,068.5 42.6 82.2 20.0 65.3 133.2 238.9 136.3 266.1 2,053.0Des-2008 1,949.3 51.6 91.2 33.2 108.7 182.5 201.1 174.2 291.7 3,083.4Jan-2009 1,916.6 50.9 91.0 34.7 108.2 181.7 201.7 167.1 292.7 3,044.4Feb-2009 1,915.1 50.6 90.7 34.2 110.7 177.0 201.5 163.5 294.2 3,037.6Mar-2009 1,956.8 54.8 87.4 34.5 113.7 186.2 206.3 166.3 300.1 3,106.2Apr-2009 2,012.0 56.6 87.8 34.9 114.4 193.4 212.4 170.1 304.7 3,186.2May-2009 2,093.1 57.9 87.9 34.7 118.9 205.1 226.7 171.8 312.6 3,308.6Jun-2009 2,135.2 57.6 91.3 34.8 118.3 206.9 231.7 173.2 317.6 3,366.5Jul-2009 2,178.2 57.4 90.8 35.3 120.9 218.0 237.4 174.1 321.1 3,433.3Aug-2009 2,223.9 57.9 93.3 36.7 124.8 223.2 245.4 176.3 325.4 3,506.8Sep-2009 2,288.5 62.3 94.8 37.5 129.1 226.8 254.2 182.0 332.2 3,607.4Oct-2009 2,344.3 64.5 94.9 37.9 132.5 240.0 264.1 184.3 341.2 3,703.7Nov-2009 2,405.3 65.8 95.0 38.5 136.7 256.2 270.8 188.9 347.2 3,804.4Dec-2009 2,399.2 66.1 96.4 38.8 135.5 255.8 269.9 187.8 348.2 3,797.6Jan-2010 2,415.2 69.6 95.7 40.2 139.5 257.0 273.6 189.6 350.7 3,831.1Feb-2010 2,424.6 69.7 95.6 40.2 138.8 258.2 270.6 187.6 352.7 3,838.0Mar-2010 2,447.1 71.8 94.0 39.6 141.1 258.8 272.3 196.9 355.0 3,876.6Apr-2010 2,490.5 78.6 94.7 40.6 144.4 259.2 278.8 203.2 357.6 3,947.5May-2010 2,439.5 74.6 96.2 41.0 140.2 256.1 270.1 198.1 360.1 3,876.1Jun-2010 2,454.3 76.3 93.3 41.8 143.4 256.7 274.1 199.7 362.4 3,902.1Jul-2010 2,538.9 78.8 93.6 42.4 147.7 260.6 285.9 206.7 370.1 4,024.7Aug-2010 2,547.8 81.3 93.8 42.8 151.2 261.3 285.3 206.2 372.1 4,041.8Sep-2010 2,648.3 86.6 107.5 46.4 159.0 266.0 289.7 214.5 380.5 4,198.3Oct-2010 2,760.9 91.8 114.1 50.3 166.7 267.0 293.3 221.2 383.8 4,349.1Nov-2010 2,767.8 92.8 104.3 53.7 163.5 266.1 290.2 217.4 379.3 4,334.8Dec-2010 2,847.3 96.2 104.9 55.4 167.5 268.7 291.5 225.5 382.0 4,439.1Jan-2011 .. 95.3 106.5 57.0 169.7 273.2 295.9 226.9 387.1 ..
Sources: Haver Analytics, Thomson Datastream, and IMF International Financial Statistics.
SECURING THE PRESENT, SHAPING THE FUTURE
APPENDIX TABLES 113

Appendix Table 8a. East Asia: Balance of Paymentsin percent of GDP
Overall Balance Current Account Capital Account 1/
2005 2006 2007 2008 2009 2005 2006 2007 2008 2009 2005 2006 2007 2008 2009
East Asia and Pacific 7.1 7.1 8.8 6.9 8.4 5.8 7.5 8.9 7.6 6.4 1.3 -0.4 -0.1 -0.7 2.0China 11.1 10.5 13.1 10.6 8.0 7.1 9.3 10.6 9.6 6.0 4.0 1.2 2.5 1.0 2.0S.E. Asia 1.7 4.5 5.0 1.4 4.0 2.2 5.3 6.1 3.8 6.2 -0.5 -0.8 -1.1 -2.4 -2.2
Indonesia 0.2 4.0 2.9 -0.4 2.3 0.1 3.0 2.4 0.1 1.9 0.1 1.0 0.5 -0.5 0.4Malaysia 2.6 4.4 7.0 -2.5 2.0 14.6 16.3 15.7 17.5 16.7 -12.0 -11.9 -8.7 -20.0 -14.7Philippines 2.4 3.2 5.9 0.1 4.0 2.0 4.5 4.9 2.2 5.5 0.4 -1.3 1.0 -2.1 -1.5Thailand 3.1 6.1 6.4 8.8 9.1 -4.3 1.1 6.3 0.8 8.3 7.5 5.0 0.1 8.0 0.8
NIEs 3.5 3.1 2.5 1.0 12.7 5.5 6.0 7.2 5.0 8.0 -1.9 -2.9 -4.7 -4.1 4.7Hong Kong SAR, China 0.8 3.2 7.1 15.7 33.9 11.4 12.1 12.3 13.7 8.6 -10.6 -8.9 -5.2 2.0 25.3Korea, Rep. 2.3 2.3 1.4 -6.0 8.2 2.2 1.4 2.0 0.5 3.9 0.1 0.9 -0.6 -6.5 4.3Singapore 9.8 11.7 10.9 6.9 6.2 21.1 24.8 27.3 14.7 19.1 -11.3 -13.2 -16.3 -7.8 -13.0Taiwan, China 5.5 1.6 -1.0 6.6 14.3 4.8 6.9 8.9 6.9 11.4 0.7 -5.3 -9.9 -0.3 2.9
Median 2.6 4.0 6.4 6.6 8.0 4.8 6.9 8.9 6.9 8.3 0.1 -1.3 -0.6 -0.5 0.8
Sources: Haver Analytics, national sources.
1/ Capital Account + Financial Account + Errors and Omissions.
Appendix Table 8b. East Asia: Capital Account Componentsin percent of GDP
Net FDI Net Portfolio Net Other Capital 2/
2005 2006 2007 2008 2009 2005 2006 2007 2008 2009 2005 2006 2007 2008 2009
East Asia and Pacific 2.0 1.4 1.7 1.2 0.0 -0.7 -2.4 -0.9 -0.8 0.3 -0.7 0.1 -1.3 -1.6 2.0China 3.0 2.0 3.5 2.1 0.7 -0.2 -2.4 0.5 0.9 0.8 -0.2 0.5 -2.0 -2.7 1.3S.E. Asia 2.2 1.6 0.7 0.1 -0.1 1.4 1.8 0.9 -2.5 0.5 -3.6 -3.5 -2.2 0.0 -2.4
Indonesia 1.8 0.6 0.5 0.7 0.5 1.5 1.2 1.3 0.3 1.9 -3.3 -1.0 -1.1 -1.4 -1.5Malaysia 0.7 0.0 -1.5 -3.5 -3.4 -2.7 2.2 2.9 -11.4 0.1 -5.1 -9.8 -7.5 -1.1 -8.5Philippines 1.7 2.4 -0.4 0.8 1.0 3.5 2.6 3.2 -2.3 0.9 -3.0 -5.1 -0.3 0.4 -3.2Thailand 4.3 4.1 3.2 1.6 0.3 3.1 2.1 -2.5 -0.7 -2.2 -3.3 -2.3 -1.3 3.5 0.8
NIEs 0.4 0.2 -1.3 -0.2 -2.0 -2.4 -4.4 -4.6 -4.0 -1.2 -0.2 1.4 0.6 0.2 7.4Hong Kong SAR, China 3.6 0.0 -3.3 4.2 -5.5 -17.7 -14.1 -1.3 -17.6 -20.5 2.0 3.2 -5.0 14.4 48.1Korea, Rep. 0.0 -0.8 -1.7 -1.8 -1.8 -0.4 -2.4 -2.5 -0.3 5.9 0.7 4.4 3.6 -4.0 -0.1Singapore 3.4 7.2 2.4 4.7 -1.7 0.7 -2.7 -8.8 -9.4 -8.4 -17.3 -16.3 -11.6 -2.4 -4.3Taiwan, China -1.2 0.0 -0.8 -1.2 -0.8 -0.8 -5.0 -10.2 -3.1 -2.7 2.6 -0.2 1.1 3.9 7.1
Median 1.8 0.6 -0.4 0.8 -0.8 -0.2 -2.4 -1.3 -2.3 0.1 -3.0 -1.0 -1.3 -1.1 -0.1
Sources: Haver Analytics, national sources.
3/ Net Other Investment + Net Financial Derivatives
WORLD BANK EAST ASIA AND PACIFIC ECONOMIC UPDATE 2011, VOL. 1
114 APPENDIX TABLES

Appendix Table 9. East Asia: Nonperforming Loansin percent of total loans
1997 1998 1999 2000 2001 2002 2003 2004 2005 2006 2007 2008 2009 2010
Dec Dec Dec Dec Dec Dec Dec Dec Dec Dec Dec Dec Dec Mar Jun Sep Dec
China 1/ .. .. .. .. .. 23.6 17.9 13.2 8.6 7.1 6.2 2.4 1.6 1.4 1.3 1.2 1.1Indonesia 2/ 7.2 48.6 32.9 18.8 12.1 7.5 6.8 4.5 7.6 6.1 4.1 3.2 3.3 3.4 3.0 3.0 2.6Malaysia 3/ .. 10.6 11.0 9.7 11.5 10.2 9.0 7.5 5.8 4.8 3.2 2.2 1.8 1.9 2.1 2.1 2.0Philippines 4/ .. 11.0 12.7 14.9 16.9 14.6 13.8 12.5 8.6 6.1 4.9 4.1 3.7 3.9 3.9 .. ..Thailand 5/ .. 45.0 38.9 17.7 10.4 15.7 12.7 10.7 8.2 7.5 7.3 5.3 4.9 4.6 4.5 4.2 3.6Korea, Rep. 6/ 6.0 7.3 13.6 8.8 3.3 2.4 2.2 2.0 1.3 0.9 0.7 1.1 1.2 1.5 1.9 2.3 1.9
Source: National data sources.
1/ Covers only the major commercial banks for 2002-04, and all commercial banks for 2005-10.
2/ Excludes IBRA’s AMC. Data for 1997 to 2002 excludes state banks; the data source is the Monetary Division of Bank Indonesia. Data from 2003 covers all commercial banks including state banks; the data source is the Banking Supervision Division of Bank Indonesia3/ Excludes Danaharta. This series, used by Bank Negara Malaysia, is net of provisions and excludes interest in suspense.
4/ Includes interbank loans.
5/ Excludes transfers to AMCs. The jump in headline NPLs in December 2002 was a one-off increase, reflecting a change in definition and did not affect provisioning.
6/ Excludes KAMCO/KDIC.
SECURING THE PRESENT, SHAPING THE FUTURE
APPENDIX TABLES 115

Appendix Table 10. East Asia: Financial Market Indicators
Stock Market Index, end-of-period, Dec. 31, 2007 = 100
Jun-07 Dec-07 Jun-08 Dec-08 Jun-09 Dec-09 Mar-10 Jun-10 Sep-10 Dec-10 Jan-11
China 72.6 100.0 52.0 34.6 56.3 62.3 60.0 45.5 50.4 53.3 52.9Indonesia 77.9 100.0 85.6 49.4 73.8 92.3 105.1 106.1 127.5 134.9 124.2Malaysia 93.7 100.0 82.1 60.7 74.4 88.1 92.4 90.9 101.3 105.1 105.2Philippines 101.1 100.0 67.9 51.7 67.3 84.3 91.1 93.1 113.2 116.0 107.2Thailand 90.5 100.0 89.6 52.4 69.6 85.6 88.7 92.9 113.7 120.4 112.4Vietnam 110.5 100.0 43.1 34.0 48.4 53.4 55.9 54.7 49.0 52.3 55.1Hong Kong SAR, China 78.3 100.0 79.5 51.7 66.1 78.6 79.5 72.4 80.4 82.8 84.3Korea, Rep. 91.9 100.0 88.3 59.3 73.3 88.7 90.2 89.5 98.7 108.1 109.1Singapore 100.3 100.0 85.1 50.8 67.3 83.6 85.7 81.8 89.4 92.0 91.8Taiwan, China 104.4 100.0 88.4 54.0 75.6 96.3 94.4 86.2 96.8 105.5 107.5Source: Thomson Datastream.
Yields, 10-year local-currency government bonds, end-of-period, in percent
Jun-07 Dec-07 Jun-08 Dec-08 Jun-09 Dec-09 Mar-10 Jun-10 Sep-10 Dec-10 Jan-11
China 4.4 4.5 4.5 2.8 3.2 3.6 3.4 3.3 3.3 3.9 4.0Indonesia 9.0 10.0 13.4 11.9 11.1 10.1 9.1 8.4 7.6 7.6 8.9Malaysia 5.0 4.1 4.9 3.2 4.4 4.3 4.2 4.0 3.6 4.0 4.1Philippines 7.4 6.6 9.4 7.4 8.1 8.1 8.1 7.9 6.2 6.1 7.2Thailand 4.5 5.0 5.9 2.7 3.7 4.2 4.0 3.1 3.1 3.7 3.8Vietnam 7.8 9.1 16.0 10.2 9.7 11.5 12.3 11.5 11.2 11.8 11.9Hong Kong SAR, China 4.8 3.4 3.5 1.9 2.6 2.6 2.6 2.3 2.0 2.9 2.8Korea, Rep. 5.5 5.7 6.0 4.2 5.2 5.4 4.7 5.0 4.1 4.5 4.7Singapore 2.9 2.7 3.6 2.1 2.6 2.7 2.7 2.4 2.0 2.7 2.6Taiwan, China 2.5 2.6 2.7 1.4 1.6 1.5 1.4 1.4 1.2 1.6 1.4Source: Bloomberg.
Foreign-Currency Government Bond Spreads (EMBIG), end-of-period, in basis points over U.S. Treasuries
Jun-07 Dec-07 Jun-08 Dec-08 Jun-09 Dec-09 Mar-10 Jun-10 Sep-10 Dec-10 Jan-11
China 54 120 137 228 122 104 87 86 81 126 133Indonesia 165 275 381 762 433 230 212 274 192 183 208Malaysia 75 119 153 119 167 136 138 171 137 117 108Philippines 155 172 303 546 324 206 219 266 184 163 166Vietnam 122 203 368 747 379 314 293 338 305 323 412Source: JP Morgan, Bloomberg.
Credit Default Swap (CDS) Spreads on Foreign-Currency Government Bonds, 5-year, end-of-period, in basis points
Jun-07 Dec-07 Jun-08 Dec-08 Jun-09 Des-09 Mar-10 Jun-10 Sep-10 Dec-10 Jan-11
China 13 29 75 188 75 73 63 91 67 68 78Indonesia 110 154 286 638 317 188 156 186 140 133 164Malaysia 16 44 116 225 105 90 70 102 80 74 83Philippines 111 153 266 384 217 168 156 174 139 130 143Thailand 39 55 135 256 110 96 104 134 102 99 117Hong Kong SAR, China 5 18 42 104 68 48 39 57 48 46 47Korea, Rep. 17 47 107 319 182 85 75 131 101 98 105Source: Thomson Datastream.
WORLD BANK EAST ASIA AND PACIFIC ECONOMIC UPDATE 2011, VOL. 1
116 APPENDIX TABLES

Appendix Table 11. Measures to Help Manage Capital Inflows
Country Measures
China Allowed banks and companies that settle trade transactions in RMB to also settle foreign direct investment transactions in RMB. •
Allowed Chinese groups to remit profits and gains from overseas direct investment back to China in RMB.•
Allowed banks to make RMB loans to overseas companies and projects with Chinese investors.•
Bank of China announced the first renminbi-denominated share sale on the Hong Kong stock exchange; private sector IPOs in •renminbi expected later in 2011.
Indonesia Announced a minimum 1 month holding period for Bank Indonesia Certificates (SBIs), effective in July.•
Announced moves to issue 9-month and 12-month SBIs. Sales of one-month notes suspended (with three-month note issuance •subsequently suspended in November and six-month issuance suspended in February 2011). Announced that the banking sector’s U.S. dollar reserve requirement would be increased from 1 percent to 5 percent in March 2011 •and to 8 percent in June 2010.Reintroduced a cap on lenders’ short-term foreign borrowings at a maximum of 30 percent of the banks’ capital.•
Korea Tightened the foreign currency liquidity ratios at domestic banks.•
Required liquidity risk management mechanisms at the local branches of foreign banks.•
Limited foreign banks’ foreign currency derivatives contracts to 250 percent of the previous month’s equity capital.•
Capped forward currency transactions for corporations at 100 percent of the revenues to be hedged.•
Limited banks’ lending to domestic non-financial companies in foreign currency to those that need foreign exchange to pay for •overseas transactions.Introduced a Macro-prudential Stability Levy to be imposed on non-deposit foreign currency liabilities of financial institutions. Levy •rate to be determined through consultations and expected to take effect from the second half of 2011.
Philippines Debuted global peso-denominated government debt •
Central Bank encouraged Aquino administration to prepay foreign debts to take advantage of the strong peso and moderate foreign •exchange appreciation.Increased ceilings for residents’ foreign exchange purchases and outward investments.•
Increased the limit on over-the-counter foreign exchange purchases without documentation for non-trade current account •purchases from $30,000 to $60,000 for authorized agent banks (AABs) and AAB foreign exchange corporations (AAB-forex corps.).Increased the limits non-resident, departing tourists could convert at ports of exit from $200 to $5000 without proof of sale of •foreign exchange for pesos Increased the ceiling on foreign exchange purchases by residents to cover import transactions from $100,000 to $1 million.•
Allowed prepayment of BSP-registered foreign and foreign-currency loans of the private sector to be funded with foreign exchange •from AABs and AAB-forex corps. without prior BSP approval.Allowed registering banks to perform foreign exchange conversions and outward remittances of peso funds not in excess of original •foreign exchange inflow less any amount used for actual investments in country.Increased the limit that residents may purchase from authorized agent banks for outward investments and/or investments in ROPs •and other Philippine debt papers issued offshore, including peso-denominated instruments to be settled in foreign exchange, from $30 million to $60 million per investor per year.Lifted the registration requirement for outward investments in excess of the $60 million limit and replaced this with reporting to •BSP. Prior approval is still required.Extended the periods for inward remittance and conversion to pesos or reinvestment of proceeds and related earnings on outward •investments of residents from 2 and 7 banking days to 30 banking days from receipt of funds abroad.
Taiwan, China Barred foreign investors from leaving funds in dollar time deposits beyond an initial three-month period.•
Raised reserve requirement ratios on new currency deposits from foreign investors to 90 percent from 10 percent; raised •requirements on existing deposits to 25 percent from 10 percent.Stopped paying interest on reserves held in certain types of deposit accounts owned by foreign investors.•
Central bank capped trading in non-deliverable forwards at 20 percent of a bank’s total foreign exchange trading.•
Set a one week deadline for substantial overseas deposits to be used for their stated purpose or be repatriated.•
Financial Supervisory Commission banned foreign investors from investing more than 30 percent of their funds in local government •bonds.Domestic banks prohibited from engaging in overseas NDF (non-delivery forward) business, keeping short position for U.S. dollars •overnight, and placing orders for the last trading match.
Thailand Increased the limit on outbound portfolio investment from $30 billion to $50 billion.•
Importers and exporters not required to request permission to unwind foreign exchange hedging transactions.•
Allowed Thai companies to lend up to $50 million to unaffiliated corporations abroad without permission .•
Lifted non-residents’ exemptions from the 15 percent withholding tax on local bond purchases.•
Allowed Thai companies to transfer export proceeds from foreign currency deposit accounts to counterparties in Thailand for •payment of goods and services.Raised the limit on foreign property investments from $5 million to $10 million per year.•
Raised the amount of foreign currency local residents and companies can hold in their own bank accounts to $500,000•
Increased the minimum requirement on repatriation of export earnings from $20,000 to $50,000•
SECURING THE PRESENT, SHAPING THE FUTURE
APPENDIX TABLES 117

aPPendix charts
Appendix Chart 1. East Asia: Foreign Exchange Reserves and Exchange Ratesin billions of U.S. dollars and in local currency unit per U.S. dollar
Sources: Haver Analytics and IMF
6.456.506.556.606.656.706.756.806.856.90
-100
-50
0
50
100
150
Jan-09 aug-09 Mar-10 oct-10
China
change in reserves exchange rate (rhS)
6,000
7,000
8,000
9,000
10,000
11,000
12,000
13,000
-6
-4
-2
0
2
4
6
8
Jan-09 aug-09 Mar-10 oct-10
Indones ia
change in reserves exchange rate (rhS)
2.60
2.80
3.00
3.20
3.40
3.60
3.80
-15
-10
-5
0
5
10
15
Jan-09 aug-09 Mar-10 oct-10
Malays ia
change in reserves exchange rate (rhS)
40414243444546474849
-1
0
1
2
3
4
5
Jan-09 aug-09 Mar-10 oct-10
Philippines
change in reserves exchange rate (rhS)
26
28
30
32
34
36
38
-6-4-202468
10
Jan-09 aug-09 Mar-10 oct-10
Thailand
change in reserves exchange rate (rhS)
3,8503,9003,9504,0004,0504,1004,1504,2004,2504,300
-0.020.000.020.040.060.080.100.120.140.16
Jan-09 aug-09 Mar-10 oct-10
Cambodia
change in reserves exchange rate (rhS)
7,7007,8007,9008,0008,1008,2008,3008,4008,5008,6008,700
-0.10
-0.05
0.00
0.05
0.10
0.15
Jan-09 aug-09 Mar-10 oct-10
Lao
change in reserves exchange rate (rhS)
8009001,0001,1001,2001,3001,4001,5001,6001,700
-0.10-0.050.000.050.100.150.200.250.300.350.40
Jan-09 aug-09 Mar-10 oct-10
Mongolia
change in reserves exchange rate (rhS)
16,00016,50017,00017,50018,00018,50019,00019,50020,000
-2.5
-2.0
-1.5
-1.0
-0.5
0.0
0.5
1.0
Jan-09 aug-09 Mar-10 oct-10
Vietnam
change in reserves exchange rate (rhS)
WORLD BANK EAST ASIA AND PACIFIC ECONOMIC UPDATE 2011, VOL. 1
118

Appendix Chart 2. East Asia: Real and Nominal Exchange Ratesindices, 2005 = 100, and in local currency unit per U.S. dollar
Sources: BIS, IMF and Haver AnalyticsNote: REER = real effective exchange rate; NEER = nominal effective exchange rate; LCU = local currency units.
6.206.406.606.807.007.207.40
90
100
110
120
130
Jan-08 Dec-08 nov-09 oct-10
China
reer neer
Lcu/uSD
8,8009,3009,80010,30010,80011,30011,80012,300
60708090
100110120130
Jan-08 Dec-08 nov-09 oct-10
Indones ia
reer neer
Lcu/uSD
2.8
3.0
3.2
3.4
3.6
3.8
90
95
100
105
110
115
Jan-08 Dec-08 nov-09 oct-10
Malays ia
reer neer
Lcu/uSD
40
42
44
46
48
50
90
100
110
120
130
140
Jan-08 Dec-08 nov-09 oct-10
Philippines
reer neer
Lcu/uSD
26283032343638
9095
100105110115120125
Jan-08 Dec-08 nov-09 oct-10
Thailand
reer neer
Lcu/uSD
0
5
10
15
20
25
50
70
90
110
130
150
Jan-08 Dec-08 nov-09 oct-10
Vietnam
reerneerLcu thousands/uSD (rhS)
SECURING THE PRESENT, SHAPING THE FUTURE
APPENDIX CHARTS 119

Acs, Zoltan J., David B. Audretsch, and Maryann P. Feldman. 1994. “R&D Spillovers and Recipient Firm Size,” The Review of Economics and Statistics 76(2): 336-40.
Almeida, Rita K. 2009b. “Does the Workforce in East Asia Have the Right Skills? Evidence from Firm Level Surveys.” HDNSP, The World Bank, Mimeo.
Audretsch, David B and Maryann P. Feldman. 2004. “Knowledge Spillovers and the Geography of Innovation.” In Handbook of Regional and Urban Economics, vol. 4, V. Henderson and J. F. Thisse, eds. Amsterdam: Elsevier.
Baulch Bob, Nguyen Thi Minh Hoa, Nguyen Thi Thu Phuong, Pham Thai Hung. 2009. Ethnic Minority Poverty in Vietnam. (Hanoi).
Berrah, N., F. Feng, R. Priddle, and L. Wang. 2007. Sustainable Energy in China: The Closing Window of Opportunity Washington, DC: World Bank.
Birdsall, Nancy; Allen C. Kelley and Steven W. Sinding, eds. 2001. Population Matters: Demographic Change, Economic Growth, and Poverty in the Developing World. Oxford: Oxford University Press.
Bloom, D. E., and J. G. Williamson. 1998. “Demographic transitions and economic miracles in emerging Asia.” World Bank Economic Review 12 (3):419-55.
Bloom, David. E. and David Canning. 2008. “Global Demographic Change: Dimension and Economic Significance.” In Population and Development Review, supplement to vol. 34: pp.17-51.
Bloomberg Businessweek. 2005. “Too Lean A Machine.” http://www.businessweek.com/magazine/content/05_40/b3953146.htm. October 3, 2005
Brahmbhatt, Milan and Albert Hu. 2009. “Ideas and Innovation in East Asia.” World Bank Research Observer 25 (2): 177-207.
Cattaneo, Olivier, Gary Gereffi and Cornelia Staritz. 2010. “Global Value Chains in a Post-Crisis World: Resilience, Consolidation and Shifting End Markets.” In Global Value Chains in a Post-Crisis World: A Development Perspective. O. Cattaneo, G. Gereffi and C. Staritz, eds. Washington, DC: The World Bank.
Cohen, D. 2002. “Fear of Globalization: the Human Capital Nexus.” Paper presented at the Annual World Bank Conference on Development Economics 2001/2002.
da Mata, D., U. Deichmannb, J.V. Hendersonc, .S. V.Lall, and H.G. Wang. 2007. “Determinants of City Growth in Brazil.” Journal of Urban Economics 62 (2): 252-272. September 2007.
EM-DAT: The Centre for Research on the Epidemiology of Disasters (CRED) International Disaster Database.
Energy Sector Management Assistance Program. 2006. Proceedings of the International Grid-Connected Renewable Energy Policy Forum. Washington, DC: The World Bank.
Fan S., R. Kanbur and X. Zhang. 2010, “China’s Regional Disparities: Experience and Policy,” Department of Applied Economics and Management. Ithaca, NY: Cornell University.
Ferreira, Francisco H. G.; Phillippe G. Leite and Julie A. Litchfield. 2008. “The Rise And Fall Of Brazilian Inequality: 1981–2004.” In Macroeconomic Dynamics 12 (2): 199-230.
Gill, Indermitt and Homi Kharas. 2007. East Asia Renaissance. Washington, DC: The World Bank.
Global Facility For Disaster Reduction and Recovery. 2010. “Natural Hazards, Unnatural Disasters: The Economics of Effective Prevention.” http://www.gfdrr.org/gfdrr/sites/gfdrr.org/files/nhud/files/NHUD-Report_Full.pdf.
Gropello, E and C. Sakellariou, “Industry and Skill Wage Premiums in East Asia.” Policy Research Working Paper 5379. Washington D.C.: The World Bank.
He, Jianwu and Louis Kuijs. 2007. “Rebalancing China’s Economy—Modeling a Policy Package” World Bank China Research Paper No. 7.
Hinz, Richard and Asta Zviniene. 2010. “Population aging and expenditures on pensions and health care in APEC economies: An exploratory simulation using World Bank projection models.” Background paper for the 2010 APEC Financial Officers Meeting. Washington DC: East Asia Pacific Human Development Network, The World Bank. September 2010.
referenceS
WORLD BANK EAST ASIA AND PACIFIC ECONOMIC UPDATE 2011, VOL. 1
120

Intergovernmental Panel on Climate Change (IPCC). 2007. Climate Change 2007: Mitigation. Contribution of Working Group III to the Fourth Assessment Report of the Intergovernmental Panel on Climate Change. Cambridge and New York: IPCC.
International Energy Agency (IEA). 2008. World Energy Outlook. Paris: IEA.
———. 2010. World Energy Outlook 2010. Paris: IEA.
Ito, Takatoshi and Andrew K. Rose, eds. 2010. The Economic consequences of demographic change in East Asia. Chicago: Chicago University Press.
Katz, Bruce. 2011. Export Nation: How U.S. Metros Lead National Export Growth. Washington DC: Brookings Institution.
Kelley, A. C., and R. M. Schmidt. 2005. Evolution of Recent Economic-demographic Modeling: A Synthesis. Journal of Population Economics 18: 275-300.
The Keystone Center. 2007. Nuclear Power Joint Fact-Finding. Keystone, Colorado: The Keystone Center.
Kim, Chul Ju. 2011. “Demographic Change and Household Savings in Japan and Korea: Implications for China,” Eye on East Asia and Pacific No. 4. www.worldbank.org/eapeye. February 2011.
Kuijs, Louis and Tao Wang. 2006. “China’s Pattern of Growth, Moving to Sustainability and Reducing Inequality.” China and the World Economy, January 2006.
Kuijs, Louis. 2010. “China through 2020—a Macroeconomic Scenario.” World Bank China Research Working Paper No. 9.
Lall, Sanjaya. 2000. “The Technological Structure and Performance of Developing Country Manufactured Exports, 1985-98,” Oxford Development Studies 28 (3): 337-369.
Lall, Somik and Hyoung Gun Wang. 2011. “China Urbanization Review: Balancing Urban Transformation and Spatial Inclusion.” An Eye on East Asia No. 6. Washington DC: The World Bank, East Asia Pacific region.
Lall, Somik V. and Uwe Deichmann. 2009. “Density and disasters: economics of urban hazard risk,” Policy Research Working Paper Series 5161. Washington, DC: The World Bank.
Lerner, J. 2009. Boulevard of Broken Dreams: Why Public Efforts to Boost Entrepreneurship and Venture Capital have Failed -- and What to do about it. Princeton, NJ: Princeton University Press.
Little, R. G. 2009. “Managing the Risk of Cascading Failure in Complex Urban Infrastructures” in Disrupted Cities: When Infrastructure Fails, Stephen Graham, ed. London: Routledge.
Maddison, Angus. 2009. Statistics on World Population, GDP and Per Capita GDP, 1-2008 AD. Groningen Growth & Development Centre. http://www.ggdc.net/MADDISON/oriindex.htm.
Massachusetts Institute of Technology (MIT). 2003. The Future of Nuclear Power: An Interdisciplinary MIT Study. Cambridge, MA: MIT.
McKinsey Global Institute. 2009. Promoting Energy Efficiency in the Developing World. Washington, DC: McKinsey & Company.
Mohapatra, Sanket, George Joseph and Dilip Ratha. 2009. “Remittances and Natural Disasters: Ex-post Response and Contribution to Ex-ante Preparedness.” World Bank Policy Research Working Paper 4972. Washington, DC: The World Bank.
Prasad, N., F. Ranghieri, F. Shah, Z. Trohanis, E. Kessler, and R. Sinha. 2009. Climate Resilient Cities: A Primer on Reducing Vulnerabilities to Disasters. Washington, DC: The World Bank.
QS Top Universities. 2009. http://www.topuniversities.com/university-rankings/world-university-rankings/2009/results.
Ravallion, M. 2010. “A Comparative Perspective on Poverty Reduction in Brazil, China, and India” The World Bank Research Observer, Advance Access. March 8, 2010.
Ravallion, Martin & Chen, Shaohua, 2007. “China’s (Uneven) Progress against Poverty.” Journal of Development Economics, vol. 82(1): 1-42.
SECURING THE PRESENT, SHAPING THE FUTURE
REFERENCES 121

Resilience Alliance. 2007. “A Resilience Alliance Initiative for Transitioning Urban Systems towards Sustainable Futures.” http://www.resalliance.org/files/1172764197_urbanresilienceresearchprospectusv7feb07.pdf.
Rogoff, Kenneth. 2005. “Exchange Rate Regimes and International Capital Market Integration: What is the Evidence and Implications for China?” Presented at CCER, Peking University.
Stern, N. 2006. Stern Review on the Economics of Climate Change. Cambridge: Cambridge University Press.
Swiss Re. 2008, 2009, 2010. Natural catastrophes and man-made disasters.” Zurich: Swiss Reinsurance Company, Ltd.
United Nations International Strategy for Disaster Reduction. 2010. “Many Partners, One System: An Integrated Flood Early Warning System (FEWS) for Jakarta.” http://www.unisdr.org/preventionweb/files/13627_LocalGovernmentsandDisasterRiskRedu.pdf
United Nations Population Fund (UNFPA). 2007. State of the World Population 2007: Unleashing the Potential of Urban Growth. New York: UNFPA.
Vandenbussche, Jerome, Philippe Aghion, and Costas Meghir. 2006. “Growth, Distance to Frontier and Composition of Human Capital.” Journal of Economic Growth 11: 97-127.
Vincellette, Gallina; Alvaro Manoel; Ardo Hansson and Louis Kuijs. 2011. “China: Global Crisis Avoided, Robust Economic Growth Sustained.” In The Great Recession and Developing Countries: Economic Impact and Growth Prospects, Mustapha K. Nabli, ed. Washington, DC: The World Bank.
Wang X., Berrah N., Peng X., Sugar L., and Du H. 2011. Low-carbon Cities in China: Characteristics, Roadmap, and Indicators (forthcoming). Washington, DC: The World Bank.
The World Bank. 1994. Global Economic Prospects. Washington, DC: The World Bank.
The World Bank. 2005. World Development Report 2005: A Better Investment Climate for Everyone, Washington DC: The World Bank.
———. 2006. Renewable Energy Toolkit: A Resource for Renewable Energy Development. Washington, DC: The World Bank.
———. 2008. An Analytical Compendium of Institutional Frameworks for Energy Efficiency Implementation. Washington, DC: World Bank.
———. 2009a. Mid-Term Evaluation of China’s 11th 5-Year Plan. Washington, DC: The World Bank.
———. 2009b. World Development Report 2009: Reshaping Economic Geography. Washington, DC: The World Bank.
———. 2010a. Cities and Climate Change: An Urgent Agenda. Washington, DC: The World Bank.
———. 2010b. Changing the Industrial Geography in Asia. Washington, DC: The World Bank.
———. 2010c. East Asia and Pacific Update: Robust Recovery, Rising Risks. Washington DC: World Bank. October 2010.
———. 2010d. The Economics of Adaptation to Climate Change: Synthesis Report. Washington, DC: The World Bank.
———. 2010e. Innovation Policy. A guide for developing countries, conference edition. Washington, DC: The World Bank.
———. 2010f. “Poverty Assessment: Philippines Fostering More Inclusive Growth.” Washington, DC: The World Bank.
———. 2010g. Thailand Economic Monitor-November 2010. Bangkok: The World Bank.
———. 2010h. Winds of Change: East Asia’s Sustainable Energy Future. Washington, DC: The World Bank.
———. 2010i. World Development Report 2010: Development and Climate Change. Washington, DC: The World Bank.
———. 2011. Global Economic Prospects Washington, DC: The World Bank.
WORLD BANK EAST ASIA AND PACIFIC ECONOMIC UPDATE 2011, VOL. 1
122 REFERENCES

———. (Forthcoming). From Technological Mastery to Innovation. Background paper for The World Bank.
———. (Forthcoming). Higher Education Flagship in East Asia and Pacific, Washington, DC: TheWorld Bank.
Yusuf and Nabeshima. 2010a. Postindustrial Asian Cities. Washington, DC: The World Bank.
Yusuf, Shahid and Kaoru Nabeshima. 2010. Changing the Industrial Geography in Asia: The Impact of China and India. Washington, DC: The World Bank.
Zaidi, Salman. 2009. “Main Drivers of Income Inequality in Central European and Baltic Countries: Some Insights from Recent Household Survey Data.” World Bank Policy Research Working Paper 4815. Washington D.C.: The World Bank.
Zeng, Douglas Zhihua. 2011. Building Engines for Growth and Competitiveness in China: Experience with Special Economic Zones and Industrial Clusters. Washington, DC: The World Bank.
Zhang, X. and K. Zhang. 2003. “How does Globalization Affect Region Equality within a Developing Country? Evidence from China.” Journal of Development Studies (39) 4: 47-77.
Zhu, Haibin. 2006. “The structure of housing finance markets and house prices in Asia.” In BIS Quarterly Review, December 2006.
SECURING THE PRESENT, SHAPING THE FUTURE
REFERENCES 123


The East Asia and Pacific Economic Update is the comprehensive, twice-yearly review of the region’s economies prepared by the East Asia and Pacific region of the World Bank. In this edition, the report notes that inflation has become the key short-run challenge for the authorities in the region, complicated by a surge in portfolio capital inflows and rapidly increasing food and commodity prices that hit low-income households disproportionately. For many middle-income countries in East Asia, lowering inflation presents difficult policy choices. And while there is scope for tighter monetary policy, the bulk of the adjustment burden is on fiscal policy where the challenge lies in lowering deficits more rapidly while creating the fiscal space to finance infrastructure to drive future growth and assuring necessary social investments and cash transfers to the poor. Over the medium-term, East Asia has the potential to sustain rapid increases in living standards even as the global economy enters a more challenging phase. China, today the world’s second largest economy and its leading exporter and manufacturer, will remain a powerful source of external demand for East Asian producers in the foreseeable future. Tighter regional integration will help further boost the international competitiveness of developing East Asia while also providing an engine of growth that is relatively less dependent on the slow-growing high-income countries. But even as the region grows rapidly, rising inequality is a matter for concern and could pose a challenge to future social stability. Climate change complicates East Asia’s quest for continuous rapid growth. On the one hand, the carbon footprint of the region must be contained: this is the essence of the mitigation agenda. On the other, countries need to learn to live with the consequences of a changing climate—the adaptation agenda. And nowhere is the adoption and implementation of an adaptation agenda more important than in East Asia’s urban centers, the concentration of increasingly larger share of output and population.
WORLD BANK EAST ASIA AND PACIFIC ECONOMIC UPDATE 2011, VOLUME 1
Securing the Present, Shaping the Future