sector skills insights: education - gov.uk...sector skills insights: education sector skills...
TRANSCRIPT

Evidence Report 57August 2012
Sector Skills Insights:Education

Sector Skills Insight: Education
Sally-Anne Barnes and Terence Hogarth
Institute for Employment Research, University of Warwick
Rachel Pinto and Richard Garrett
UK Commission for Employment and Skills
August 2012

Table of Contents GLOSSARY ii
EXECUTIVE SUMMARY ........................................................................................................ iv
1. The Economic and Policy Climate ..................................................................... 1
2. The Importance of the Sector ............................................................................. 4
2.1 Overall Output and Employment Performance ......................................................... 4
2.2 Employment Structure (for 2010) ............................................................................. 7
2.3 Self-employment ....................................................................................................... 9
2.4 Age Structure of Employment ................................................................................... 9
2.5 Distribution of Employment by Nation and Region ................................................. 11
2.6 International Standing of the Sector ....................................................................... 12
2.7 Conclusion .............................................................................................................. 13
3. Key Challenges Facing the Sector over the Medium-term ............................... 15
3.1 Introduction ............................................................................................................. 15
3.2 From Recession to Recovery ................................................................................. 15
3.3 Investment, Innovation and R&D ............................................................................ 17
3.4 Global Competition ................................................................................................. 19
3.5 Attracting Talented Individuals and Developing Capabilities .................................. 20
3.6 Other Drivers of Change – Consumer/Learner Demand ........................................ 22
3.7 The Strategic Role of Management and Leadership Skills ..................................... 23
3.8 Conclusion .............................................................................................................. 26
4. Employment and Skill Demand in the Sector ................................................... 27

4.1 Introduction ............................................................................................................. 27
4.2 The Changing Demand for Employment ................................................................ 27
4.3 Factors Affecting the Demand for Skill ................................................................... 28
4.4 Changing Patterns of Skill Demand ........................................................................ 30
4.5 Replacement Demands .......................................................................................... 34
4.6 Conclusion .............................................................................................................. 36
5. Skills Supply ..................................................................................................... 37
5.1 The Supply Infrastructure ....................................................................................... 37
5.2 Trends in Skill Supply: Individuals .......................................................................... 38
5.3 Employer Investment in Skills ................................................................................. 42
5.4 Skills Utilisation ....................................................................................................... 45
5.5 Employer use of, and satisfaction with, the external training infrastructure ............ 46
5.4 Migration ................................................................................................................. 47
5.5 Conclusion .............................................................................................................. 47
6. Skill Mismatches .............................................................................................. 49
6.1 Defining Skill Mismatches ....................................................................................... 49
6.2 Evidence of Relative Wage Growth ........................................................................ 50
6.2 Evidence of Employer Reported Skill Deficiencies ................................................. 52
6.4 Occupational Distribution of Skills Shortages and Gaps ........................................ 54
6.5 Causes, Impacts and Remedies ............................................................................. 56
7. CONCLUSION ................................................................................................. 62
Bibliography 66

Tables Table 1.1 Four recent periods of recession in the UK ........................................................ 1
Table 2.1 Key Output and Employment Indicators for the Education Sector ..................... 5
Table 2.2 Size Structure of Employment (% of employment by employer size band), 2010
.......................................................................................................................... 8
Table 2.3 Total public expenditure on education, 2008 ................................................... 13
Table 3.1 Sector Investment as a Share of Total Investment .......................................... 18
Table 4.1 Changing Pattern of Skill Demand in the Education Sector, 2011 ................... 32
Table 4.2 Changing Pattern of Skill Demand by Qualification ......................................... 34
Table 5.1 Number of Employees in Receipt of Work-Related Training over the Past 13
Weeks, 2010 .................................................................................................... 39
Table 5.2 Employer Investments in Skill .......................................................................... 43
Table 5.3 Recruitment of young people ........................................................................... 44
Table 5.4 Recruitment of apprentices .............................................................................. 44
Table 5.5 Other Indicators of Training Activity ................................................................. 45
Table 6.1 Gross Weekly Wage Levels ............................................................................. 50
Table 6.1a Incidence of Skill Deficiencies .......................................................................... 53
Table 6.2b Density of Skill Deficiences .............................................................................. 53
Table 6.2 Investors in People Accreditation ..................................................................... 59

Charts Chart 1.1 Employment and Gross Value-Added 1978 - 2020 ............................................ 3
Chart 2.1 Trends in Employment and Output of the Education Sector, 1990-2020 ........... 6
Chart 2.2a Size Structure of Employment (% of employment by employer size band) ....... 7
Chart 2.2b Size Structure of Employment (% of employment by employer size band) ....... 8
Chart 2.3 Age Structure of the Education Workforce, 2010 ............................................. 10
Chart 2.4 Education Sector Employment by Nation and Region, 2011 ........................... 11
Chart 4.1 Employment Structure of the Education Sector, 2010-2020 ............................ 28
Chart 4.2 Replacement Demand, 2011 ........................................................................... 35
Chart 5.1 Apprenticeship Programme Starts and Achievements by Sector Subject Area –
Education and Training, 2002/03-2010/11 ....................................................... 40
Chart 5.2 Apprenticeship Programme Starts and Achievements by Sector Framework –
Teaching Assistants, 2002/03-2010/11 ............................................................ 41
Chart 5.3 Apprenticeship Programme Starts and Achievements by Sector Framework –
Learning and Development (direct training and support), 2002/03-2010/11 .... 42
Chart 6.1 Occupational Distribution of Skill shortages, 2011 ........................................... 55
Chart 6.2 Occupational Distribution of Skills Gaps, 2011 ................................................ 56
Chart 6.3 Reasons for not engaging in training leading to a qualification ........................ 58

ii
GLOSSARY This report uses data from several sources and uses a definition of the sector depending upon which data sources are available.
PRINCIPAL DATA SOURCES Employer Perspectives Survey 2010 (EPS 2010) The UK Commission’s Employer Perspectives Survey 2010 gathered the views of approximately 14,500 employers on the UK’s employment and skills system. The aim of the survey is to provide evidence to stakeholders operating in the system across the four UK nations to inform policy and improve service delivery.
Source: Shury et al (2011), see: http://www.ukces.org.uk/publications/er25-employer-perspectives-survey
UK Employers Skills Survey 2011 (ESS2011) The 2011 UK Employer Skills Survey provides UK-wide data on skills deficiencies and workforce development across the UK on a comparable basis. It was undertaken at the establishment level and involved over 87,500 interviews, with a follow up survey of over 11,000 employers focusing on employers’ expenditures on training. Source: Davies et al (2012) see: http://www.ukces.org.uk/publications/ukess-2011-first-findings
Working Futures Database Working Futures 2010-2020, is the most detailed and comprehensive set of UK labour market forecasts available. The results provide a picture of employment prospects by industry, occupation, qualification level, gender and employment status for the UK and for nations and English regions up to 2020. The database used to produce the projections is held by the University of Warwick Institute for Employment Research and Cambridge Econometrics. Source: Wilson and Homenidou (2011) see: http://www.ukces.org.uk/assets/ukces/docs/publications/evidence-report-41-working-futures-2010-2020.pdf
Labour Force Survey The Labour Force Survey (LFS) is a quarterly sample survey of households living at private addresses in the United Kingdom. Its purpose is to provide information on the UK labour market that can then be used to develop, manage, evaluate and report on labour market policies. It is conducted by the Office for National Statistics. For the purposes of this report the LFS findings are an average of four quarters data. http://www.ons.gov.uk/ons/guide-method/surveys/respondents/household/labour-force-survey/index.html
Inter-Departmental Business Register
The Inter-Departmental Business Register (IDBR) covers businesses across the economy, except some very small businesses (self-employed, those without employees and low turnover) and some non-profit making organisations. The IDBR accounts for 2.1 million businesses listed and covers 99 per cent of UK economic activity.
http://www.ons.gov.uk/ons/about-ons/who-we-are/services/idbr/about-the-idbr/index.html

iii
SECTOR DEFINITIONS
Standard Industrial Classification (SIC 2007) Based Definition Education is defined as SIC code 85. The principal data sources above use this definition of Education. This comprises pre-primary education, primary education, secondary education, higher education and educational support activities such as educational consulting and counselling. Other education activities such as sports and recreation, cultural education and driving school activities also form part of the education sector.
Sector Skills Assessment (SSA) Definition Information from the SSA for education is also used to inform the analysis in this report. This is based on the SIC definition.

iv
EXECUTIVE SUMMARY This report considers the current situation of the UK Education sector, the challenges it faces
over the medium-term and its implications for skills. The intention is to provide a summary of
the extent to which the performance challenges faced by the sector can be addressed
through skill development and thereby bring about growth and contribute to the recovery of
the UK economy.
The Importance of the Sector
• The sector is vitally important to the UK for a number of reasons. First, it is a major
employer of highly skilled and qualified employees. Secondly, it provides the UK with
a large part of its competitive advantage in world markets by providing the education
and training to individuals which allows them to provide innovative solutions to a wide
range of problems. Thirdly, it is a bulwark against social exclusion and is potentially a
facilitator of upward social mobility by providing individuals with the skills and abilities
to gain access and then prosper in the labour market.
• It is also apparent that education and training has been one of the main policy
instruments used by Government over recent years to foster growth in the economy
through, mainly, increasing the provision of education and training to all individuals.
Key Challenges
• The sector is going through a period of substantial change, though it is a sector with a
long tradition of needing to introduce major reforms since the Education Act of 1945.
Education budgets are being cut, policy continues to develop apace with implications
for the skill needs of teachers, lecturers and managers. Recent reforms have
redesigned and reshaped education and skills provision which has major implications
for managers operating in the sector.
• Further Education (FE) and Higher Education (HE) institutions are increasingly
operating in international markets for their income. So a key challenge is maintaining
its strong position in the world FE and HE markets against increasingly strong
competition from countries such as the USA and Australia.
• Attracting and retaining the best and brightest educators, particularly STEM and
modern language teachers in sufficient numbers remains a key challenge for the

v
sector. This can be achieved by putting initiatives in place to boost supply and
attracting new talent from the UK, the EU, and international labour markets.
• The sector workforce needs to develop technical and ICT skills to respond to the
increasing demand for e-learning and technology implementation in service delivery.
The implementation and exploitation of technology, in terms of new platforms, new
delivery methods and new communication methods, will be essential to growth in the
sector and maintaining its position in the international market.
Employment and Skills Demand
• Employment will continue to grow over the medium-term albeit at a slower pace than in
the past. But when replacement demands are considered, in relation to the age
structure of the workforce, there is likely to be a strong demand for labour and skills
over the medium-term.
• The occupational structure of the sector is dominated by professional staff who make
up around half of the entire workforce. This share is likely to increase over the
medium-term.
• As well as having a strong demand for professional staff, increasingly there is a
demand for people with skills in STEM subjects.
• People are attracted to teaching as a vocation, but the sector will place strong
pressures upon its supply of skills if it is to meet its projected replacement demands
and, in addition, continue to meet the demand for existing employees to acquire new
skills. Given the importance of the sector to the UK economy this is a challenge which
cannot be avoided and cannot be failed.
• Growth through skills is dependent upon people possessing the minimum entry
requirements when graduating from university. There are enormous skill
replenishment needs once people are in the sector in relation to curriculum changes
and advances in knowledge. This can only be achieved through training.
Skill Supply
• There is a well developed supply side which provides initial preparation to those
considering entering the teaching profession and supporting their ongoing continuing
professional development needs.

vi
• The Education sector invests heavily in its workforce, compared to the economy as a
whole. There is a well-developed professional development and training structure to
assist with the initial and continuing training of the sector’s workforce, but for the sector
to continue to grow, more specific professional development opportunities will be
required in key areas.
• It is also apparent that the sector has made use of initiatives such as Apprenticeships
to provide training via vocational entry routes into the sector.
Skill Mismatches
• Skill mismatches are less in evidence in the sector than in the economy generally.
This relates to both external skill deficiencies (i.e. recruitment problems) and internal
ones (i.e. skill gaps).
• This relates at least in part to the strong training supply infrastructure and the relatively
heavy investments which are made in the training of new and existing teachers,
trainers, and lecturers.
• Despite the relatively low incidence of skill mismatches there are likely to be particular
areas of shortage, such as those people are who are skilled in teaching STEM
subjects.
Concluding Comments: Benefits of Training
• An exhortation to train more would not be well placed in the context of the Education
sector because of the high volume of activity already undertaken. What can be said is
that there is a need to maintain current levels of activity and build upon it, at a time of
pressures on education and training budgets, in order that important economic and
social goals are not derailed by people lacking the necessary skills the economy
needs.
• The evidence demonstrates that there are relatively good returns for individuals and
employers who invest in skills. There is also a strong education and training
infrastructure to help deliver the skills the sector needs. However, the skills the sector
needs can also be successfully delivered via programmes such as Apprenticeships
and Investors in People.

1
1. The Economic and Policy Climate Increasingly, the competitiveness of advanced industrial nations is explained with reference
to the capabilities of their respective labour forces. Hence, national education and training
systems are seen as providing comparative economic advantages. It is notable that over the
recent past education and training have taken centre stage in policies designed to foster the
UK’s competitiveness and lie at the heart of the current Government’s plans to kick start the
recovery against a backdrop of challenging global economic conditions. To understand the
role skills development might play in stimulating growth within the digital and creative sector
requires some consideration of the current economic situation and current skills policy.
In 2012 the UK economy, and indeed the global economy, is still coming to terms with the
repercussions of the 2008/9 economic recession. By comparison with previous recessions,
2008/9 was relatively deep and it continues to cast a long shadow over the country’s
medium-term economic prospects (see Table 1.1). The economic climate at the time of the
2008/9 recession and in the period afterwards has been characterised by low interest rates
and a depreciation of sterling against other currencies, notably the dollar and the euro.
Whilst these would usually be sufficient to give a fillip to the economy by boosting demand
and, given time, increasing output, the potential for export led growth has been seriously
undermined by continuing weak demand conditions across the global economy, especially in
the Eurozone and the USA. Also the difficulties households and businesses have had
gaining access to finance as the banks have sought to increase their capital has restricted
growth. Moreover, the markets’ continuing disquiet over developments in the Eurozone has
contributed further to the climate of uncertainty in the global economy thereby further
dampening demand.
Table 1.1 Four recent periods of recession in the UK
Start date Date of bottom of recession
Length of period from
start to bottom of recession
Total decline in GDP (%)
Time taken for GDP to
recover to level at start of
recession
1 1974 Q4 1975 Q3 4 Quarters 3.8 7 Quarters
2 1980 Q1 1980 Q4 4 Quarters 5.9 13 Quarters
3 1990 Q3 1992 Q2 8 Quarters 2.3 11 Quarters
4 2008 Q2 2009 Q1 6 Quarters 6.3 ? Source: Office of National Statistics Quarterly Economic Accounts, 1975, 1981, 1993, 2010

2
As a consequence of the above developments, the rapid acceleration in growth observed
after the recessions of the early 1980s and 1990s has failed to materialise. Nevertheless the
economy is expected to resume its long-run growth path over time (see Chart 1.1) but in
order to do so there are specific steps the UK economy needs to take. The UK Treasury has
identified a number of weaknesses which need to be addressed if a sustained recovery is to
be achieved (HM Treasury 2011a):
i. the level of debt funded household consumption;
ii. the share of the economy accounted for by the public sector;
iii. weak business investment;
iv. an over-dependence upon financial and business services; and
v. unbalanced regional growth.
Government has identified four ambitions which need to be realised in order to restore long-
term sustainable growth (HM Treasury 2011a):
i. creating the most competitive tax system in the G20;
ii. making the UK one of the best places in Europe to start, finance and grow a business;
iii. encouraging investment and exports as a route to a more balanced economy; and
iv. creating a more educated workforce that is the most flexible in Europe.
Therefore, the role of skills in national economic policy is clearly an essential one; to bring
about recovery and sustainability by creating jobs and growth.
From the employer’s perspective there is a need to adapt to both global demand side
conditions and the consequences which are likely to arise from policies designed to
rebalance the UK economy. Depending upon the sector there are likely to be a number of
skill-related performance challenges which employers will need to address as they seek to
consolidate existing markets, develop new ones, and introduce technical and organisational
changes to improve their competitiveness. The importance of these challenges become
even more apparent if one considers the role of skills in the economic cycle. Evidence
demonstrates that the recovery from previous economic recessions was hampered by skills
shortages, and that these skill shortages then contributed to further downturns in the
economy (Blake et al., 2000). Therefore, the message is clear: a failure to invest sufficiently
in skills now has the potential to dampen future growth.

3
Chart 1.1 Employment and Gross Value-Added 1978 - 2020
Source: Wilson and Homenidou (2011)
At a time when capital investments are constrained as a consequence of problems in the
global banking system, investments in skills, and human resources more generally, made
through programmes such as Apprenticeships and Investors in People, and funded through
initiatives such as the Growth and Innovation Fund, may be the most amenable to
employers.
Based on the latest evidence available, this report considers the specific situation in the
Education sector to provide:
i. an overview of the size and structure of the sector and the principal drivers of change
over the medium term which are likely to have some bearing upon skill demand;
ii. an outline of current and expected patterns of skill demand in the sector;
iii. a description of skills supply and how this has adapted to changing patterns of skill
demand;
iv. an analysis of mismatches between the demand for, and supply of skills, and the
implications of this for the sector.
In conclusion, the report identifies the performance challenges faced by the sector and
highlights the skills solutions available to address them thereby delivering increased levels of
growth and contributing to the recovery of the UK economy.
20000
22000
24000
26000
28000
30000
32000
34000
400000
600000
800000
1000000
1200000
1400000
1600000
Empl
oym
ent (
000s
)
GVA
(£m
)
GVA (£2006m)Employment (000s)

4
2. The Importance of the Sector
2.1 Overall Output and Employment Performance
The Education sector has a significant role to play in the sustainable long-term economic
growth of the UK. The Government’s first growth review (HM Treasury, 2011a) focused on
eight key sectors to contribute to the UK’s future competitiveness and prosperity. The
second Government growth review focused on the Education sector and the growth in skills
across the economy (HM Treasury, 2011b). The Education sector has an essential role in
developing skills and knowledge - which are at a premium in the current economic climate
given that the supply for labour is currently outstripping its demand - and addressing high
youth unemployment by providing young people with the skills which allow them to enter the
labour market (BIS, 2011a).
Table 2.1 highlights key output and employment indicators for the Education sector over the
last ten years and for the coming decade.
The Education sector contributed nearly £70 billion in 2010 (2006 prices) to the UK economy
(i.e. gross value added, GVA). This has grown, on average, by 0.5 per cent a year between
2000 and 2010. Growth between 2010 and 2020 is forecast to be 3.6 per cent, which is
equivalent to growth rate only 0.4 per cent a year to 2020. The sector contributes seven per
cent to the total output of the UK. It is also export orientated with Further Education (FE)
and Higher Education (HE) institutions recruiting pupils from abroad and/or developing
campuses overseas.
The sector is principally a public sector one. UK public expenditure on all education levels
(as a percentage of GDP) has risen from 4.5 per cent in 1999 to 5.4 per cent in 2008. A
similar rise has been recorded in private expenditure on education; 0.8 per cent in 1999 to
1.7 per cent in 2008 (Eurostat, 2011). At primary and secondary levels, there is a
substantial and growing private sector (OECD, 2011).
Focusing on employment performance, the sector workforce grew steadily throughout the
last decade by two per cent a year. It represents nine per cent of total employment in the
UK. As in other service sectors, the workforce is dominated by women with around 69 per
cent of the education workforce is female (Wilson, et al, 2008). Although women dominate
in administrative and support roles in the sector, it provides an important source of high
skilled employment for women. For instance, 59 per cent of teaching staff in Further

5
Education (FE) colleges are female, whilst women occupy 53 per cent of academic
professional roles in Higher Education (HE) (LLUK, 2011b).
In the Education sector over the last decade, there has been relatively strong employment
growth, albeit from a low base, of people who are self-employed (by 8.2 per cent a year
between 2000 and 2010) (see Table 2.1). The number of full-time and part-time workers has
also increased but more slowly, by 1.4 per cent and 1.7 per cent a year, respectively.
Projections suggest that growth in the sector, between 2010 and 2020, will again be among
the self-employed, with numbers increasing by 13 per cent. Over the same period, the part-
time workforce is projected to grow by 0.6 per cent, whilst the full-time workforce is expected
to decrease by 6 per cent. Overall, future employment in the sector is forecast to decrease
by 0.1 per cent a year between 2010 and 2020. Decreases among the male workforce will
be more marked than that of the female one. The projected changes in the numbers of self-
employed people working in the sector will have significant implications for skills and training
in the sector.
Table 2.1 Key Output and Employment Indicators for the Education Sector
Education 2010 level
Growth rate: 2000-
2010 (% p.a.)
Changes (absolute)
Growth: 2010-
2020 (%)
Growth rate: 2010-
2020 (% p.a.)
Changes (absolute)
Output (£2006m) 69,667 0.5 3,429 3.6 0.4 2,529
Employment 2,702,602 2.0 484,602 -1.5 -0.1 -39,432
Part time employment 1,170,628 1.7 185,262 0.6 0.1 7,124
Full time employment 1,290,173 1.4 167,139 -6.0 -0.6 -77,938
Self employment 241,801 8.2 132,201 13.0 1.2 31,382
Male employment 841,200 2.1 157,042 -1.6 -0.2 -13,049
Female employment 1,861,402 2.0 327,560 -1.4 -0.1 -26,383
Source: Wilson and Homenidou (2011)

6
Employment in the sector is female dominated and in terms of ethnic group it is
predominately white. The number of female workers in the Education sector has grown
significantly over the last three years (UK Commission, 2011).
The Education sector has been a source of growth for the UK economy. Excluding the public
sector, there has been year-on-year increases in turnover and purchases of between 5 and
12 per cent across the 2008 - 2010 period resulting in a £2.5 billion increase in approximate
GVA from 2009 - 2010. GVA for the sector was £9,995 million in 2008, £9,982 million in
2009 and an increased to £12,449 million in 2010 (Annual Business Survey, 2011).
From 2010, employment in the sector has continued to rise and it is projected to remain
relatively constant to the year 2020. Output, however, has been relatively stable since 2004,
although it is forecast to decrease slightly from 2010 to 2015 but moderate growth is then
forecast up to 2020.
Chart 2.1 Trends in Employment and Output of the Education Sector, 1990-2020
Source: Wilson and Homenidou (2011)
The UK Education sector is a highly skilled one: half of the workforce comprises professional
workers – principally in teaching, training, and lecturing jobs – and the share of people
working in highly skilled and qualified jobs will increase in the period to 2020.
0
10,000
20,000
30,000
40,000
50,000
60,000
70,000
80,000
0
500
1,000
1,500
2,000
2,500
3,000
1990 1995 2000 2005 2010 2015 2020
Output (£2006m)Employment (000s)
Education
Employment Output

7
2.2 Employment Structure (for 2010)
The evidence shows that most establishments in the sector are relatively small (20 per cent
having between 2 and 4 employees and 54 per cent have fewer than 25 employees (see
Chart 2.2a).
Chart 2.2a Size Structure of Employment (% of employment by employer size band)
Source: Inter-departmental Business Register (IDBR), ONS 2010.
The distribution of employment by employer size in the sector is shown in Table 2.2 and
Chart 2.2b. In terms of employer size, the Education sector is different to the UK economy
as a whole. Employment is concentrated within establishments with 50 or more employees,
compared to the UK economy where the majority of employees (36 per cent) are working
within a company with less than 25 employees (see Table 2.2, below).
2-4, 20
5-9, 14
10-24, 20
25-49, 23
50-250, 21
251+, 2

8
Table 2.2 Size Structure of Employment (% of employment by employer size band), 2010
Number of employees All employment (%) Education (%)
Under 25 36 20
25 to 49 13 21
50 to 249 23 37
250 to 499 7 5
500 or more 21 17 Source: Labour Force Survey 2010, (average of four quarters).
Organisations with 250-499 employees account for the smallest share of employment in
education (5 per cent), whilst companies with 50-249 employees comprised 37 per cent of
total employment in the Education sector in 2010. The smallest employers (those with less
than 25 employees) accounted for 20 per cent (see Table 2.2 above) in 2010.
Chart 2.2b Size Structure of Employment (% of employment by employer size band)
Source: Labour Force Survey 2010 (average of four quarters).
Under 2520%
25 to 4921%
50 to 24937%
250 to 5005%
500 or more17%

9
2.3 Self-employment
Self-employment in the Education sector is relatively small, accounting for 8.9 per cent of all
employment, compared to 14 per cent across all sectors. Between 2010 and 2020, the
numbers of self-employed in education are projected to increase by 1.2 per cent a year (see
Table 2.1 above). A possible explanation for the increase may be due to the demand for
private education services. This presents more opportunities for self-employment through
private tuition, assessors and examiners. Alternatively, there also may be an age effect, as
older workers may be keen to work on a self-employed basis, after retiring from the sector.
Across the whole economy, the number of self-employed is projected to increase by 0.2 per
cent over the same period. The Education sector together with the Construction and Digital
and Creative sectors are the only sectors with a positive increase in the numbers of self-
employed forecast between 2010 and 2020.
2.4 Age Structure of Employment
The profile of the UK labour force is changing as individuals extend their working lives and
respond to changes in the default retirement age. Chart 2.3 shows the age structure of the
Education sector workforce by gender. The sector has typically had an older worker profile
and this is set to continue. The majority of the education workforce is aged between 25 and
59 years, but there are also high numbers of people aged 60-64 years employed in
education compared to other sectors. So, the development and implementation of effective
age management strategies across the Education sector are still needed (LLUK, 2011b;
Manfredi, 2008; Universities UK, 2007).
In terms of male employment in the Education sector, 13 per cent are aged 60 years and
over, compared with only 9 per cent across all sectors. By contrast, there is very low sector
employment of those aged 16-18 years (only 1 per cent, compared with 2 per cent across all
sectors).

10
Chart 2.3 Age Structure of the Education Workforce, 2010
Source: Labour Force Survey 2010 (average of four quarters).
In FE, 35 per cent of staff is aged over 50 years compared with the national average of 24
per cent (LSIS, 2011b). In this sub-sector, there are particular issues requiring consideration
as:
• the number of older workers in support roles is increasing;
• part-time working arrangements are common; and
• those in selected occupations are more likely than others to work beyond 60 years
(including those in managerial, technical and teaching roles) (LSIS, 2011b).
This has positive implications for addressing the demand for teaching and training skills. The
retention and recruitment of staff beyond 60 years allows skills, knowledge and experience
to be retained.
An ageing population and workforce across the UK also has implications for the sector as
more adults will require education later in life to ensure their skills are up-to-date and that
they gain new skills in order to work longer. In FE, requirements for both vocational and
non-vocational courses are predicted to rise. As government funding is not expected to
increase, meeting these demands will require the workforce to adapt and look to partnership
funding (LSIS, 2011b). This could drive further collaborations with employers. New
0% 10% 20% 30% 40% 50%
Under 16
16 to 18
19 to 24
25 to 34
35 to 44
45 to 59
60 to 64
65 and over
All
Female
Male

11
technologies will increasingly be used to address these new demands, but will require the
Education sector workforce to develop new technical skills.
2.5 Distribution of Employment by Nation and Region
The distribution of the Education sector workforce across the UK (England, Scotland, Wales
and Northern Ireland) and English regions are depicted in Chart 2.4. Employment is
concentrated in the South East and London. Northern Ireland and the North East have the
smallest employment numbers.
Trend data show that across the majority of regions employment levels in the Education
sector have slowly increased from 1990 levels, peaking in 2009. However, employment
levels are forecast to fall to some extent and then stabilise by 2020. A similar picture is
forecast for Scotland and Wales. In Northern Ireland, education employment levels have
remained relatively constant since 2005 and are forecast to remain at similar levels by 2020.
Chart 2.4 Education Sector Employment by Nation and Region, 2011
Source: Wilson and Homenidou (2011)
The HE sub-sector in London and the South East has the highest total revenue (£4.85 billion
and £3.1 billion, respectively) and provide the most full-time equivalent (FTE) jobs across a
wide range of occupations (74,641 FTE and 42,960 FTE, respectively) (Universities UK,
2010). The North East, by comparison, has the lowest revenue of £967 million and its
universities only provide 13,715 FTE jobs.
There are national, regional and sub-regional differences in terms of education and skills
needs, which the Education sector is proficient at responding to. For example, in areas with
high levels of long-term unemployment, there is a need to provide training around
employability skills that are focused on getting the individuals back into work (LLUK, 2011b).
England, 2281.3
Wales, 134.8
Scotland, 208.7
NI, 77.8
Education
Employment (000s)
London, 320.4
South East, 394.2
East, 247.1
South West, 222.4
West Mids, 250.9
East Mids, 179.0
Yorks/Hum, 264.0
North West, 298.5
North East, 104.7
Education
Employment (000s)

12
2.6 International Standing of the Sector
European data reveals that the sector in the UK is relatively large accounting for 11 per cent
of all employment in the UK (according to Eurostat data for 2008) compared with an average
of 7 per cent per cent in the European Union (EU). Overall, the sector in the UK accounts
for 19 per cent of employment in education in the EU.
In terms of expenditure on education, the UK is ranked fifth internationally, with the USA
spending considerably more than any other country (see Table 2.3 below). In 2008, an
estimated 93,635 million Euros was spent on education in the UK (Eurostat, 2011).
However this picture may have changed slightly following the recession.
FE and HE institutions are increasingly operating in international markets. The UK has a
successful Higher Education system, which is home to the majority of top universities in the
world (with the exception of the USA). Although HE has experienced recent funding
increases and additional income from student top-up fees, new sources of income are being
sought. Across the Education sector, there is increasing competition internationally to attract
overseas students who are charged higher fees than domestic and EU students. The UK
share of overseas students is expected to fall.
Within the sector lies a substantial part of the UK’s R&D capability. In particular, the HE sub-
sector plays a significant role in attracting international R&D investment to the UK (Russell
Pioneering Research Group, 2010). Universities in the UK have become more proactive in
developing sources of future income from their research activities. Long-term partnerships
and companies have been set up from these activities with the aim of becoming income
generators. See section 3.3, below, for data on R&D in the sector.

13
Table 2.3 Total public expenditure on education, 2008
2008
(Millions EUR PPS)
United States 599,340 Japan 117,711 Germany 107,711 France 96,689
United Kingdom 93,635
Italy 69,970 Spain 54,140 Netherlands 30,159 Poland 27,458 Belgium 19,973 Sweden 19,113 Norway 14,724 Switzerland 14,554 Austria 14,161 Denmark 12,816 Portugal 10,222 Finland 9,570 Romania* 9,486 Czech Republic 8,582 Ireland 8,477 Hungary 8,262 Bulgaria 3,629 Slovakia 3,518 Croatia 2,974 Lithuania 2,558 Slovenia 2,405 Latvia 1,850 Cyprus 1,412 Estonia 1,284 Luxembourg* 1,036 Iceland 7,31 Malta 472 Liechtenstein 56
Source: Eurostat 2011 Note: 2008 and 2007 data unavailable for Greece, Montenegro, Former Yugoslavia and Turkey. * 2007 data used for Romania and Luxembourg as 2008 data were unavailable.
2.7 Conclusion
The Education sector makes a significant contribution to the UK economy and has a strong
international profile, particularly in HE and increasingly in FE. R&D activities are a
substantial element of the sector’s contribution to the economy. The sector will continue to
be an important sector over the medium to longer-term, as demands for education and
training increase to meet the needs of those working longer. Technical skills will also be
needed to meet the demands that new technologies in the sector brings. The development

14
of knowledge and skills adds to individual quality of life and the competitiveness and cultural
capital of the country. GVA has continued to increase since 2008 and moderate increases
are forecast over the medium term. Higher pupil scores, the rising qualification levels of the
workforce and a more skilled workforce will contribute to increasing the productivity of the
economy.
The employment structure of the sector is forecast to remain the same, but the number of
people employed in the sector will continue to grow over the next decade, but this is mainly
accounted for by the rise in the number of those self-employed. It is important to note that
the sector has an older workforce profile, which will have implications on replacement
demands in the future. The sector will remain an important source of high skilled
employment for women.
Section 3 looks at the key challenges facing the sector over the medium term, including
implications for the future.

15
3. Key Challenges Facing the Sector over the Medium-term
3.1 Introduction
A number of key challenges face the Education sector and will be particularly influential over
the medium-term. Of course, the impact of the 2008/09 recession and policies to address
some of the issues contributing to the financial crisis and to stimulate recovery will have
implications for the sector’s performance in the years to come, whilst other issues which
have been important for the sector will continue to present challenges. Over the medium
term the sector needs to focus on:
• the sector’s economic impact on the economy;
• its role in increasing the stock of human capital in the labour market;
• maintaining the world class education system and improving in terms of international educational attainment indicators; and
• developing workforce capacity and skills.
This section outlines the key challenges facing the sector over the medium term by
considering the role it will play in: supporting the economy move from recession to recovery;
encouraging investment, innovation and R&D in the sector; tackling global competition; and
meeting changing consumer/learner demands. Attracting talented individuals and developing
their capabilities, together with the strategic role of management and leadership skills will be
considered.
3.2 From Recession to Recovery
The recent economic downturn has had, and will continue to have, an impact on the
Education sector in terms of policy changes, reduced funding, reduced workforce numbers
and efficiency measures. Despite this, the sector will continue to grow in economic
importance. UK FE and HE, in particular, are important to the economy in terms of output,
but require a combination of public and private sector funding (Universities UK, 2009). In
response to the recession, policy has shifted responsibility for skills development to
education providers, individuals and employers, though the State continues to fund a large
part of post-compulsory education. There is an emphasis on supporting local partnerships to

16
deliver services and increase funds for work-based learning. As part of economic recovery,
the Education sector will need to:
• provide individuals of all ages with the knowledge and skills that will sustain them in the labour market through their life course;
• deliver economically valuable skills which employers require;
• attract STEM and modern language teachers in sufficient numbers;
• continue to develop the market and generate export income;
• maintain its strong position in the world Higher Education market; and
• attract and retain the best and brightest educators.
A challenge for the sector will be to deliver the same level of service with reduced levels in
public funding and other sources of income. The proportion of HE income from public
sources has fallen from 61 per cent in 2005/06 to less than 56 per cent in 2009/10, but
institutional income from non-EU domiciled students continues to rise (Universities UK,
2011). It is unknown to what extent the current economic climate and the new fee
arrangements will impact on the number of UK domiciled and overseas applicants, who
provide a valuable source of income for both FE and HE Education institutions. Research
has suggested that upfront fees will have a negative impact on participation in HE and that
increases in financial aid will have a positive impact (Dearden et el, 2010). Early indications
are that there has been an 8.3 per cent decrease in the number of UK, EU and non-EU
applicants to UK universities1 but only time will tell what the longer term impact will be. The
number of applications from domestic students has decreased by 8.5 per cent between 2011
and 2012, to 478, 285 applicants.
In the FE sector too there are changes afoot with changes to entitlements especially for
people aged over 25 years where increasingly either the employer or the individual will be
expected to contribute to the costs of their training in England.
Without doubt, the Education sector is key to economic recovery and is able to address the
labour market need for new skills, knowledge and innovations. In its Plan for Growth (HM
Treasury, 2011a), the Government has set out measures to secure opportunities for
sustainable growth through the education and skills system. Economic output is attributed in
1 For more data on number of 2012 applications to UK Higher Education Institutions see:
http://www.ucas.com/about_us/media_enquiries/media_releases/2012/20120228.

17
part to a skilled workforce. One of the Government’s four ambitions is to create an educated
and flexible workforce for Europe. It is the aim to create new jobs by stimulating private
sector growth. In addition, to make the education and skills system more responsive to the
demands of the labour market, there have been reforms in education policy, and the Further
and Higher Education systems. The aim of these changes has been to address employer
needs for increased literacy, numeracy and employability skills in labour market entrants
(HM Treasury, 2011b).
3.3 Investment, Innovation and R&D
Investment is one key driver of productivity – raising productivity by increasing the amount of
capital available per worker, or through the adoption of new, better technologies in
production and/or delivery processes. A key challenge for the Education sector over the
medium-term is to support innovation and encourage R&D activity, of all which provide
valuable sources of income and stimulate investment. Investment in education, as a share of
economy-wide investment, rose from 5.3 per cent in 2006 to 7.2 per cent in 2009. Over this
period, this represents the third largest increase in sector investment behind ‘Public
administration and defence’ and ‘Electricity, gas and water supply’ (see Table 3.1, below).

18
Table 3.1 Sector Investment as a Share of Total Investment
Sector 2006 2007 2008 2009
Agriculture 1.9 1.8 2.1 2.0
Mining and quarrying 3.1 3.5 3.1 3.5
Manufacturing 9.2 8.9 8.4 7.9
Electricity, gas and water supply 3.7 4.5 5.1 6.3
Construction 2.3 2.1 1.7 1.4
Distribution 12.1 12.4 10.9 10.1
Hotels and restaurants 4.1 4.2 4.2 3.6
Transport and communications 15.6 14.5 15.2 16.0
Financial intermediation 5.5 5.5 5.6 4.6
Real estate, renting & business services 14.0 15.4 13.8 11.5
Public administration and defence 7.9 7.9 9.1 10.8
Education 5.3 4.9 5.6 7.2
Health and social welfare 3.3 3.2 3.7 4.5
Other services 11.9 11.2 11.5 10.5
Total 100 100 100 100
Source: UK Commission (2011)
Note: Percentage shares of total investment based on current price data.
Data show that those developed countries which have invested in education to prepare their
workforce for new jobs have higher levels of educational attainment and employment. In
terms of public expenditure on education, the UK expenditure (as a percentage of GDP) of
5.7 per cent is below the OECD (2011) average of 5.9 per cent and well below Korea (7.6
per cent), Norway (7.4 per cent) and the USA (7.2 per cent). It is reported that on average,
public expenditure at all levels of education has decreased globally, but as a share of all
tertiary education funding private funding for tertiary education rose by more than 10
percentage points between 2000 and 2008 in the UK due to the decrease in public funding.
The growing use and application of information and communication technology has
enhanced networking and social engagement between the education community and labour
market, both local and internationally (Kearney, 2009). This has been beneficial for
attracting investment and R&D. A challenge for the sector is to support this type of activity
by encouraging new partnerships. Partnerships between governments, the private sector
and universities are growing and supporting innovation. To address this, The Wilson Review

19
(BIS, 2012) has reviewed business-university collaboration and the role the Government can
play in supporting these partnerships. It is recognised that there is a strong link between
universities, innovation and R&D activity, which are integral to economic and business
development, but skills are needed to support these activities, together with more flexible
research systems to address the tensions between basic and applied research (Kearney,
2009).
The UK Higher Education sub-sector is internationally recognised for its innovation and
knowledge exchange, which makes a significant contribution to the economy (Universities
UK, 2009). Universities are establishing their own spin-off enterprises and their partnerships
with business are good examples of how this is being achieved. It is estimated that the UK
HE sub-sector generated over £59 billion of output in 2007/08 (Universities UK, 2009). So,
universities have an important role to play in creating new knowledge and capacity building
to support R&D activity in order for the UK labour market to compete in the global labour
market.
3.4 Global Competition
Over the past decade, the Education sector has had to respond to policy and educational
reforms in the UK and international markets. The sector continues to respond to changes in
demand, diversification of provision, changing education and skills needs, together with the
implementation of technology (Kearney, 2009). Investment in education and training
systems is vital to economic growth and the challenge for the sector is to meet investment
needs within a global market. Being competitive in the global market requires the Education
sector workforce to develop various management skills, which include managing: change in
economic circumstances; contracts and projects; staff (both those that are employed and
those that volunteer); a range of customers, such as learners, businesses, policy makers;
and the increasing use of technology in delivery (LLUK, 2011b). Strategic planning skills,
marketing, networking and business development have also been identified as essential.
The Education sector has a highly skilled and qualified workforce, but globalisation has
increased the supply of labour and skills. There is an increasing demand for high-quality HE
academic staff from education providers in countries where systems are being reformed and
those who are developing rapidly (Universities UK, 2007, 2011). Education providers are
increasingly providing courses in English, so the UK Education sector is competing for both
students and staff as mobility rises. UK institutions are successfully attracting academics
from other countries and international students who often remain in the UK to work after their

20
studies. The challenge is to improve the Education sector, at least as quickly as the main
competitors. This means attracting high level, high quality teachers, trainers, managers and
leaders, support staff, and researchers, as well as making it an attractive sector in which to
work. A major challenge for all parts of the Education sector is the capacity to recruit and
retain staff, especially in those subject areas where staff are in high demand.
International students also provide valuable income to the HE and FE sectors, and also have
a positive impact on local economy. Current data suggest that in the short-term international
applicants are not declining. The number of HE applications from EU decreased by 12 per
cent, whilst non-EU domiciled applicants increased by 13 per cent. A high proportion of non-
UK domiciled students at UK HE institutions were from Asia and the European Union
(excluding the UK) (Universities UK, 2011), but the market for international students is
becoming more competitive, so over the medium-term universities will have to meet this
challenge. It is recognised that they need new skills in order to compete in this international
market. At a fundamental level, new skills are required to facilitate learning (such as
language skills) for students who are coming to study in the UK from eastern European
regions, the Middle East, India and elsewhere.
3.5 Attracting Talented Individuals and Developing Capabilities
As discussed earlier, there is strong competition for high quality teachers, both within the UK
and from abroad. Here, the challenge of attracting talented individuals and developing their
capabilities and skills are discussed. In the compulsory Education sector, there is strong
competition between the private and public sector for suitably qualified and experienced
teachers, particularly in science, technology, engineering, mathematics and modern
language subjects. The capacity of schools to compete on the basis of salaries is
constrained, so there is a need to develop policies which will attract people into the sector
and ensure that they develop their careers. In HE, there is international competition for staff.
A number of initiatives have been developed in the UK to encourage individuals to enter
teaching and develop their capabilities. These include: subsidised training to people
qualifying in STEM subjects and modern languages; bursaries; transference courses to allow
people to quickly access teaching from industry; and fast-track programmes to allow suitably
qualified teachers to attain senior roles within schools. The Teach First initiative recruits and
trains graduates with a 2:1 or higher degree and places them in challenging schools, often
located in deprived areas. Schools employing these teachers have seen improvements in
pupil achievements. The Teach First Charity is small, but has been successful in recruiting

21
graduates and has plans to double this in 2013. The Training and Development Agency for
Schools (TDA) recruits around 37,000 each year for the school workforce. Bursaries are now
available to boost recruitment in selected subjects, including specialist mathematics, physics
and chemistry, thereby facilitating the satisfaction of demands for more STEM teachers.
The demand for people to work in the sector over the medium term is large when the level of
replacement demand is considered. The challenge of attracting more people to work in this
profession is a necessity. Providing on-going training and Continuing Professional
Development (CPD) are already part of measures to retain people (such as the Leadership
Development Programme) and are a statutory requirement in parts of the sector. Although
there is a substantial infrastructure in place to attract people into the sector, obtain their
initial training, and then further develop their skills, this is not a solution in itself. These
initiatives need to be developed further to ensure that talented individuals are attracted to the
sector.

22
Case Study: Teach First – Attracting and Developing Talented Individuals
The Challenge
Only four per cent of all teachers would consider teaching in a school in challenging circumstances.
This poses a huge challenge for tackling the problem of educational disadvantage, and attracting
talented individuals to work in these schools.
The approach
Teach First harnesses the energy, enthusiasm and drive of exceptional graduates to provide
leadership, motivation and, above all, inspirational teaching in schools in challenging circumstances
across England. The charity (founded in 2002) attracts new talent to the sector by providing an
intensive two year Leadership Development Programme, which combines working, training, coaching
and mentoring to develop individual leadership abilities. Alongside the programme, there are
opportunities for internships, networking and the opportunity to work towards a Masters qualification.
So, in the long-term, individuals develop a range of transferable skills.
The benefits
Every Teach First teacher is placed in a challenging school, and over 90 per cent of Teach First
recruits stay for a minimum of two years and over 50 per cent stay longer. While 67 per cent of those
placed since 2003 remain actively engaged with addressing educational disadvantage through the
Teach First ambassador community.
"Teach First is almost like a constant reminder that there's a wider mission out there and there's an
opportunity to learn new skills, go to events and meet new people. I think also it constantly reminds
me of the Teach First mission, so that I'm not just plodding through my day job, I'm kind of thinking
that there is a sense of urgency, there is a desire to see change in these inner-city schools." Taken
from Teach First’s report.
Source: Teach First website
See: http://www.teachfirst.org.uk/OurWork/
3.6 Other Drivers of Change – Consumer/Learner Demand
The Government is working with employers to understand what more it can do to make the
skills system more responsive to their needs. Changes have focused on: addressing the
skills of labour market entrants; increasing the skills of the existing workforce; facilitating
informed education and careers choices and decisions; and maximising the potential of the
UK’s education export market. So for instance, participation in education or training will be
compulsory to 18 years ago by 2015. More investment is to be made available to support
work-experience as part of post-16 learning. Expanding University Technical Colleges
(UTCs), improving support and quality of Apprenticeships and vocational training will provide

23
further opportunities for individuals to learn and develop skills. Educational courses are to
be kite-marked (particularly those in science, engineering, technology and mathematics
subjects), so students are aware of what employers have endorsed. An improved careers
information, advice and guidance portal (the National Careers Service) will be launched in
early 2012. In addressing these changes, a key challenge for the sector is to ensure that
consumer/learner demands are met as well as employer demands.
Both FE and HE institutions report that learner demands (and expectations) are increasing
(LLUK, 2011b). Learner demands are focused on new delivery methods and options, as
well as more pastoral support. As more students are opting to study part-time, educational
institutions have to adapt, which means the workforce requires different skills sets and
working patterns. For those working in areas of high unemployment, the sector workforce
has to learn to support those looking for work to develop employability skills, for example
self-management, team-working, business and customer awareness, problem solving,
communication and literacy, the application of numeracy, and the application of information
technology. A key challenge for the sector workforce is to maintain knowledge and skills
related to qualification and curriculum reforms, including understanding the size and level of
qualifications, developing more flexible training programmes for learners and tracking learner
achievement through an individual’s electronic learner record.
3.7 The Strategic Role of Management and Leadership Skills
As mentioned, management skills are vital for the UK Education sector to compete
internationally. The Education sector also needs to manage a programme of change
resulting from policy reforms at all levels. This places considerable pressure on
management and leadership skills, which are now the responsibility of head teachers,
principals, vice chancellors and other senior staff within educational institutions. Much of this
responsibility is related to managing finances, managing the performance of teachers and
lecturers, improving educational standards, research and project management, plus
marketing, networking and business development. Enhancing leadership, governance and
management for improvement, innovation and change is one of the five strategic platforms
set out by LSIS (2011c) in its Strategic Intentions 2011-2014 and part of the mission for the
Leadership Foundation for Higher Education.2
2 See Leadership’s Foundation website, http://www.lfhe.ac.uk/about/.

24
Over a number of years, educational institutions have been increasingly self-governing.
School heads, for instance, now have more management responsibilities than their
counterparts 20 or 30 years ago. At all levels of the education system, senior managers
within schools, colleges and universities are facing a variety of challenges and require more
strategic management skills, for instance:
• schools: substantial decrease in their capital spending, managing teacher
performance, meeting educational standards and ensuring sufficient enrolments;
• FE: budget cuts, the need to provide a more responsive service to employers to
maintain income, developing overseas markets;
• HE: managing the increase in tuition fees and substantial reduction in funding for
non-STEM subjects; being able to develop international markets.
There is a substantial professional development and training infrastructure to foster
management and leadership skills in the sector, as illustrated in the case study, below, on
developing management skills.

25
Case Study: Developing Management Skills – Meeting More Demanding Leadership Needs in Schools The challenge
With increasing self-governance and leadership demands being placed on head teachers the current
National Professional Qualification for Headship (NPQH) was failing to meet their needs.
The approach
The National College for School Leadership in England decided the best way forward was to revamp
the NPQH so that it was more targeted and relevant to their needs. The changes announced by the
National College for School Leadership included a tougher entry bar, more demanding content and a
much sharper focus on the key skills required by heads to achieve higher standards for pupils – from
the leadership of teaching and learning to the management of behaviour and teacher performance.
Essential modules for the NPQH now include, ‘leading and improving teaching’, ‘leading an effective
school’ and ‘succeeding in headship’. The new programme also includes greater access to peer
networks and resources for head teachers.
Steve Munby, Chief Executive of the National College, said: “Raising the bar will help to drive up the
standard of school leadership in this country even further. We believe the new non mandatory NPQH
will become the first choice qualification, ranked alongside the best leadership development in the
world, and the mark of quality that governing bodies and academy boards choose to rely on when
appointing head teachers and principals, as only the most talented candidates will get through.”
The Benefits
In developing initiatives like the NPQH, the sector is developing management and leadership skills
across schools in England, and providing a wealth of support to head teachers as requirements
change.
Source: National College for School Leadership in England website
See: http://www.education.gov.uk/nationalcollege/index/professional-development/npqh.htm
A further strategic challenge for the sector is the fact that there is scope for increasing the
number of schools and training providers classified by Ofsted as ‘outstanding’ (LSIS, 2012).
This clearly has implications for strategic management and leadership skills.

26
3.8 Conclusion
A number of key challenges face the Education sector over the medium term. The recent
recession has had adverse effects on the sector in terms of funding cuts and the recovery
presents a number of challenges to all parts of the sector. Also, changes in education policy
create both challenges and opportunities for the sector. Increasing investment, encouraging
innovation and R&D together with global competition and meeting consumer/learner
demands also present challenges for the sector. Attracting talented individuals to the sector
and developing new skills, particularly in management, governance and leadership, together
with knowledge and skills in new technologies are important if the sector is to respond to the
medium-term challenges. Similarly, the sector will need to encourage new partnerships to
support the growing use and application of information and communication technology. The
Education sector is well placed to meet the challenges over the medium term as it has a
successful track record in adapting to change, but will need to continue to develop its well-
established training infrastructure to support new skills requirements.
Section 4 considers the implications of these various drivers of change for employment and
skills demand.
27
4. Employment and Skill Demand in the Sector
4.1 Introduction
The Education sector has a highly skilled and highly qualified workforce which is dominated
by people working in professional teaching and learning roles; this is unlikely to change over
the medium-term. This section emphasises the changing nature of employment in the sector
with respect to the changing composition of employment and skills over recent years.
Factors that affect skills demand in the sector, while not unique to education, have different
implications on the resulting demand for skills compared to other sectors. It will focus on the
changing demand for employment, factors affecting the demand for skill, changing patterns
of skill demand and replacement demands.
4.2 The Changing Demand for Employment
Although job losses are expected in the sector, employment levels are still forecast to grow,
but at a much slower rate than in recent years (see Wilson et al 2007). Job losses are
forecast in administrative, secretarial and clerical roles and elementary roles (see Chart 4.1
below), but with an increasing need for those in support roles and a high replacement
demand, employment levels will grow.
Teaching and research professionals as an occupational group have significant net
requirements and expansion demand between 2007 and 2017 (UK Commission 2010a,
2010b). This occupational group is considered a high growth occupation in a sector with
expanding employment. In terms of numbers, education assistants (483,000), secondary
education assistants (417,000) and primary and nursery teachers (401,000) are listed as
some of the 20 biggest occupations in England in 2009 (UK Commission, 2010b). The
educational assistants occupational group was reported to be one of the 20 fastest growing
occupations in England, with a 91 per change between 2001 and 2009 (UK Commission,
2010b). These professionals are considered essential to support key areas, such as STEM
subjects and research where innovations and activity need to be commercialised (UK
Commission, 2011). With an ageing workforce, teaching needs to be seen as an appealing
employment option.

28
Chart 4.1 Employment Structure of the Education Sector, 2010-2020
Source: Wilson and Homenidou (2011)
4.3 Factors Affecting the Demand for Skill
The National Strategic Skills Audit for England identified a number of key drivers that will
impact on the demand for skills in the future (UK Commission, 2010a). The principal drivers
of skill needs are: technical change; globalisation; policy and regulation; product market
strategies related to horizontal and vertical integration; the low-carbon agenda; and
demographic change. These drivers are interdependent and the dynamic interplay of these
means that the future skill requirements are not certain. These drivers of skills demands,
together with those drivers identified by the Life Long Learning UK Sector Skills Councils in
their Sector Skills Assessment in 2010 (see LLUK, 2011b), are discussed next.
Technical Change
The rapid pace of change in relation to new technology across all areas of the Education
sector, both in its organisation of work and delivery of services, has created the need to
develop new ICT and technical skills. Sector organisations have to ensure that equipment
and training keep abreast of these changes. Across the Education sector, there is an
increasing demand for e-learning and other types of learning and service delivery. These
delivery methods are focused on the implementation and exploitation of technology, in terms
3
50
7
8
2
21
1
2
7
2
56
7
5
1
23
0
2
4
0 20 40 60
Managers, directors and senior officials
Professional occupations
Associate professional and technical
Administrative and secretarial
Skilled trades occupations
Caring, leisure and other service
Sales and customer service
Process, plant and machine operatives
Elementary occupations
% of workforce
2020
2010

29
of new platforms, new delivery methods and new communication methods. For instance,
technology can create global education platforms to connect learners (LSIS, 2011d). Sector
organisations need to equip their workforce with higher-level technical skills.
Globalisation
The Education sector is increasingly operating in a global, competitive market where there is
increased supply of labour and skills, but also competition for highly qualified staff and
international students as more European countries are offering courses. The sector has to
attract high level, high quality teachers, trainers, managers and leaders, support staff, and
researchers. The capacity to recruit and retain staff, especially in those subject areas where
staff are in high demand is important. To be competitive in the global market, the Education
sector workforce requires management, leadership and strategic planning skills to manage
contracts and projects, staff, a range of learners. The LLUK Sector Skills Assessment
(2011b) noted the need for the sector workforce to development skills in marketing, PR and
advocacy to ensure that organisations remain competitive, reach wider markets and secure
new business. New skills related to innovation and entrepreneurship to ensure new business
development, particularly in global markets, are also required.
Policy and Regulation
A significant driver for skills is public policy reforms, regulation and legislation, which may be
cross-sector or sector specific, UK wide or nation specific. Policies implemented by each
nation’s Government in relation to skills and education have an important impact in
influencing skills needs and priorities across the Education sector within each nation,
particularly in relation to the curriculum, working with children and young people, quality and
regulation. In response, there are increasing demands for problem solving skills and
creativity to ensure the sector is able to keep pace with reforms. Skills needs relating to
policy analysis, especially amongst managers – for example, being able to understand the
shifting policy context and anticipate, plan for, and respond to the implications of the policy
changes for organisations, and also of increased importance.
Public sector cuts, funding constraints and the need to procure funding from other sources
are also significant drivers of skills demand. The sector has to ensure that the workforce has
the necessary skills to compete for funding sources, whether from the commercialisation of
intellectual property, to the recruitment of students (both EU and non-EU domiciled), to
seeking out new partnerships. There is greater emphasis on bid writing and negotiation skills

30
to enable organisations to compete for diminishing funding sources and negotiate to
maintain or extend their current funding streams, especially within the current economic
climate. Skills in efficient procurement and outsourcing to make the most effective and
efficient use of the funds available are also required. The LLUK Sector Skills Assessment
(2011b) reported increasing demands for skills related to budget planning and financial
management to ensure organisations cope with and adapt to more complex funding
procedures and streams.
Sustainability and Environmental Issues
Research within FE and HE institutions may need to develop skills to enable staff to
research and develop products given sustainability and environmental issues (LLUK,
2011b). National strategies related to environmental issues will also impact on skills
requirements and demand. For instance, ‘green’ policies regarding alternative energy
strategies, and developments in the low carbon industry may prompt research funding
towards climate change. The development of skills to enable research, innovation and
product development, such as training and awareness raising, will need to address
prominent issues, such as climate change and sustainability. The Skills for Growth report,
produced by BIS (2010) sets out plans in which FE institutions will be required to improve
and expand courses in areas where there is a demand for trained technicians, such as green
technologies.
Demographic Change
The UK population is forecast to increase to around 70 million by 2054 and the average age
of the population is rising. Demand for learning amongst older individuals is likely to increase
to meet the demands of those working longer and those wishing to learn for leisure. New
skills may be required to teach older learners. The ageing education workforce also presents
a need for succession planning where expertise, knowledge and skills will be lost through
those leaving the sector. There is also the challenge to continually develop older workers.
4.4 Changing Patterns of Skill Demand
Table 4.1 shows changing patterns of skill demand based on Working Futures 2010-2020
projections. Across all occupations in the Education sector, the net change in employment is
-1.5 per cent between 2010 and 2020, which equates to 39,000 less jobs. The highest
increase in absolute terms in employment is in the professional occupations (e.g. lecturers,
professors, primary and secondary school teachers, school inspectors, deputy head
31
teacher), which is consistent with the need for higher-level skills in management,
governance and leadership.
The shares of total education employment in only the Professional occupations and the
Caring, leisure and other service occupations (e.g. teaching assistants, education support
assistants) are expected to increase over the period 2010 to 2020, by 9.9 per cent and 5 per
cent respectively. While across all sectors the shares of total employment are expected to
increase in all occupations except Administrative and secretarial, Skilled trades occupations
and Process, plant and machine operatives. (see Table 4.1 below). The absolute change in
employment in the professional occupations in the Education sector is considerable at
135,000. The rise in professional occupations is consistent with the need for R&D and
innovation to generate income from other sources. An increasing range of support
professionals is also required for the Education sector to operate in the competitive labour
market and to secure income. Therefore, professionals with project and research
management, finance, marketing and business development skills are in high demand.
Expertise and skills in improving educational standards and managing student recruitment
are also sought. The increase is consistent with the drivers of skills demand and the key
challenges facing the sector discussed above.

32
Table 4.1 Changing Pattern of Skill Demand in the Education Sector, 2011
Education: 2010 2015 2020 2010 2015 2020 2010-
2020
Employment Growth Numbers (000s) % shares Change (000s)
Change (%)
All Sectors Change (%)
Managers, directors and senior officials 68 66 64 2.5 2.5 2.4 -3 -5.0 18.0
Professional occupations 1356 1405 1490 50.2 53.6 56.0 135 9.9 14.9
Associate professional and technical 196 184 183 7.3 7.0 6.9 -13 -6.6 14.0
Administrative and secretarial 214 170 135 7.9 6.5 5.1 -79 -37.0 -10.5
Skilled trades occupations 45 34 28 1.7 1.3 1.0 -17 -37.7 -6.5
Caring, leisure and other service 572 582 601 21.2 22.2 22.6 29 5.0 11.5
Sales and customer service 14 13 12 0.5 0.5 0.4 -3 -18.1 0.1
Process, plant and machine operatives 53 49 49 1.9 1.9 1.8 -4 -7.1 -10.9
Elementary occupations 185 122 101 6.8 4.6 3.8 -84 -45.4 3.2
All occupations 2703 2623 2663 100.0 100.0 100.0 -39 -1.5 5.1
Source: Wilson and Homenidou (2011)
The shares of total employment in Sales and customer service occupations (e.g.
telephonists, sales assistants), Process, plant and machine operatives (e.g. food and drink
operatives) and Managers, directors and senior officials (e.g. research directors, service
managers) are expected to decrease slightly between 2010 and 2020. The absolute
changes in employment in these occupations however, are small at between 3,000 and
4,000 jobs. The greatest absolute change is forecast in Elementary occupations (e.g.
cleaners, school midday and crossing patrol wardens) (-84,000 jobs) and Administrative and
secretarial occupations (e.g. school secretaries, librarians, receptionists) (-79,000) between
2010 and 2020.
The average level of qualification level held by the UK workforce is continually improving
with greater numbers studying at FE and HE institutions and more individuals obtaining
Level 4 and above qualifications (UK Commission, 2011). It is suggested that the current
economic climate and labour market conditions are encouraging participation in education,
but the medium to long term outcomes are changeable (See Beaven, May-Gillings, Wilson
and Bosworth, 2011; Dearden, Fitzsimons and Wyness, 2010).

33
In 2009, 33 per cent of the working age population had obtained a Level 4 or above
qualification, compared to 26 per cent in 2002 (UK Commission, 2011). Demand for these
qualifications across the UK labour market is growing.
The Education sector workforce is highly qualified and it is forecast to remain so in the
medium to long term. In 2010, 22 per cent of the Education sector workforce held a Level 7
or above qualification, which is forecast to significantly increase to 40 per cent in 2020 (see
Table 4.2 below). By 2020, it is estimated that nearly two thirds of the sector will be qualified
at QCF levels 5 -8 (i.e. broadly at an HE level). The numbers of those working in the sector
with no qualifications has decreased since 1990 and is forecast to decrease further between
2010 and 2020 (see Table 4.2).

34
Table 4.2 Changing Pattern of Skill Demand by Qualification
Column
percentages Education 1990 2000 2010 2020 QCF8 Doctorate 3.4 3.2 4.0 5.6 QCF7 Other higher degree 13.2 16.1 22.2 31.7 QCF6 First degree 18.9 20.4 21.1 21.5 QCF5 Foundation degree;Nursing;Teaching 15.1 12.3 8.2 4.7 QCF 5 – 8 50.6 51.9 55.5 63.5 QCF4 HE below degree level 4.1 3.3 3.6 3.8 QCF3 A level & equivalent 7.7 10.0 13.4 13.8 QCF 3 and 4 11.7 13.3 16.9 17.6 QCF2 GCSE(A-C) & equivalent 12.0 12.9 12.5 9.6 QCF1 GCSE(below grade C) & equivalent 14.0 13.1 10.7 7.4 No Qualification 11.6 8.8 4.4 1.8 Total 100.0 100.0 100.0 100.0 Whole Economy QCF8 Doctorate 1.1 0.7 1.1 1.8 QCF7 Other higher degree 3.6 4.0 7.5 11.8 QCF6 First degree 7.6 10.2 15.3 19.3 QCF5 Foundation degree;Nursing;Teaching 7.4 6.0 5.6 5.2 QCF 5 – 8 19.7 20.9 29.6 38.1 QCF4 HE below degree level 5.6 4.4 4.7 5.2 QCF3 A level & equivalent 19.6 19.4 19.3 16.7 QCF 3 and 4 25.1 23.8 24.0 21.9 QCF2 GCSE(A-C) & equivalent 21.4 21.5 20.8 19.5 QCF1 GCSE(below grade C) & equivalent 19.4 19.5 16.4 14.8 No Qualification 14.3 14.3 9.2 5.7 Total 100.0 100.0 100.0 100.0
Source: Wilson and Homenidou (2011)
4.5 Replacement Demands
Chart 4.2 shows the net change in employment by replacement demand and total
employment requirements for the Education sector and the whole UK economy. Whilst
across all sectors, there is a net decrease in employment forecast between 2010 and 2020
for administrative and secretarial occupations, skilled trades occupations and process, plant
and machine operatives, the same is true of administrative and secretarial occupations and
process, plant and machine operatives in education. Replacement demand (i.e. demand
necessary to replace existing employees leaving the sector due to retirement, death etc.) in
education is greatest in the professional occupations at more than 135,000 jobs, which is
also reflected in the UK economy as a whole where around 2 million individuals will be
required. The highest net change in demand is forecast for professional occupations in both
the UK economy as a whole and the Education sector.

35
Replacement demand and the age structure of the workforce in the Education sector are
interrelated. The sector has an older age profile, with many over the age of retirement
continuing to work. Meeting replacement demand is a concern as many of the skills held by
retiring workers are essential to the sector. So, communicating knowledge and skills is
essential to the sector.
The principal demand in the future will be to recruit high quality teachers often in subject
areas in which there is likely to be relatively high demand. Whilst educational institutions
now have some autonomy in their recruitment and the terms and conditions of employment
they are able to offer, they are, in many instances, constrained by rules of entry to the
teaching profession and nationally negotiated wage structures. An environment in which to
develop individual skills would appear to be an important incentive attracting teachers and
lecturers to particular institutions.
Chart 4.2 Replacement Demand, 2010-2020
Source: Wilson and Homenidou (2011)
-1000 0 1000 2000 3000 4000
Elementary occupations
Process, plant and machine operatives
Sales and customer service
Caring, leisure and other service
Skilled trades occupations
Administrative and secretarial
Associate professional and technical
Professional occupations
Managers, directors and senior officials
Whole economy
Net Change Replacement Demand Total Requirement
[thousands]-200 0 200 400 600 800
Elementary occupations
Process, plant and machine operatives
Sales and customer service
Caring, leisure and other service
Skilled trades occupations
Administrative and secretarial
Associate professional and technical
Professional occupations
Managers, directors and senior officials
Education
Net Change Replacement Demand Total Requirement[thousands]

36
4.6 Conclusion
The key drivers of change in education have a variety of implications for employment and
skills demand in the sector. Changes in the employment structure and an ageing will mean
there are significant replacement and skills demands. Technical change, globalisation and
competitiveness, developments in policy and regulation, together with sustainability and
environmental issues have implications for skills demand. The Education sector has to be
adept at responding to the demands of the labour market and retaining a workforce with
managerial, leadership and technical skills to meet policy reforms, new funding regimes and
legislation. Learner demands, such as new ways of delivering courses, and demographic
change are also shaping skills required by the workforce.
Future skills are likely to be much the same as current skill needs (LSIS, 2012). The critical
issue is that learning providers at all levels keep updated in their specific fields of knowledge.
These relate to:
• subject knowledge;
• pedagogical skills development;
• IT skills;
• thinking and creative skills;
• management and leadership;
• customer service and community engagement skills;
• fundraising skills;
• low carbon knowledge;
• technological skills.

37
5. Skills Supply
5.1 The Supply Infrastructure
Skills supply is dependent upon the supply of labour, the skills infrastructure (including
compulsory education, FE and HE), and employers’ investment in skills. A sufficient supply
of skills is required to increase productivity and to meet future demand for skills thus
encouraging growth in the Education sector, but also in the labour market that it supports.
Indicators show that the supply of skills matches demand where labour markets have a
supply of well-educated workers (OECD, 2011). Shifts in demand, however, created by
technological changes and the economic downturn, can change rapidly and a well-qualified
workforce does not mean that the demand for skills will be met. So, training and
development plays a vital role in ensuring that the supply of skills matches demand.
Various bodies oversee training and development in the Education sector:
• Learning and Skills Improvement Service (LSIS) is the sector-owned body that aims
to drive for excellence in the learning and skills sector, building the sector’s own
capacity to design, commission and deliver improvement and strategic change;
• Teaching and Development Agency for Schools (TDA) is the national agency and recognised sector body responsible for training and development of the school workforce;
• Association of Colleges (AoC) represents Colleges and provides professional support
services for the workforce;
• Association of Learning Providers (AELP) is a national organisation representing
independent learning providers who engage in government-funded skills training and
employability programmes throughout England;
• General Teaching Council for England (GCT) is the professional body for teaching in
England;
• General Teaching Council for Wales (GTCW) is the statutory self-regulating
professional body for the teaching profession in Wales;
• General Teaching Council for Scotland (GTCS) is the independent professional body
for the teaching profession in Scotland;

38
• General Teaching Council for Northern Ireland (GTCNI) is the statutory, independent
body for the teaching profession dedicated to promoting the highest standards of
professional conduct and practice in Northern Ireland;
• Higher Education Funding Council for England (HEFCE) promotes and distributes
public money for teaching and research to universities and colleges, plus ensures
accountability and promotes good practice;
• National College for School Leadership works to develop leaders in schools and
academies, early years settings plus children’s services;
• Teach First is a charity that recruits and trains high achieving graduates to become
teachers in disadvantaged and challenging schools;
• Teacher Support Network is a group of independent charities that provides practical
support to staff in the Education sector; and
• Teacher Training and Education in Wales represents those working in primary and
secondary teacher training in Wales.
The Education sector in each of the devolved administrations has a substantial training
infrastructure, which provides both initial and continuing training and professional
development for the education workforce. Many teachers have a statutory obligation to
undertake a number of hours of professional development and training each year. The
sector challenge is not so much persuading employers to train more, but to train more
efficiently by targeting skills gaps, and to keep training given pressures on training budgets.
Chapter 6 provides more details of how organisations have used specific initiatives to
respond to overcome skill deficiencies.
5.2 Trends in Skill Supply: Individuals
Table 5.1 indicates the number of employees in receipt of work-related training over the past
13 weeks. The proportion of the education workforce in receipt of such training (38 per cent)
is considerably higher than the proportion across the whole economy (26 per cent) (See
Table 5.1, below). The percentage of workers aged 25 years and under that has received
work-related training is also greater (41 per cent) than across all sectors (30 per cent). By
major occupational group, the Education sector provides more training to workers across all
occupations than is the case across the whole economy, with the exception of elementary

39
occupations, for which similar proportions have received training in the last 13 weeks.
Similar proportions of men and women working in the sector received training over the past
13 weeks.
Table 5.1 Number of Employees in Receipt of Work-Related Training over the Past 13 Weeks, 2010
Education
Whole Economy
Occupations (SOC Major Groups) Number % of workforce Number % of
workforce
1 Managers and senior officials 43,095 35.3 1,008,425 22.6
2 Professional 655,364 44.8 1,588,563 39.5
3 Associate professional and technical 106,308 38.2 1,505,022 35.3
4 Administrative and secretarial 57,997 25.7 670,009 21.1
5 Skilled trades 9,976 23.4 476,943 15.6
6 Personal service 255,995 39.4 927,704 36.5
7 Sales and customer service 1,875 27.2 416,531 19.4
8 Process, plant and machine operatives 7,613 16.4 288,954 15.2
9 Elementary 36,212 14.5 470,477 14.5
All 1,174,434 38.1 7,352,628 25.5
Women 861,175 38.67 3,868,241 28.86
Men 313,259 36.48 3,484,387 22.59
People aged under 25 85,935 41.20 1,091,698 29.46
Source: Labour Force Survey 2010 (average of four quarters)
The Education sector is starting to take advantage of Apprenticeships, which could
prove vital to developing skilled workers in the future through combining off-the-job
training and practical on-the-job experience. There are a variety of support roles that are
specific to the Education sector, including: Teaching Assistants; business development and
support managers; laboratory technicians; together with a variety of general support
activities associated with managing and maintaining, often large-scale, campuses. They
have their own skill challenges and business needs. Some of these staff are supported
through the teacher training infrastructure, but there is also, potentially, a role for
programmes such as Apprenticeship to contribute to the training of these groups (e.g.
learning and development trainers, laboratory technicians and teaching assistants).
Chart 5.1 (below) shows Apprenticeship starts and achievements between 2002/03 and
2010/11 in the education and training sector. Since 2004/05, there have been small numbers

40
starting Apprenticeships in education and training, but this significantly increased from 330 in
2007/08 to 1,160 in 2008/09. The highest number of starts was 4,010 in 2010/11.
Apprenticeship achievements in education have steadily increased as the number of starts
has increased.
Chart 5.1 Apprenticeship Programme Starts and Achievements by Sector Subject Area – Education and Training, 2002/03-2010/11
Source: Data Service (2012) Notes: Where no data are shown figures are below 5.
In the education and training sector, Apprenticeships in Supporting Teaching and Learning
in Schools are available at intermediate and advanced level. Apprenticeships in other
sectors are also relevant to the Education sector, including the Learning and Development
apprenticeship and the Laboratory Technician apprenticeship. Chart 5.2 (below) shows
Apprenticeship starts and achievements for Teaching Assistants between 2002/03 and
2010/11. A similar picture is shown with numbers small, but increasing since 2003/04. A
significant increase in the number of starts is recorded in 2010/11. Apprenticeship
achievements for Teaching Assistants have steadily increased.
0
500
1,000
1,500
2,000
2,500
3,000
3,500
4,000
4,500
2002/03 2003/04 2004/05 2005/06 2006/07 2007/08 2008/09 2009/10 2010/11
Starts Achievements

41
Chart 5.2 Apprenticeship Programme Starts and Achievements by Sector Framework – Teaching Assistants, 2002/03-2010/11
Source: Data Service (2012) Notes: Where no data are shown figures are below 5.
Chart 5.3 (below) shows Apprenticeship starts and achievements for Learning and
Development Apprenticeships. Data show that overall the number of starts has been
increasing, peaking in 2008/09, and the number of achievements has increased to 2009/10.
Numbers for Apprenticeship starts and achievements for Laboratory Technicians have
remained small since 2002/03, peaking in 2010/11 to 160 starts. In the Education sector,
apprenticeships are not fully exploited to develop skilled workers and meet future
demands for skilled Support staff.
0
500
1,000
1,500
2,000
2,500
3,000
3,500
4,000
4,500
2002/03 2003/04 2004/05 2005/06 2006/07 2007/08 2008/09 2009/10 2010/11
Starts Achievements

42
Chart 5.3: Apprenticeship Programme Starts and Achievements by Sector Framework – Learning and Development (direct training and support), 2002/03-2010/11
Source: Data Service (2012) Notes: Where no data are shown figures are below 5.
5.3 Employer Investment in Skills
The Education sector invests heavily in its workforce, compared to the economy as a whole;
86 per cent of employers reported that they were providing training to their employees, while
only 59 per cent of employers across all sectors provided training (Davies et al., 2012).
There are strict entry requirements to the teaching profession at every level. Growth through
skills is dependent upon people possessing the minimum entry requirements when
graduating from university. The Education sector has limited room for manoeuvre in this
regard, but there are enormous skill replenishment needs once people are in the sector in
relation to curriculum changes, plus advances in technology and knowledge. Overall 86 per
cent of employers in the sector had provided training, much higher than the all sector
average of 59 per cent. The UK Commission’s Employers Skills Survey 2011 reported that
over the last 12 months, 66 per cent of employers in the Education sector have provided
both on and off-the-job training, compared to 29 per cent in the whole economy. Employers
in the Education sector were more likely to provide job-specific training, health and
safety/first aid training and induction training.
0
20
40
60
80
100
120
140
2002/03 2003/04 2004/05 2005/06 2006/07 2007/08 2008/09 2009/10 2010/11
Starts Achievements

43
Where employers train they also tend to train a higher share of the workforce (69 per cent on
average compared with 46 per cent in the economy overall. That said, the average number
of days of training per trainee was 6.6 days in the Education sector, slightly less than the 8.9
days, across all sectors (see Table 5.2 below).
Table 5.2 Employer Investments in training
Education Whole economy
% of employers training 86 59
% of workforce receiving training
69 46
% average number of training days per trainee
6.6 8.9
Average expenditure on training per trainee
£4,075 £3,275
Average expenditure on training per employee
£2,325 £1,775
Source: (Davies et al. 2012), Base: All trainers completing the Investment in Training Survey 11,117 unweighted.
The data in Table 5.2 also indicate that the amount spent by employers in the sector is
relatively high compared with the situation in the economy generally: £4,075 spent by
employers in the sector on average per trainee compared with £3,274 in the whole economy.
With respect to the recruitment of young people into the sector there is not much difference
with respect to patterns in the economy as a whole. Where there is a substantial difference
is with respect to taking on recent graduates from HE: 25 per cent of employers in the
sector had done so compared with seven per cent in the economy as a whole. A large share
of this will be the recruitment of new teachers, trainers, and lecturers.

44
Table 5.3 Recruitment of young people
Employers who have recruited young people
Education (%)
Whole economy (England, Wales and
Northern Ireland) (%)
16 year olds recruited to first job from school
4 4
17 or 18 year olds recruited to first job from school
7 5
17 or 18 year olds recruited to first job from FE College
8 5
Recruited to their first job from University or other Higher Education institution
25 7
Source: (Davies et al., 2012), Base: All establishments 85,069 unweighted (not asked in Scotland)
Mention was made above to the increase in the number of apprentices in the sector over
recent years. Table 5.4 shows that employers in the sector are now nearly twice as likely to
report having apprentices than in the economy generally.
Table 5.4 Recruitment of apprentices
All Employers (%)
Education Employers
(%)
Currently have staff undertaking Apprenticeships 5% 9% Currently offer but have no staff on Apprenticeships 4% 10% Plan to offer Apprenticeships in future 8% 7%
Source: Shury et al, (2011) Base: All establishments 14,390 unweighted
In the summary indicators provided in Table 5.5 show that training in the sector tends to be
formally structured with relatively high shares of employers in the sector having a formal
business plan, training plan and training budget. The data also shows that staff in the sector
are more likely to have annual reviews with 73 per cent of education establishments
reporting that all staff are reviewed compared with 47 per cent in the economy generally.

45
Table 5.5 Other Indicators of Training Activity
UK Education
% all establishments with business plan 61% 85% % all establishments with training plan 38% 65% % all establishments with training budget 29% 67% Annual review of staff (all establishments)
All staff reviewed 47% 73% No staff reviewed 43% 11% Provide training (all establishments) 59% 86%
Train towards qualification (all employers providing training)
43% 64% Training to Level 2 qualification 14% 20% Training to Level 3 qualification 16% 34% Training to Level 4 qualification 12% 33% Assess training delivered 65% 78% % of employees trained towards a qualification in last 12 months 12% 12%
Source: (Davies et al., 2012), Base: All Establishments 87,572 unweighted; Where the base is all establishments providing
training, this is 66,916 unweighted establishments
Table 5.5 also shows that training, where provided by the employer, is much more likely to
lead to a qualification at any NQF level, and more likely that training is formally assessed.
The statistics above give an overview of the level of training and skills development activity
undertaken by employers, but insights can also be obtained from looking at specific
examples of employers training activities and the value they place in what they provide. For
example, many universities and FE colleges have well-developed training programmes for
their staff and offer a range of postgraduate qualifications for those wishing to combine their
work and training. Government training initiatives, despite high organisational awareness,
are inconsistently embedded (LLUK, 2011a). For instance, approximately 28 per cent of
employers in the sector had achieved Investors in People status and 10 per cent of
organisations held an ISO9000 Standard (Davies et al., 2012),
5.4 Skills Utilisation
Sometimes within organisations there are untapped sources of skill supply. Employees may
have a wide variety of skills which are not deployed in the workplace for one reason or
another. The evidence suggests that in the economy generally around 49 per cent of
46
establishments have employees whose qualifications and skill levels are in advance of those
required to do their jobs. This compares with 54 per cent in the Education sector indicating
that the sector has a relatively large store of extant skills which are not being fully utilised
(Davies et al., 2012). A critical issue here is how to unlock those skills for the benefit of the
workplace.
Investors in People – which is addressed in Chapter 6 – is a specific programme which looks
to effectively deploy skills in the workplace, but there are a range of measures employers
can take themselves to achieve this end. One such is having in place those measures which
allow employees with high potential or particular talents to be identified and nurtured. The
evidence suggests that in education 66 per cent of education employers have processes in
place which allow them to do this, which is much higher than in the economy generally (45
per cent). In general, where there are processes in place they are just as likely to be formal
(32 per cent of establishments reported formal processes) as informal (34 per cent) (Davies
et al., 2012).
High performance work practices (HPW) more generally – defined with respect to the
deployment, harnessing and deploying people’s abilities in order to optimise organisational
performance – are of central importance to the sector). Implementing HPW is seen a
reflection of good strategic management. It has been noted that managers in the Education
sector are relatively well qualified compared with the economy as a whole, with over 90 per
cent qualified at Level 4 and above compared with 61 per cent in the economy as a whole
(LSIS, 2012).
5.5 Employer use of, and satisfaction with, the external training infrastructure
If it is possible to increase the demand for skills and training within education then there is a
need to ensure that training suppliers are in place to meet that demand. In education there
is a tradition of on-going professional development and training being supplied to those
working in the professions of teaching, training, and lecturing. This is reflected in the extent
to which employers in the sector engage with learning institutions of various types. For
example, employers in the Education sector are relatively more likely to engage with: private
training providers (64 per cent in the Education sector had done so versus 54 per cent
across all sectors); FE colleges (42 per cent versus 23 per cent); third sector trainers (32 per
cent versus 19 per cent), and HE institutions (37 per cent versus 13 per cent). Overall, only
15 per cent of employers in the sector reported having no engagement with these types of

47
learning providers compared with 29 per cent across all sectors. This is further evidence of
the extent to which the Education sector is one which is relatively heavily involved in training
and learning of its employees. There overall satisfaction with the use of FE colleges – 7.5
out of 10 where a high score indicates relative satisfaction – is not much different from the
overall average of 7.4 for all employers (Shury et al, 2011).
5.4 Migration
The evidence suggests that relative to other sectors, education has not been heavily
dependent upon migrant labour (defined with reference to non-UK born employees). The
same is true if the situation is observed for teaching professions, with increase in the share
being relatively modest in the period 2002-2008 (Migration Advisory Committee Secretariat,
2010). Where the situation differs is with respect to research professionals where the share
of non-UK born professionals is relatively high compared with other sectors. This may be
due to the competition between, for instance, HE institutions across the world, to attract the
best researchers.
In terms of occupational roles that are in short supply the UK Border Agency (2011) Tier 2
Skills Shortage list cites Secondary education teaching professionals and Special needs
education teaching professionals as being in demand.
5.5 Conclusion
The evidence demonstrates that the Education sector has a well-developed training
infrastructure, which is supported by well-established, nationally recognised training bodies.
The Education sector has an established track record of providing both initial and continuing
training and professional development activities. Employer investment in skills is greater in
the sector than across the whole economy and given the evidence this is likely to remain so.
The sector provides more training to workers across the sector than the whole economy.
The system of training for teachers to meet their statutory requirements for professional
development is provided alongside a range of training initiatives for all levels of staff
employed in the sector. The percentage of employers offering training to the workforce is
high. The role of Apprenticeships and Investors in People is only part of this training story.
The number of Apprentices in the sector is increasing, but this together with Investors in
People, have even greater potential in supporting skills growth in the sector.

48
The case study examples provided in this chapter illustrate the way in which education
establishments can make use of various national programmes to train and support new
employees, as well as develop the skills of their existing employees.
The next section will focus on the defining and outlining skills mismatches and skills
deficiencies in the sector.

49
6. Skill Mismatches
6.1 Defining Skill Mismatches
Previous evidence has demonstrated that mismatches between the demand for, and supply
of skills, can be damaging for organisational performance (Wilson et al, 2003). The
Employer Skill Surveys for each nation have consistently demonstrated that gaps result in,
amongst other things, delays to the development of new products and services, work being
turned down, difficulties meeting customer service standards, etc. (Davies et al, 2012).To
some extent, skill mismatches will result from ongoing processes of new developments in
the subjects which are taught and the introduction of new teaching methods, as well as
changes which periodically take place in the organisation of the education system and the
management of education institutions.
As there is no direct measure of mismatches between the demand for, and supply of, skills,
at the sectoral level, inferences about the balance between the two are typically made
through various means given that each measure provides only partial information. The
common methods of gauging the level of mismatch are outlined below.
i. Observing trends in wages is a common method of measuring skills mismatches.
This assumes that employers respond to difficulties finding the skills they need by
increasing wages. In reality, not all employers respond in this way to an excess
demand for skills. Regulation regarding pay, collective bargaining, and job-related
risk factors will also affect wage rates, and non-wage incentives, including training,
may be offered to potential employees to attract them to an organisation. There is
also a more general question about the extent to which wage levels are responsive to
the market. Evidence suggests that nominal wage rates are relatively more
responsive in the UK than elsewhere, but this might be little more than a reflection of
the demand for overtime.
ii. Estimating the rate of return to obtaining sector related qualifications provides a
further indication of the extent to which a premium is attached to obtaining the skills
deployed in a given sector. Qualifications, however, are an imperfect measure of
skills and the rate of return to obtaining a given qualification, and given that the
measure of return is based on wages, all of the caveats which relate to this apply as a
measure of skills mismatch.

50
iii. Employer reports of skill mismatches in the form of hard-to-fill vacancies (HtFVs)
and skill-shortage vacancies (SSVs) which provide an indication of the difficulties
employers have in recruiting people from the external labour market with the skills and
attributes they require. Surveys also capture information about problems employers
experience with the skills of existing staff with respect to the extent they lack full
proficiency in their jobs (i.e. skill gaps).
Each of these is now considered in turn with respect to the education sector.
6.2 Evidence of Relative Wage Growth
Table 6.1 provided evidence about weekly wage levels in education compared with the
economy overall. The evidence reveals that the median and mean salaries of employees in
education are generally higher than in the economy overall, and have been increasing more
rapidly but not across all sub-sectors. Whereas wage levels in primary education had been
increasing in 2010 compared to one year ago, wages in pre-primary and other education had
been falling. It should be noted that large parts of the sector are subject to collective
bargaining. Whilst this does not preclude wage levels being responsive to market signals
about the relative demand for, and supply of, people to work in the Education sector, and
one would expect this to be reflected in bargaining, it may also result in a range of other
factors being related to wage developments.
Table 6.1 Gross Weekly Wage Levels
Description SIC Code Median
Annual percentage
change Mean
Annual percentage
change
ALL EMPLOYEES 403.8 1.7 487.6 1.4 All Industries and Services 403.9 1.7 487.7 1.4 EDUCATION 400.9 2.9 444.1 2.2 Education 85 400.9 2.9 444.1 2.2 Pre-primary education 851 222.8 -1.6 248.8 -2.1 Primary education 852 376.0 3.6 419.3 3.2 Secondary education 853 421.7 1.6 459.8 2.3 Higher education 854 531.1 1.0 565.0 -0.8 Other education 855 373.4 -2.5 433.6 -7.1 Educational support activities 856 512.5 * 504.8 4.1 Source: ASHE 2010 * The annual percentage change for educational support services is not reported in ASHE 2010

51
With respect to Level 4/5 qualifications, the evidence on sectoral wage rates is more difficult
to identify. It is possible to look at the types of degree which the Education sector requires.
If one looks at the evidence from the Class of ’99 – a longitudinal survey of people who
entered HE in 1999 – it reveals that graduates in education fared relatively well during their
early period in the labour market (Purcell et al., 2005):
i. they were amongst the group of graduates most likely to be employed in a job requiring
a degree (only people who studied medicine were more likely to be in a graduate job);
ii. their wage levels were around the average for all graduates;
iii. they reported relatively high levels of job quality (as reflected in their salary level,
undertaking interesting and challenging work, long-term job security, and working in
progressive and dynamic organisations).
While there have been some negative implications of the recession (see chapter 3), on a
more positive note, there has been an increasing the number of people interested in
teaching as a profession – as a consequence of more limited opportunities in the private
sector - .which will increase supply, whilst the implications of the Comprehensive Spending
Review may well place downward pressures on wage growth.
Previous evidence has demonstrated that mismatches between the demand for, and supply
of skills, can be damaging for organisational performance (Payne, 2008; Meager, 2009;
Wilson and Hogarth, 2003). To some extent, skill mismatches will result from on-going
processes of technical and organisational changes within businesses, and shifts in the
pattern of demand in external markets. To some extent, these will be transitional
mismatches as the demand side begins to articulate fully its skill requirements (such as
requirements for more teaching assistants and STEM teachers) and the supply side
responds accordingly. But, there are also likely to be structural mismatches where the
demand for, and supply of, skills remain misaligned despite the market signalling what skills
are required. The Education sector is one that has experienced relatively low levels of skill
mismatch over recent years, but due to policy reforms, changes in the curriculum and rapid
advancing technology, sector demands for specific skills are high. Across the Education
sector, there are major requirements for science, technology, engineering and mathematics
educators. There is also an emerging need for multi-disciplinary teachers and researchers
across scientific, technical and business areas, (UK Commission, 2010b). Across the whole
economy, there is higher demand for STEM skills, so there is greater competition for talent.
The National Skills Audit reported that one of the fastest growing occupations is Teaching

52
Assistants (UK Commission, 2010b). New skills in the sector are of high economic
significance, so deficits are significant.
As there is no direct measure of mismatches between the demand for, and supply of, skills,
at the sectoral level inferences about the balance between the two are typically made
through various means given that each measure provides only partial information. The
common methods of gauging the level of mismatch are: observing trends in wages, which
assumes that employers respond to difficulties finding the skills they need by increasing
wages; estimating the rate of return to obtaining sector related qualifications provides a
further indication of the extent to which a premium is attached to obtaining the skills
deployed in a given sector; employer reports of skill mismatches in the form of persistent
vacancies and skill-shortages, which provide an indication of the difficulties employers have
in recruiting people from the external labour market with the skills and attributes they require.
6.2 Evidence of Employer Reported Skill Deficiencies
The UK Commission’s Employers Skills Survey (2011) (Davies et al., 2012) provides an
opportunity to gauge the current state of recruitment problems at a time when demand in the
Education sector is high in specific areas. The evidence suggests that the recession has
impacted on the sector and growth in employment levels have slowed. Table 6.1a and 6.1b
below, details the vacancies, hard-to-fill vacancies, skills shortage vacancies and the skills
gaps for the Education sector compared to the whole economy.
The general evidence from Tables 6.1a and 6.1b in relation to recruitment problems is that a
relatively high share of establishments in the sector are likely to report having had
vacancies, but the overall number of vacancies per 1000 employees is relatively low, as is
the incidence of skill shortage vacancies. Overall hard-to-fill vacancies (HTFVs) and skill-
shortage vacancies (SSVs) form a lower overall share of vacancies than in the economy
generally suggesting that the sector does not encounter the same level of skill related
recruitment problems as found in the economy as a whole.
In relation to skills gaps (the extent to which employers regard their workforce as being fully
proficient at their existing job), the level of skills gaps in education (37.4 per 1,000
employees) is significantly lower than in the economy (54.1 per 1,000 employees) more
generally (see Table 6.2a below).

53
Table 6.1a Incidence of Skill Deficiencies
Whole Economy Education
Vacancies (total) 635,900 34,684 Vacancies / 1,000 employees 23.1 13.7 % of establishments with at least one vacancy
12% 22%
HtFVs (total) 143,550 4,984 % of establishments with at least one HTFV
4% 5%
SSVs (total) 103,453 3,729 SSVs / 1,000 employees 3.8 1.5 % of establishment with at least one SSV
3% 4%
Skill gaps 1,489,500 94,884 Skill gaps / 1,000 employees 54.1 37.4 % of establishments reporting any skill gaps
13% 19%
Source: (Davies et al., 2012) Base: Vacancies as a % of employees based on all employment (N=87,572 establishments
unweighted). Hard-to-fill vacancies as a % of vacancies based on all vacancies (N=17,166 establishments unweighted) SSVs as a % of vacancies based on all vacancies (N=17,166 establishments unweighted) Skills gaps as a % of employees based on all employment (N=87,572 establishments unweighted)
Notes: Numbers rounded to nearest 50
Table 6.2b Density of Skill Deficiences
Whole Economy Education
Vacancies as a proportion of employees
2% 1%
HTF vacancies as a % of vacancies 23% 14%
SSV as % of all vacancies 16% 9%
Skills gaps as a % of all employees 5% 4%
Source: (Davies et al., 2012). Base: Vacancies as a % of employees based on all employment (N=87,572 establishments
unweighted). Hard-to-fill vacancies as a % of vacancies based on all vacancies (N=17,166 establishments unweighted) SSVs as a % of vacancies based on all vacancies (N=17,166 establishments unweighted) Skills gaps as a % of employees based on all employment (N=87,572 establishments unweighted)
Notes: Numbers rounded to nearest 50

54
The most common skills gaps identified by the LLUK Sector Skills Assessment (2011b),
included: technical; practical and job-specific skills; management skills; customer service
skills; general IT user skills; and team working. Within Further Education colleges, it was
emphasised that some teachers who had been in post for a considerable time could lack the
skills derived from more recent vocational experience. It was also emphasised that some
teachers were slower to embrace e-learning technology. Within Higher Education, job-
specific skills gaps were reported in relation to contextual knowledge about public policy and
an understanding of how private sector businesses operate.
Skills deficiencies are not regarded as having a major impact on the sector (LSIS, 2011a,
LSIS 2012). Population growth will ensure that there is an increased demand for Education
services and thereby a strong demand for highly qualified and skilled workers to work in the
sector. Potentially, this should make the sector an attractive and stable employment option
at a time when there is considerable uncertainty attached to the employment prospects in
some other sectors.
6.4 Occupational Distribution of Skills Shortages and Gaps
Overall, where employers report skill shortages these are much more likely to be in
associate professionals, professionals and skilled trades occupations for the economy as a
whole (see Chart 6.1 below). In the Education sector, skill shortages are reported for two
critically important occupations for the sector, associate professional and technical, and
professional. The latter comprises the largest occupational share of the workforce (44.8 per
cent) and associate professional occupations the third largest (38.2 per cent). Reported skill
shortage vacancies for associate professional occupations in the Education sector are
comparable to those reported for the economy as a whole, but skill shortage vacancies for
professional occupations are more than twice that reported for the economy as a whole.
Whereas for skilled trade occupations, eight per cent are reported in the Education sector
compared with 17 per cent for the whole economy.

55
Chart 6.1 Occupational Distribution of Skill shortages, 2011
5%
20%
22%
7%
17%
9%
7%
5%
7%
2%
0%
47%
23%
6%
8%
12%
2%
0%
1%
1%
0% 20% 40% 60%
Managers
Professionals
Associate professionals
Administrative/clerical staf f
Skilled trades occupations
Caring, leisure and other services staf f
Sales and customer services staf f
Machine operatives
Elementary staf f
Unclassif ied staf f
% of all SSVs
EducationAll sectors
Source: (Davies et al., 2012). Base: All Skills Shortage vacancies. Unclassified staff refers to survey responses that were uncategorised.
Chart 6.2 below, shows the occupational distribution of skills gaps in the Education sector
compared to the economy as a whole. High skills gaps, compared with those for the
economy as a whole, are reported in professional occupations (29 per cent),
administrative/clerical staff (18 per cent) and caring, leisure and services staff (14 per cent).
Reported skills gaps in managers and associate professional occupations are also slightly
higher in the Education sector, compared with the economy as a whole.

56
Chart 6.2 Occupational Distribution of Skills Gaps, 2011
11%
9%
6%
11%
7%
8%
19%
8%
20%
12%
29%
11%
18%
1%
14%
3%
1%
11%
0% 10% 20% 30% 40%
Managers
Professionals
Associate professionals
Administrative/clericalstaff
Skilled trades occupations
Caring, leisure and otherservices staff
Sales and customerservices staff
Machine operatives
Elementary staff
% of all skill gaps
EducationAll sectors
Source: (Davies et al., 2012). Base: All Skills Gaps
This is interesting as the evidence indicates that amongst higher level occupations
employees are more likely to be qualified to the typical standard expected at that level (UK
Commission, 2010b). For instance, less than 20 per cent of managers and professionals are
without the minimum Level 4 or above qualification. Only around five per cent of associate
professionals are without the minimum Level 3 or above qualification. Employers in the
Education sector reported that 54 per cent of their workforce was underemployed, compared
with 49 per cent in the whole economy (Davies et al., 2012). An estimated 5 per cent of staff
were reported to be not fully proficient.
6.5 Causes, Impacts and Remedies
The Employers Skills Survey 2011 (Davies et al., 2012) provides a wealth of information
about the causes and implications of skill shortages and skills gaps. In general, the cause of
skill shortages in the Education sector was reported as being a shortage of applicants with
planning and organisational skills, written communication skills, oral communication skills,
customer handling skills and strategic management skills. To aid the development of

57
employees, employers in the Education sector were most likely to supervise or provide
opportunities for staff to observe others.
In relation to skills gaps, these were seen to result from staff being only partially trained or
being new to their role. Where employers had skills gaps just over half of them reported that
it had a minor impact on their performance. The majority reported that skills gaps resulted in
increased workload for other staff and difficulties in implementing new working practices. In
response, 84 per cent of employers reported that they had taken steps to improve
proficiency and skills of their workforce. In order to offset this they were currently, or planning
to introduce, more training, more supervision, and more mentoring of staff.
The Education sector reported that the impact of skill shortages and gaps can be adverse
(LLUK, 2011b), contributing to, for instance:
• lower productivity and lack of efficiency;
• inability of organisations to react to new opportunities and expand the business;
• lack of competitiveness, which can result in loss of market share; increased workload
for existing staff;
• increased workload for existing staff; and
• organisations being unable to respond to change and meet the demands of
customers/learners.
Within FE and HE, a shortage of educators may mean that it is not possible to deliver the
range of courses demanded. Within Wales, if there is a shortage of staff with language skills,
it means the organisation is unable to provide the service required within bi-lingual or Welsh
speaking areas. In the current climate, the delivery of services by organisations that are
unable to obtain funding because they lack the necessary bid-writing and negotiation skills
may be compromised. Within Higher Education, skill shortages and gaps can have an
impact upon the Research Excellence Framework (REF) and league tables.
In order to avoid skills shortages and skills gaps, employers need to put in place policies,
which will ensure that they are able to recruit the employees with the skills and attributes
they require. In many ways this relates to providing: an attractive employment offer to would-
be recruits; better remuneration, career development and progression; together with support
for existing employees to further develop their skills. Potentially, the combination of
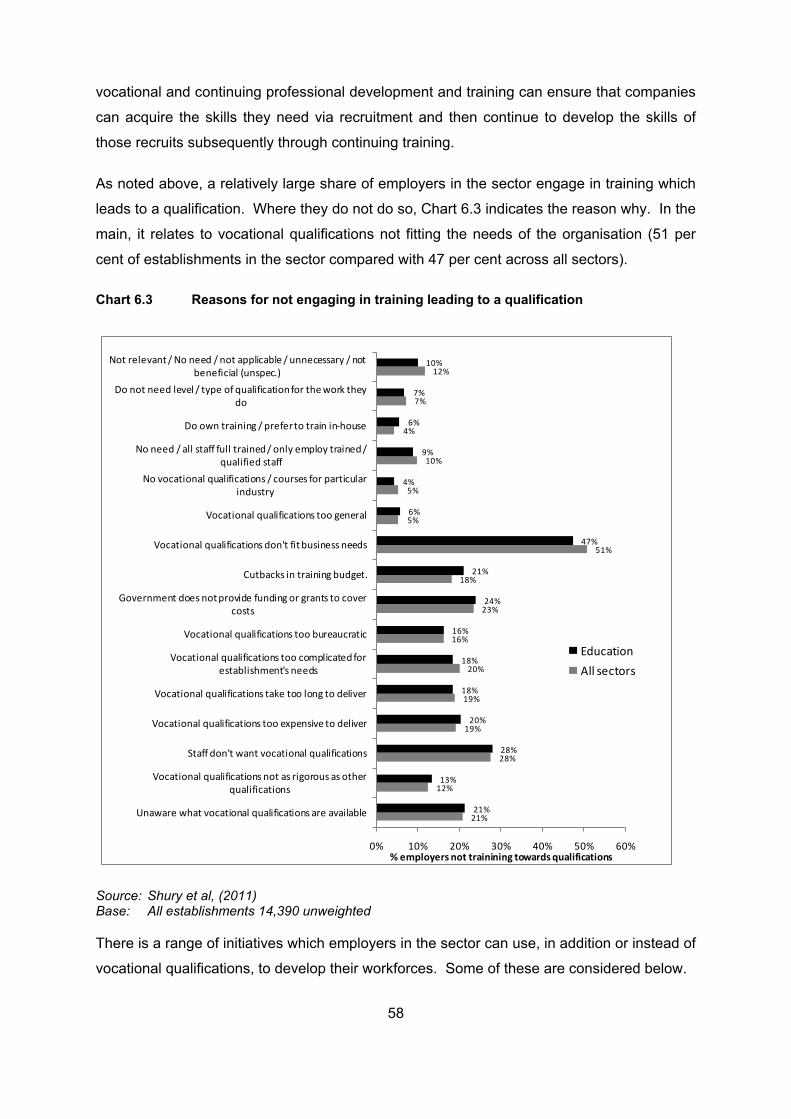
58
vocational and continuing professional development and training can ensure that companies
can acquire the skills they need via recruitment and then continue to develop the skills of
those recruits subsequently through continuing training.
As noted above, a relatively large share of employers in the sector engage in training which
leads to a qualification. Where they do not do so, Chart 6.3 indicates the reason why. In the
main, it relates to vocational qualifications not fitting the needs of the organisation (51 per
cent of establishments in the sector compared with 47 per cent across all sectors).
Chart 6.3 Reasons for not engaging in training leading to a qualification
21%
12%
28%
19%
19%
20%
16%
23%
18%
51%
5%
5%
10%
4%
7%
12%
21%
13%
28%
20%
18%
18%
16%
24%
21%
47%
6%
4%
9%
6%
7%
10%
0% 10% 20% 30% 40% 50% 60%
Unaware what vocational qualifications are available
Vocational qualifications not as rigorous as other qualifications
Staff don't want vocational qualifications
Vocational qualifications too expensive to deliver
Vocational qualifications take too long to deliver
Vocational qualifications too complicated for establishment's needs
Vocational qualifications too bureaucratic
Government does not provide funding or grants to cover costs
Cutbacks in training budget.
Vocational qualifications don't fit business needs
Vocational qualifications too general
No vocational qualifications / courses for particular industry
No need / all staff full trained / only employ trained / qualified staff
Do own training / prefer to train in-house
Do not need level / type of qualification for the work they do
Not relevant / No need / not applicable / unnecessary / not beneficial (unspec.)
% employers not trainining towards qualifications
EducationAll sectors
Source: Shury et al, (2011) Base: All establishments 14,390 unweighted
There is a range of initiatives which employers in the sector can use, in addition or instead of
vocational qualifications, to develop their workforces. Some of these are considered below.

59
Investors in People
Investors in People (IIP) has a potential role to play in providing a framework within which
training and development can be delivered (see case study below). In general, the take up
of IIP is relatively high compared with the whole economy: 28 per cent of establishments in
education are accredited compared with 16 per cent across all sectors.
Table 6.2 Investors in People Accreditation
IIP accredited (%)
Not IIP accredited (%)
Don't know (%)
Total (%)
Education 28 64 8 100
All sectors 16 69 15 100
Source: (Davies et al., 2012) Base: All Establishments 87,572 unweighted
The example provided below indicates the way in which IIP can be used to bolster training
activities within an organisation and improve overall organisational performance.

60
Case Study: Investors in People – Growth through skills (Penair School, Cornwall)
The Challenge
Penair school is a science college teaching approximately 1200 students aged between 11 and 16
years. The school felt that it needed to seek new ways to develop their staff and attract new talent.
The approach
Penair felt that Investors in People (IIP) could help with these issues, and having achieved IIP
recognition in 1994 it has consistently maintained its recognition ever since. This has involved
focussing on Continuing Professional Development (CPD) throughout the organisation and
establishing a comprehensive training programme on leadership which is delivered both internally and
externally.
“IIP feedback forms part of our ethos here at Penair, if you’re here, we will support you to reach your
potential at our school or indeed beyond...There is an outstanding ethos within the school that
encourages and supports initiative at all levels...the whole staff acts together as one team and
supports each other in every aspect of school life.” Explains Rob Sharpe, Deputy Headteacher,
Penair School.
The benefits
Being committed to CPD and extensive training programmes has ensured low turnover and staff are fully committed to ensuring the success of the school. Similarly, a strong emphasis on leadership
helps to foster creativity and innovation at the school, looking at new ways of teaching and sharing
their knowledge with others to create a dynamic learning community.
Source: UK Commission case study, 2011
Apprenticeships
Whilst the sector is dominated by professional staff employed in teaching, lecturing and
research roles, there is a substantial number of support staff who might potentially benefit
from programmes, such as Apprenticeships. In a study undertaken by Lewis and Gospel
(2011) they found that engineering and physics departments were keen to take on
apprentices mainly due to many experienced technicians leaving the sector. The statistics in
Section 5 revealed that the number of Apprenticeships is increasing in the sector, however
they are not fully exploited to develop skilled workers and meet future demands for
skilled Support staff.

61
6.7 Conclusion
The Education sector has experienced relatively low levels of skills mismatch over recent
years, but as a consequence of policy reforms, changes in the curriculum and advancing
technology demands for new and specific skills are high. Currently evidence suggests that
persistent vacancies and skills shortages are very low, compared with the economy as a
whole. Where vacancies exist they will be for suitably qualified candidates, but skills gaps
are high in professional occupations and slightly higher in manager and associate
professional occupations, compared with the economy as a whole. This is a concern as
these occupations comprise a significant proportion of the Education sector workforce. The
Education sector is likely to play a key strategic role in stimulating the economy, so
addressing skills mismatches is important.

62
7. CONCLUSION 7.1 The Sector Today and Tomorrow
The Education sector makes a significant contribution to the UK economy and has a strong
international profile, particularly in HE. It employs 2.7 million people, and next to public
administration and health, it is one of the largest employing sectors in the UK. It has an
essential role in developing skills and knowledge, which are at a premium in the current
economic climate.
The sector has a strategically important role in supporting the economic recovery of the UK
and sustaining economic growth over the long term. Increasingly, nations compete in
relation to the relative skills of their workforces. Hence the strategic role for the sector in
developing those skills in the population which allow the economy to compete in increasingly
global markets. Economic growth will help combat social exclusion in aggregate, but there is
also a key role for the Education sector in providing all individuals with those skills which
provide them with access to the labour market and sustain them in the labour market in well
paid jobs.
In aggregate, the Education sector will increasingly need to meet its strategic objectives with
less public funding in real terms given pressures on the public finances. The sector is going
through a period of major change as education budgets are cut, especially in FE and HE
where the size and structure of state funding has, and is changing, at a pace. It should be
noted that the sector, at least since the Education Act of 1945 in the schooling system, and
the creation of Industrial Training Boards in the training sector, has gone through periodic
major transformations. So it is a sector which is used to dealing with change, though this
does not detract from the challenges the management of change poses those working in the
sector.
Changes in policy have implications for the skill needs of teachers, lecturers and managers.
Recent reforms have redesigned and reshaped education and skills provision to ensure that
it responds more effectively to the requirements of employers and the achievements of
learners. FE and HE institutions are increasingly operating in international markets for their
income. Overall, the sector needs to focus on developing the capacity of its workforce to
respond effectively to these changes.
Despite the challenges the sector faces, it will continue to grow in economic importance. As
the sector develops and as demands for education and training increase to meet the needs

63
of those working longer, it has a number of medium-term challenges. In addition to this,
there is a growing emphasis on the important role of skills and knowledge in improving
economic performance. To address these changes and demands, the sector will need to:
• develop the capacity of its workforce to effectively respond to labour market, policy
and technological changes by developing, in particularly, multi-disciplinary and
leadership skills;
• address the skills and knowledge required in the economy – FE and HE courses
need to be demand-led and more responsive to both employers and learners;
• provide tangible benefits for learners in terms of employment outcomes;
• develop workforce capacity and skills and increase the stock of human capital in the
labour market;
• deliver the minimum standards and statutory requirements required by Government
in the compulsory education system;
• maintain the world class education system and improve in terms of international
educational attainment indicators; and
• enhance its world class reputation by HE continuing to be a source of research
development and innovation.
The aim of these reforms and delivery expectations are to create a more educated workforce
that is the most flexible and successful in Europe. These aims can only be realised if the
skills are in place; those skills relate to management and leadership, teaching and lecturing,
and the various support roles.
7.2 The Performance Challenge
The performance challenge for employers currently based in the UK is managing a
programme of change resulting from policy reforms, public sector cuts, funding constraints
and the need to procure funding from other sources. It is well placed to meet these
challenges. The performance challenges for the Education sector can be summarised as:
• attracting and retaining the best and brightest teachers and research professionals,
particularly those with STEM and modern language skills, to support supply across
the whole economy;
• putting initiatives in place to boost supply and attracting new talent from the UK, the
EU and beyond in order to replace the ageing workforce;

64
• ensuring that the education workforce has the necessary skills to compete for funding
sources, whether from the commercialisation of intellectual property, to the
recruitment of students (both EU and non-EU domiciled), or to seeking out new
partnerships;
• continuing to develop the market and generate export income; and
• responding to the increasing demand for e-learning and service delivery by focusing
on the implementation and exploitation of technology, in terms of new platforms, new
delivery methods and new communication methods.
These mean developing new skills, particularly in management, governance and leadership,
together with knowledge and skills in new technologies to respond to these challenges.
Forging new partnerships will also be needed to meet the growing use and application of
information and communication technology. Therefore, sector workforce development skills
in marketing, networking, partnership development, PR and advocacy are required to ensure
that organisations remained competitive, reach wider markets and secure new business.
7.3 Growth through Skills
The Education sector invests heavily in its workforce, compared to the economy as a whole.
There is a substantial training and skills development infrastructure provided through various
nationally recognised bodies, as well as the Education sector itself. There is also a well-
developed professional development and training structure to assist with the initial and
continuing training of the sector workforce. Ultimately the success of the sector is dependent
upon the skills of the people who work in it and their capability to communicate knowledge.
There are strict entry requirements to the teaching profession at every level. Growth through
skills is dependent upon people possessing the minimum entry requirements when
graduating from university. There are enormous skill replenishment needs once people are
in the sector in relation to curriculum changes and advances in knowledge. This can only be
achieved through training.
Perhaps the key message here is that the sector needs to continue to invest heavily in skills
and learning, as it has always done, but also place an emphasis on the new skills and
developing support roles to assist the sector in improving the nation’s competitiveness and
provide a means to upward social mobility for many people.

65
7.4 Business Benefits
One of the principal business benefits of investing in training is company survival. The
evidence suggests that where Education sector employers invest in training they are four
more times likely to survive than their counterparts who do not do so (Collier et al, 2007). In
organisation with developed supervisory skills, information sharing and employment skill
development practices were found to perform better (Garrett, et al, 2010). In schools,
research has shown that students performed better where these practices were well
developed and informing the learning and work culture (Bassi and McMurrer, 2007).
At a time when the economic recovery is dependent on growth in skills, demand for the
Education sector is high. The business benefits of training go beyond company survival. The
beginning of this section pointed to the range of performance or business challenges which
will face the sector over the medium-term. The evidence demonstrates that there are
relatively good returns for individuals and employers to invest in skills and that there is a
strong education and training infrastructure to help deliver the skills the sector needs. The
skills the sector needs can also be successfully delivered via programmes such as
Apprenticeships and Investors in People.

66
Bibliography Annual Business Survey (2011) Annual Business Survey 2010 - Provisional Results, Office
for National Statistics, Newport. Available:
http://www.ons.gov.uk/ons/dcp171778_249457.pdf [Accessed 29th June 2012].
ASHE (Annual Survey of Hours and Earnings) (2011) Provisional results (SOC 200) Table 4
– Industry. Office for National Statistics, Newport. Available:
http://www.ons.gov.uk/ons/publications/re-reference-tables.html?edition=tcm%3A77-
235202 [Accessed 29th June 2012].
Bassi, L. J. and McMurrer, D. (2007) Maximising your Return on People. Harvard Business
Review, March, 115-123.
BIS (2012) The Wilson Review: A Review of Business-University Collaboration (URN
12/610). London: Department for Business, Innovation and Skills.
BIS (2011a) New Challenges, New Chances. Skills Investment Statement 2011-2014:
Investing in a World Class Skills System (URN 11/1374). London: Department for
Business, Innovation and Skills.
BIS (2010) Skills for Sustainable Growth (Strategy Document) (URN 10/1274). London:
Department for Business, Innovation and Skills.
Beaven, R., May-Gillings, M., Wilson, R. and Bosworth, D. (2011) Measuring the Economic
Impact of Further Education (BIS Research Paper number 38). London: Department
for Business Innovation and Skills.
Blake, N., Dods, J. and Griffiths, S. (2000) Employers Skill Survey: Existing Survey Evidence
and Its Use in the Analysis of Skill Deficiencies (SKT30). London: Business
Strategies.
Collier, W.J.C., Green, F. and Kim, Y.B. (2007) Training and Establishment Survival
(Research Report 20). Wath-upon-Dearne: Sector Skills Development Agency.
Data Service (2012) Statistical First Release Apprenticeship Supplementary Tables, March
2012, ONS. Available:
http://www.thedataservice.org.uk/statistics/statisticalfirstrelease/sfr_supplementary_t
ables/Apprenticeship_sfr_supplementary_tables/. [Accessed 29th June 2012].

67
Davies, B., Gore, K., Shury, J., Vivian, D. and Winterbotham, M. (2012) UK Commission’s
Employer Skills Survey 2011: UK Results. Evidence Report 45. UK Commission for
Employment and Skills, Wath-upon-Dearne. Available:
http://www.ukces.org.uk/publications/employer-skills-survey-2011
Dearden, L., Fitzsimons, E., and Wyness, G. (2010) The Impact of Higher Education
Finance on University Participation in the UK (BIS Research Paper number 11).
London: Department for Business Innovation and Skills.
Eurostat (2011) Education and Training Statistics. Brussels: European Commission.
Available at:
http://epp.eurostat.ec.europa.eu/statistics_explained/index.php/Educational_expendit
ure_statistics
Garrett, R., Campbell, M. and Mason, G. (2010) The Value of Skills: An Evidence Review
(Evidence Report 22). London: UK Commission for Employment and Skills.
HM Treasury (2011a) The Plan for Growth. London: HM Treasury/Department for Business
Innovation and Skills.
HM Treasury (2011b) The Autumn Statement (Cm8231). London: The Stationery Office.
Kearney, M-L. (2009) Higher Education, Research and Innovation: Charting the Course of
the Changing Dynamics of the Knowledge Society in Meek, V.L., Teichler, U., &
Kearney, M-L. (eds). Higher Education, Research and Innovation: Changing
Dynamics. (Report on the UNESCO Forum on Higher Education, Research and
Knowledge 2001-2009). Germany: International Centre for Higher Education
Research Kassel/UNESCO Forum on Higher Education, pp.7-24.
Lewis, P. & Gospel, H. (2011) ‘Technicians under the Microscope: The Training and Skills of
University Laboratory and Engineering Workshop Technicians’, SKOPE Research
Paper, No. 103.
LLUK (2011a) Lifelong Learning UK – Information, Advice and Guidance LMI. London: Life
Long Learning UK.
LLUK (2011b) Sector Skills Assessment 2010: England. London: Life Long Learning UK.
LSIS (2012), Sector Skills Assessment: Education, Qualification and Skills Unit, Learning
and Skills Improvement Service.

68
LSIS (2011a) The Further Education and Skills Sector in 2020: A Social Productivity
Approach (LSIS246). Coventry: Learning and Skills Improvement Agency.
LSIS (2011b) Extending working lives in the Further Education and skills sector. Creative
approaches to managing and supporting older people in the workforce (LSIS249).
Coventry: Learning and Skills Improvement Agency.
LSIS (2011c) Strategic Intentions 2011-2014 (LSIS229). Coventry: Learning and Skills
Improvement Agency.
LSIS (2011d) New Freedoms: New Focus towards a Strategic Framework for Improvement
and Development in the Learning and Skills Sector (LSIS230). Coventry: Learning
and Skills Improvement Agency.
Manfredi, S. (2008) Developing Good Practice in Managing Age Diversity in the Higher
Education Sector: An Evidence-Based Approach. Oxford: The Centre for Diversity
Policy Research and Practice, Oxford Brookes University.
Meager, N. (2009) The role of training and skills development in active labour market
policies. International Journal of Training and Development, 13:1–18.
Migration Advisory Committee Secretariat (2010) Which sectors and occupations use more
immigrant labour and what characterises them? A quantitative analysis, Migration
Advisory Committee Secretariat Working Paper
OECD (2011) Education at a Glance 2011: OECD Indicators. Paris: Organisation for
Economic Cooperation and Development.
Payne, J. (2008) Sector skills councils and employer engagement – delivering the ‘employer‐
led’ skills agenda in England, Journal of Education and Work, 21(2): 93-113.
Purcell, K., P. Elias, R. Davies, and N. Wilton (2005) Class of ’99, study of the early labour
market experience of recent graduates. Department for Education and Skills,
Nottingham
Russell Pioneering Research Group (2010) The Economic Impact of Research Conducted in
Russell Group Universities (Russell Group Papers, Issue 1). London: The Russell
Group.

69
Shury, J., Vivian, D., Davies, B. and Gore, K. (2011) Employer Perspective Survey 2010.
Evidence Report 42. UK Commission for Employment and Skills, Wath-upon-Dearne.
UK Border Agency (2011) Tier 2 Shortage Occupation List. Available:
http://www.ukba.homeoffice.gov.uk/sitecontent/documents/workingintheuk/shortageo
ccupationlistnov11.pdf [Accessed 17th July 2012].
UK Commission (2011) The UK Employment and Skills Almanac 2010 (Evidence Report
26). London: UK Commission for Employment and Skills.
UK Commission (2010a) Skills for Jobs: Today and Tomorrow. The National Strategic Skills
Audit for England 2010 (Volume 1: Key findings). London: UK Commission for
Employment and Skills.
UK Commission (2010b) Skills for Jobs: Today and Tomorrow. The National Strategic Skills
Audit for England 2010 (Volume 2: Evidence Report). London: UK Commission for
Employment and Skills.
Universities UK (2007) Talent wars: The international market for academic staff (Policy
Briefing). London: Universities UK.
Universities UK (2009) The Impact of Universities on the UK Economy (Fourth report).
London: Universities UK.
Universities UK (2011) Higher Education in Facts and Figures (Summer 2011). London:
Universities UK.
Wilson, R. and Hogarth T., with Bosworth, D., Dickerson, A., Green, A., Jacobs, C., Keep,
E., Mayhew, K. and Watson, S. (2003) Tackling the Low Skills Equilibrium: A Review
of Issues and Some New Evidence. London: Department for Trade and Industry.
Wilson, R. and Homenidou, K. (2011) Working Futures 2010-2020: Main Report (Evidence
report 41). London: UK Commission for Employment and Skills.
Wilson, R., Homenidou, K. and Gambin, L. (2008) Working Futures 2007-2017 (Evidence
report 2). London: UK Commission for Employment and Skills.

70
List of previous publications Executive summaries and full versions of all these reports are available from www.ukces.org.uk Evidence Report 1 Skills for the Workplace: Employer Perspectives Evidence Report 2 Working Futures 2007-2017 Evidence Report 3 Employee Demand for Skills: A Review of Evidence & Policy Evidence Report 4 High Performance Working: A Synthesis of Key Literature Evidence Report 5 High Performance Working: Developing a Survey Tool Evidence Report 6 Review of Employer Collective Measures: A Conceptual Review from a Public Policy Perspective Evidence Report 7 Review of Employer Collective Measures: Empirical Review Evidence Report 8 Review of Employer Collective Measures: Policy Review Evidence Report 9 Review of Employer Collective Measures: Policy Prioritisation Evidence Report 10 Review of Employer Collective Measures: Final Report Evidence Report 11 The Economic Value of Intermediate Vocational Education and Qualifications Evidence Report 12 UK Employment and Skills Almanac 2009 Evidence Report 13 National Employer Skills Survey 2009: Key Findings Evidence Report 14 Strategic Skills Needs in the Biomedical Sector: A Report for the National Strategic Skills Audit for England, 2010 Evidence Report 15 Strategic Skills Needs in the Financial Services Sector: A Report for the National Strategic Skills Audit for England, 2010

71
Evidence Report 16 Strategic Skills Needs in the Low carbon Energy generation Sector: A Report for the National Strategic Skills Audit for England, 2010 Evidence Report 17 Horizon Scanning and Scenario Building: Scenarios for Skills 2020 Evidence Report 18 High Performance Working: A Policy Review Evidence Report 19 High Performance Working: Employer Case Studies Evidence Report 20 A Theoretical Review of Skill Shortages and Skill Needs Evidence Report 21 High Performance Working: Case Studies Analytical Report Evidence Report 22 The Value of Skills: An Evidence Review Evidence Report 23 National Employer Skills Survey for England 2009: Main Report Evidence Report 24 Perspectives and Performance of Investors in People: A Literature Review Evidence Report 25 UK Employer Perspectives Survey 2010 Evidence Report 26 UK Employment and Skills Almanac 2010 Evidence Report 27 Exploring Employer Behaviour in relation to Investors in People Evidence Report 28 Investors in People - Research on the New Choices Approach Evidence Report 29 Defining and Measuring Training Activity Evidence Report 30 Product strategies, skills shortages and skill updating needs in England: New evidence from the National Employer Skills Survey, 2009 Evidence Report 31 Skills for Self-employment

72
Evidence Report 32 The impact of student and migrant employment on opportunities for low skilled people Evidence Report 33 Rebalancing the Economy Sectorally and Spatially: An Evidence Review Evidence Report 34 Maximising Employment and Skills in the Offshore Wind Supply Chain Evidence Report 35 The Role of Career Adaptability in Skills Supply Evidence Report 36 The Impact of Higher Education for Part-Time Students Evidence Report 37 International approaches to high performance working Evidence Report 38 The Role of Skills from Worklessness to Sustainable Employment with Progression Evidence Report 39 Skills and Economic Performance: The Impact of Intangible Assets on UK Productivity Growth Evidence Report 40 A Review of Occupational Regulation and its Impact Evidence Report 41 Working Futures 2010-2020 Evidence Report 42 International Approaches to the Development of Intermediate Level Skills and Apprenticeships Evidence Report 43 Engaging low skilled employees in workplace learning Evidence Report 44 Developing Occupational Skills Profiles for the UK Evidence Report 45 UK Commission’s Employer Skills Survey 2011: UK Results Evidence Report 46 UK Commission’s Employer Skills Survey 2011: England Results Evidence Report 47 Understanding Training Levies

73
Evidence Report 48 Sector Skills Insights: Advanced Manufacturing Evidence Report 49 Sector Skills Insights: Digital and Creative Evidence Report 50 Sector Skills Insights: Construction Evidence Report 51 Sector Skills Insights: Energy Evidence Report 52 Sector Skills Insights: Health and Social Care Evidence Report 53 Sector Skills Insights: Retail Evidence Report 54 Research to support the evaluation of Investors in People: Employer Survey Evidence Report 55 Sector Skills Insights: Tourism Evidence Report 56 Sector Skills Insights: Professional and Business Services

Evidence Reports present detailed findings of the research produced by the UK Commission for Employment and Skills. The reports contribute to the accumulation of knowledge and intelligence on skills and employment issues through the review of existing evidence or through primary research. All of the outputs of the UK Commission can be accessed on our website at www.ukces.org.uk
Produced by the Institute for Employment Research, University of Warwick for the UK Commission for Employment and Skills.
UKCESRenaissance HouseAdwick ParkWath-upon-DearneRotherhamS63 5NBT +44 (0)1709 774 800F +44 (0)1709 774 801
UKCES28-30 Grosvenor GardensLondonSW1W 0TTT +44 (0)20 7881 8900F +44 (0)20 7881 8999
This document is available atwww.ukces.org.uk under ‘Publications’
ISBN 978-1-908418-22-7© UKCES 1st Ed/08.12