sector issues in rate design: energy – case study · 11:30 am – 3:00 pm. june 17, 2008....
TRANSCRIPT

11:30 AM – 3:00 PMJune 17, 2008
Jonathan A. Lesser, Ph.D.Leonardo Giacchino, Ph.D.
Sector Issues in Rate Design: Energy – Case Study

2June 17, 2008
Agenda
8:30 AM to 10:15 AM – Concepts
10:30 AM to 11:30 AM – Issues
11:30 AM to 12:15 PM and 1:30 PM to 3:00 PM – Case Study
• Preliminary Discussion
• Data and Assumptions
• Calculating the Rate of Return
• Regulated Company Tariff Proposal
• Regulator’s Consultant Findings
• Amending the Tariff Proposal
• Creating a Social Tariff
3:15 PM to 4:45 PM – Transmission Pricing

Preliminary Discussion

4June 17, 2008
The rate-setting process
Total Revenue Requirement
Distribution Transmission Generation
Fixed Costs(Demand)
VariableCosts
(usage/energy)
CustomerCosts
Functionalization
Classification
Allocation
Rate DesignResidential
RatesCommercial
RatesIndustrial
Rates
Res. Com. Ind. Res. Com. Ind. Res. Com. Ind.
5June 17, 2008
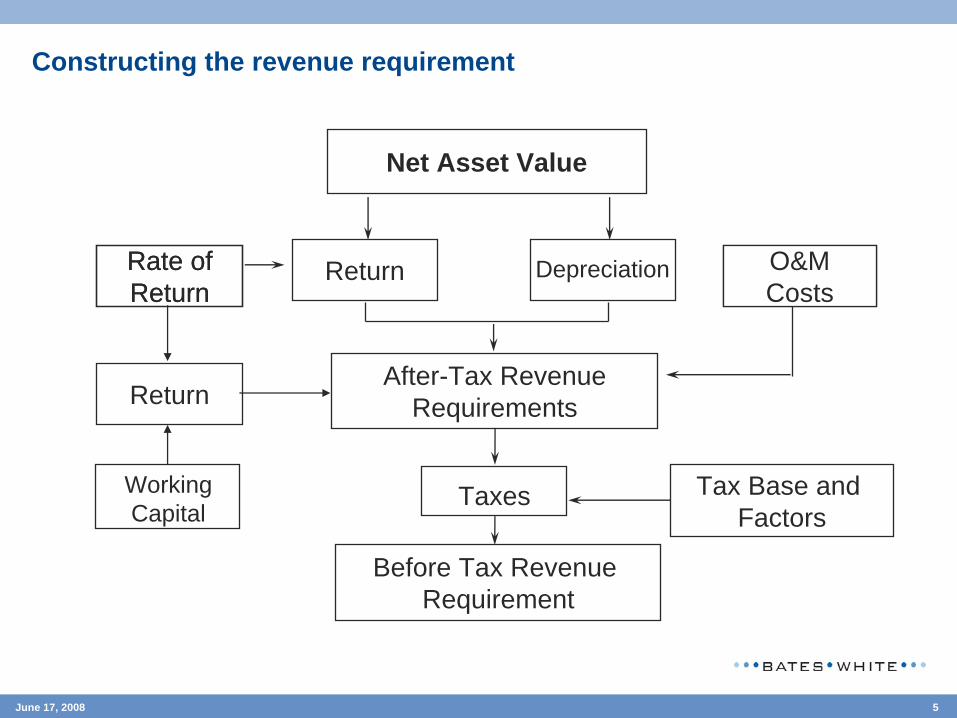
O&MCosts
Rate ofReturn
Return Depreciation
After-Tax RevenueRequirements
Taxes
Net Asset Value
Tax Base and Factors
Before Tax Revenue Requirement
Constructing the revenue requirement
O&MCosts
Rate ofReturn
WorkingCapital
Return

6June 17, 2008
Cost categories
• Return on invested capital
• Depreciation
• Operation and maintenance (O&M) costs
• Taxes
• Medium voltage costs
• Low voltage costs
• Common costs: allocated to medium and low voltage
7June 17, 2008
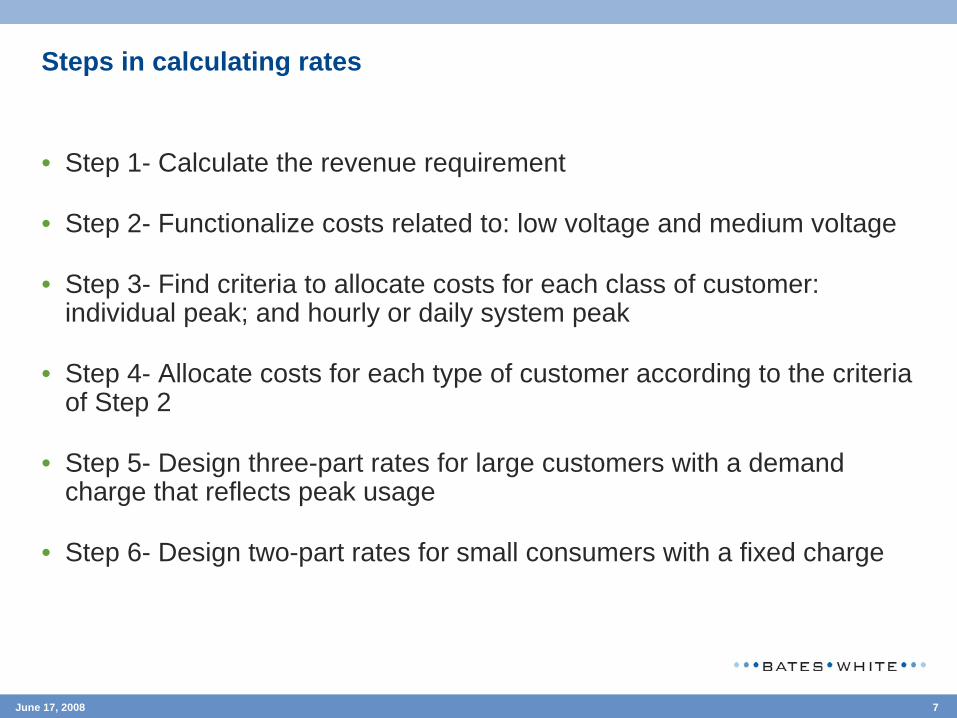
Steps in calculating rates
• Step 1- Calculate the revenue requirement
• Step 2- Functionalize costs related to: low voltage and medium voltage
• Step 3- Find criteria to allocate costs for each class of customer: individual peak; and hourly or daily system peak
• Step 4- Allocate costs for each type of customer according to the criteria of Step 2
• Step 5- Design three-part rates for large customers with a demand charge that reflects peak usage
• Step 6- Design two-part rates for small consumers with a fixed charge

8June 17, 2008
Principal indicators used to calculate rates
• Consumption during different peaks System peak or coincidental peak
Non-coincidental peak
• Annual consumption
• Demand
• Number of customers
Data and assumptions

10June 17, 2008
Rate review process
• A regulated distribution company is in the middle of a tariff review and presents its tariff proposal based on certain data and assumptions
• The regulator receives a consultant report that proposes some actions
• The actions are reviewed by the regulators and discussed with the company. Amendments to the tariff proposal are agreed
• After the regulated company presents its new tariff proposal, a social tariff is calculated for customers that consume 75 kWh or less per month

11June 17, 2008
Distribution rates
• Different types of customers
Residential and Commercial: energy charge (kWh) rate
Industrial customers: demand charge (kW/month) and kWh rate
All customers have a fixed “ready-to-serve” charge
12June 17, 2008
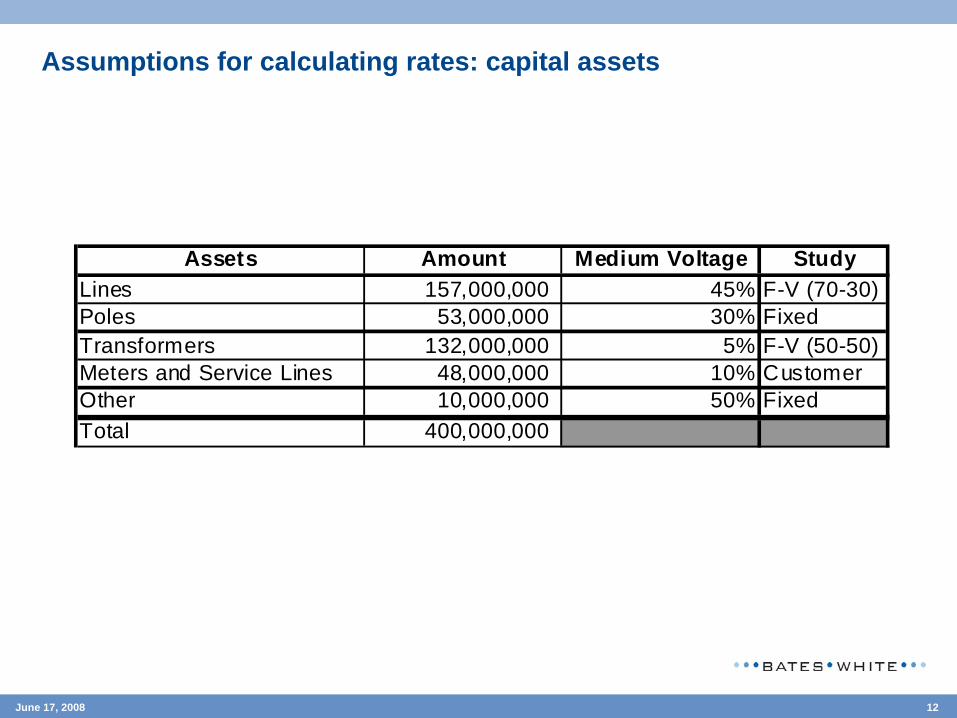
Assumptions for calculating rates: capital assets
Assets Amount Medium Voltage StudyLines 157,000,000 45% F-V (70-30)Poles 53,000,000 30% FixedTransformers 132,000,000 5% F-V (50-50)Meters and Service Lines 48,000,000 10% CustomerOther 10,000,000 50% FixedTotal 400,000,000

13June 17, 2008
Assumptions for calculating rates: O&M costs
Costs Amount Medium Voltage StudySalaries and Benefits 10,000,000 25% FixedBilling Services 500,000 10% VariableCustomer Services 400,000 1% CustomerOperator's Fee 500,000 45% FixedSAP 1,000,000 15% FixedThird Party Services 400,000 30% FixedOther Costs 1,100,000 20% FixedCommon Expenses 3,500,000 45% FixedTotal 17,400,000

14June 17, 2008
Assumptions for calculating rates: depreciation, taxes, and WACC
Item ValueWorking Capital 10,000,000 Gross Asset Base 400,000,000 Accumulated Depreciation 62.50%Annual O&M Costs 17,400,000 Rate of Return 12%Average Life (years) 25 Tax rate 25%
Revenue Requirement

15June 17, 2008
Assumptions for calculating rates: load curve and billing determinants
MV LVResidential 1 1 1,250,000 2,500 2,500 Commercial 10 10 50,000 300 300 Industrial (LV) 200 70 7,000 250 250 50 Industrial (MV) 500 150 1,000 450 - 80 Total 1,308,000 3,500 3,050
Noncoincidental Peak
Coincidental Peak
Demand (MW)Type of Customer Number Annual Usage (GWh)

16June 17, 2008
Assumptions for calculating rates: existing tariff sheet
Variable ($/kWh) 0.0100 Customer Charge ($/month) 0.1100
Variable ($/kWh) 0.0230 Customer Charge ($/month) 1.2000
Variable ($/kWh) 0.0038 Customer Charge ($/month) 20.0000 Demand ($/kW/month) 22.5000
Variable ($/kWh) 0.0008 Customer Charge ($/month) 55.0000 Demand ($/kW/month) 4.6000
Industrial (LV)
Industrial (MV)
Concept Rate
Residential
Commercial

Calculating the rate of return

18June 17, 2008
Step 1: Calculate the revenue requirement – let’s figure it out
O&M Costs $ M
Depreciation$ M
Return$ M
Rate of Return %
Net value: $ M
After-tax Revenue Requirement$ M
Tax factorsand bases
Taxes$ M
Pre-tax Revenue Requirement$ M
Return
WorkingCapital
We will start by calculating the rate of return – since this is often highly disputed in rate cases
19June 17, 2008
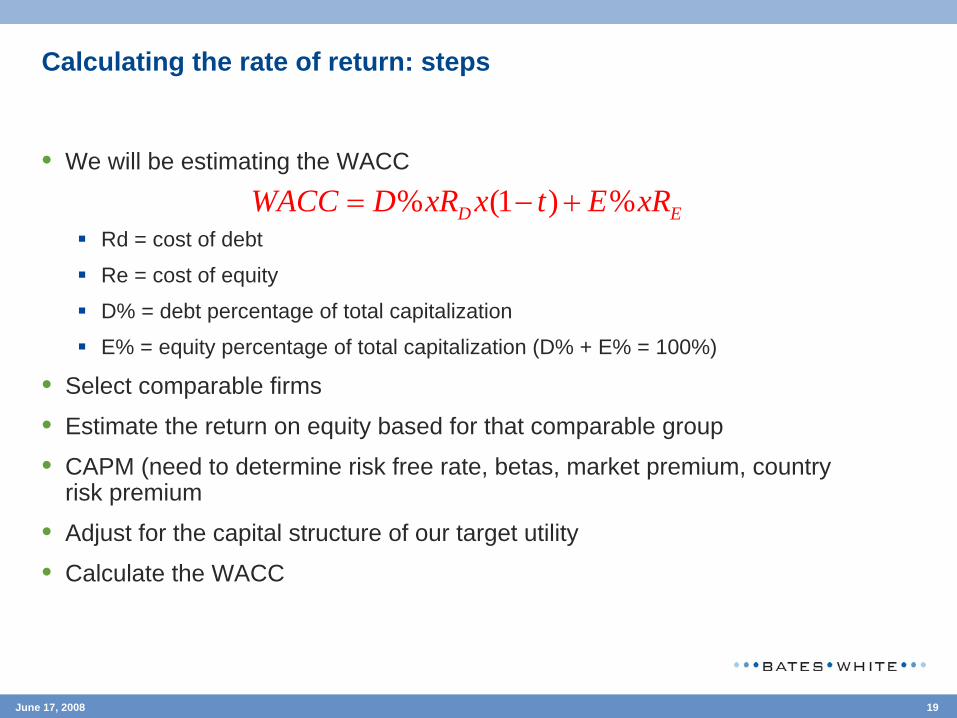
Calculating the rate of return: steps
• We will be estimating the WACC
Rd = cost of debt
Re = cost of equity
D% = debt percentage of total capitalization
E% = equity percentage of total capitalization (D% + E% = 100%)
• Select comparable firms
• Estimate the return on equity based for that comparable group
• CAPM (need to determine risk free rate, betas, market premium, country risk premium
• Adjust for the capital structure of our target utility
• Calculate the WACC
% (1 ) %D EWACC D xR x t E xR= − +
20June 17, 2008
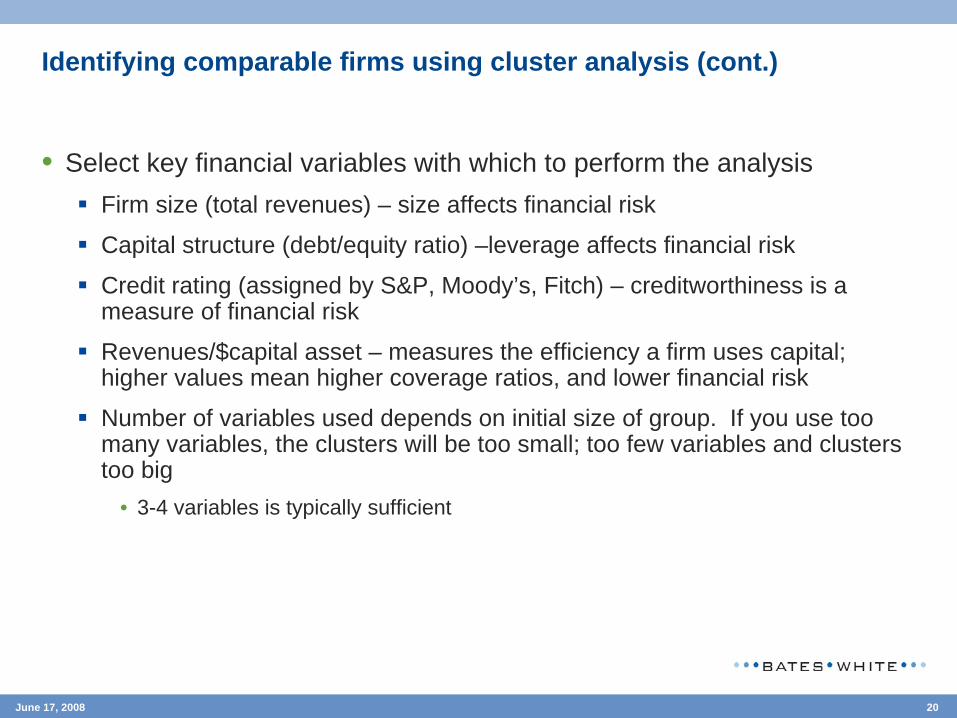
Identifying comparable firms using cluster analysis (cont.)
• Select key financial variables with which to perform the analysisFirm size (total revenues) – size affects financial risk
Capital structure (debt/equity ratio) –leverage affects financial risk
Credit rating (assigned by S&P, Moody’s, Fitch) – creditworthiness is a measure of financial risk
Revenues/$capital asset – measures the efficiency a firm uses capital; higher values mean higher coverage ratios, and lower financial risk
Number of variables used depends on initial size of group. If you use too many variables, the clusters will be too small; too few variables and clusters too big
• 3-4 variables is typically sufficient

21June 17, 2008
Identifying comparable firms using cluster analysis
D%
Credit Rating
$Rev
Essentially, we are determining the firms with the least “distance” from the target utility
Our Utility
- Other firms
Our selected cluster of 6 firms

22June 17, 2008
Calculating the correct betas for our analysis
• Formulas you will need to use:
0.33 0.67
%1 (1 )%
%1 (1 )%
J JADJ RAW
JJ ADJ
UL J
J
UTILITYJ JRL UL UTILITY
x
DtE
Dx tE
β β
ββ
β β
= +
=⎛ ⎞+ −⎜ ⎟
⎝ ⎠⎛ ⎞
= + −⎜ ⎟⎝ ⎠
= Beta adjusted for mean reversion
= Unlevered betas of the comparable firms
= Relevered betas of the comparable firms, using the utility’s actual capital structure

23June 17, 2008
Applying the CAPM
• Assume that the capital structure of our utility is 50% debt and 50% equity
• Corporate income tax rate = 25%
• We need to calculate the adjusted beta (adjusted for reversion to the market beta of 1.00); and make the calculations to account for capital structure
Use the formulas on the previous slide to do this

24June 17, 2008
Applying the CAPM (cont.)
• Here are the results you should get

25June 17, 2008
Applying the CAPM (cont.)
• Next, we determine the risk-free rate, the market risk premium, and the country risk premium
• The basis for these values should be the country of origin for the comparable firms selected
For example, in estimating the return for an electric utility in Guatemala, if US comparable firms, then use US data, and calculate the appropriate US-Guatemala country risk premium
• Risk-free rate: rate on a long-term. AAA-rated government bondExample: 20Yr U.S. Treasury Bonds, current rate around 4.5%
• Market risk premium – typically select a historic risk premium based on the long-run arithmetic average of the difference between total returns in the stock market and income returns on government bonds
Use income returns because that is the truly risk-free componentIbbotson data published for the U.S, historical data starting from 1926 (7.1%)
• Some analysts use subsets of these data, but then the question arises, what is the basis for selecting a particular subset?
26June 17, 2008
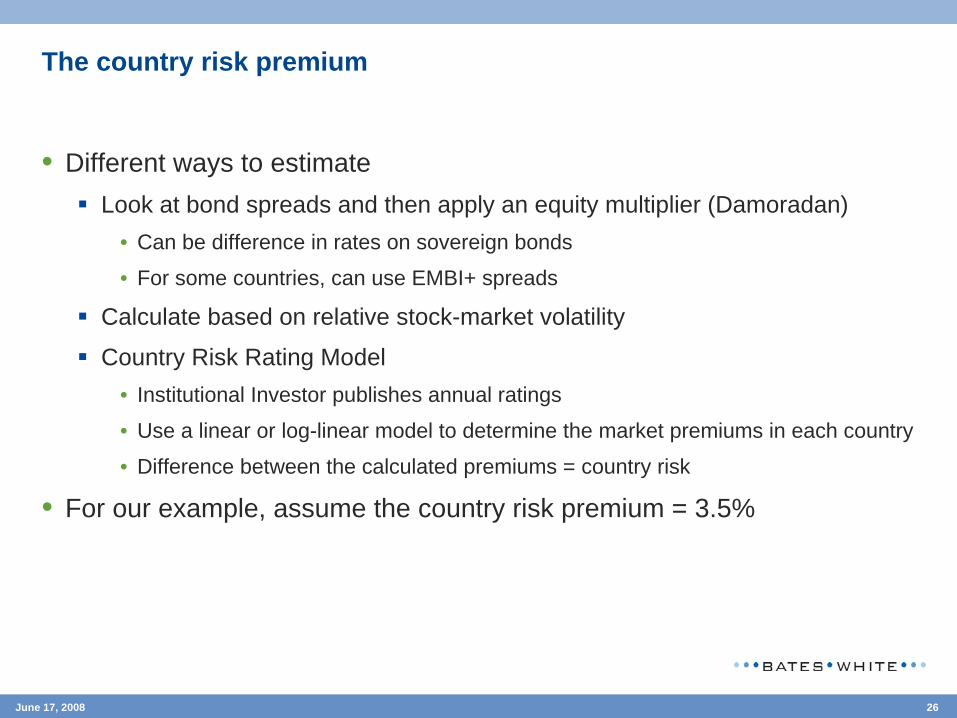
The country risk premium
• Different ways to estimateLook at bond spreads and then apply an equity multiplier (Damoradan)
• Can be difference in rates on sovereign bonds
• For some countries, can use EMBI+ spreads
Calculate based on relative stock-market volatility
Country Risk Rating Model• Institutional Investor publishes annual ratings
• Use a linear or log-linear model to determine the market premiums in each country
• Difference between the calculated premiums = country risk
• For our example, assume the country risk premium = 3.5%
27June 17, 2008
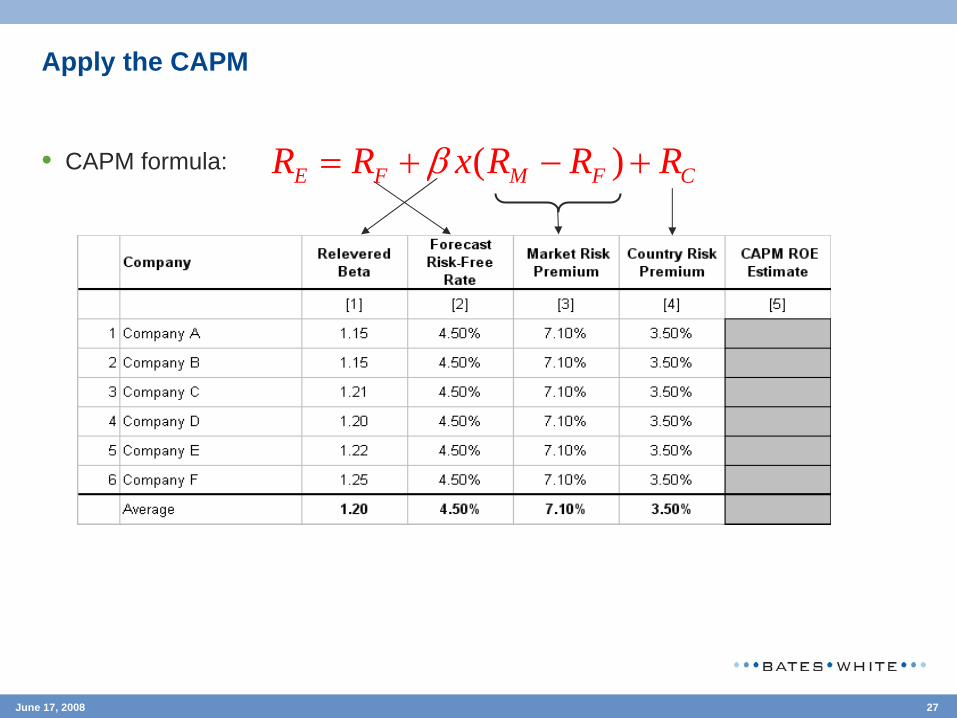
Apply the CAPM
• CAPM formula: ( )E F M F CR R x R R Rβ= + − +

28June 17, 2008
The result
• Finally, we calculate the WACC for our utility using
• Assume cost of debt = 10%% (1 ) %D EWACC D xR x t E xR= − +
50% 10% (1 25%) 50% 16.5% 12.0%WACC x x x= − + =

Regulated company tariff proposal

30June 17, 2008
Step 1: Calculate the revenue requirement - results
O&M Costs $17.4 M
Depreciation$16 M
Return$18 M
Rate of Return 12 %
Net Asset value: $150 M
After-tax Revenue Requirement$52.6 M
Tax factorsand bases
Taxes$6.4 M
Pre-tax Revenue Requirement$59 M
Return$1.2 M
Working Capital$10 M

31June 17, 2008
Step 1: Calculate the revenue requirement – different format
AmountGross asset base (a) 400,000,000 Accumulated depreciation (b) (250,000,000) Net asset base (c)=(a)-(b) 150,000,000 Working capital (d) 10,000,000 Net value (e)=(c)+(d) 160,000,000 Rate of Return (f) 12%Tax (g) 25%Pretax Rate of Return (h)=(f)/[1-(g)] 16%Return (with taxes) (i)=(e)*(h) 25,600,000 Asset Lifes (years) (j) 25Depreciation (k)=(a)/(j) 16,000,000 O&M (l) 17,400,000 Taxes (m)=(g)*(i) 6,400,000 Revenue Requirement (n)=(i)+(k)+(l) 59,000,000
Concept

32June 17, 2008
The company’s proposed rate increase
(a) (b) (c)=(a)*(b)
Variable ($/kWh) 0.0100 2,500,000,000 25,000,000 Customer Charge ($/month) 0.1100 15,000,000 1,650,000
Variable ($/kWh) 0.0230 300,000,000 6,900,000 Customer Charge ($/month) 1.2000 600,000 720,000
Variable ($/kWh) 0.0038 250,000,000 950,000 Customer Charge ($/month) 20.0000 84,000 1,680,000 Demand ($/kW/month) 22.5000 600,000 13,500,000
Variable ($/kWh) 0.0008 450,000,000 360,000 Customer Charge ($/month) 55.0000 12,000 660,000 Demand ($/kW/month) 4.6000 960,000 4,416,000
55,836,00059,000,000
5.67%
Billings at Current RatesBillings at Proposed Rates
Tariff Increase
Concept Rates
Residential
Commercial
Industrial (LV)
Industrial (MV)
Billing Determinant
Annual Billing
33June 17, 2008
Cost allocation – the three different types of costs
• Customer Costs - distributed in proportion to the number of customers in a class. Normally included in a minimum bill or customer service charge
• Variable Costs - distributed to customer groups on the basis of the kWh (energy) consumed during some historical or projected test period
• Fixed Costs - analysis of the system load conditions and on how each customer class affects such costs

34June 17, 2008
Allocating capital costs
Fixed Variable Customer Fixed Variable CustomerLines 157,000,000 49,455,000 21,195,000 60,445,000 25,905,000 Poles 53,000,000 15,900,000 37,100,000 Transformers 132,000,000 3,300,000 3,300,000 62,700,000 62,700,000 Meters and Service Lines 48,000,000 4,800,000 43,200,000 Other 10,000,000 5,000,000 5,000,000 Total Assets 400,000,000 73,655,000 24,495,000 4,800,000 165,245,000 88,605,000 43,200,000 Accumulated Depreciation (250,000,000) (46,034,375) (15,309,375) (3,000,000) (103,278,125) (55,378,125) (27,000,000) Working Capital (W K) 10,000,000 1,841,375 612,375 120,000 4,131,125 2,215,125 1,080,000 Net Assets and W K 160,000,000 29,462,000 9,798,000 1,920,000 66,098,000 35,442,000 17,280,000 Return 25,600,000 4,713,920 1,567,680 307,200 10,575,680 5,670,720 2,764,800 Depreciation 16,000,000 2,946,200 979,800 192,000 6,609,800 3,544,200 1,728,000
Medium VoltageAmountItem Low Voltage

35June 17, 2008
Allocating O&M costs
Fixed Variable Customer Fixed Variable CustomerSalaries and Benefits 10,000,000 2,500,000 7,500,000 Billing Services 500,000 50,000 450,000 Customer Services 400,000 4,000 396,000 Operator's Fee 500,000 225,000 275,000 SAP 1,000,000 150,000 850,000 Third Party Services 400,000 120,000 280,000 Other Costs 1,100,000 220,000 880,000 Common Expenses 3,500,000 1,575,000 1,925,000 Total 17,400,000 4,790,000 50,000 4,000 11,710,000 450,000 396,000
Medium Voltage Low VoltageItem Amount

36June 17, 2008
Allocating the overall revenue requirement
Fixed Variable Customer Fixed Variable CustomerReturn 25,600,000 4,713,920 1,567,680 307,200 10,575,680 5,670,720 2,764,800 Depreciation 16,000,000 2,946,200 979,800 192,000 6,609,800 3,544,200 1,728,000 Costs 17,400,000 4,790,000 50,000 4,000 11,710,000 450,000 396,000 Total 59,000,000 12,450,120 2,597,480 503,200 28,895,480 9,664,920 4,888,800 % 100.00% 21.10% 4.40% 0.85% 48.98% 16.38% 8.29%
Allocation Factors MV LVFixed 21.10% 48.98%Variable 4.40% 16.38%Customer 0.85% 8.29%
Allocation MV LV TotalFixed 12,450,120 28,895,480 41,345,600 Variable 2,597,480 9,664,920 12,262,400 Customer 503,200 4,888,800 5,392,000 Total 15,550,800 43,449,200 59,000,000
Item Amount Medium Voltage Low Voltage

37June 17, 2008
Methods to allocate fixed costs
• Coincident Demand Method: based on the demands of the various classes of customers at the time of the system peak
• Non-coincident Demand Method: based on the actual peak demands of each customer class

38June 17, 2008
Allocating fixed medium voltage costs
• Allocation of costs according to the number of consumers weighted by different types of usage in the peak.
• Weights compare average consumption for each class of customer during the peak
Allocation of fixed costs for medium voltage: $12.5 M
Allocation factor: coincidental peak hours on the system
* For example, a commercial customer consumes 10 times morethan a residential during peak hours.
Weights Number of Clients
Weighted Number
Allocated Costs
(a) (b) (c)=(a)*(b) (d)=%(c)*CostResidential 1 1,250,000 1,250,000 6,511,569 Commercial 10 50,000 500,000 2,604,628 Industrial (LV) 70 7,000 490,000 2,552,535 Industrial (MV) 150 1,000 150,000 781,388 Total 1,308,000 2,390,000 12,450,120
Customer

39June 17, 2008
Allocating fixed low voltage costs
• Allocation of costs according to the number of consumers weighted by different types of usage from the sum of individual peaks.
• Weights compare average consumption for each class of customer for the sum of individual peaks
Allocation of fixed costs for low voltage: $28.9 M
Allocation factor: non-coincidental peak hours on the system
•For example, an industrial customer in low voltage consumes 10 times more than a residential customer at the non-coincidental peak.
Weights Number of Clients
Weighted Number
Allocated Costs
(a) (b) (c)=(a)*(b) (d)=%(c)*CostResidential 1 1,250,000 1,250,000 9,895,712 Commercial 10 50,000 500,000 3,958,285 Industrial (LV) 200 7,000 1,400,000 11,083,198 Industrial (MV) 500 1,000 500,000 3,958,285 Total 1,308,000 3,650,000 28,895,480
Customer

40June 17, 2008
Allocating variable medium voltage costs
• Allocation of costs according to usage in MV
Allocation of variable costs for medium voltage: $2.6 M
Allocation factor: usage in MV
GWh Weights Allocated Costs
(a) (b)=%(a)*GWh (c)=(b)*CostResidential 2,500 71.4% 1,855,343 Commercial 300 8.6% 222,641 Industrial (LV) 250 7.1% 185,534 Industrial (MV) 450 12.9% 333,962 Total 3,500 100.0% 2,597,480
Customer

41June 17, 2008
Allocating variable low voltage costs
• Allocation of costs according to usage in LV.
Allocation of fixed costs for low voltage: $9.7 M
Allocation factor: usage in LV
GWh Weights Allocated Costs
(a) (b)=%(a)*GWh (c)=(b)*CostResidential 2,500 82.0% 7,922,066 Commercial 300 9.8% 950,648 Industrial (LV) 250 8.2% 792,207 Industrial (MV)Total 3,050 100.0% 9,664,920
Customer

42June 17, 2008
Allocating customer costs
• Allocation of costs according to weighted customers using usage at the non-coincidental peak.
Allocation of customer costs: $5.4 M
Allocation factor: weighted customers
Weights Number of Clients
Weighted Number
Allocated Costs Charge
(a) (b) (c)=(a)*(b) (d)=%(c)*Cost (e)=(d)/(b)/12Residential 1 1,250,000 1,250,000 1,846,575 0.1231 Commercial 10 50,000 500,000 738,630 1.2311 Industrial (LV) 200 7,000 1,400,000 2,068,164 24.6210 Industrial (MV) 500 1,000 500,000 738,630 61.5525 Total 1,308,000 3,650,000 5,392,000
Customer
43June 17, 2008
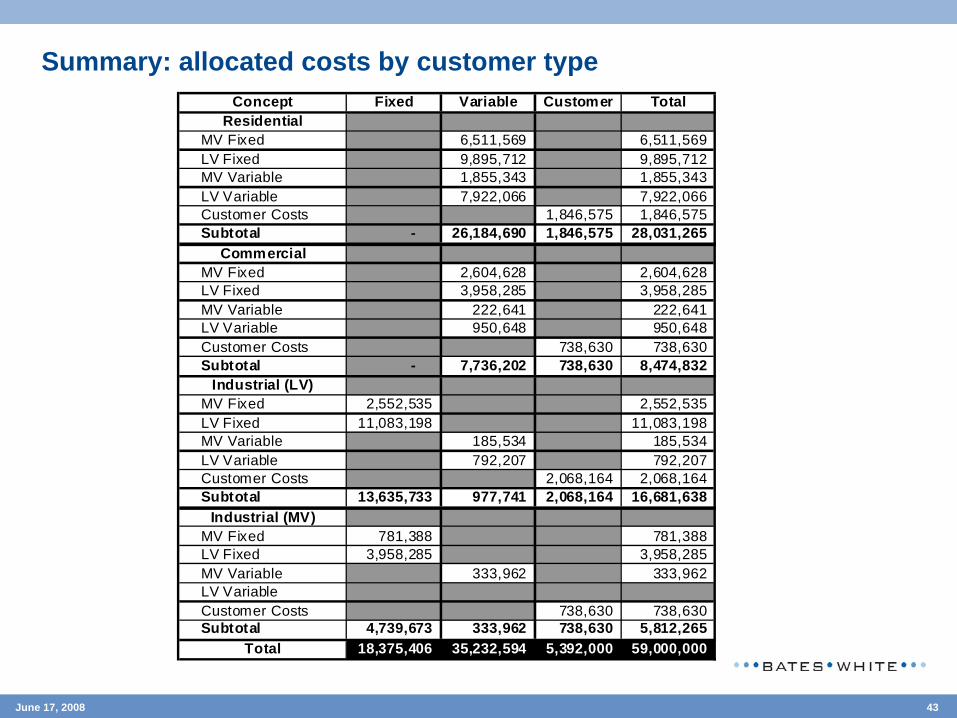
Summary: allocated costs by customer typeFixed Variable Customer Total
MV Fixed 6,511,569 6,511,569 LV Fixed 9,895,712 9,895,712 MV Variable 1,855,343 1,855,343 LV Variable 7,922,066 7,922,066 Customer Costs 1,846,575 1,846,575 Subtotal - 26,184,690 1,846,575 28,031,265
MV Fixed 2,604,628 2,604,628 LV Fixed 3,958,285 3,958,285 MV Variable 222,641 222,641 LV Variable 950,648 950,648 Customer Costs 738,630 738,630 Subtotal - 7,736,202 738,630 8,474,832
MV Fixed 2,552,535 2,552,535 LV Fixed 11,083,198 11,083,198 MV Variable 185,534 185,534 LV Variable 792,207 792,207 Customer Costs 2,068,164 2,068,164 Subtotal 13,635,733 977,741 2,068,164 16,681,638
MV Fixed 781,388 781,388 LV Fixed 3,958,285 3,958,285 MV Variable 333,962 333,962 LV VariableCustomer Costs 738,630 738,630 Subtotal 4,739,673 333,962 738,630 5,812,265
18,375,406 35,232,594 5,392,000 59,000,000 Total
ConceptResidential
Commercial
Industrial (LV)
Industrial (MV)

44June 17, 2008
Rate design
• Allocated fixed costs are divided by peak demand (and further by 12 to reflect monthly rates).
Exception: Residential and commercial customers - annual usage
• Divide variable costs by annual usage for the calculation of charges for each kWh.
• Customer costs are allocated to each type of customer using an equivalent users method and divided by the number of customers.
45June 17, 2008
Calculating rates: final steps
• Add charges for each category of costs to determine two part or three part rates.
• Verify with the revenue requirement check that the rates allow the company to recover all of its costs.

46June 17, 2008
The resulting rates
(a) (b) (c)=(a)/(b)
Variable ($/kWh) 26,184,690 2,500,000,000 0.0105 Customer Charge ($/month) 1,846,575 15,000,000 0.1231
Variable ($/kWh) 7,736,202 300,000,000 0.0258 Customer Charge ($/month) 738,630 600,000 1.2311
Variable ($/kWh) 977,741 250,000,000 0.0039 Customer Charge ($/month) 2,068,164 84,000 24.6210 Demand ($/kW/month) 13,635,733 600,000 22.7262
Variable ($/kWh) 333,962 450,000,000 0.0007 Customer Charge ($/month) 738,630 12,000 61.5525 Demand ($/kW/month) 4,739,673 960,000 4.9372
Billing Determinant
Cost RateConcept
Residential
Commercial
Industrial (LV)
Industrial (MV)
47June 17, 2008
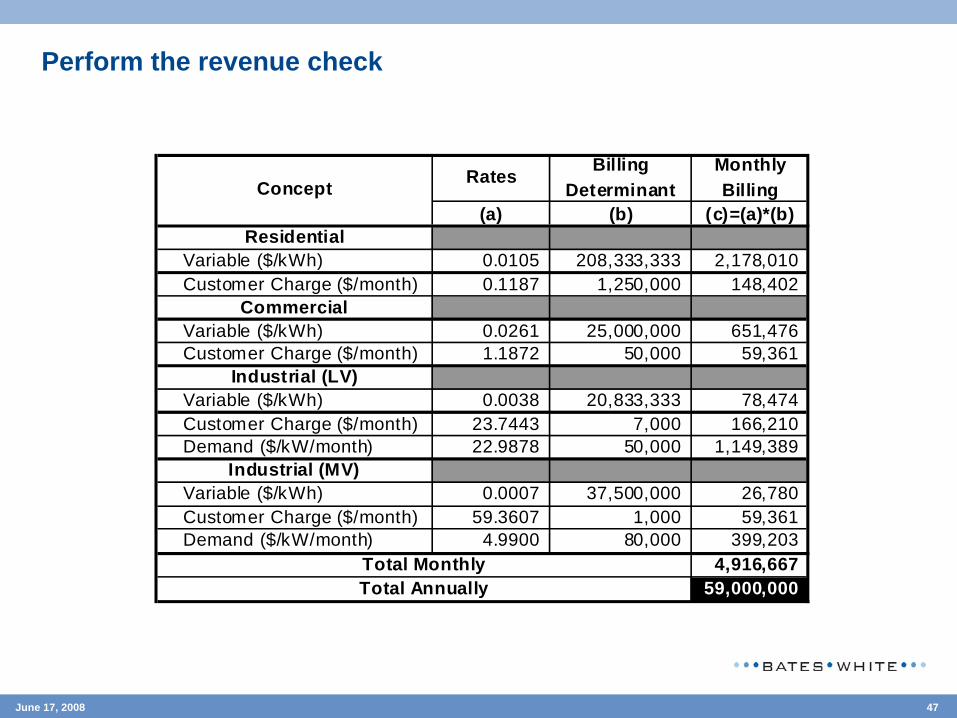
Perform the revenue check
(a) (b) (c)=(a)*(b)
Variable ($/kWh) 0.0105 208,333,333 2,178,010 Customer Charge ($/month) 0.1187 1,250,000 148,402
Variable ($/kWh) 0.0261 25,000,000 651,476 Customer Charge ($/month) 1.1872 50,000 59,361
Variable ($/kWh) 0.0038 20,833,333 78,474 Customer Charge ($/month) 23.7443 7,000 166,210 Demand ($/kW/month) 22.9878 50,000 1,149,389
Variable ($/kWh) 0.0007 37,500,000 26,780 Customer Charge ($/month) 59.3607 1,000 59,361 Demand ($/kW/month) 4.9900 80,000 399,203
4,916,667 59,000,000
Total MonthlyTotal Annually
Billing Determinant
Rates
Industrial (LV)
Industrial (MV)
Monthly BillingConcept
Residential
Commercial

Consultant’s Findings

49June 17, 2008
Consultant’s findings
The regulator has hired a consultant who recommends the following:• Functionalization: the consultant found that there were $0.5 million in common
expenses allocated to regulated costs that belong to unregulated activities;• Operator’s Fees: the consultant recommends disallowing $0.5 million in
operator’s fees because it says that although it was recognized for the first five years and there are services performed by the technical operator, the company managers should know by now how to run the company on their own;
• SAP: the consultant recommends to disallow $1 million in expenses in a SAP update that is done every four years; and
• Investments: the consultant reviewed each investment done in the last five years and recommends the following disallowances:
$5 million in new lines investment because the works done included a 15% charge for engineering design and management for the construction company in charge of a large project. Similar works in that country have those charges but the consultant used electric works done in El Salvador and Argentina as examples of lower percentages;$10 million in transformers because the company installed 15 kV transformers for new residential users in middle class neighborhoods without seeking approval from the regulator, hoping that in the next few decades demand from those customers would increase. The consultant used 10 kV transformers in its calculation; and$25 million from the cost of new materials. The consultant used prices he found in the internet in Colombia, Mexico, Netherlands, China and a few other countries for large purchases and internalized those costs using shipping rates for direct routes.

50June 17, 2008
Commission staff recommendation to the Commissioners
After requesting more data from the company and holding discussions:
• Functionalization: disallow $0.5 million in common expenses;
• Operator’s Fees: allow the charges since services were provided and the provision of those services would have cost more if done in-house;
• SAP: include an annuity for the update as an expense and disallow the difference; and
• Investments: for each of the three recommendations:Ignore the $5 million disallowance since it is common practice in the country to hire international construction firms that charge those percentages;
Disallow $10 million in transformers and allow the company to book it as an asset not in use to be included if and when the demand prediction of the company becomes reality; and
Ignore the $25 million disallowance since the recommendation by the consultant cannot hold water. Shipping might be more expensive, the local construction companies might not have access to the markets mentioned and the consultant forgot that some imported materials pay duties.

Amended rate proposal
52June 17, 2008
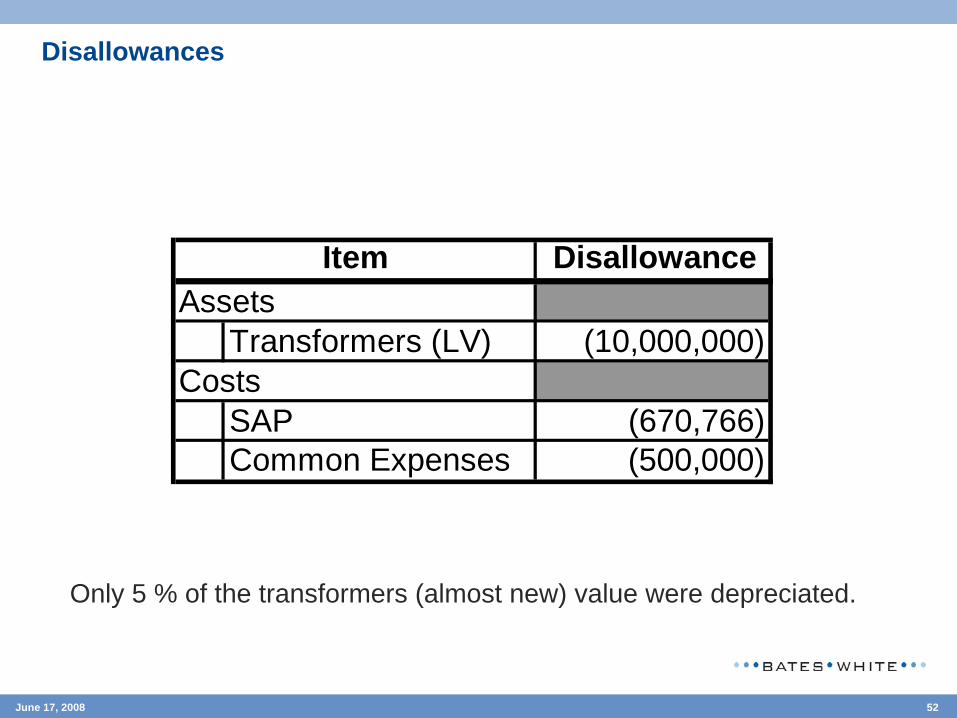
Disallowances
Only 5 % of the transformers (almost new) value were depreciated.
DisallowanceAssets
Transformers (LV) (10,000,000) Costs
SAP (670,766) Common Expenses (500,000)
Item

53June 17, 2008
Assumptions for calculating rates: revised capital assets
Assets Amount Medium Voltage StudyLines 157,000,000 45% F-V (70-30)Poles 53,000,000 30% FixedTransformers 122,000,000 5.41% F-V (50-50)Meters and Service Lines 48,000,000 10% CustomerOther 10,000,000 50% FixedTotal 390,000,000
54June 17, 2008
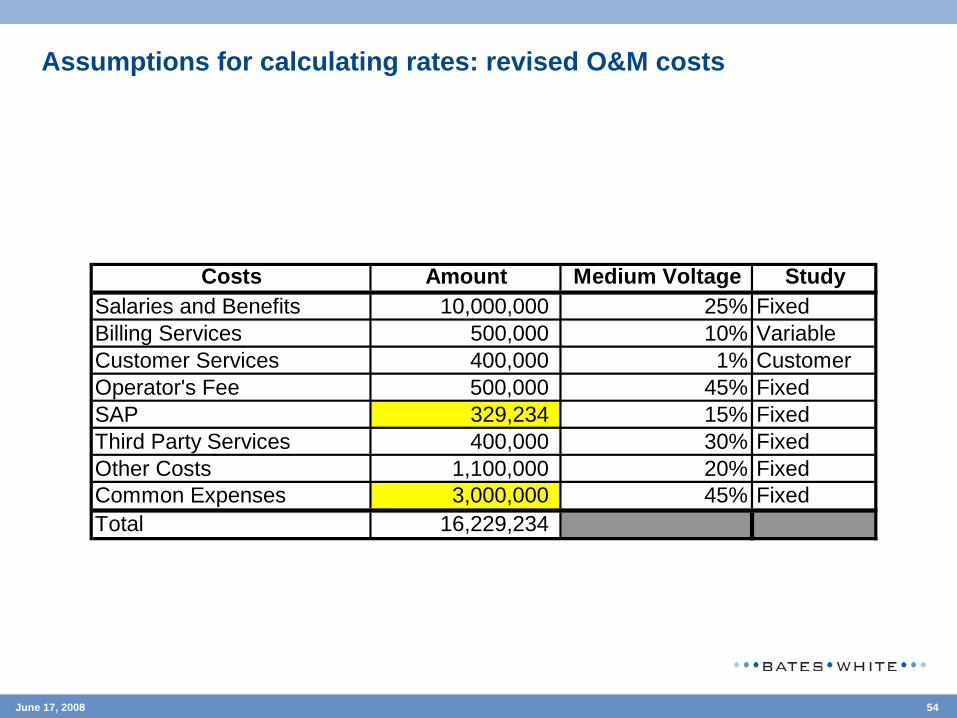
Assumptions for calculating rates: revised O&M costs
Costs Amount Medium Voltage StudySalaries and Benefits 10,000,000 25% FixedBilling Services 500,000 10% VariableCustomer Services 400,000 1% CustomerOperator's Fee 500,000 45% FixedSAP 329,234 15% FixedThird Party Services 400,000 30% FixedOther Costs 1,100,000 20% FixedCommon Expenses 3,000,000 45% FixedTotal 16,229,234

55June 17, 2008
Assumptions for calculating rates: revised depreciation
Item ValueWorking Capital 10,000,000 Gross Asset Base 390,000,000 Accumulated Depreciation 63.97%Annual O&M Costs 16,229,234 Rate of Return 12%Average Life (years) 25 Tax rate 25%
Revenue Requirement
56June 17, 2008
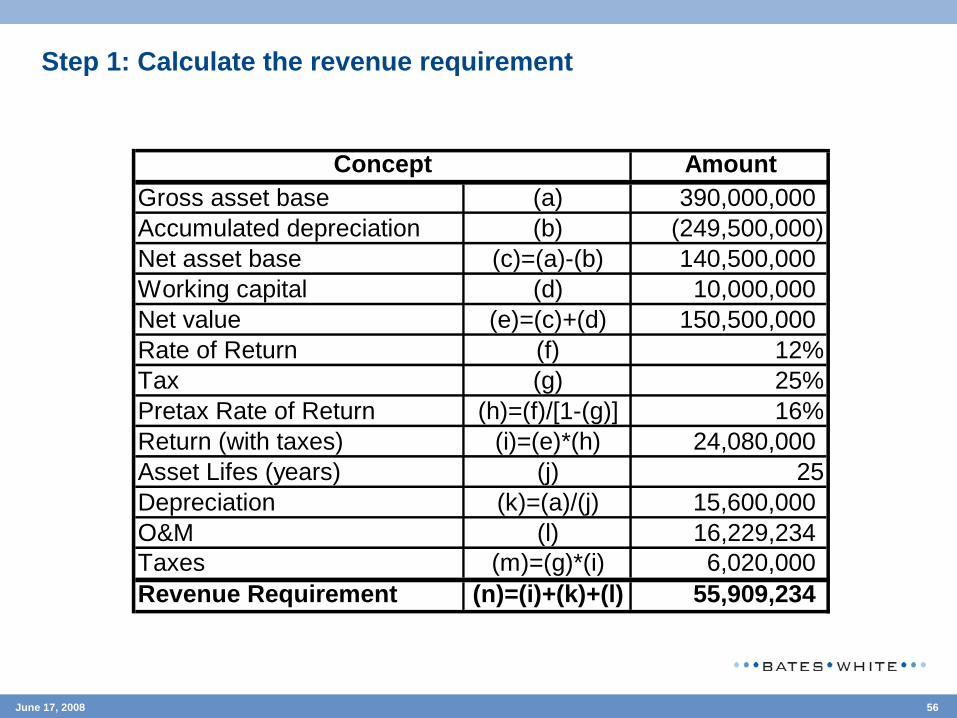
Step 1: Calculate the revenue requirement
AmountGross asset base (a) 390,000,000 Accumulated depreciation (b) (249,500,000) Net asset base (c)=(a)-(b) 140,500,000 Working capital (d) 10,000,000 Net value (e)=(c)+(d) 150,500,000 Rate of Return (f) 12%Tax (g) 25%Pretax Rate of Return (h)=(f)/[1-(g)] 16%Return (with taxes) (i)=(e)*(h) 24,080,000 Asset Lifes (years) (j) 25Depreciation (k)=(a)/(j) 15,600,000 O&M (l) 16,229,234 Taxes (m)=(g)*(i) 6,020,000 Revenue Requirement (n)=(i)+(k)+(l) 55,909,234
Concept

57June 17, 2008
Staff’s proposed rate increase
(a) (b) (c)=(a)*(b)
Variable ($/kWh) 0.0100 2,500,000,000 25,000,000 Customer Charge ($/month) 0.1100 15,000,000 1,650,000
Variable ($/kWh) 0.0230 300,000,000 6,900,000 Customer Charge ($/month) 1.2000 600,000 720,000
Variable ($/kWh) 0.0038 250,000,000 950,000 Customer Charge ($/month) 20.0000 84,000 1,680,000 Demand ($/kW/month) 22.5000 600,000 13,500,000
Variable ($/kWh) 0.0008 450,000,000 360,000 Customer Charge ($/month) 55.0000 12,000 660,000 Demand ($/kW/month) 4.6000 960,000 4,416,000
55,836,00055,909,234
0.13%
Concept Rates Billing Determinant
Annual Billing
Residential
Commercial
Industrial (LV)
Industrial (MV)
Billings at Current RatesBillings at Proposed Rates
Tariff Increase

58June 17, 2008
Allocating costs
Fixed Variable Customer Fixed Variable CustomerLines 157,000,000 49,455,000 21,195,000 60,445,000 25,905,000 Poles 53,000,000 15,900,000 37,100,000 Transformers 122,000,000 3,300,000 3,300,000 57,700,000 57,700,000 Meters and Service Lines 48,000,000 4,800,000 43,200,000 Other 10,000,000 5,000,000 5,000,000 Total Assets 390,000,000 73,655,000 24,495,000 4,800,000 160,245,000 83,605,000 43,200,000 Accumulated Depreciation (249,500,000) (47,120,314) (15,670,519) (3,070,769) (102,515,712) (53,485,763) (27,636,923) Working Capital (WK) 10,000,000 5,000,000 5,000,000 Net Assets and WK 150,500,000 31,534,686 8,824,481 1,729,231 62,729,288 30,119,237 15,563,077 Return 24,080,000 5,045,550 1,411,917 276,677 10,036,686 4,819,078 2,490,092 Depreciation 15,600,000 2,946,200 979,800 192,000 6,409,800 3,344,200 1,728,000
Fixed Variable Customer Fixed Variable CustomerSalaries and Benefits 10,000,000 2,500,000 7,500,000 Billing Services 500,000 50,000 450,000 Customer Services 400,000 4,000 396,000 Operator's Fee 500,000 225,000 275,000 SAP 329,234 49,385 279,849 Third Party Services 400,000 120,000 280,000 Other Costs 1,100,000 220,000 880,000 Common Expenses 3,000,000 1,350,000 1,650,000 Total 16,229,234 4,464,385 50,000 4,000 10,864,849 450,000 396,000
Medium Voltage Low VoltageItem Amount
Medium VoltageAmountItem Low Voltage

59June 17, 2008
Allocating the revenue requirement
Fixed Variable Customer Fixed Variable CustomerReturn 24,080,000 5,045,550 1,411,917 276,677 10,036,686 4,819,078 2,490,092 Depreciation 15,600,000 2,946,200 979,800 192,000 6,409,800 3,344,200 1,728,000 Costs 16,229,234 4,464,385 50,000 4,000 10,864,849 450,000 396,000 Total 55,909,234 12,456,135 2,441,717 472,677 27,311,335 8,613,278 4,614,092 % 100.00% 22.28% 4.37% 0.85% 48.85% 15.41% 8.25%
Allocation Factors MV LVFixed 22.28% 48.85%Variable 4.37% 15.41%Customer 0.85% 8.25%
Allocation MV LV TotalFixed 12,456,135 27,311,335 39,767,470 Variable 2,441,717 8,613,278 11,054,995 Customer 472,677 4,614,092 5,086,769 Total 15,370,529 40,538,706 55,909,234
Item Amount Medium Voltage Low Voltage

60June 17, 2008
Allocating fixed medium voltage costs
• Allocation of costs according to the number of consumers weighted by different types of usage in the peak.
• Weights compare average consumption for each class of customer during the peak
Allocation of fixed costs for medium voltage: $12.5 M
Allocation factor: coincidental peak hours on the system
* For example, a commercial customer consumes 10 times morethan a residential during peak hours.
Weights Number of Clients
Weighted Number
Allocated Costs
(a) (b) (c)=(a)*(b) (d)=%(c)*CostResidential 1 1,250,000 1,250,000 6,514,715 Commercial 10 50,000 500,000 2,605,886 Industrial (LV) 70 7,000 490,000 2,553,768 Industrial (MV) 150 1,000 150,000 781,766 Total 1,308,000 2,390,000 12,456,135
Customer

61June 17, 2008
Allocating fixed low voltage costs
• Allocation of costs according to the number of consumers weighted by different types of usage from the sum of individual peaks.
• Weights compare average consumption for each class of customer for the sum of individual peaks
Allocation of fixed costs for low voltage: $27.3 M
Allocation factor: non-coincidental peak hours on the system
•For example, an industrial customer in low voltage consumes 10 times more than a residential at the non-coincidental peak.
Customer Weights Number of Clients
Weighted Number
Allocated Costs
(a) (b) (c)=(a)*(b) (d)=%(c)*CostResidential 1 1,250,000 1,250,000 9,353,197 Commercial 10 50,000 500,000 3,741,279 Industrial (LV) 200 7,000 1,400,000 10,475,581 Industrial (MV) 500 1,000 500,000 3,741,279 Total 1,308,000 3,650,000 27,311,335

62June 17, 2008
Allocating variable medium voltage costs
• Allocation of costs according to usage in MV.
Allocation of variable costs for medium voltage: $2.4 M
Allocation factor: usage in MV
GWh Weights Allocated Costs
(a) (b)=%(a)*GWh (c)=(b)*CostResidential 2,500 71.4% 1,744,084 Commercial 300 8.6% 209,290 Industrial (LV) 250 7.1% 174,408 Industrial (MV) 450 12.9% 313,935 Total 3,500 100.0% 2,441,717
Customer

63June 17, 2008
Allocating variable low voltage costs
• Allocation of costs according to usage in LV.
Allocation of variable costs for low voltage: $8.6 M
Allocation factor: usage in LV
GWh Weights Allocated Costs
(a) (b)=%(a)*GWh (c)=(b)*CostResidential 2,500 82.0% 7,060,064 Commercial 300 9.8% 847,208 Industrial (LV) 250 8.2% 706,006 Industrial (MV)Total 3,050 100.0% 8,613,278
Customer

64June 17, 2008
Allocating customer costs
• Allocation of costs according to weighted customers using usage at the non-coincidental peak.
Allocation of customer costs: $5.1 M
Allocation factor: weighted customers
Weights Number of Clients
Weighted Number Allocated Costs Charge
(a) (b) (c)=(a)*(b) (d)=%(c)*Cost (e)=(d)/(b)/12Residential 1 1,250,000 1,250,000 1,742,044 0.1161 Commercial 10 50,000 500,000 696,818 1.1614 Industrial (LV) 200 7,000 1,400,000 1,951,090 23.2273 Industrial (MV) 500 1,000 500,000 696,818 58.0681 Total 1,308,000 3,650,000 5,086,769
Customer

65June 17, 2008
Summary: revised allocation of costs by customer typeFixed Variable Customer Total
MV Fixed 6,514,715 6,514,715 LV Fixed 9,353,197 9,353,197 MV Variable 1,744,084 1,744,084 LV Variable 7,060,064 7,060,064 Customer Costs 1,742,044 1,742,044 Subtotal - 24,672,059 1,742,044 26,414,104
MV Fixed 2,605,886 2,605,886 LV Fixed 3,741,279 3,741,279 MV Variable 209,290 209,290 LV Variable 847,208 847,208 Customer Costs 696,818 696,818 Subtotal - 7,403,662 696,818 8,100,480
MV Fixed 2,553,768 2,553,768 LV Fixed 10,475,581 10,475,581 MV Variable 174,408 174,408 LV Variable 706,006 706,006 Customer Costs 1,951,090 1,951,090 Subtotal 13,029,349 880,415 1,951,090 15,860,853
MV Fixed 781,766 781,766 LV Fixed 3,741,279 3,741,279 MV Variable 313,935 313,935 LV VariableCustomer Costs 696,818 696,818 Subtotal 4,523,045 313,935 696,818 5,533,797
17,552,394 33,270,072 5,086,769 55,909,234Total
ConceptResidential
Commercial
Industrial (LV)
Industrial (MV)
66June 17, 2008
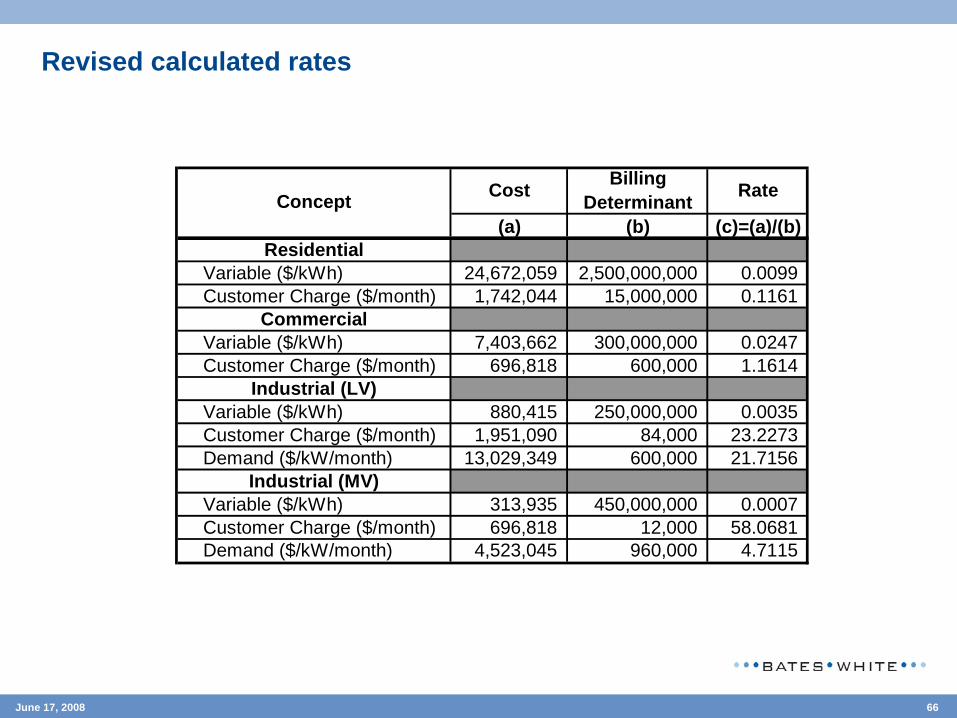
Revised calculated rates
(a) (b) (c)=(a)/(b)
Variable ($/kWh) 24,672,059 2,500,000,000 0.0099 Customer Charge ($/month) 1,742,044 15,000,000 0.1161
Variable ($/kWh) 7,403,662 300,000,000 0.0247 Customer Charge ($/month) 696,818 600,000 1.1614
Variable ($/kWh) 880,415 250,000,000 0.0035 Customer Charge ($/month) 1,951,090 84,000 23.2273 Demand ($/kW/month) 13,029,349 600,000 21.7156
Variable ($/kWh) 313,935 450,000,000 0.0007 Customer Charge ($/month) 696,818 12,000 58.0681 Demand ($/kW/month) 4,523,045 960,000 4.7115
Billing DeterminantCost RateConcept
Residential
Commercial
Industrial (LV)
Industrial (MV)

67June 17, 2008
Perform the revenue check
(a) (b) (c)=(a)*(b)
Variable ($/kWh) 0.0099 208,333,333 2,056,005 Customer Charge ($/month) 0.1161 1,250,000 145,170
Variable ($/kWh) 0.0247 25,000,000 616,972 Customer Charge ($/month) 1.1614 50,000 58,068
Variable ($/kWh) 0.0035 20,833,333 73,368 Customer Charge ($/month) 23.2273 7,000 162,591 Demand ($/kW/month) 21.7156 50,000 1,085,779
Variable ($/kWh) 0.0007 37,500,000 26,161 Customer Charge ($/month) 58.0681 1,000 58,068 Demand ($/kW/month) 4.7115 80,000 376,920
4,659,103 55,909,234
Monthly BillingConcept
Residential
Commercial
Total MonthlyTotal Annually
Billing DeterminantRates
Industrial (LV)
Industrial (MV)

Creating a social tariff

69June 17, 2008
Creating a social tariff
• The Minister reviewed the tariff proposal and called the company and the regulator
• Although his decision or suggestions are not binding, the Minister told the two parties that his Ministry would like to give a $1 million subsidy per year for poor customers and asked the two parties if they could create a social tariff for customers that consume under 75 kWh/month
• The regulator and the company agreed
• How would you create such tariff? Here is some additional information:Annual Usage Average
GWh kWh/monthResidential Customers
Up to 75 kWh/month 500,000 300 50.00 More than 75 kW h/month 750,000 2,200 244.44 Total 1,250,000 2,500 166.67
NumberItem

70June 17, 2008
Potential annual residential collections under the proposed tariff
(a) (b) (c)=(a)*(b)Variable ($/kWh) 0.0099 2,500,000,000 24,672,059 Customer Charge ($/month) 0.1161 15,000,000 1,742,044 Total 26,414,104
Up to 75 kWh/monthVariable ($/kWh) 0.0099 300,000,000 2,960,647 Customer Charge ($/month) 0.1161 6,000,000 696,818 Total 3,657,465
More than 75 kWh/monthVariable ($/kWh) 0.0099 2,200,000,000 21,711,412 Customer Charge ($/month) 0.1161 9,000,000 1,045,227 Total 22,756,639
Residential Rates Billing Determinant
Annual Billing

71June 17, 2008
Designing the social tariff
Alternatives
Comparison of Results
Which alternative is the most appropriate? Why?
(a) (b) (c)=(a)/(b)
Variable ($/kWh) 1,960,647 300,000,000 0.0065 Customer Charge ($/month) 696,818 6,000,000 0.1161
Variable ($/kWh) 2,657,465 300,000,000 0.0089 Customer Charge ($/month) - 6,000,000 -
Item Cost Billing Determinant Rate
Alternative 1: Reduce Variable
Alternative 2: Eliminate Fixed First
1 2Variable ($/kWh) 0.0099 0.0065 0.0089 Customer Charge ($/month) 0.1161 0.1161 -
Subsidy AlternativeTariff ProposalItem

Tariff summary

73June 17, 2008
Comparison of tariffs
Impact of social tariff
Existing NewAverage 50.00 0.61 0.44 -27.39%Maximum 75.00 0.86 0.66 -22.75%
Monthly Cost ($) % ChangekWh/monthItem
SocialVariable ($/kWh) 0.0100 0.0089 -11.42%Customer Charge ($/month) 0.1100 n.a.
Variable ($/kWh) 0.0100 0.0099 -1.31%Customer Charge ($/month) 0.1100 0.1161 5.58%
Variable ($/kWh) 0.0230 0.0247 7.30%Customer Charge ($/month) 1.2000 1.1614 -3.22%
Variable ($/kWh) 0.0038 0.0035 -7.32%Customer Charge ($/month) 20.0000 23.2273 16.14%Demand ($/kW/month) 22.5000 21.7156 -3.49%
Variable ($/kWh) 0.0008 0.0007 -12.80%Customer Charge ($/month) 55.0000 58.0681 5.58%Demand ($/kW/month) 4.6000 4.7115 2.42%
Industrial (LV)
Industrial (MV)
Existing % ChangeConcept New
Residential Non Social
Commercial
74June 17, 2008
For more information… please contact
Jonathan A. Lesser, Ph.D.
Bates White, LLC
1300 Eye Street, N.W.
Washington, DC 20005
(202) 747-5972 (work)
(202) 306-9372 (cell)
www.bateswhite.com
Leonardo R. Giacchino, Ph.D.
Bates White, LLC
1300 Eye Street, N.W.
Washington, DC 20005
(202) 747-2094 (work)
(202) 375-3673 (cell)
www.bateswhite.com