sector b socioeconomic conditions 1. …open_jicareport.jica.go.jp/pdf/11740495_012.pdfthe map...
TRANSCRIPT

The Study on Comprehensive Water Management of Musi River Basin in the Republic of Indonesia
Sector BFinal Report
JICA CTI Engineering International Co., Ltd. NIKKEN Consultants, Inc.
B - 1
SECTOR B
SOCIOECONOMIC CONDITIONS
1. ADMINISTRATIVE SYSTEM
The Republic of Indonesia is administratively divided into 27 provinces (Propinsi) and three special districts of Yogyakarta in central Java, Aceh in Sumatra, and the capital district of Jakarta as of September 2002. Each province is administrated by a provincial government with its own representative assembly (Dewan Perwakilan Rakyat Daerah or DPRD). The provincial government is headed by a Governor, who is appointed by the President. As a result of the regional autonomy legislation enacted in 2000 and implemented gradually from 2001, greater autonomy and power are being devolved to regional authorities. Districts/Municipalities are the basic units of regional government system. Matters which affect over one District/Municipality are assumed by Provinces while those over one Province are assumed by the Central Government. The administrative hierarchy is summarized in Table B1.0.1:
Table B1.0.1 Administrative Hierarchy of Indonesia
Territory Head Nation (Negara) President (Presiden) Level I Province (Propinsi) Governor (Gubernur) Level II District/Municipality
(Kabupaten/Kotamadya) Regent/Mayor (Bupati/Walikotamadya)
Level III District (Kecamatan) District Head (Camat) Level IV Ward (Kelurahan) in urban areas
Village (Desa) in rural areas Ward Chief (Lurah) Village Chief (Kepala Desa)
In line with the decentralization, the restructuring of the local autonomy is under way in South Sumatra Province. Since the restructuring was conducted quite recently, almost all the available data on socioeconomic conditions are still based on the previous administrative systems. Therefore, in this study, the previous administrative division is used to grasp the socioeconomic condition of the study area. The relation of the previous system and the latest one are summarized in Table B1.0.2:

Sector B Final Report
The Study on Comprehensive Water Management ofMusi River Basin in the Republic of Indonesia
B - 2 JICA CTI Engineering International Co., Ltd. NIKKEN Consultants, Inc.
Table B1.0.2 Restructuring of Autonomy in South Sumatra Province
Previous Administrative Division New autonomy as of September 2002 Kotamadya Palembang Kotamadya Palembang
Kab. Musibanyuasin Kab. Musibanyuasin Kab. Banyuasin Kab. Muaraenim Kab. Muaraenim Kotamadya Prabumulih Kab. Lahat Kab. Lahat Kotamadya Pagaralam Kab. Musirawas Kab. Musirawas Kotamadya Lubuk Linggau
Kab. Ogan Komering Ilir Kab. Ogan Komering Ilir Kab. Ogan Komering Ulu Kab. Ogan Komering Ulu
The Musi River Basin stretches over four provinces. South Sumatra, Bengkulu, and Jambi occupy approximately 96%, 3.6%, 0.4% of total basin area, respectively while Lampung occupies the small areas along its provincial boundary.
The map showing the administrative boundaries and sub-basin boundaries of the Musi River are presented in Annex B1.0.1.
Study area for each Kabupaten is shown in Table B1.0.3.
Table B1.0.3 Area by Kabupaten
Province and Kabupaten Musi River Basin (km2)
South Sumatra
Ogan Komering Ulu* 10,762
Ogan Komering Ilir 5,349
Muaraenim 8,909
Lahat 6,839
Musirawas 13,261
Musibanyuasin 12,212
Palembang 235
Bengkulu
Rejang Lebong 2,130
Jambi
Batan Hari & Others 245
Total South Sumatra 57,567
Total Study Area 59,942 *: including Lampung Province

The Study on Comprehensive Water Management of Musi River Basin in the Republic of Indonesia
Sector BFinal Report
JICA CTI Engineering International Co., Ltd. NIKKEN Consultants, Inc.
B - 3
2. DEVELOPMENT PLANS
The Government of Indonesia has two kinds of development plans at national level. One is Twenty-Five Year Long Term Plan (PJP) and another is Five-Year Development Plan (PROPENAS, former REPELITA). The outlines of the plans are as described in the following sub-sections.
2.1 The Second Twenty-Five Year Long-Term Development Plan (PJP II)
The first Twenty-five Year Long-term Development Plan (PJP I) started from April 1969 and completed in March 1994 and during the same period, the Five-Year Development Plans (REPRITA) I to V had been completed. Indonesia had made remarkable economic growth in this period including water resources development and self-sufficient in rice.
Since April 1994, the Second Twenty-Five Year Long Term Plan (PJP II, April 1994-March 2019) and the Sixth Five-Year Development Plan (REPELITA VI, 1994-1998) have been started simultaneously. In PJP II, Indonesia aims to enter “the take-off stage” in the effort to become a developed, just, prosperous and self-reliant nation. The plan includes the following challenges:
1) Sustaining high economic growth,
2) Increasing equitable development,
3) Resolving the unemployment and underemployment problems,
4) Improving the quality of human resources,
5) Developing science and technology,
6) Conservation of natural resources and the environment, and
7) Development of law, social institutions, and national culture
The comparison between the results of PJP I and the targets of PJP II is summarized in Table B2.1.1.

Sector B Final Report
The Study on Comprehensive Water Management ofMusi River Basin in the Republic of Indonesia
B - 4 JICA CTI Engineering International Co., Ltd. NIKKEN Consultants, Inc.
Table B2.1.1 Results of PJP I and Targets of PJP II
Item PJP I (1969 - 1994) Results PJP II (1994 - 2018) Targets
1. Average annual economic growth rate 6.8 % 7 % 2. Population growth rate in the 1970s: 2.3 %
in the 1990s: 1.6 % by the end of PJP II: 0.88 %
3. Per capita income beginning: US$ 70 final : US$ 650 (nominal)
by the end of PJP II: US$ 2,600
4. Average life expectancy beginning : 45.7 years final : 62.7 years
by the end of PJP II: 70 years and up
5. Infant mortality rate (per 1000 births) in 1967 : 145 persons in 1993 : 58 persons
by the end of PJP II: 26 persons
6. Elementary school attendance rate in 1968 : 41 % in 1993 : 100 %
7. Junior high school attendance rate in 1968 : 17 % in 1993 : 53 %
to make compulsory education within 10 years, at latest 15 years
With regard to water resources, the emphasis is placed on sustainable development, more effective and efficient management of water resources in an integrated manner. In addition, greater attention is placed on sustaining self-sufficiency in rice and on the O&M of water resources infrastructure.
Another challenges emphasized in PJP II is to ensure the preservation of a balance between economic growth and the conservation of natural resources and the environment, by maintaining a sustainable development process.
2.2 Five Year National Development Program (PROPENAS), 2000-2004
In 1999, the new Government moved to redraw its development strategy, articulated by the General Guideline for National Development, 1999-2004 (GBHN). The GBHN was approved by the People's Consultative Assembly (MPR) on October 19, 1999. It sets forth guidelines for conducts of Government organizations and the entire nation toward sustainable and enhanced development. Among the key issues, underlined in the present Study are: Re-organization of the Government administration system focusing on the regional autonomy and transparency of public finance; and Globalization of the national and regional economy through introducing open market mechanism and fair competition.
Based on the GBHN, the medium-term development strategy, Five Year National Development Program (PROPENAS, 2000-2004), was presented in October 2000. PROPENAS is based on decentralization policy in all aspects of national development, which is quite different from the past development plans. It sets out the following five broad national objectives:
1) Ensure national cohesion and social stability;
2) Achieve good governance and rule of law;

The Study on Comprehensive Water Management of Musi River Basin in the Republic of Indonesia
Sector BFinal Report
JICA CTI Engineering International Co., Ltd. NIKKEN Consultants, Inc.
B - 5
3) Accelerate economic recovery and strengthen the foundations for sustained growth;
4) Develop the social sectors and human welfare; and
5) Strengthen regional autonomy, rural and urban development, and structural poverty programs.
PROPENAS has been further articulated with the following development programs to encourage recovery and sustainable development of the economy.
1) To alleviate poverty fulfilling the basic needs of the people including manpower development, social security system, and agricultural development
2) To develop micro, small and medium sized businesses and cooperatives
3) To stabilize the economy and financial system including proper management of government debt, reducing dependency on foreign loans, restructuring of bank and corporate, and implementation of economic decentralization
4) To increase competitiveness by promoting non-oil/gas exports, industries, market institutions, tourism, and science & technology
5) To increase investment
6) To make available of facilities and infrastructure for supporting economic development
7) Sustainable utilization of natural resources
Comparison of the macro-economic targets between REPELITA VI (1994-1999) and PROPENAS (2000-2004) is summarized in Table B2.2.1.
Table B2.2.1 Comparison of REPELITA VI (1994-1999) and PROPENAS (2000-2004)
Item REPELITA VI (1994 - 1999) Targets
PROPENAS (2000 - 2004) Targets
1. Average annual economic growth rate
Agriculture Manufacturing industry (Non-oil/gas manufacturing) Other
6.2 % (increase from 6.0 % to 6.6 %) 3.4 % 9.4 % 10.3 % 6.0 %
4-5% in 2000 to 6-7% in 2004 1.4% in 2000 to 2.9% in 2004 4.8% in 2000 to 9.2% in 2004 5.5% in 2000 to 10.0% in 20045.3% in 2000 to 6.4% in 2004
2. Population growth rate lower from 1.66 % to 1.51 % 3. Per capita income (Nominal) - ditto - (Real terms)
US$ 1,000 US$ 775
US$760 in 2000 to US$1,312 in 2004 US$616 in 2000 to US$783 in 2004
4. Tax share in revenue increase from 64 % to 77 % 58% in 2000 to 83% in 2004 5. Total investment 1998/99: Rp.660 trillion 6. Inflation rate control at about 5 % 7-9% in 2000 to 3-5% in 2004 7. Ratio of outstanding debt to GDP lower from 57 % to 46 % 99.2% in 2000 to 45.7 in 2004 8. DSR lower from 31 % to 21 % 9. Ratio of foreign aid lower from 38 % to 32 %
(Continuing)
Sector B Final Report
The Study on Comprehensive Water Management ofMusi River Basin in the Republic of Indonesia
B - 6 JICA CTI Engineering International Co., Ltd. NIKKEN Consultants, Inc.
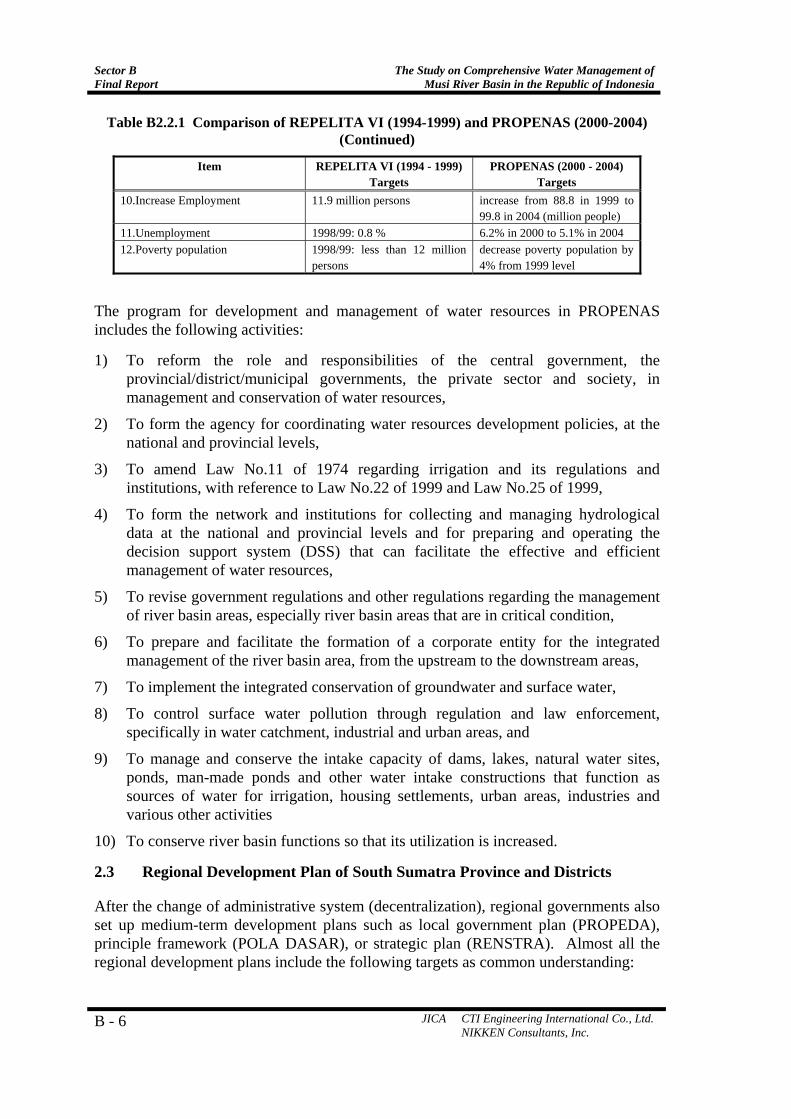
Table B2.2.1 Comparison of REPELITA VI (1994-1999) and PROPENAS (2000-2004) (Continued)
Item REPELITA VI (1994 - 1999) Targets
PROPENAS (2000 - 2004) Targets
10.Increase Employment 11.9 million persons increase from 88.8 in 1999 to 99.8 in 2004 (million people)
11.Unemployment 1998/99: 0.8 % 6.2% in 2000 to 5.1% in 2004 12.Poverty population 1998/99: less than 12 million
persons decrease poverty population by 4% from 1999 level
The program for development and management of water resources in PROPENAS includes the following activities:
1) To reform the role and responsibilities of the central government, the provincial/district/municipal governments, the private sector and society, in management and conservation of water resources,
2) To form the agency for coordinating water resources development policies, at the national and provincial levels,
3) To amend Law No.11 of 1974 regarding irrigation and its regulations and institutions, with reference to Law No.22 of 1999 and Law No.25 of 1999,
4) To form the network and institutions for collecting and managing hydrological data at the national and provincial levels and for preparing and operating the decision support system (DSS) that can facilitate the effective and efficient management of water resources,
5) To revise government regulations and other regulations regarding the management of river basin areas, especially river basin areas that are in critical condition,
6) To prepare and facilitate the formation of a corporate entity for the integrated management of the river basin area, from the upstream to the downstream areas,
7) To implement the integrated conservation of groundwater and surface water,
8) To control surface water pollution through regulation and law enforcement, specifically in water catchment, industrial and urban areas, and
9) To manage and conserve the intake capacity of dams, lakes, natural water sites, ponds, man-made ponds and other water intake constructions that function as sources of water for irrigation, housing settlements, urban areas, industries and various other activities
10) To conserve river basin functions so that its utilization is increased.
2.3 Regional Development Plan of South Sumatra Province and Districts
After the change of administrative system (decentralization), regional governments also set up medium-term development plans such as local government plan (PROPEDA), principle framework (POLA DASAR), or strategic plan (RENSTRA). Almost all the regional development plans include the following targets as common understanding:

The Study on Comprehensive Water Management of Musi River Basin in the Republic of Indonesia
Sector BFinal Report
JICA CTI Engineering International Co., Ltd. NIKKEN Consultants, Inc.
B - 7
1) Development of human resources, 2) Economic development by making good use of local resources and characteristics, 3) Balanced development for environmental conservation and sustainable
development, and 4) Development of basic infrastructure especially for isolated areas
The major targets of South Sumatra Province and Districts are summarized below and summary of the development plans by sector is presented in Annex B2.3.1.
2.3.1 South Sumatra Province (Strategic Plan, 2001-2003)
(1) Vision
To empower individual, social stratum and society group to participate actively in regional development of South Sumatra Province, which is a part of Unity Nation of Republic of Indonesia.
(2) Mission
• To improve quality of human resources,
• To open opportunity for all society members to participate for development,
• To make and/or implement the policy so that the policy can involve wider part of society,
• To develop the region according to the potential of local human resources and local society's aspiration,
• To increase the accessibility and participation of isolated areas for balanced development, and
• To control development activities for environmental conservation and sustainable development
(3) Target
• To improve social health so that people can work productively,
• To improve educational level of society and/or skill to fulfill requirement for development,
• To increase religion knowledge and quality of religious living,
• To create appropriate condition so that society participation for development activities can be increased,
• To make and/or evaluate the policy, law and regulation so that they concern wider part of the society and consistent implementation of law enforcement,

Sector B Final Report
The Study on Comprehensive Water Management ofMusi River Basin in the Republic of Indonesia
B - 8 JICA CTI Engineering International Co., Ltd. NIKKEN Consultants, Inc.
• To develop/build economic system based on management of local resources,
• To develop/build and improve the facilities and infrastructures which are basis for supporting economic activities and also for isolated regions, and
• To maintain good balance between economic growth and environmental conservation so that expected development can be continued.
(4) Strategy Relating to this Study
• To develop elementary facilities and basic facilities, which are required to support the growth of various development sectors. The facilities include transport, irrigation, telecommunication, clean water, and energy. Without these basic facilities, optimum development of various sectors will not be possible, and
• To manage natural resources carefully by balancing both economic growth and continuation of environmental function.
2.3.2 Kotamadya Palembang (Principle Framework, 2001-2005)
(1) Vision
Vision of Palembang for the year 2001-2005 shall be "Historic Town Palembang - as the center of commerce and services".
(2) Mission
• To preserve and develop heritage and culture,
• To arrange riverfront area and improve culture of river environment,
• To develop and arrange industry based on the idea that Palembang as the regional center of commerce and services,
• To implement good government services,
• To improve the quality of human resources, and
• To develop, maintain, and optimize facilities and infrastructure of the city.
(3) Target
• Reflecting Palembang as old town in Indonesia and the center of Sriwijaya Monarchy and Sultanate of Palembang Darussalam and develop tourism industry,
• To make use of river as economic aorta, alternative transport reflecting Palembang as Waterfront City,
• To create new job opportunity and to improve earnings of society,

The Study on Comprehensive Water Management of Musi River Basin in the Republic of Indonesia
Sector BFinal Report
JICA CTI Engineering International Co., Ltd. NIKKEN Consultants, Inc.
B - 9
• To develop and manage convenient, safe, and pleasure shopping center,
• To prepare quality of human resources to support development of Palembang city in globalization and regional autonomy era, and
• To fulfill requirement of facilities and infrastructures which are adequate to supports dynamic, harmonized and convenient living.
2.3.3 Kabupaten Ogan Komering Ulu (Local Government Plan, 2001-2005)
(1) Vision
To realize peaceful, democratic, sovereign, competitive, progressive, and welfare Ogan Komering Ulu society as a part of Republic of Indonesia.
(2) Mission
• To practice five principles (pancasila) consistently in social and national lives,
• To realize and raise the sovereignty, law enforcement, and human rights in all of living aspects based on justice and the truth,
• To increase practicing of religion theory in daily lives,
• To empower the societies and all regional economic powers including small and medium entrepreneurs and also cooperatives by developing a system that is fairly based on natural and human resources, which are productive, forwardly, competitive, and sustainable,
• To implement regional autonomy by mobilizing all regions' potential optimally and integrated in order to achieve balanced regional development,
• To realize social welfare by increasing quality of life and give major attention toward fulfilling basic needs for society such as food, healthiness, education, job opportunity, clothes and houses, and
• To realize government organization that is professional, productive, objective, transparent, free from corruption, collusion, and nepotism.
(3) Target
To create posture and society autonomy eagerness in planning and implementation of regional development that reflects increase of participation, efficiency, professionalism and productivity in all society groups and followed by more increase of living standard and both physical & spiritual welfare.

Sector B Final Report
The Study on Comprehensive Water Management ofMusi River Basin in the Republic of Indonesia
B - 10 JICA CTI Engineering International Co., Ltd. NIKKEN Consultants, Inc.
(4) Strategy
For next five years, stress is put on agriculture sector, especially food and horticultural agriculture, estate, livestock and fishery that will be supported by quality of human resources and mutual relation and integration with other development.
2.3.4 Kabupaten Ogan Komering Ilir (Principle Framework, 2001-2004)
(1) Vision
To realize Ogan Komering Ilir that has discipline, devout, autonomy and welfare through the society empowerment.
(2) Mission
• To increase the quality of human resources with healthiness, education, discipline, and good character,
• To increase social stability, decency, and appeasement by respecting human rights and democracy,
• To increase government organizations' performance for good government services,
• To increase society participation in management of village development,
• To develop agribusiness by giving priority for agro industry, institutional reinforcement, food security, and marketing,
• To develop national industry trading zone by joint venture and cooperation between region,
• To develop accessibility and to maintain facility and infrastructure of communication and transportation, and
• To preserve and manage natural resources and environment.
2.3.5 Kabupaten Muaraenim (Principle Framework, 1999/2000-2003/2004)
(1) Vision
To empower all the people in Muaraenim District in economically, socially, legally and politically.
The development must reach and the results should be enjoyed by all the people in Muaraenim District without discrimination of ethnicity, race or religion. Development in Muaraenim District is oriented to growth distribution proportionally, that is suitable for potential of natural resources and local human resources potential. Even though development growth is rapid based on local

The Study on Comprehensive Water Management of Musi River Basin in the Republic of Indonesia
Sector BFinal Report
JICA CTI Engineering International Co., Ltd. NIKKEN Consultants, Inc.
B - 11
resources potential, subsidy will remain in order to guarantee development distribution in all of area of Muaraenim district.
Extent of society empowerment is not only for economic aspect, but also by evaluating other development sectors, mainly social, legal and political aspects.
(2) Mission
• To increase income for all the people in Muaraenim District, mainly for economically weak class, at least all the people should be fulfilled with major basic requirement,
• To increase social welfare for all the people in Muaraenim District, so that educational level can reach suitable academic ability, and to improve quality of health services and to keep all of religious activities safely,
• To increase the understanding for all the people in Muaraenim District about their rights, duties, regulations, and laws, also for every one has law protection based on justice and truth, and
• To increase the latitude for people in Muaraenim District to participate in political aspiration by holding responsibility.
Development in Muaraenim district directly focus to:
• Implementation of physical and non-physical development in order to empower all the society strata and groups, and
• To support the first level regional development (South Sumatra Province), and wider to support national development.
2.3.6 Kabupaten Lahat (Strategic Plan, 2001-2005)
(1) Vision
To realize the welfare through society empowerment by continuous economic development of the nation.
(2) Mission
• To improve quality of society in Lahat district. It is not just to increase educational, skill and quality of thinking but also related to quality of healthiness, environment, and responsibility toward development,
• To develop economy based on agribusiness. Development of coffee estate and the other agriculture venture does not last forever by intensification and by cutting preserved forest areas. If the cutting is still done, damage of environment will happen and finally it will disturb economic activities,

Sector B Final Report
The Study on Comprehensive Water Management ofMusi River Basin in the Republic of Indonesia
B - 12 JICA CTI Engineering International Co., Ltd. NIKKEN Consultants, Inc.
• To increase venture productivity through effective and efficient technology and science,
• To carry out good government services and to create laws for supremacy and human rights. Societies desire that services by government organization must satisfy all parties and law enforcement and human rights should be done, and
• To develop joint venture by utilizing local human resources. Societies desire to develop Lahat District by cooperation among society, private and government.
2.3.7 Kabupaten Musirawas (Strategic Plan, 2001-2004)
(1) Vision
To realize the society with more quality and more welfare based on belief and devout toward autonomy and progress.
(2) Mission
• To realize welfare and quality of human resources,
• To realize good governance through the arrangement of regional governments' bureaucracy and organizational empowerment,
• To increase infrastructure development in order to develop and open isolated areas,
• To improve regional economy toward autonomy,
• To develop natural resources utilization by considering conservation of environment, and
• To improve awareness of law, politics, safety and defense.
(3) Target
• To increase society income, to increase and to distribute educational and healthiness level,
• To improve convenience of isolated and desolate areas through adequate and effective infrastructure development,
• To develop the function, capacity and capability of institutional and also human resources quality of government organizations,
• To increase regional ability in funding its own requirement,
• To increase food securities that are supported by institutional and managemental works including distribution system,

The Study on Comprehensive Water Management of Musi River Basin in the Republic of Indonesia
Sector BFinal Report
JICA CTI Engineering International Co., Ltd. NIKKEN Consultants, Inc.
B - 13
• To develop small, medium businesses and cooperation through improvement of production technical skills and management,
• To develop small/household industries based on local resources and regional characteristics, and
• To develop regional condition that conducive for the implementation of development in all sectors.
2.3.8 Kabupaten Musibanyuasin (Strategic Plan, 2001-2005)
(1) Vision
To realize welfare society on “SERASAN SEKATE” based on fair, honest, and responsible governance.
Welfare society means that it fulfill minimum requirements of food, houses and clothes needed based on minimum physical requirement criteria
Fair, honest and responsible governance means that governance with accountability and transparency.
(2) Mission
• To increase quality of human resources and organization,
• To increase the facility and infrastructure in Musibanyuasin District,
• To increase and distribute economic growth,
• To improve quality of social living,
• To increase motivation and working ethos of organization,
• To uphold law enforcement, democracy, and culture,
• To increase services quality for society, and
• To increase effectiveness and efficiency of administration in the regional government of Musibanyuasin.

Sector B Final Report
The Study on Comprehensive Water Management ofMusi River Basin in the Republic of Indonesia
B - 14 JICA CTI Engineering International Co., Ltd. NIKKEN Consultants, Inc.
3. POPULATION AND LABOR FORCE
3.1 Population
In Indonesia, population censuses were conducted in 1961, 1971, 1980, 1990, and 2000 by the Central Statistic Office (Badan Pusat Statistik (BPS)).
According to the latest population census 2000, Indonesia had a population of 205.8 million, which is the fourth most populous country in the world after China, India, and the United States. This population increased by 27.3 million as compared with the census 1990. During 10 years from 1980 to 1990, the average annual growth rate of the population was 2.0 % but that from 1990 to 2000 slowed down to 1.4 %.
Table B3.1.1 Population of Indonesia and Related Provinces
Population ('000) Annual growth (%) 1980 1990 2000 1980-1990 1990-2000
Indonesia 146,935 178,500 205,843 2.0 1.4 South Sumatra 3,974 (2.7%) 5,493 (3.1%) 6,858 (3.3%) 3.3 2.2 Bengkulu 768 (0.5%) 1,179 (0.7%) 1,564 (0.8%) 4.4 2.9 Jambi 1,446 (1.0%) 2,018 (1.1%) 2,407 (1.2%) 3.4 1.8 Lampung 4,625 (3.1%) 6,016 (3.4%) 6,731 (3.3%) 2.7 1.1
Source: Statistical Year Book of Indonesia 2001, BPS Sumatera Selatan Dalam Angka, 1990, 2000, and 2001, BPS Sumatera Selatan
South Sumatra Province, which occupies the major part of the Musi River Basin, had total population of 6.9 million or 3.3% of total population of Indonesia in 2000. During 10 years from 1980 to 1990, the average annual growth rate of the population was 3.3 % while that from 1990 to 2000 slowed down to 2.2%.
Other three provinces of Bengkulu, Jambi, and Lampung had the population of 1.6 million, 2.4 million, and 6.7 million, respectively. These three provinces also lowered population growth rates quite significantly from 1980s to 1990s.
Table B3.1.2 shows area, population by sex, population density, number of household, and average family size of the Districts and Municipality in South Sumatra Province in 2000. Population density of South Sumatra Province was 69 persons/km2 and which is 37% less than national average (109 people/ km2 in 2000). The provincial capital city, Palembang is the most densely populated area in the province at 3,623 people/km2 but which is still lower than Indonesia's capital, DKI Jakarta (12,635 people/ km2 in 2000). Meanwhile, Musirawas, Ogan Komering Ilir, and Musibanyuasin, which have vast swampy areas, are scarcely populated at 30, 46, and 48 people/km2, respectively.

The Study on Comprehensive Water Management of Musi River Basin in the Republic of Indonesia
Sector BFinal Report
JICA CTI Engineering International Co., Ltd. NIKKEN Consultants, Inc.
B - 15
Table B3.1.2 Population Density and Average Family Size of South Sumatra
Population Population Number of Average
District/ Municipality Area Male Female Total density household family size
km2 (1,000) (1,000) (1,000) (person/km2) (1,000) (person/family
)
Palembang 401 719.0 732.4 1,451.4 3,623 293.8 4.9
Ogan Komering Ulu 13,661 590.0 569.7 1,159.7 85 251.3 4.6
Ogan Komering Ilir 21,387 489.8 486.3 976.2 46 222.6 4.4
Muaraenim 9,575 358.9 358.8 717.7 75 161.9 4.4
Lahat 7,252 338.5 331.6 670.1 92 146.2 4.6
Musirawas 21,513 323.7 318.1 641.8 30 140.5 4.6
Musibanyuasin 26,099 624.2 616.2 1,240.4 48 272.9 4.5
Total 99,888 3,444.1 3,413.3 6,857.4 69 1,489.2 4.6
Source: Sumatera Selatan Dalam Angka 2001, BPS Sumatera Selatan
Average family size of South Sumatra Province was 4.6, which is more than national average (3.9 in 2000). That of Palembang City is large at 4.9 while those of other districts are from 4.4 to 4.6.
3.2 Population in the Musi River Basin
Population of the Musi River Basin has been estimated by sub-basin (see figure in Annex B1.0.1) by the Study Team. The following existing data were used for estimation of the population:
• District (Kecamatan) population in the results of the Population Censuses 1990 and 2000
• Sub-basin boundary in the Musi River Basin Study
• Administrative boundary (Kecamatan) in Administration Map by National Coordination Agency for Surveys and Mapping 1999/2000
When a kecamatan stretches over two or three river basins, its population is allotted by the ratio of area in each river basin. The current population (in the middle of 2002) was estimated applying the same growth trend as "Proyeksi Penduduk Indonesia per Kabupaten/Kotamadya 1990 - 2000, BPS" since no official population projection has been made after this. Population of Bengkulu and Jambi Provinces in the Musi River Basin are estimated based on the population estimated in the Musi River Basin Study and past average population growth rates of the respective districts. The estimated population is shown in Annex B3.2.1 and summarized below:
Sector B Final Report
The Study on Comprehensive Water Management ofMusi River Basin in the Republic of Indonesia
B - 16 JICA CTI Engineering International Co., Ltd. NIKKEN Consultants, Inc.
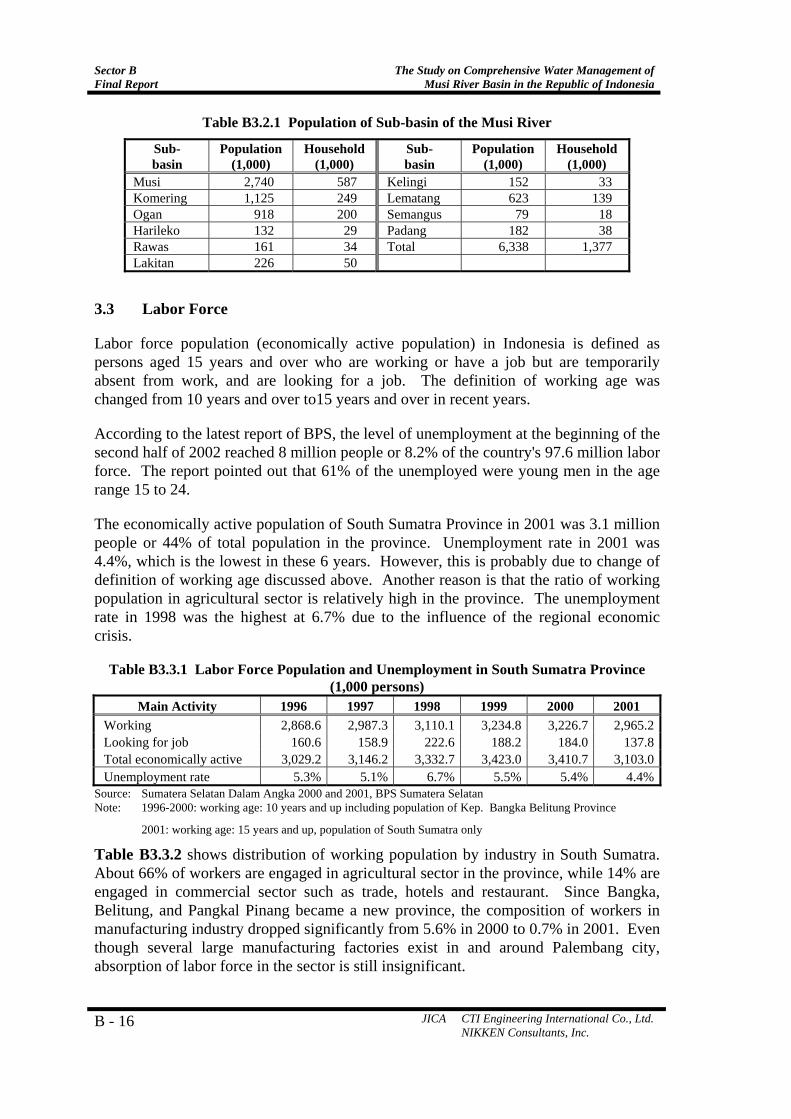
Table B3.2.1 Population of Sub-basin of the Musi River
Sub- Population Household Sub- Population Household basin (1,000) (1,000) basin (1,000) (1,000)
Musi 2,740 587 Kelingi 152 33 Komering 1,125 249 Lematang 623 139 Ogan 918 200 Semangus 79 18 Harileko 132 29 Padang 182 38 Rawas 161 34 Total 6,338 1,377 Lakitan 226 50
3.3 Labor Force
Labor force population (economically active population) in Indonesia is defined as persons aged 15 years and over who are working or have a job but are temporarily absent from work, and are looking for a job. The definition of working age was changed from 10 years and over to15 years and over in recent years.
According to the latest report of BPS, the level of unemployment at the beginning of the second half of 2002 reached 8 million people or 8.2% of the country's 97.6 million labor force. The report pointed out that 61% of the unemployed were young men in the age range 15 to 24.
The economically active population of South Sumatra Province in 2001 was 3.1 million people or 44% of total population in the province. Unemployment rate in 2001 was 4.4%, which is the lowest in these 6 years. However, this is probably due to change of definition of working age discussed above. Another reason is that the ratio of working population in agricultural sector is relatively high in the province. The unemployment rate in 1998 was the highest at 6.7% due to the influence of the regional economic crisis.
Table B3.3.1 Labor Force Population and Unemployment in South Sumatra Province (1,000 persons)
Main Activity 1996 1997 1998 1999 2000 2001 Working 2,868.6 2,987.3 3,110.1 3,234.8 3,226.7 2,965.2Looking for job 160.6 158.9 222.6 188.2 184.0 137.8Total economically active 3,029.2 3,146.2 3,332.7 3,423.0 3,410.7 3,103.0Unemployment rate 5.3% 5.1% 6.7% 5.5% 5.4% 4.4%
Source: Sumatera Selatan Dalam Angka 2000 and 2001, BPS Sumatera Selatan Note: 1996-2000: working age: 10 years and up including population of Kep. Bangka Belitung Province
2001: working age: 15 years and up, population of South Sumatra only
Table B3.3.2 shows distribution of working population by industry in South Sumatra. About 66% of workers are engaged in agricultural sector in the province, while 14% are engaged in commercial sector such as trade, hotels and restaurant. Since Bangka, Belitung, and Pangkal Pinang became a new province, the composition of workers in manufacturing industry dropped significantly from 5.6% in 2000 to 0.7% in 2001. Even though several large manufacturing factories exist in and around Palembang city, absorption of labor force in the sector is still insignificant.

The Study on Comprehensive Water Management of Musi River Basin in the Republic of Indonesia
Sector BFinal Report
JICA CTI Engineering International Co., Ltd. NIKKEN Consultants, Inc.
B - 17
Table B3.3.2 Composition of Working Population by Industry
Major Industry Composition of Workers (%) 1996 1997 1998 1999 2000 2001
1. Agriculture 57.2 57.5 59.3 57.2 60.6 65.9 2. Mining and quarrying 3.0 2.3 1.9 2.3 1.8 3.3 3. Manufacturing 5.4 5.4 4.9 5.7 5.6 0.7 4. Electricity, gas, and water 0.5 0.4 0.2 0.3 0.2 0.1 5. Construction 3.5 3.7 3.9 3.6 3.7 3.0 6. Trade, hotel, and restaurant 13.6 14.9 14.5 16.1 14.1 14.0 7. Transport and communication 3.5 3.4 3.9 3.9 4.7 3.5 8. Finance, insurance, R.E. & business 0.4 0.5 0.6 0.5 0.7 0.6 9. Public services 12.3 11.7 10.8 10.2 8.6 8.8
10. Other 0.5 0.2 0.0 0.1 - 0.0 Total 100 100 100 100 100 100 Source: Sumatera Selatan Dalam Angka 1996, 1997, 1998, 1999, 2000, and 2001, BPS Note: 1996-2000: including working population of Kep. Bangka Belitung Province.

Sector B Final Report
The Study on Comprehensive Water Management ofMusi River Basin in the Republic of Indonesia
B - 18 JICA CTI Engineering International Co., Ltd. NIKKEN Consultants, Inc.
4. ECONOMIC CONDITIONS
4.1 National and Regional Accounts
4.1.1 Gross Domestic Product (GDP)
Gross Domestic Product (GDP) of Indonesia in 2001 was Rp.1,490,974 billion (approximately US$ 145 billion) and per capita GDP in the same year was Rp.7.1 million (approximately US$ 690) as shown in Table B4.5.1. Due to depreciation of Rupiah through the economic crisis, GDP and per capita GDP in 2001 are only 60 % of those in 1996 if converted into US dollars.
Table B4.1.1 Gross Domestic Product (with oil/gas)
Item 1996 1997 1998 1999 2000 2001 GDP Total (Rp. bn) At current prices 532,568 627,696 955,754 1,099,732 1,282,018 1,490,974 At constant (1993) prices 413,798 433,246 376,375 379,353 397,934 411,132 Real growth (%) 7.8 4.7 -13.1 0.8 4.9 3.3 Per capita GDP (Rp.1,000) At current prices 2,686 3,117 4,676 5,326 6,119 7,063 At constant (1993) prices 2,087 2,151 1,841 1,837 1,899 1,948 Real growth (%) 5.9 3.1 -14.4 -2.0 3.4 2.5 Source: Statistical Year Book of Indonesia 1991 - 2001, BPS
Annual growth rate of GDP in 1996 was 7.8% and that of per capita GDP was also high at 5.9%. However, because of the crisis, - 13% of a large negative growth was occurred in 1998. Meanwhile, per capita GDP also recorded negative growth for two consecutive years of 1998 and 1999.
Yearly changes of GDP and GDP per capita are shown in Annexes B4.1.1 and B4.1.2, respectively.
4.1.2 Gross Regional Domestic Product (GRDP) of South Sumatra Province
Gross Regional Domestic Product (GRDP) of South Sumatra Province in 2001 was Rp.45,383 billion (approximately US$ 4.4 billion), which accounted for 3.0% of GDP of Indonesia. Per capita GRDP in the same year was Rp.6.5 million (approximately US$ 630), which is 8.4% lower than the national average.

The Study on Comprehensive Water Management of Musi River Basin in the Republic of Indonesia
Sector BFinal Report
JICA CTI Engineering International Co., Ltd. NIKKEN Consultants, Inc.
B - 19
Table B4.1.2 GRDP of South Sumatra Province (with oil/gas)
Item 1996 1997 1998 1999 2000 2001 GRDP Total (Rp. bn) At current prices 16,986 20,156 33,072 31,711 40,542 45,383At constant (1993) prices 13,521 14,207 13,239 11,888 12,599 13,149Real growth (%) 8.0 5.1 -6.8 -10.2 6.0 4.4Per capita GDP (Rp.1,000) At current prices 2,337 2,728 4,403 4,154 5,226 6,468At constant (1993) prices 1,861 1,923 1,763 1,557 1,624 1,874Real growth (%) 6.2 3.3 -8.3 -11.6 4.3 15.4Source: Sumatera Selatan Dalam Angka 1996 - 2001, BPS Sumatera Selatan
GRDP and per capita GRDP of South Sumatra Province for the last 10 years with and without oil/gas are presented in Annexes B4.1.3 and B4.1.4. The tables show that real economic growth for last 7 years remains 1.9% p.a. with oil/gas, and 1.0% p.a. without oil/gas due to grave impact of the crisis. Per capita GRDP of South Sumatra Province without oil/gas was Rp.4.3 million (US$417), which was 30% lower than that of Indonesia, Rp.6.1 million (US$594).
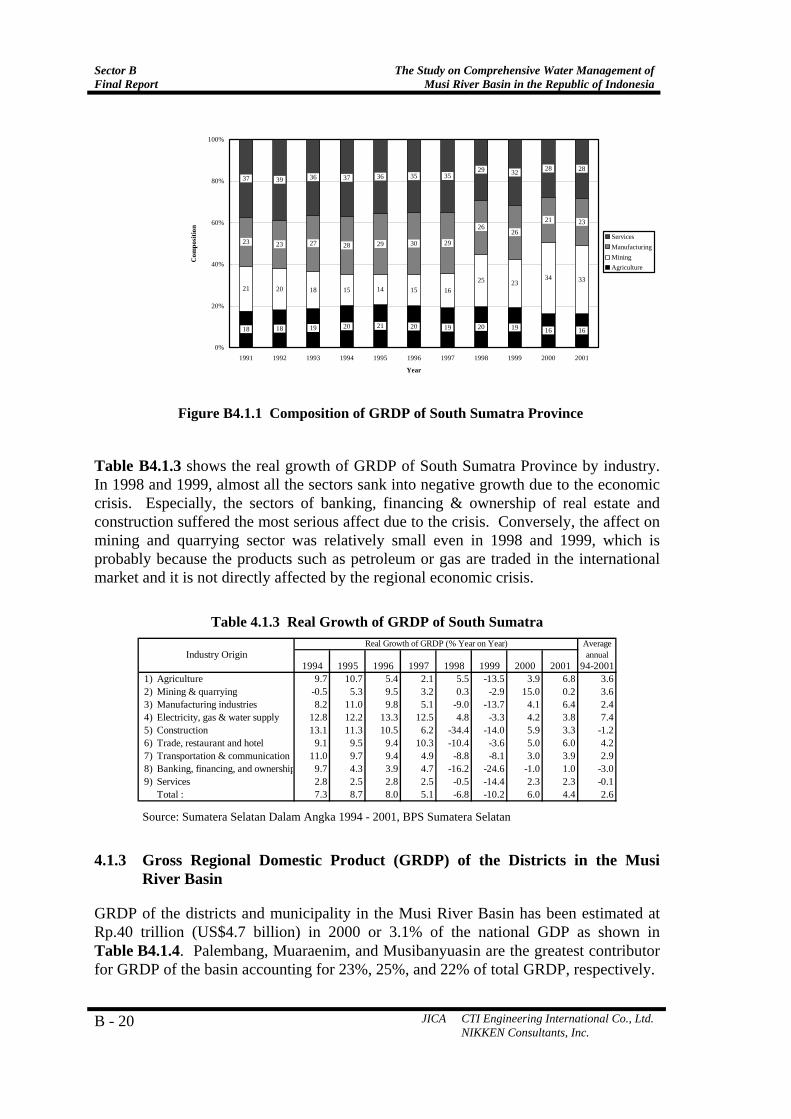
Figure B4.1.1 shows the composition of GRDP of South Sumatra Province. In this figure, the industries are classified into four sectors based on the classifications shown below:
Sector Industry Agriculture agriculture, livestock, forestry, & fishery Mining mining and quarrying Manufacturing manufacturing and construction Services electricity, gas & water supply,
trade, hotel & restaurant transport & communication, financial, ownership & business services other services
Mining sector has increased its share in GRDP since 1996 and accounted for one third of total GRDP in 2001. Conversely, other sectors have reduced their shares gradually during the same period. This shows that economy of South Sumatra Province has increased dependence on mining sector, especially on oil/gas, again taking a cue from the economic crisis.
Sector B Final Report
The Study on Comprehensive Water Management ofMusi River Basin in the Republic of Indonesia
B - 20 JICA CTI Engineering International Co., Ltd. NIKKEN Consultants, Inc.
18 18 19 20 21 20 19 20 19 16 16
21 20 18 15 14 15 1625 23
34 33
23 23 27 28 29 30 29
2626
21 23
37 39 36 37 36 35 3529 32 28 28
0%
20%
40%
60%
80%
100%
1991 1992 1993 1994 1995 1996 1997 1998 1999 2000 2001
Year
Com
posi
tion
ServicesManufacturingMiningAgriculture
Figure B4.1.1 Composition of GRDP of South Sumatra Province
Table B4.1.3 shows the real growth of GRDP of South Sumatra Province by industry. In 1998 and 1999, almost all the sectors sank into negative growth due to the economic crisis. Especially, the sectors of banking, financing & ownership of real estate and construction suffered the most serious affect due to the crisis. Conversely, the affect on mining and quarrying sector was relatively small even in 1998 and 1999, which is probably because the products such as petroleum or gas are traded in the international market and it is not directly affected by the regional economic crisis.
Table 4.1.3 Real Growth of GRDP of South Sumatra
Averageannual
1994 1995 1996 1997 1998 1999 2000 2001 94-2001 1) Agriculture 9.7 10.7 5.4 2.1 5.5 -13.5 3.9 6.8 3.62) Mining & quarrying -0.5 5.3 9.5 3.2 0.3 -2.9 15.0 0.2 3.63) Manufacturing industries 8.2 11.0 9.8 5.1 -9.0 -13.7 4.1 6.4 2.44) Electricity, gas & water supply 12.8 12.2 13.3 12.5 4.8 -3.3 4.2 3.8 7.45) Construction 13.1 11.3 10.5 6.2 -34.4 -14.0 5.9 3.3 -1.26) Trade, restaurant and hotel 9.1 9.5 9.4 10.3 -10.4 -3.6 5.0 6.0 4.27) Transportation & communication 11.0 9.7 9.4 4.9 -8.8 -8.1 3.0 3.9 2.98) Banking, financing, and ownership 9.7 4.3 3.9 4.7 -16.2 -24.6 -1.0 1.0 -3.09) Services 2.8 2.5 2.8 2.5 -0.5 -14.4 2.3 2.3 -0.1
Total : 7.3 8.7 8.0 5.1 -6.8 -10.2 6.0 4.4 2.6
Real Growth of GRDP (% Year on Year)Industry Origin
Source: Sumatera Selatan Dalam Angka 1994 - 2001, BPS Sumatera Selatan
4.1.3 Gross Regional Domestic Product (GRDP) of the Districts in the Musi River Basin
GRDP of the districts and municipality in the Musi River Basin has been estimated at Rp.40 trillion (US$4.7 billion) in 2000 or 3.1% of the national GDP as shown in Table B4.1.4. Palembang, Muaraenim, and Musibanyuasin are the greatest contributor for GRDP of the basin accounting for 23%, 25%, and 22% of total GRDP, respectively.

The Study on Comprehensive Water Management of Musi River Basin in the Republic of Indonesia
Sector BFinal Report
JICA CTI Engineering International Co., Ltd. NIKKEN Consultants, Inc.
B - 21
Table B4.1.4 GRDP of the Districts in Musi River Basin
District/Municipality 1993 1994 1995 1996 1997 1998 1999 2000With oil & gasPalembang 2,409 2,791 3,345 3,981 4,670 6,810 7,941 8,924 Ogan Komering Ulu 1,011 1,171 1,389 1,593 1,846 2,910 3,223 3,919 Ogan Komering Ilir 804 937 1,127 1,345 1,566 2,232 2,594 2,915 Muara Enim 1,475 1,619 1,966 2,441 3,261 5,364 6,099 9,570 Lahat 638 739 887 1,017 1,257 1,871 2,066 2,258 Musi Rawas 748 793 886 1,045 1,263 2,027 2,207 2,533 Musi Banyuasin 1,995 2,070 2,496 2,881 3,332 5,553 6,321 8,578 Rejang Lebong 446 n.a. 693 768 836 1,386 1,463 n.a.Total 9,526 10,120 12,790 15,071 18,030 28,153 31,913 38,697 Without oil & gasPalembang 2,138 2,509 3,012 3,576 4,239 6,189 7,169 8,147 Ogan Komering Ulu 937 1,110 1,318 1,508 1,741 2,720 2,907 3,230 Ogan Komering Ilir 804 937 1,127 1,345 1,566 2,232 2,594 2,915 Muara Enim 932 1,003 1,234 1,588 2,050 2,731 3,031 3,129 Lahat 638 739 887 1,017 1,257 1,871 2,066 2,258 Musi Rawas 504 608 713 838 1,011 1,408 1,504 1,710 Musi Banyuasin 1,221 1,414 1,715 2,013 2,357 3,507 3,948 4,501 Rejang Lebong 446 n.a. 693 768 836 1,386 1,463 n.a.Total 7,620 8,320 10,699 12,653 15,056 22,043 24,683 25,890
GRDP at Current Price (Rp. bn)
Source: Produk Domestik Regional Bruto, BPS each district
OKU, Muaraenim, Musirawas, and MUBA are oil-producing districts. The differences of GRDP of these districts between with and without oil/gas are very large. GRDPs of Muaraenim and MUBA in 2000 were Rp.9.6 trillion and Rp.8.6 trillion, respectively. However, those without oil/gas were only Rp.3.1 trillion, and Rp.4.5 trillion, respectively.
Per capita GRDP without oil/gas may be more relevant to see people's livelihood since oil/gas revenue have little impacts on the regional economy. Palembang's per capita GRDP is the largest at Rp.5.6 million among the districts, while that of Musirawas is the smallest at Rp.2.7 million.
Table B4.1.5 Per Capita GRDP without Oil/Gas by District
District/ GRDP Per Capita at Current Price (Rp.1,000)Municipality 1993 1994 1995 1996 1997 1998 1999 2000Palembang 1,701 1,942 2,261 2,691 3,051 4,454 5,046 5,612 Ogan Komering Ulu 886 1,030 1,199 1,356 1,548 2,323 2,532 2,785 Ogan Komering Ilir 938 1,066 1,251 1,469 1,682 2,358 2,698 2,986 Muara Enim 1,477 1,550 1,860 2,337 2,953 3,891 4,271 4,360 Lahat 1,018 1,160 1,372 1,550 1,890 2,774 3,024 3,369 Musi Rawas 910 1,068 1,218 1,406 1,663 2,274 2,386 2,665 Musi Banyuasin 1,219 1,360 1,591 1,806 2,058 2,941 3,262 3,628 Rejang Lebong 1,165 n.a. 1,714 1,872 2,003 3,298 3,445 n.a. Source: Produk Domestik Regional Bruto, BPS each district
Annexes B4.1.5, B4.1.6 and B4.1.7 show GRDP structure of the districts by industrial origin.

Sector B Final Report
The Study on Comprehensive Water Management ofMusi River Basin in the Republic of Indonesia
B - 22 JICA CTI Engineering International Co., Ltd. NIKKEN Consultants, Inc.
In Palembang, service and manufacturing are the dominant industries, which accounted for 57% and 42%, respectively. The manufacturing industry includes large-scale oil refinery and fertilizer factories.
OKU, which is located upstream area of Ogan and Komering River basin, has relatively balanced industrial structure. Crop production accounted for 24% of total GRDP, while those of oil production and trade accounted for 18% and 16%, respectively.
In OKI, which is located at middle stream area of Ogan and Komering River basin, agriculture is the dominant industry in the district accounting for 44% of its GRDP. Especially, the contribution of non-food crop is large at 16%, while that of food crop such as rice is 11%.
Muaraenim is located at the center of South Sumatra province and which occupies major part of Lematang, a part of Ogan and Musi River basins. The district has a characteristic industrial structure, which is dominated by mining represented by oil/gas production. The mining sector accounted for 79% of the district's GRDP. Annex B4.1.6 shows that the district is rich in mining resources even without oil/gas.
Lahat is located at southwestern part of South Sumatra province, and it occupies the most upstream part of the Musi, upstream part of Lematan, upstream small part of Semangus and Kelingi River basins. Agriculture is the dominant industry, which accounting for 46% of the district's GRDP. Especially, production of non-food crop such as rubber, coffee, and oil palm is large at 26% of total GRDP. Trade is the second largest economic activity in the district accounting for 16%.
Musirawas is located at western part of South Sumatra Province. It occupies almost all the area of Rawas and Lakitan River basins, downstream part of Kelingi, upper-middle reaches of Musi, and downstream part of Semangus River basins. Mining represented by production of oil/gas is the largest industry in the district accounting for 35%. Production of food and non-food crops, and trade are also large at 8%, 13%, and 11%, respectively.
MUBA is located at northwestern part of South Sumatra Province. It occupies almost all areas of Harileko and Padang River basins, and lower-middle reaches of the Musi River Basin. Northeastern half of the district is not the Musi River Basin. Mining and manufacturing are the dominant industries accounting for 36% and 30%, respectively. Out of them, production of oil and its refinery industries are also large at 35% and 13% of the district's GRDP, respectively. Since the district is located downstream area, agricultural production including crop, forestry and fishery is quite large.
Rejang Lebong is located at north central part of Bengkulu Province. The most upstream part of the Musi and Kelingi River basins are occupied by the district. Agriculture and services are the dominant industries, which accounting for 58% and 35%, respectively. Especially production of food crops is large at 34% of total GRDP, while that of non-food crops is 19%.

The Study on Comprehensive Water Management of Musi River Basin in the Republic of Indonesia
Sector BFinal Report
JICA CTI Engineering International Co., Ltd. NIKKEN Consultants, Inc.
B - 23
Annex B4.1.8 shows composition of agricultural GRDP of the districts in the Musi River Basin. Large share of non-food crops such as rubber, coffee, and oil palm is one of the characteristics of the basin. Production of forestry is also large at OKI and MUBA.
4.2 Trade Balance and Debt
4.2.1 Trade Balance
Until 1997, the surplus of merchandise trade had not been large and current account had consistently been in deficit. However, the fall in merchandise import due to recession caused by the crisis generated a large surplus on the merchandise trade and more than offset the deficit on the service accounts, enabling Indonesia's current account to move into surplus since 1998. The strong trade performance has meant the surplus of US$5.8 billion in 1999, US$8.0 billion in 2000, and US$6.9 billion in 2001.
Table B4.2.1 Balance of Payment (US$ million)
1996 1997 1998 1999 2000 2001 A. Current account
Merchandise exports fob 50,188 56,297 50,371 51,241 65,408 57,364 Merchandise imports fob -44,240 -46,223 -31,942 -30,600 -40,367 -34,669 Trade balance 5,948 10,074 18,429 20,641 25,041 22,695 Service, net -13,749 -15,075 -14,332 -14,859 -17,043 -15,795 Current account balance -7,801 -5,001 4,097 5,782 7,998 6,900
B. Capital Transactions Net official capital -522 2,880 9,971 5,353 3,217 -739 Inflows 5,055 4,538 2,788 2,408 2,420 2,482 Amortization -6,215 -4,714 -3,765 -4,070 -4,272 -4,704 Exceptional financing 0 3,036 6,322 2,863 3,627 1,483 Net private capital 11,511 -338 -13,846 -9,922 -9,992 -8,253 Total capital transaction 10,989 2,542 -3,875 -4,570 -6,775 -8,992
C. Basic balance 3,188 -2,459 222 1,213 1,223 -2,092Source: Country Data, web page of the World Bank Office, Jakarta
The capital account remained in deficit for four consecutive years since 1998. The surplus of net official capital dropped significantly from US$5.3 billion in 1999 to US$0.7 billion in 2001. The outflow of the net private capital has continued since 1997. The basic balance had been surplus from 1998 to 2000 on the strength of the merchandise exports. However, it fell to the deficit of US$2.1 billion due to a sharp drop in foreign aid financing.
4.2.2 External Debt
Indonesia is classified as a severely indebted low-income country by World Bank according to economic condition of income and indebtedness. The total debt outstanding declined from US$150.8 billion at end-1999 to US$141.8 billion at end-2000 by 6% as shown in Table B4.2.2. The debt in 2000 accounted for 99% of the gross national income (GNI). Out of this, US$108 billion or 76% was procured as long-

Sector B Final Report
The Study on Comprehensive Water Management ofMusi River Basin in the Republic of Indonesia
B - 24 JICA CTI Engineering International Co., Ltd. NIKKEN Consultants, Inc.
term debt, mostly for capital investment. Total debt service aggregated to US$18.8 billion in 2000. In the year, the debt-service ratio (DSR), a kind of country risk assessment factors, was 25.5%, which was the lowest in this decade. However, this figure is still in a critical position, because it is beyond the level of 20%, critical level of DSR.
Table B4.2.2 External Debt of Indonesia (US$ bn, debt stocks as at year-end)
1995 1996 1997 1998 1999 2000 Total external debt 124.4 128.9 136.2 151.2 150.8 141.8
Long-term debt 98.4 96.7 100.3 122.0 120.6 108.3 Total debt service 16.4 21.5 19.7 18.3 17.9 18.8 Principal 10.2 14.9 13.0 11.2 11.7 11.3 Interest 6.2 6.6 6.7 7.1 6.2 7.5 Gross national income (GNI) 196.2 221.3 209.4 90.1 131.3 142.7 Exports of goods & services 54.9 58.8 65.8 57.7 58.8 74.3 Ratios (%) Total external debt/GNI 63.4 58.3 65.0 167.9 114.9 99.4 Debt-service ratio (DSR) 29.9 36.6 30.0 31.7 30.4 25.3
Source: Global Development Finance 2002, World Bank
4.3 Economic Profile by Sector
4.3.1 Agriculture
At the end of Repelita IV (1984-1989), South Sumatra province achieved self-sufficient in food (rice production) with a production of 1,282,483 tons from cultivation areas of 443,830 hectares. Since then, the province has contributed to the national food stock. In perpetuating self-sufficiency of food, especially rice, in Repelita V (1989-1994) the province tried to improve the production of food crops and the farmers' income, as well as the community's nutrition.
Annex B4.3.1 shows production of paddy in the districts in the Musi River Basin. In 2000, the production of paddy was 1,964,700 tons from 579,600 hectares, which accounted for 3.8% of total production and 4.9% of total cultivation area of Indonesia. Musibanyuasin, OKU, and OKI are the biggest rice producer in the area with 564,700 tons, 374,100 tons, and 414,400 tons, respectively. Since more than half of paddy cultivation land is still depending on rain, crop production varies largely from year to year depending on climate.
In the Musi River Basin, other food crops are also cultivated such as maize, cassava, sweet potato, peanuts, and soybeans as shown in Annex B4.3.2. Especially maize and cassava have been widely cultivated in South Sumatra province with cultivation areas of 28,600 ha and 27,900 ha, respectively in 2001.
Rubber, oil palm, coffee, and coconut are the major cash crops cultivated in South Sumatra province. Especially cultivation area of rubber in 2001 (excluding Rejang Lebong of Bengkulu Province) is large at 868,700 ha, which is larger than paddy cultivation area of 505,300 ha. The rubber production of 465,400 tons accounted for
The Study on Comprehensive Water Management of Musi River Basin in the Republic of Indonesia
Sector BFinal Report
JICA CTI Engineering International Co., Ltd. NIKKEN Consultants, Inc.
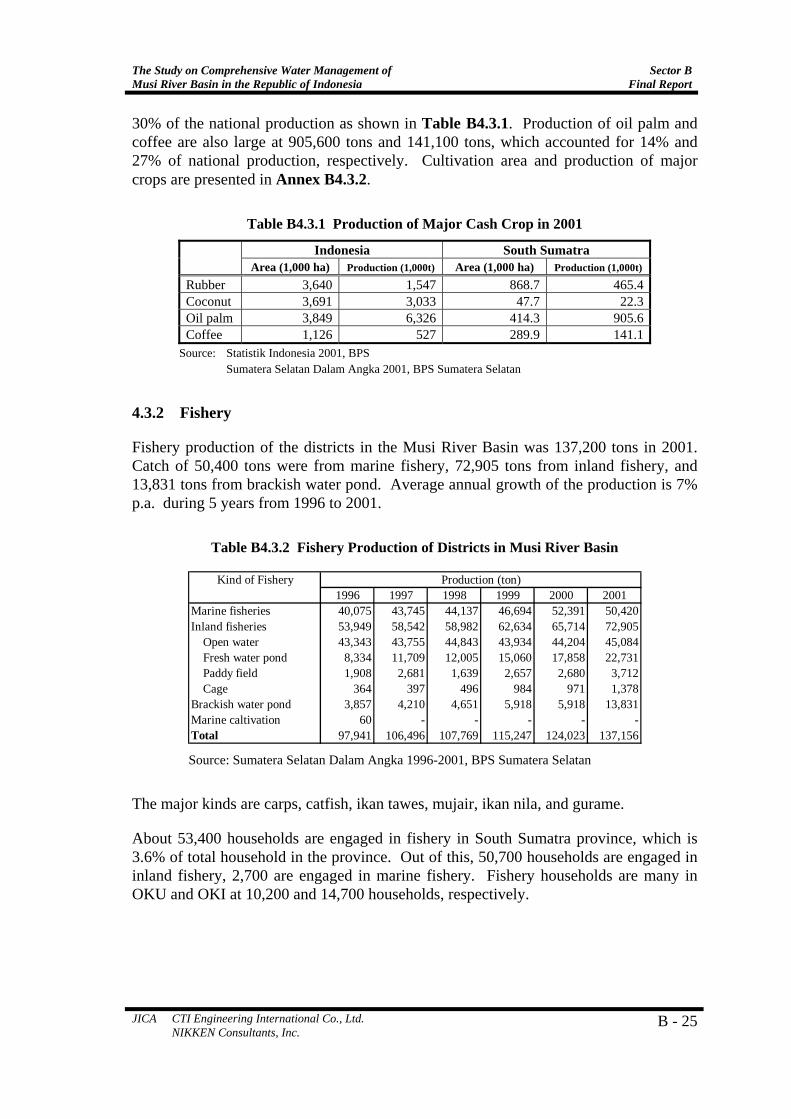
B - 25
30% of the national production as shown in Table B4.3.1. Production of oil palm and coffee are also large at 905,600 tons and 141,100 tons, which accounted for 14% and 27% of national production, respectively. Cultivation area and production of major crops are presented in Annex B4.3.2.
Table B4.3.1 Production of Major Cash Crop in 2001
Indonesia South Sumatra Area (1,000 ha) Production (1,000t) Area (1,000 ha) Production (1,000t)
Rubber 3,640 1,547 868.7 465.4 Coconut 3,691 3,033 47.7 22.3 Oil palm 3,849 6,326 414.3 905.6 Coffee 1,126 527 289.9 141.1
Source: Statistik Indonesia 2001, BPS Sumatera Selatan Dalam Angka 2001, BPS Sumatera Selatan
4.3.2 Fishery
Fishery production of the districts in the Musi River Basin was 137,200 tons in 2001. Catch of 50,400 tons were from marine fishery, 72,905 tons from inland fishery, and 13,831 tons from brackish water pond. Average annual growth of the production is 7% p.a. during 5 years from 1996 to 2001.
Table B4.3.2 Fishery Production of Districts in Musi River Basin
1996 1997 1998 1999 2000 2001Marine fisheries 40,075 43,745 44,137 46,694 52,391 50,420 Inland fisheries 53,949 58,542 58,982 62,634 65,714 72,905
Open water 43,343 43,755 44,843 43,934 44,204 45,084 Fresh water pond 8,334 11,709 12,005 15,060 17,858 22,731 Paddy field 1,908 2,681 1,639 2,657 2,680 3,712 Cage 364 397 496 984 971 1,378
Brackish water pond 3,857 4,210 4,651 5,918 5,918 13,831 Marine caltivation 60 - - - - - Total 97,941 106,496 107,769 115,247 124,023 137,156
Production (ton)Kind of Fishery
Source: Sumatera Selatan Dalam Angka 1996-2001, BPS Sumatera Selatan
The major kinds are carps, catfish, ikan tawes, mujair, ikan nila, and gurame.
About 53,400 households are engaged in fishery in South Sumatra province, which is 3.6% of total household in the province. Out of this, 50,700 households are engaged in inland fishery, 2,700 are engaged in marine fishery. Fishery households are many in OKU and OKI at 10,200 and 14,700 households, respectively.

Sector B Final Report
The Study on Comprehensive Water Management ofMusi River Basin in the Republic of Indonesia
B - 26 JICA CTI Engineering International Co., Ltd. NIKKEN Consultants, Inc.
4.3.3 Manufacturing Industry
Manufacturing industry had served as an engine of economic growth in the region before the economic crisis. However, it was badly hit by the crisis in 1997/98, and more recently has had to cope with recession in major export markets. Table B4.3.3 shows annual growth of manufacturing sector in the Musi River Basin. The manufacturing sector had grown fruitfully until 1996. After the economic crisis, recovery of the sector is quite weak, especially that of non-oil/gas manufacturing is very slow.
Table B4.3.3 Real Growth of Manufacturing Sector in Musi River Basin
Real Growth (% Year on Year) Manufacturing sector 1994 1995 1996 1997 1998 1999 2000
With oil & gas Without oil & gas
7.5 11.8
12.118.0
11.414.8
3.46.9
-6.2-9.0
2.90.1
1.1 -0.4
Major non-oil/gas products are fertilizer, cement, coffee, rubber goods, timbers, and chemical products. Pusri fertilizer plant is the largest producer of urea in South-East Asia. Annex B4.3.3 shows major industrial products of South Sumatra province in 2000 and 2001.
Development of industrial sector has given a good impact on the employment opportunities. In 2000, there were 37,409 manufacturing establishment and 166,800 persons engaged in the sector. However, the number of establishment was decreased by 6,280 from 2000 to 2001 and engaged persons are decreased by 12,900 as shown in Annex B4.3.4.
4.3.4 Tourism
South Sumatra Province had 18,600 foreign and 260,500 local tourists in 2001. The number of tourists fluctuates year-by-year depending on events or festivals taken place in the province.
Table B4.3.4 Number of Foreign and Domestic Tourists Visited South Sumatra
Tourists 1993 1994 1995 1996 1997 1998 1999 2000 2001 Foreign 34,989 35,339 36,551 16,647 20,439 14,634 17,879 18,577 18,584Domestic 189,352 200,335 224,494 240,757 251,432 160,139 295,414 375,163 260,479Total 224,341 235,674 261,045 257,404 271,871 174,773 313,293 393,740 279,063Source: Sumatera Selatan Dalam Angka 2000, 2001, BPS Sumatera Selatan
Musi River tour is one of the tourists attractions in Palembang area. Tourists can enjoy the unique scenery of floating houses, Benteng Kuto Besak (the fort of Big Town under development), Ampera Bridge, and the tiny delta of Kemaro Island, island of Viharas the famous place for Buddhist pilgrims.

The Study on Comprehensive Water Management of Musi River Basin in the Republic of Indonesia
Sector BFinal Report
JICA CTI Engineering International Co., Ltd. NIKKEN Consultants, Inc.
B - 27
According to the tourism department of South Sumatra Province, water quality or water volume of the Musi River have not given any negative impact for tourism so far. There are plans to improve or reconstruct the tourist attraction along the Musi River such as historical buildings and floating houses.
4.3.5 Services
(1) Electricity
The supply of electricity and its infrastructure in South Sumatra is served by District IV of the State Electricity Company (PLN) using inter connection system with Bengkulu and Lampung Provinces. The supply of electricity is also carried out by electricity undertaken permit holders of both private companies and cooperatives.
In 2001, the total electricity sold by PLN in the South Sumatra province was 1,217,081 MWh as shown in Table B4.3.5. Out of this, the consumption by households accounted for 56%, industrial sector accounted for 27% and commercial sector accounted for 11%.
Table B4.3.5 Electricity Distribution by PLN in South Sumatra
Item 1998 1999 2000 2001 MWh % MWh % MWh % MWh % 1. Household 581,214 39 656,529 55 512,389 55 680,262 56 2. Commercial 121,476 8 127,449 11 114,447 12 136,562 11 3. Industry 359,049 24 347,846 29 249,342 27 329,697 27 4. Gov. institution 415,983 28 43,045 4 32,301 3 19,458 2 5. Other 25,638 2 26,743 2 22,448 2 51,102 4 Total 1,503,360 100 1,201,612 100 930,926 100 1,217,081 100Source: Sumatera Selatan Dalam Angka 2001, BPS Sumatra Selatan
Table B4.3.6 shows the number of households that have electric power supply in South Sumatra Province in 2001. Electricity was supplied for 625,300 households, which was 41% of total household in the province. In Lahat and Palembang, the ratios of electricity user are very high at 99% and 88% respectively, while those in OKU and MUBA are low at 16% and 11%. PLN supplies electricity for 95% of consumer and only 5% of consumer use non-PLN electricity.

Sector B Final Report
The Study on Comprehensive Water Management ofMusi River Basin in the Republic of Indonesia
B - 28 JICA CTI Engineering International Co., Ltd. NIKKEN Consultants, Inc.
Table B4.3.6 Number of Electricity Consumer in 2001
Total Electricity Consumer Districts household PLN Other Total
('000) ('000) % ('000) % ('000) % Palembang 281.8 230.5 82 18.1 6 248.6 88 OKU 264.9 40.7 15 2.2 1 42.9 16 OKI 234.6 62.7 27 2.3 1 64.9 28 Muaraenim 170.6 39.9 23 1.7 1 41.6 24 Lahat 154.0 146.5 95 6.0 4 152.4 99 MURA 148.1 39.8 27 2.2 1 42.0 28 MUBA 287.7 31.5 11 1.3 0 32.8 11 Total 1,541.7 591.7 38 33.6 2 625.3 41
Source: Sumatera Selatan Dalam Angka 2001, BPS Sumatera Selatan
(2) Potable Water
Municipal water companies (PDAM) have been responsible for delivering water supply service in urban areas. PDAM is financially autonomous, and its budget is distinct from that of local government. Table B4.3.7 shows drinking water distribution by district in 2001.
Table B4.3.7 Drinking Water Distribution in 2001
District (1,000 m3) District (1,000 m3)
Palembang 1,559.5 Lahat 1,381.4OKU 2,518.0 MURA 2,214.3OKI 1,128.3 MUBA 931.5Muaraenim 2,953.7 Total 12,686.9
Source: Sumatra Selatan Dalam Angka 2001, BPS Sumatera Selatan
According to the latest socioeconomic survey in South Sumatra Province (Susenas 2000), households that use water supply for drinking water were only 17.7%, while those in Palembang were 69.6%. The most dominant sources of drinking water were protected and non-protected wells, which accounted for 38% and 21%, respectively. River water is used as drinking water by 12.8% of household. In MUBA, 29.5% of households use rainwater for drinking in order to avoid saline groundwater.

The Study on Comprehensive Water Management of Musi River Basin in the Republic of Indonesia
Sector BFinal Report
JICA CTI Engineering International Co., Ltd. NIKKEN Consultants, Inc.
B - 29
Table B4.3.8 Source of Drinking Water in 2000 (%) District Water
supply Ground-
water Protected
well Non-
protectedwell
Protectedspring
Non- protected
spring
River water
Rain water
Other
Palembang 69.6 0.8 11.2 10.3 - - 5.8 1.1 1.3OKU 7.2 0.5 50.0 18.4 3.3 1.6 18.3 0.1 0.6OKI 5.5 1.1 39.0 17.8 0.1 0.3 29.9 4.2 2.0Muaraenim 11.0 0.6 37.6 33.3 5.6 0.8 7.9 0.3 2.9Lahat 5.8 1.2 54.5 18.1 7.0 0.9 12.5 - 0.2MURA 9.8 0.3 42.6 29.6 1.8 2.0 13.7 - 0.2MUBA 2.4 0.5 41.4 11.8 0.1 0.2 13.6 29.5 0.6Total 17.7 1.2 38.0 21.0 1.8 0.8 12.8 5.6 1.0
Source: Keadaan Social Ekonomi Masyarakat Sumatera Selatan 2000, BPS Sumatera Selatan
4.4 Prices
The regional economic crisis caused severe inflation in 1997/1998 driven by depreciation of Rupiah. The prices of food rose more than 100% from 1997 to 1998, while those of housing and clothing also rose significantly at 41% and 79%, respectively. In 1999, the prices of almost all categories still rose quite significantly between 13 to 31%. In 2000, stabilization of the prices appeared but they rose again in almost all the categories in 2001. The same trend of the high inflation has been continuing in 2002.
Table B4.4.1 Consumer Price Index of Palembang City
% change year on year Commodity group
1997 1998 1999 2000 2001 2002 Jan-Sep
1. Farm food 10.4 101.4 28.8 -7.1 9.7 11.02. Prepared food, beverages, and tobacco - - 31.4 0.4 14.3 10.03. Housing 6.2 41.0 20.5 3.9 18.2 13.44. Clothing 7.3 78.8 27.9 6.9 10.6 8.75. Health - - 14.5 2.6 9.9 8.16. Education, recreation, and sports - - 13.0 3.3 8.3 20.37. Transportation and communication - - 13.9 4.0 14.6 28.58. General Index 8.4 61.6 24.3 -0.1 13.1 12.5
Source: Sumatra Selatan Dalam Angka 1997-2001, BPS Sumatera Selatan Consumer Price Indices in web page of BPS
4.5 Foreign Exchange Rates
Bank Indonesia is the central bank of the country. After a long period of peg system of Rupiah to US dollar in the 1970s and 1980s, the government introduced a managed float aimed at maintaining the competitiveness of Indonesia's non-oil/gas exports. The Asian economic crisis, occurred in the middle of August 1997, has forced the government to allow Rupiah to float freely. Average annual foreign exchange rates against U.S. Dollar and Japanese Yen are summarized below.

Sector B Final Report
The Study on Comprehensive Water Management ofMusi River Basin in the Republic of Indonesia
B - 30 JICA CTI Engineering International Co., Ltd. NIKKEN Consultants, Inc.
Table B4.5.1 Foreign Currency Exchange Rate
Currency 1996 1997 1998 1999 2000 2001 Sep. 16,
2002
One U.S. Dollar One Japanese Yen
2,342 22
2,90924
10,01477
7,85577
8,42278
10,261 84
9,035 74.05
Source: Country Profile 2001, the Economic Intelligence Unit (EIU) Country Report 2001, the Economic Intelligence Unit (EIU) Sep.16, 2002: Bank Indonesia, TT, middle rate Note: 1996 - 2001: Annual average rates

The Study on Comprehensive Water Management of Musi River Basin in the Republic of Indonesia
Sector BFinal Report
JICA CTI Engineering International Co., Ltd. NIKKEN Consultants, Inc.
B - 31
5. SOCIOECONOMIC FRAMEWORK
5.1 Introduction
Socio-economic framework plan for the target year 2020 has been set by the study team for estimation of the future water demand and the future flood damage potential. The socio-economic framework includes the following items:
(1) Population projection (by district, increasing rates)
(2) Growth targets for GRDP (amount, sector component, and growth rate)
(3) Per capita GRDP
5.2 Population Projection
There are two population projection prepared by BPS. One is "Proyeksi Penduduk Indonesia per Propinsi 1995-2005" and another is "Proyeksi Penduduk Indonesia per Kabupaten/Kotamadya 1990-2000". The former is rather new and the projections were based on the results of the Census 1990. However, since the projections were made by provincial unit, adjustment of the growth rate by district is necessary. Furthermore, the population of Kep. Bangka Belitung should be deducted. The latter is rather old, which was also prepared based on the Census 1990, but it is possible to verify the results of projections referring to the results of the Census 2000. In addition, since the projections were made by district/municipality, it is easy to separate the population of the new province. In this study, the future population is projected based on the latter and also the population growth target set in the PJP-II was referred.
As a result of the verification of the population projection 1990-2000 discussed above, the projected population in 2000 is very close to the results of the Census 2000. Therefore, the same growth trends by district have been estimated by linear regressions for the projection of the future population. The base for projection was set from the Census 2000. The estimated future population by district is summarized below:
Table B5.2.1 Population Projection and Annual Growth Rates (1,000 people)
District/Municipality 2002 2005 2010 2020 Palembang 1,506 (2.1%) 1,598 (2.0%) 1,752 (1.8%) 2,058 (1.5%)Ogan Komering Ulu 1,202 (1.7%) 1,263 (1.6%) 1,365 (1.5%) 1,568 (1.3%)Ogan Komering Ilir 1,019 (2.1%) 1,083 (2.0%) 1,189 (1.8%) 1,403 (1.5%)Muaraenim 749 (2.1%) 795 (2.0%) 873 (1.8%) 1,028 (1.5%)Lahat 690 (1.3%) 717 (1.3%) 763 (1.2%) 853 (1.1%)Musirawas 672 (2.3%) 717 (2.2%) 794 (2.0%) 946 (1.6%)Musibanyuasin 1,309 (2.9%) 1,422 (2.7%) 1,609 (2.4%) 1,984 (1.9%)Total 7,146 (2.1%) 7,565 (1.9%) 8,344 (2.0%) 9,840 (1.7%)

Sector B Final Report
The Study on Comprehensive Water Management ofMusi River Basin in the Republic of Indonesia
B - 32 JICA CTI Engineering International Co., Ltd. NIKKEN Consultants, Inc.
The annual growth rate of population at the target year 2020 is 1.7%, which is higher than the target growth rate in PJP-II (0.88%). However, since the population growth rate of South Sumatra Province in the recent years was approximately 0.8% higher than that of whole Indonesia, it will not be practical to assume sharp drop in population growth of the province.
5.3 Economic Growth Target
5.3.1 Methodology
In order to formulate the economic growth target until the target year 2020, GRDP without oil/gas is selected with the following reasons:
• Price of oil/gas is largely affected by external factors,
• Even after the fiscal decentralization, the revenue accruing from oil/gas industries are not net regional receipt, but large part of it is transferred into the central government account, and
• The absorption of labor force in the oil/gas sectors is relatively low and their contribution to regional welfare is insignificant.
Three scenarios are conceived as follows:
Scenario 1: "Low growth due to slow economic recovery"
Scenario 2: "Moderate growth due to sound economic recovery"
Scenario 3: "Fast growth due to rapid economic recovery"
Projection process is made from provincial down to district level. GRDP without oil/gas is projected breaking down into four sectors; agriculture, mining, manufacturing, and services.
(1) Economic Growth Target of the Governments
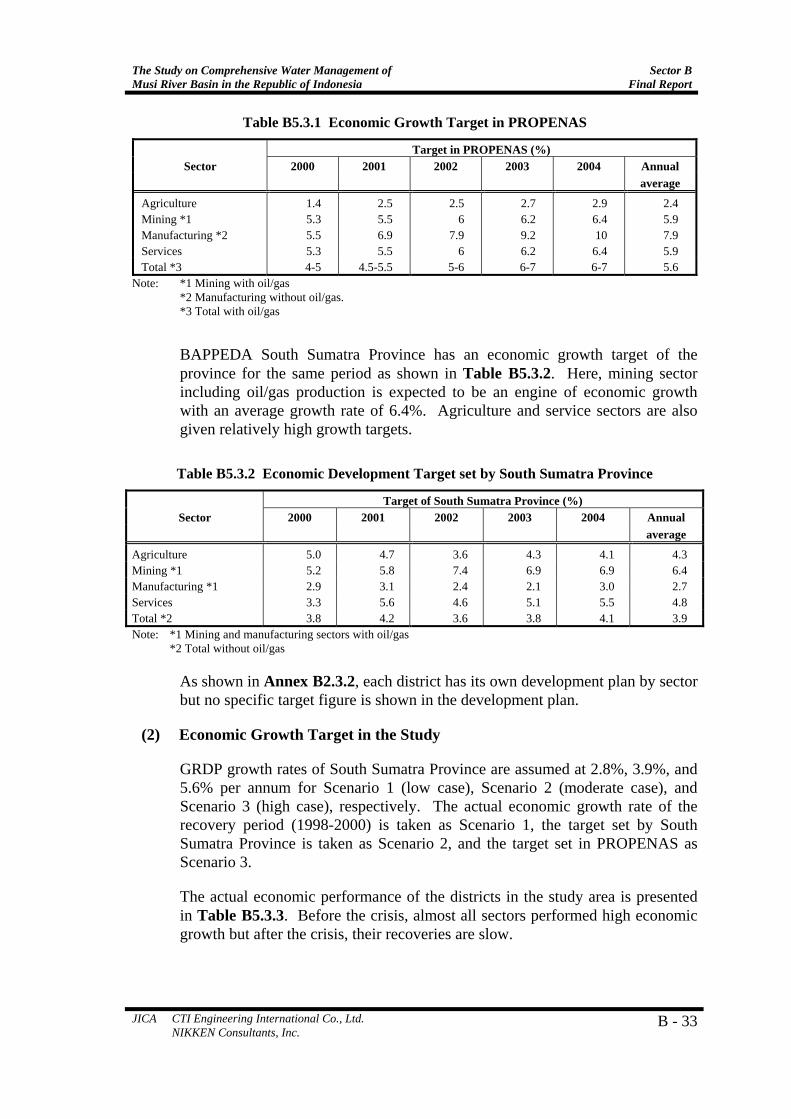
PROPENAS indicates the national economic growth targets for the period from 2000 to 2004 as shown in Table B5.3.1. In the target, the manufacturing industry is expected to be an engine of economic recovery with an annual growth rate of 7.9% while the growth target of the agricultural sector is relatively low with an annual growth rate of 2.4%.
The Study on Comprehensive Water Management of Musi River Basin in the Republic of Indonesia
Sector BFinal Report
JICA CTI Engineering International Co., Ltd. NIKKEN Consultants, Inc.
B - 33
Table B5.3.1 Economic Growth Target in PROPENAS
Target in PROPENAS (%) Sector 2000 2001 2002 2003 2004 Annual
average
Agriculture 1.4 2.5 2.5 2.7 2.9 2.4 Mining *1 5.3 5.5 6 6.2 6.4 5.9 Manufacturing *2 5.5 6.9 7.9 9.2 10 7.9 Services 5.3 5.5 6 6.2 6.4 5.9 Total *3 4-5 4.5-5.5 5-6 6-7 6-7 5.6
Note: *1 Mining with oil/gas *2 Manufacturing without oil/gas. *3 Total with oil/gas
BAPPEDA South Sumatra Province has an economic growth target of the province for the same period as shown in Table B5.3.2. Here, mining sector including oil/gas production is expected to be an engine of economic growth with an average growth rate of 6.4%. Agriculture and service sectors are also given relatively high growth targets.
Table B5.3.2 Economic Development Target set by South Sumatra Province
Target of South Sumatra Province (%) Sector 2000 2001 2002 2003 2004 Annual
average
Agriculture 5.0 4.7 3.6 4.3 4.1 4.3 Mining *1 5.2 5.8 7.4 6.9 6.9 6.4 Manufacturing *1 2.9 3.1 2.4 2.1 3.0 2.7 Services 3.3 5.6 4.6 5.1 5.5 4.8 Total *2 3.8 4.2 3.6 3.8 4.1 3.9 Note: *1 Mining and manufacturing sectors with oil/gas *2 Total without oil/gas
As shown in Annex B2.3.2, each district has its own development plan by sector but no specific target figure is shown in the development plan.
(2) Economic Growth Target in the Study
GRDP growth rates of South Sumatra Province are assumed at 2.8%, 3.9%, and 5.6% per annum for Scenario 1 (low case), Scenario 2 (moderate case), and Scenario 3 (high case), respectively. The actual economic growth rate of the recovery period (1998-2000) is taken as Scenario 1, the target set by South Sumatra Province is taken as Scenario 2, and the target set in PROPENAS as Scenario 3.
The actual economic performance of the districts in the study area is presented in Table B5.3.3. Before the crisis, almost all sectors performed high economic growth but after the crisis, their recoveries are slow.

Sector B Final Report
The Study on Comprehensive Water Management ofMusi River Basin in the Republic of Indonesia
B - 34 JICA CTI Engineering International Co., Ltd. NIKKEN Consultants, Inc.
Table B5.3.3 Actual Economic Growth in Study Area without Oil/Gas
Actual annual economic growth (% p.a.) Sector Whole period Before crisis Recovery period
1993-2000 1993-1997 1998-2000
Agriculture 5.4 7.3 2.5 Mining 3.9 8.1 1.9 Manufacturing 4.2 12.4 0.3 Services 3.7 6.3 4.5 Total 4.3 8.3 2.8
(3) Economic Growth Target by Sector
(a) Agriculture
Agriculture is a single large sector in GRDP and the largest provider of employment. For all the three scenarios, growth in agricultural sector is assumed at 3.4%, which is an average of the provincial target (4.3%) and the actual growth rate of the recovery period (2.5%). Since the province and almost all the districts have the development plans such as intensification, extension, or diversification of crop production, revitalization of local agricultural marketing, agricultural mechanization, and pest control, relatively high growth is assumed for agriculture.
(b) Mining
The mining sector without oil/gas accounted for 5.6% of GRDP of the province. For all the three scenarios, growth in mining sector is assumed at 1.9%, which is the actual growth rate during the recovery period (1998-2000).
(c) Manufacturing and Service Sectors
The manufacturing and service sectors will no doubt be the impetus of the regional economic growth in the future. In the provincial target, relatively low growth of 2.7% p.a. has been set for the manufacturing sector while relatively high growth rate of 4.8% has been targeted for the service sector. This means that the service sector is expected to grow faster than the manufacturing industry. By keeping this relation between manufacturing and service sectors, their growth rates are set so that the whole growth rates become the target growth. The growth rates of the manufacturing sector are assumed at 1.8%, 2.8%, and 4.2% per annum for Scenario 1, Scenario 2, and Scenario 3, while those of the service sector are assumed at 3.2%, 5.0%, and 7.5% respectively.
According to the provincial and districts' development plans, development of agro-industry, development of small and handicraft industry, industrial use of local materials or products, and increase efficiency of production by

The Study on Comprehensive Water Management of Musi River Basin in the Republic of Indonesia
Sector BFinal Report
JICA CTI Engineering International Co., Ltd. NIKKEN Consultants, Inc.
B - 35
knowledge and technology are targeted for manufacturing development. On the other hand, almost all the districts set tourism development as one of the important pillars for development of the service sector. Development of agriculture and manufacturing sectors will no doubt increase the importance of trade and marketing businesses.
(d) Growth Rate of the Districts/Municipality
Based on the above assumption, basically the same growth rates are applied for assumption of economic growth rates of the Districts/Municipality.
5.3.2 Results
The economic growth target of each sector is assumed as summarized below according the development scenarios discussed above:
Table B5.3.4 Economic Growth Target of the Scenarios
Item Unit Scenario 1 Scenario 2 Scenario 3 Agriculture Mining Manufacturing Services Total
% p.a. % p.a. % p.a. % p.a. % p.a.
3.4 1.9 1.8 3.2 2.8
3.4 1.9 2.8 5.0 3.9
3.4 1.9 4.2 7.5 5.6
The results of estimation of the future GRDP are presented in Annex B5.3.1 and summarized below:
Table B5.3.5 Results of Future GRDP Estimation (without oil/gas, 2000 constant price)
Actual Scenario 1 Scenario 2 Scenario 3 District/ GRDP GRDP Growth GRDP Growth GRDP Growth
Municipality in 2000 in 2020 2000-2020 in 2020 2000-2020 in 2020 2000-2020
(Rp. bn) (Rp. bn) (% p.a.) (Rp. bn) (% p.a.) (Rp. bn) (% p.a.)Palembang 8,147 13,973 2.7 18,858 4.3 28,621 6.5 OKU 3,230 5,807 3.0 6,967 3.9 9,285 5.4 OKI 2,916 5,266 3.0 6,205 3.8 8,078 5.2 Muaraenim 3,129 5,211 2.6 5,986 3.3 7,526 4.5 Lahat 2,258 4,108 3.0 4,815 3.9 6,231 5.2 Musirawas 1,710 3,061 3.0 3,623 3.8 4,740 5.2 MUBA 4,501 7,885 2.8 9,429 3.8 12,466 5.2 Total 25,890 45,311 2.8 55,883 3.9 76,947 5.6
Based on the population projection and the future GRDP projection, per capita GRDP at the target year has been estimated as shown below: Since the estimation was made based on GRDP without oil/gas, the results are rather undervalued.

Sector B Final Report
The Study on Comprehensive Water Management ofMusi River Basin in the Republic of Indonesia
B - 36 JICA CTI Engineering International Co., Ltd. NIKKEN Consultants, Inc.
Table B5.3.6 Future Per Capita GRDP (without oil/gas, 2000 constant price)
Actual Per Scenario 1 Scenario 2 Scenario 3 District/ capita GRDP Per capita Growth Per capita Growth Per capita Growth
Municipality in 2000 GRDP 2020 2000-2020 GRDP 2020 2000-2020 GRDP 2020 2000-2020 (Rp.1,000) (Rp.1,000) (% p.a.) (Rp.1,000) (% p.a.) (Rp.1,000) (% p.a.)
Palembang 5,613 6,790 1.0 9,163 2.5 13,907 4.6 OKU 2,785 3,703 1.4 4,443 2.4 5,921 3.8 OKI 2,987 3,753 1.1 4,423 2.0 5,758 3.3 Muaraenim 4,360 5,069 0.8 5,823 1.5 7,321 2.6 Lahat 3,369 4,816 1.8 5,644 2.6 7,304 3.9 Musirawas 2,665 3,236 1.0 3,830 1.8 5,011 3.2 MUBA 3,629 3,974 0.5 4,752 1.4 6,283 2.8 Total 3,776 4,605 1.0 5,679 2.1 7,820 3.7
These results of the socioeconomic forecast are the basis for future water demand estimation and/or estimation of future flood damage potentials in the study.