section1 gulf red grouper - cio.noaa.gov · down-weighting the discard length compositions by...
TRANSCRIPT
SEDAR Southeast Data, Assessment, and Review
_________________________________________________________________
SEDAR 42
Gulf of Mexico Red Grouper
SECTION V: Review Workshop Report
September 2015
SEDAR
4055 Faber Place Drive, Suite 201 North Charleston, SC 29405
September 2015 Gulf of Mexico Red Grouper
2 SEDAR 42 SAR SECTION V REVIEW WORKSHOP REPORT
Table of Contents
Table of Contents ............................................................................................................................ 2
1. INTRODUCTION ................................................................................................................... 2
1.1 WORKSHOP TIME AND PLACE ................................................................................... 2
1.2 TERMS OF REFERENCE ................................................................................................ 2
1.3 LIST OF PARTICIPANTS ................................................................................................ 3
1.4 LIST OF REVIEW WORKSHOP WORKING PAPERS AND DOCUMENTS ............. 4
2. REVIEW PANEL REPORT .................................................................................................... 5
1. INTRODUCTION
1.1 WORKSHOP TIME AND PLACE
The SEDAR 42 Review Workshop was held July 14-16, 2015 in Miami, Florida.
1.2 TERMS OF REFERENCE
1. Evaluate the data used in the assessment, including discussion of the strengths and weaknesses of data sources and decisions, and consider the following:
a) Are data decisions made by the DW and AW sound and robust? b) Are data uncertainties acknowledged, reported, and within normal or expected levels?
c) Are data applied properly within the assessment model? d) Are input data series reliable and sufficient to support the assessment approach and
findings? 2. Evaluate and discuss the strengths and weaknesses of the methods used to assess the
stock, taking into account the available data, and considering the following: a) Are methods scientifically sound and robust?
b) Are assessment models configured properly and used consistent with standard practices?
c) Are the methods appropriate for the available data? 3. Evaluate the assessment findings and consider the following:
a) Are abundance, exploitation, and biomass estimates reliable, consistent with input data and population biological characteristics, and useful to support status inferences?
b) Is the stock overfished? What information helps you reach this conclusion?
September 2015 Gulf of Mexico Red Grouper
3 SEDAR 42 SAR SECTION V REVIEW WORKSHOP REPORT
c) Is the stock undergoing overfishing? What information helps you reach this conclusion?
d) Is there an informative stock recruitment relationship? Is the stock recruitment curve reliable and useful for evaluation of productivity and future stock conditions?
e) Are the quantitative estimates of the status determination criteria for this stock reliable? If not, are there other indicators that may be used to inform managers about stock trends and conditions?
4. Evaluate the stock projections, including discussing strengths and weaknesses, and consider the following:
a) Are the methods consistent with accepted practices and available data?
b) Are the methods appropriate for the assessment model and outputs? c) Are the results informative and robust, and useful to support inferences of probable
future conditions? d) Are key uncertainties acknowledged, discussed, and reflected in the projection results?
5. Consider how uncertainties in the assessment, and their potential consequences, are addressed.
• Comment on the degree to which methods used to evaluate uncertainty reflect and capture the significant sources of uncertainty in the population, data sources, and assessment methods.
• Ensure that the implications of uncertainty in technical conclusions are clearly stated. 6. Consider the research recommendations provided by the Data and Assessment workshops
and make any additional recommendations or prioritizations warranted.
• Clearly denote research and monitoring that could improve the reliability of, and information provided by, future assessments with particular emphasis on the Deepwater Horizon Oil Spill
• Provide recommendations on possible ways to improve the SEDAR process. 7. Consider whether the stock assessment constitutes the best scientific information
available using the following criteria as appropriate: relevance, inclusiveness, objectivity, transparency, timeliness, verification, validation, and peer review of fishery management information.
8. Provide guidance on key improvements in data or modeling approaches which should be considered when scheduling the next assessment.
9. Prepare a Peer Review Summary summarizing the Panel’s evaluation of the stock assessment and addressing each Term of Reference.
1.3 LIST OF PARTICIPANTS
Workshop Panel
September 2015 Gulf of Mexico Red Grouper
4 SEDAR 42 SAR SECTION V REVIEW WORKSHOP REPORT
Luiz Barbieri, Chair ............................................................................................ Chair, SSC Ben Blount ..................................................................................................................... SSC Matt Cieri ........................................................................................................ CIE Reviewer Kai Lorenzen .................................................................................................................. SSC Henrik Sparholt ............................................................................................... CIE Reviewer Geoff Tingley .................................................................................................. CIE Reviewer Analytic Representation Meaghan Bryan ............................................................................................. SEFSC, Miami Adyan Rios .................................................................................................... SEFSC, Miami Appointed Observers Bo Gorham ...................................................................................... Recreational Fisherman Ed Walker ......................................................................................................... Industry Rep Observers Shannon Cass-Calay ..................................................................................... SEFSC, Miami Nancie Cummings ......................................................................................... SEFSC, Miami Michael Drexler .................................................................................... Ocean Conservancy Chad Hanson ................................................................................................................... Pew Bill Harford ................................................................................................. RSMAS/SEFSC Michael Larkin ............................................................................................................ SERO Patrick Lynch ........................................................................................................ NMFS/ST Clay Porch ..................................................................................................... SEFSC, Miami Skyler Sagarese .................................................................................................. SEFSC/UM Staff Julie Neer ................................................................................................................. SEDAR John Froeschke ............................................................................................... GMFMC Staff Ryan Rindone ................................................................................................. GMFMC Staff Charlotte Schiaffo .......................................................................................... GMFMC Staff
1.4 LIST OF REVIEW WORKSHOP WORKING PAPERS AND DOCUMENTS
Documents Prepared for the Review Workshop
SEDAR42-RW-01 Incorporating ecosystem considerations within the Stock Synthesis integrated assessment model for Gulf of Mexico Red Grouper (Epinephelus morio)
Skyler R. Sagarese, Meaghan D. Bryan, John F. Walter, Michael Schirripa,
29 June 2015
September 2015 Gulf of Mexico Red Grouper
5 SEDAR 42 SAR SECTION V REVIEW WORKSHOP REPORT
Arnaud Grüss, Mandy Karnauskas
SEDAR42-RW-02 Assessing the impact of the 2014 red tide event on red grouper (Epinephelus morio) in the Northeastern Gulf of Mexico
John F. Walter III, Skyler R. Sagarese, William J. Harford, Arnaud Grüss, Richard P. Stumpf, Mary C. Christman
14 July 2015 Updated: 20 July 2015
2. REVIEW PANEL REPORT
September 2015 SEDAR 42 – Gulf of Mexico Red Grouper
1
1. SEDAR 42 Review Panel Summary Report The Review Panel was presented outputs and results of the SEDAR 42 Gulf of Mexico red grouper stock assessment. The assessment model framework used was Stock Synthesis 3 (SS3), a highly flexible, integrated analysis, statistical catch-at-age model framework. However, there were significant areas of uncertainty identified in both the data and in components to the model. The Panel had concerns with the lack of more detailed information on red grouper’s reproductive biology (especially regarding social and population factors associated with sexual transition), as well as with the landings and discard data series. Of these, the issues associated with the discard data series were considered to be of the greatest importance. However, despite these concerns, the Review Panel concluded that the data used in the assessment were generally sound and robust. Likewise, data generally were applied properly and uncertainty in data inputs was appropriately acknowledged. Numerous sensitivity analyses and exploration of alternative scenarios were presented and discussed during the Review Workshop all of which broadly agreed with the base model run conclusions of stock status. Outputs and diagnostics of a new base model configuration recommended by the Review Panel (RW1) could not be completed and reviewed during the in-person Review Workshop. Therefore, more complete assessment documentation was reviewed and approved a posteriori by e-mail. Notwithstanding these problems, the Review Panel was very impressed with the performance of the assessment team. It was clear the analytical team had put considerable thought into the development of the assessment model, which by necessity is very complex. The stock was estimated to be not overfished and not undergoing overfishing. Since the stock-recruitment relationship could not be estimated the Panel recommended the use of proxy reference points (SPR30%). Current level of spawning potential biomass (SPB2013, expressed in number of eggs) is estimated to be above MSST (SPB2013/MSST = 1.38), and the estimated current level of fishing mortality (F2010-2013) is about half of F30%SPR (F2010-2013/F30%SPR = 0.52), although these observations have an associated moderate to high level of uncertainty. 2. Terms of Reference:
1. Evaluate the data used in the assessment, including discussion of the strengths and
weaknesses of data sources and decisions, and consider the following: General Comments:
Overall the Panel observed that key descriptions on the data elements were not in the final report prepared for the review, despite their importance in how the base model was set up. While many of these can be found in the data workshop report, it was thought that inclusion of these in the review report would be clearer. Further, there was little discussion or justification in the review report as to why the assessment working group chose the current model, fleet structure, start year, and other key elements. This information needs to be included in the review report so that the train of logic can be followed from data workshop, though assessment workshop, to review workshop.
A wide array of input data were used in this assessment. These included: Life History
• Age and growth
September 2015 SEDAR 42 – Gulf of Mexico Red Grouper
2
• Fecundity • Natural mortality • Maturity • Sex transition
Landings • Handline: 1986-2013 • Longline: 1986-2013 • Trap: 1986-2006 • Charter /Private: 1986-2013 • Headboat 1986-2013
Discards • Handline: 2007-2013 (observer program) • Longline: 2007-2013 (observer program) • Trap: Charter/Headboat/Private: 1986-2013
Length composition of discards by fleet • Handline: 2006-2013 (observer program) • Longline: 2006-2013 (observer program) • Charter: 2010-2013 (observer program) • Headboat: 2005-2007, 2009-2013 (observer program)
Age composition of retained catch • Handline: 1991-2013 • Longline: 1991-2013 • Charter/Headboat/Private: 1991-2013
Abundance indices • Handline: 1993-2009 • Longline: 1993-2009 • Charter/Private: 1986-2013 • Headboat: 1986-2013 • Combined video survey: 1993-1997, 2002, 2004-2013 • SEAMAP summer groundfish survey: 2009-2013 • NMFS bottom longline survey: 2001, 2003-2013
The Review Panel examined the available information on life history. They noted that the maturity schedule, the transition from females to males, fecundity, and growth/size at age were all static across years. While there is little data to support alternatives, it is likely that life history traits change based on environmental factors and/or may be subject to density-dependent variation. In particular, the ratio of males to females, the transition from females to males, and the fecundity could have large impacts on reference points and advice on sustainable harvest levels.
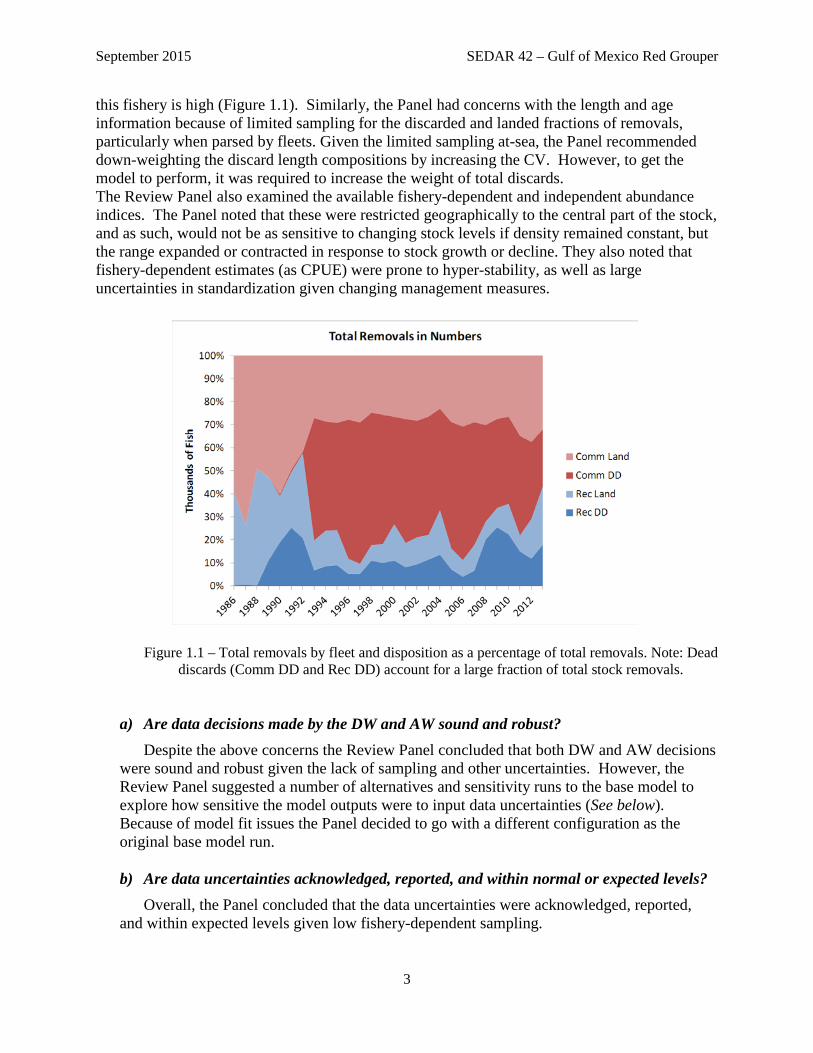
The Review Panel had a number of concerns with the landings and discard data series as well as the fishery dependent sampling. While commercial landings were well known, recreational landings were not as precise given the change from MRFSS to MRIP. More importantly, the level of removals as dead discards, both commercial (Comm DD) and recreational (rec DD) in
September 2015 SEDAR 42 – Gulf of Mexico Red Grouper
3
this fishery is high (Figure 1.1). Similarly, the Panel had concerns with the length and age information because of limited sampling for the discarded and landed fractions of removals, particularly when parsed by fleets. Given the limited sampling at-sea, the Panel recommended down-weighting the discard length compositions by increasing the CV. However, to get the model to perform, it was required to increase the weight of total discards. The Review Panel also examined the available fishery-dependent and independent abundance indices. The Panel noted that these were restricted geographically to the central part of the stock, and as such, would not be as sensitive to changing stock levels if density remained constant, but the range expanded or contracted in response to stock growth or decline. They also noted that fishery-dependent estimates (as CPUE) were prone to hyper-stability, as well as large uncertainties in standardization given changing management measures.
Figure 1.1 – Total removals by fleet and disposition as a percentage of total removals. Note: Dead
discards (Comm DD and Rec DD) account for a large fraction of total stock removals.
a) Are data decisions made by the DW and AW sound and robust? Despite the above concerns the Review Panel concluded that both DW and AW decisions
were sound and robust given the lack of sampling and other uncertainties. However, the Review Panel suggested a number of alternatives and sensitivity runs to the base model to explore how sensitive the model outputs were to input data uncertainties (See below). Because of model fit issues the Panel decided to go with a different configuration as the original base model run.
b) Are data uncertainties acknowledged, reported, and within normal or expected levels?
Overall, the Panel concluded that the data uncertainties were acknowledged, reported, and within expected levels given low fishery-dependent sampling.
September 2015 SEDAR 42 – Gulf of Mexico Red Grouper
4
c) Are data applied properly within the assessment model? Overall the Panel found that the application of the data within the model was properly
done. However the Panel did recommend changes to the model structure as well as sensitivity analyses to examine model behavior in light of data variability and uncertainty (See below).
d) Are input data series reliable and sufficient to support the assessment approach and
findings? The Panel noted the lack of fishery dependent sampling, the restricted geographic range
of the surveys, the high discard and low levels of at-sea sampling, and the lack of information or data on the socio-biology of the species spawning and recommended a number of model runs to test the sensitivity of the model results, and to examine model behavior. These runs included: (a) Modeling the recreational fleet as one fleet, as was done in the previous benchmark, (b) Starting the model in 1993 to better encapsulate the start of both the fishery-dependent and independent sampling, (c) Relaxing the fit to the landings in light of the transition from MRFSS to MRIP, (d) Removing the fishery-dependent abundance indices given issues with hyper-stability, (e) increasing and decreasing the fit to the discards and the length distributions of discards given low sampling. For these runs resulting residuals and selectivity’s were examined to observe model behavior.
2. Evaluate and discuss the strengths and weaknesses of the methods used to assess the
stock, taking into account the available data, and considering the following: a) Are methods scientifically sound and robust?
The stock was assessed with a model developed using the Stock Synthesis 3 (SS3) software. This is a modern and up to date assessment tool which is very flexible and designed to handle assessment like this. It is scientifically sound and robust if configured appropriately. There is a small issue around its documentation. The software is developed constantly and the user guide is often lacking behind. Proper tests of each new version could also be an issue as the best test is often the test of time. SS3 demand a very high level of experience by the user and often the person behind the tool (Rick Methot) has to be called for assistance. Given that SS3 works correctly and that the user is experienced, it is probably one of the best assessment software available for assessments like the present one.
b) Are assessment models configured properly and used consistent with standard practices? A major problem was apparent in the configuration of the base model initially presented
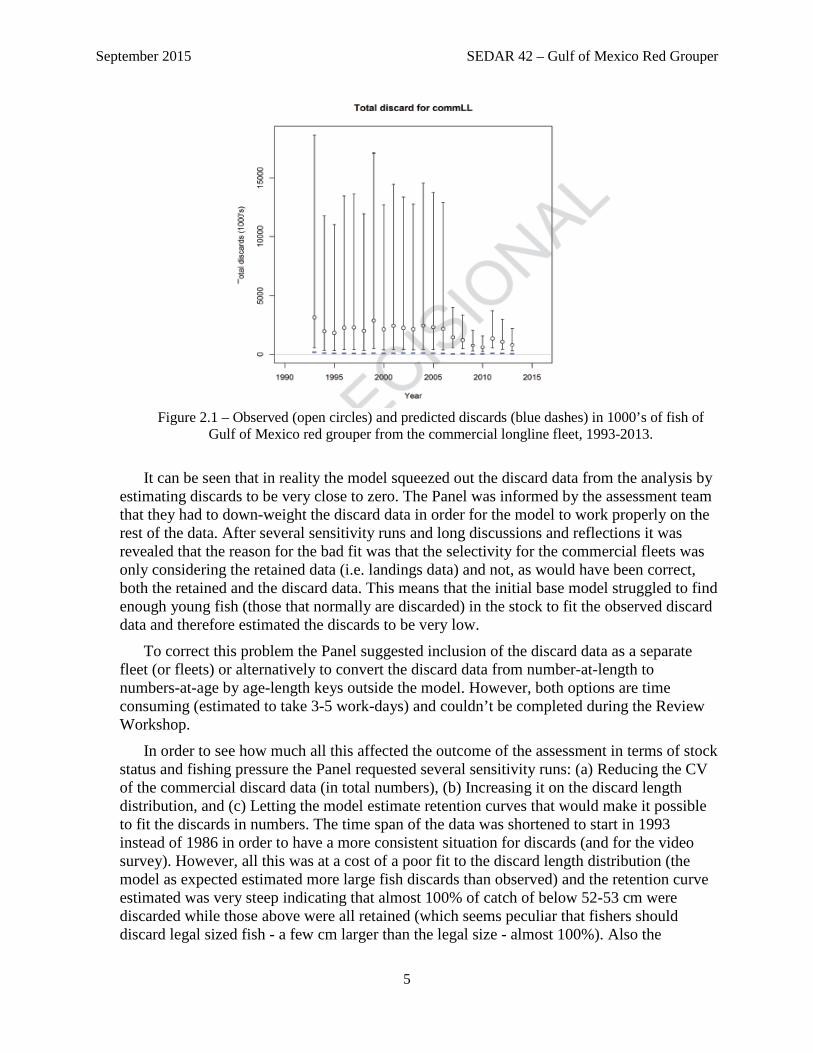
to the Panel. Discard data from the commercial fleets were not fitted by the model. This is illustrated for the long-line fleet (Figure 2.1).
September 2015 SEDAR 42 – Gulf of Mexico Red Grouper
5
Figure 2.1 – Observed (open circles) and predicted discards (blue dashes) in 1000’s of fish of
Gulf of Mexico red grouper from the commercial longline fleet, 1993-2013.
It can be seen that in reality the model squeezed out the discard data from the analysis by
estimating discards to be very close to zero. The Panel was informed by the assessment team that they had to down-weight the discard data in order for the model to work properly on the rest of the data. After several sensitivity runs and long discussions and reflections it was revealed that the reason for the bad fit was that the selectivity for the commercial fleets was only considering the retained data (i.e. landings data) and not, as would have been correct, both the retained and the discard data. This means that the initial base model struggled to find enough young fish (those that normally are discarded) in the stock to fit the observed discard data and therefore estimated the discards to be very low.
To correct this problem the Panel suggested inclusion of the discard data as a separate fleet (or fleets) or alternatively to convert the discard data from number-at-length to numbers-at-age by age-length keys outside the model. However, both options are time consuming (estimated to take 3-5 work-days) and couldn’t be completed during the Review Workshop.
In order to see how much all this affected the outcome of the assessment in terms of stock status and fishing pressure the Panel requested several sensitivity runs: (a) Reducing the CV of the commercial discard data (in total numbers), (b) Increasing it on the discard length distribution, and (c) Letting the model estimate retention curves that would make it possible to fit the discards in numbers. The time span of the data was shortened to start in 1993 instead of 1986 in order to have a more consistent situation for discards (and for the video survey). However, all this was at a cost of a poor fit to the discard length distribution (the model as expected estimated more large fish discards than observed) and the retention curve estimated was very steep indicating that almost 100% of catch of below 52-53 cm were discarded while those above were all retained (which seems peculiar that fishers should discard legal sized fish - a few cm larger than the legal size - almost 100%). Also the
September 2015 SEDAR 42 – Gulf of Mexico Red Grouper
6
selection pattern by fleet deteriorated as they became bimodal. Clearly, indications of a situation, where the model with these moderations was not fitting the data well, re-emphasising that the Panel’s recommendation of redoing the model with discard data included in a way that they are used in the estimation of the selectivity of the commercial fleets, is important. Various other moderations to the model like fixing the steepness of the S-R to close to 1, merging the Headboat recreational fleet with the two other recreational ones, and putting more weight at the surveys were also ran.
The overall impression was that it did not change the trend and level of the spawning stock size and nor the fishing mortality very much. The Panel did not have much time to analyse what it meant for reference points, like FMSY and F30%SPR, but it is likely that the effect of the discard problem would be greater here. However, the stock biomass was in the cases tested well above reference levels and the F well below, so the basic question of whether the stock is overfished or is experiencing overfishing can still be answered with a “No” for both, but with moderate to high level of uncertainty.
Selection pattern is always difficult to estimate in stock assessments. The question is how dome shaped is it or maybe even flat. Usually, there are not data or knowledge to estimate this. The type of data needed would be reliable observations of absolute numbers of the older component of the stock, which are almost never available. In the current assessment, a random walks approach was used, with no trend assumed. This seems to work quite well and put a flat selection on the long line survey data, which seems reasonable, as this survey covers the total distribution area of the stock, and one would not expect much hook size selection in the upper fish size range. This gave a dome shaped selection for the other fleets. For the commercial fleets the selection on older fish decreased to about half the one on the main age selected for, which seems reasonable as the fishers probably do not fish so much in very deep water where the older fish are more abundant than in shallower water where the main age groups of the stock are found. The shrimp trawl survey had a very low selection on older fish and given that the survey covers the entire distribution area (shallow to deep water) of all age groups, the reason could be that the gear simply is hauled too slowly or the net opening is too narrow for catching the older fish.
The stock recruitment relationship was not very informative. There was almost no correlation between R and S. The Panel found that a steepness (h) of 0.8 was a bit low compared to other comparable fish stocks (around 0.9 would be more in line with other similar stocks) and concluded that it was better to fix it to almost one (here 0.99). Fixing h = 0.99 should not be interpreted as a measure of very high stock productivity of the stock at very low stock sizes, but is merely a method for implementing a forecast going forward with random recruitment.
The Panel did not have much time to discuss the reference points due to the need to spend much time on the discard problem mentioned above. However, the immediate opinion of the Panel was that to compensate for the uncertainty in the productivity of the stock, the review group suggests using SPR reference points as reference points rather than the development of MSY reference points.
A minor point was that the S-R model was estimated with 4 parameters, steepness, R0 and R1, and a variance parameter, while only 3 parameters seems to be needed, as two of the
September 2015 SEDAR 42 – Gulf of Mexico Red Grouper
7
three parameters: steepness, R0 and R1, would suffice to determine the shape of the B&H S-R curve.
Another minor issue was that the selection patterns used for the commercial CPUE indices were identical to that for the total fishery by the given fleet. This was questioned, because the indices were calculated based on GLM models which take care of part of the selectivity of the commercial fleets, by e.g. stratifying by depth. However, it seems that the SS3 cannot easily accomplish that sophistication.
Red tide mortality was taken care of by creating an artificial fleet with only catch (all discards) in 2005. The Panel was informed that this worked well for the gag grouper assessment made recently. The Panel fund this approach sensible. Some ramping could be tried and it was also mentioned that if the red tide is a usual phenomenon then it is implicitly included in Hoenig’s formula (because it will influence the observed maximum age) in which case the approach was a kind of double counting for that mortality. The data presented and the knowledge about the red tide events made the Panel comfortable with the approach chosen by the assessment group.
After examination of model results and diagnostics the Panel decided to recommend changes to the base model. These included (RW_run1): (1) Starting the model in 1993 as opposed to 1986, (2) Combining private, charter, and headboat sectors as just one recreational fleet, (3) Setting steepness to 0.99 and using median recruitment in projections, (4) Relaxing the fit to the landings, (5) increasing the fit on the survey indices, (6) increasing the CV on the discards, and (7) Using batch fecundity as the metric of egg production. An alternate run (RW_run2) was also proposed with the same configuration as the above run, but with only the fishery-independent indices used. Outputs and diagnostics of a new base model configuration recommended by the Review Panel (RW1) could not be completed and reviewed during the in-person Review Workshop. Therefore, more complete assessment documentation was reviewed and approved a posteriori by e-mail.
c) Are the methods appropriate for the available data? Even though the SS3 model framework cannot handle landings and discard data from a
given fleet given in different units (by age or by length), the model can still be used and is still appropriate, if the discard data in this case are transformed outside the model from length to age based using appropriate age-length keys, or alternatively, the discard data are inserted as a separate fleet (or fleets). There might also be other ways to circumvent the problem.
3. Evaluate the assessment findings and consider the following: a) Are abundance, exploitation, and biomass estimates reliable, consistent with input data
and population biological characteristics, and useful to support status inferences? As stated above the Panel would much prefer to see a revised assessment with discard
data included in the selection pattern estimates for the commercial fleets. However, some deductions can be made of the current assessment. This is mainly because the stock is well clear of the reference points that a revised assessment is unlikely to change this. The run where discards are not underestimated should in that case be the one to use for setting catch limits and reference points. The base run in the assessment report should probably not be
September 2015 SEDAR 42 – Gulf of Mexico Red Grouper
8
used because it ignored almost completely the commercial discard data and will therefore bias the F reference points upwards, and biomass reference points downwards.
In the AW report several different units of fishing mortality were used and it was not always clear which unit was used. Ideally, only one unit should be used in order to easy comparison.
b) Is the stock overfished? What information helps you reach this conclusion? The various runs all supported the notion that the stock has increased in recent years and is not overfished.
c) Is the stock undergoing overfishing? What information helps you reach this conclusion? The various runs all supported the notion that fishing mortality has decreased in recent
years and that the stock is not undergoing overfished.
d) Is there an informative stock recruitment relationship? Is the stock recruitment curve reliable and useful for evaluation of productivity and future stock conditions? The stock recruitment relationship is not informative as the relationship observed is
almost flat, i.e. no correlation between R and S. The unknown feature is how quickly recruitment gets impaired (e.g. though socio-biological means) if the stock declines to sizes lower than hitherto observed. As long as the stock is maintained above the lowest observed level, recruitment should not be impaired.
e) Are the quantitative estimates of the status determination criteria for this stock reliable? If not, are there other indicators that may be used to inform managers about stock trends and conditions? The review panel concluded that the MSY benchmarks provided by the AW were not
reliable because of the uncertainty about the stock-recruitment relationship. Therefore, the Panel recommended the use of 30% SPR proxy reference points (based on past practice for this stock). However, this might change if a new assessment shows that the stock recruitment relationship is more informative and properly estimated.
The uncertainty of 30% SPR reference points with respect to the relevant estimated productivity processes (i.e. growth, maturities, and selectivities) was not evaluated. Further, care should be taken to avoid stock declines to below the lowest observed stock size because the productivity at such lower stock sizes is not well established.
Female egg production (fecundity) was used at the stock biomass reference points. This seems appropriate. Gonad weight was judged problematic as red grouper is a batch spawner and thus gonad weight fluctuates over the spawning season. Female mature biomass might be a robust alternative, but will miss changes in fecundity due to poor growth, density dependence and the like. It is suggested to also consider including male mature biomass for this stock as a reference point, because apparently the percentage of males can get very low for species like this, which are first females and at a later stage become males (protogynous hermaphroditism).
September 2015 SEDAR 42 – Gulf of Mexico Red Grouper
9
On a longer term basis, it was considered useful to analyse and reflect on including density-dependence in growth, sex change, maturity, and cannibalism mortality in the reference point determination, in order to get these as realistic and unbiased as possible.
4. Evaluate the stock projections, including discussing strengths and weaknesses, and
consider the following: a) Are the methods consistent with accepted practices and available data? b) Are the methods appropriate for the assessment model and outputs? c) Are the results informative and robust, and useful to support inferences of probable
future conditions? d) Are key uncertainties acknowledged, discussed, and reflected in the projection
results? The Review Panel agreed on a number of serious concerns over the presented assessment.
Principal of these was the virtual lack of fit of all model runs and sensitivities to the discard data, although other concerns were also made, for example, about the quality of the retained abundance index data and the choice of start date for the model. Given these concerns the Panel decided not to use the limited time available for the review in collectively considering the prepared projections as planned. This decision was made as there was insufficient time available to both review the projections and explore alternative model runs to address the concerns expressed above. The Panel, therefore, focused on working with the Assessment Team to develop alternative models that better captured, in particular, the issue of lack of fit to the discard data.
The review of projections was conducted by correspondence following the RW. In preparing the comments about projections below, the Panel has tried to take in to account the drawbacks of this approach to developing review comments, and reflect the additional uncertainty in their comments.
a) Are the methods consistent with accepted practices and available data?
The approaches used to develop the projections for all models, including RW1 and RW2, and sensitivities look to be appropriate for the stock, available data and consistent with accepted practice.
b) Are the methods appropriate for the assessment model and outputs?
The methods are appropriate to the assessment presented and the model runs developed during the RW.
c) Are the results informative and robust, and useful to support inferences of probable
future conditions?
Due to the concerns about the underlying models rather than the projection methodology, the results presented are unlikely to be robust or to support inferences about future conditions. However, the approach, if repeated on an accepted base model, would be
September 2015 SEDAR 42 – Gulf of Mexico Red Grouper
10
expected to be both robust and to provide a basis for inferring probable future conditions for the stock.
d) Are key uncertainties acknowledged, discussed, and reflected in the projection results? Most of the key uncertainties are clearly acknowledged (discards, steepness) but other are
not recognized (index retention, model start date). Discussion of uncertainties within the projection sections of the AW Report was overly brief.
Inclusion of projection sensitivities to some of the key variables is strongly recommended for this fishery. These should specifically include, steepness and recruitment. Steepness because this parameter is poorly understood in this stock and where assumptions about the value used in the assessment appears too low and would have underestimated productivity; and recruitment as the assumed pattern of recruitment will likely play an important role in determining future stock status. Specifically, assuming average recruitment (i.e. all years) as done in the projections presented, will likely have very different outcomes compared to using recent average recruitment (e.g. last eight years), as recent recruitment has been below average over this period. This is particularly important given the relatively long projection time-scales typically used.
Note that, had time permitted, most of the issues with the projections identified above would have been fully discussed and addressed during the RW.
5. Consider how uncertainties in the assessment, and their potential consequences, are
addressed.
• Comment on the degree to which methods used to evaluate uncertainty reflect and capture the significant sources of uncertainty in the population, data sources, and assessment methods.
• Ensure that the implications of uncertainty in technical conclusions are clearly stated.
A variety of methods were used to evaluate the uncertainty about the model structure, key parameters, stock status, projections, and reference points. These aspects of uncertainty are discussed sequentially below, as indicated by the ‘5-number’ subheadings below. Overall, the uncertainty analysis successfully addressed the main sources of uncertainty.
5.1. Model structure
The SEDAR 42 benchmark assessment involved a transition from the previously used ASAP (Age Structured Assessment Program) model to the Stock Synthesis III model. A ‘continuity run’ was conducted by applying the Stock Synthesis model to the data used in the 2009/10 update assessment (the last assessment conducted with ASAP) to check that the two models produced similar results on the same data. Two versions of the continuity run were conducted, one with natural mortality, growth, fecundity, selectivity, retention and stock-recruitment parameters fixed at the ASAP values and one in which selectivity parameters and R0 (unexploited equilibrium recruitment) were estimated. Both continuity runs produced results and management advice that were similar to those obtained previously from the
September 2015 SEDAR 42 – Gulf of Mexico Red Grouper
11
ASAP model. The Stock Synthesis model was therefore adopted and used for all analyses in SEDAR 42.
Different configurations of the model in terms of model start year and weighting of different data components were explored. Primarily these variations on the model were explored in an attempt to find a configuration that would provide good fits to indices as well as discard numbers and length distributions, which proved difficult to achieve. A jack-knife (‘leave one out at a time’) analysis of the abundance indices was also conducted to determine which index or indices were most influential on abundance estimates, recruitment, and exploitation. However, even extreme configurations which effectively excluded either the discard data or the indices did not provide substantially different results with respect to stock status or management advice. The panel therefore felt that this uncertainty should not preclude use of the assessment (e.g. RW_1 or RW_2) for management advice. It was noted, however, that a better representation of discards and discard mortality in the modeling is a low hanging fruit that, with only a very moderate work effort ( say a week’s work) by the assessment experts, would make the whole assessment and the deductions of management advice, much more certain
5.2. Key parameters
Uncertainty about the natural mortality rate M was addressed using sensitivity runs with
scenarios based on lower and higher M vectors than the base AW model. The effect of increasing the assumed M was that the estimated stock increased. The range of M values used in the sensitivity runs was narrower than the range implied by use of a wide variety of comparative estimators, and no clear motivation was provided for the choice of the Hoenig estimator to scale the Lorenzen mortality curve for the base run. However, the choices are consistent with previous practice and were deemed appropriate by the panel.
Growth was modelled using a time-invariant von Bertalanffy growth model. Uncertainty in the relationship between variance and age was explored using different error model configurations and found to have a minimal influence on estimated man growth parameters. The possibilities that growth may vary in a density-dependent or environmentally driven manner were discussed but not analysed.
Female egg production (fecundity) was used for the stock biomass reference points. This is considered biologically appropriate because gonad weight fluctuates over the spawning season. The relationship between batch fecundity and length at length was investigated upon request from the panel and found to be satisfactory.
Uncertainty in the stock recruitment relationship was analyzed using profile likelihood. The analysis indicated that steepness was most likely in the range of 0.8-0.85, but poorly defined. The Panel considered a steepness (h) of 0.8 was low compared to other similar stocks (around 0.9). Given this uncertainty, the panel recommended not to develop MSY-based references points but to use 30% SPR proxy reference points. This is consistent with past practice for this stock.
Uncertainties in selectivity patterns were explored in a comparison of three model runs provided after the review workshop. A random walk approach was used to describe age-
September 2015 SEDAR 42 – Gulf of Mexico Red Grouper
12
based selectivity patterns, i.e. no prior assumptions on the shape of the selectivity curve were made.
5.3. Stock status, projections, and reference points The uncertainty of 30% SPR reference points with respect to the relevant estimated
productivity processes (i.e. growth, maturities, and selectivities) was not evaluated during the RW.
6. Consider the research recommendations provided by the Data and Assessment workshops
and make any additional recommendations or prioritizations warranted.
− Data Workshop Recommendations: Recommendation 1: Time-varying natural mortality
Research is required to incorporate inter-annual variation in red grouper natural mortality within the assessment process. In particular, elevated mortality rates in fishes, including members of the shallow-water grouper complex, can be caused by severe red tide events (Flaherty & Landsberg 2011). A red tide severity index (Walter et al. 2013) was previously included in the base stock assessment model for Gulf of Mexico gag grouper, which improved model fits to indices of abundance (Sagarese et al. 2014b). In the Gulf of Mexico gag grouper assessment (SEDAR 33), fluctuations in red tide mortality varied more than 10-fold through time, and were estimated to be commensurate with fishing mortality rates in several “severe” years (Sagarese et al. 2014b). Like the gag grouper SEDAR assessment, red tide severity should be considered as a source of mortality for red grouper. This recommendation requires at least four research steps: 1) length/age composition data are needed to determining lengths/ages susceptibility to red
tide severity. Collections of fish during red tide events would allow for the size/age selectivity of
mortality to be determined, and might also allow for some minimum estimates of total mortality. Preliminary data were distributed by the NMFS Panama City Laboratory containing red grouper lengths and estimated ages for 16 individuals collected from the Big Bend region during August 1st and 3rd of 2014. During plenary, various participants noted that collection of samples during the NMFS bottom longline survey was complicated by the decomposed nature of many fish encountered, which also prevented length estimates. In addition, otoliths were often difficult to recover from some specimens because they were missing anterior portions of their body. 2) existing indices of red tide severity should be updated.
The IEA Group recommends research to produce candidate indices of red tide severity and to devise scenarios based on red tide indices and methods for inclusion in the red grouper Stock Synthesis assessment model. Updating red tide indices is difficult because the original red tide indices (Walter et al. 2013) were created using SeaWiFS (operational 1998 – December 2010) satellite sensors. More recently, MODIS (Moderate Resolution Imaging Spectrometer) satellite sensors (July 2002 – present) have been used to detect and track harmful algal blooms (Stumpf et al. 2003, Hu et al. 2005). Thus, steps need to be taken to (i) calibrate SeaWiFS and MODIS satellite data during overlap periods; (ii) extend the red tide

September 2015 SEDAR 42 – Gulf of Mexico Red Grouper
13
index through the present period (2014); and (iii) automate compilation of satellite data, and calculation and reporting of index values. 3) procedures for incorporating red tide indices into Stock Synthesis should be critically
evaluated. Simulations should be conducted to evaluate the consequences of assuming constant or
size specific natural mortality, when mortality actually fluctuates according to episodic temporal events. Further, approaches to incorporating environmental indices in stock assessment tuning procedures should be compared through simulated datasets to evaluate the effects of assessment model misspecification. 4) the statistical properties of red tide indices should be characterized for use in simulations
and assessment projections. Evaluate whether all levels of red tide severity are equally likely in near-term future
events, or whether information is contained in red tide indices that can be used to generate ‘forecast distributions’. Time series decomposition can be used to statistically characterize red tide indices (Stumpf et al. 2003). By quantifying periodicity, trends, and stochasticity, ‘forecast distributions’ may enable plausible future scenarios to be considered in assessment projections.
Recommendation 2: Index of red tide mortality derived from Ecopath with Ecosim
The IEA working group agreed that additional efforts deriving natural mortality values from the WFS Red tide Ecopath with Ecosim model would be helpful as presented for gag grouper during SEDAR 33 (Gray et al. 2013). These modeling efforts would allow red tide events to affect multiple components of the West Florida Shelf ecosystem and to assess the overall effect of red tide and predator/prey dynamics on the mortality rates of Gulf of Mexico red grouper.
Recommendation 3: Elucidating the response of red grouper to red tide events
Future modeling efforts should aim to address whether groupers move in response to red tide events or if they experience elevated natural mortality during these episodic events.
Recommendation 4: Modifications to the CMS modeling framework
Additional fisheries-independent data (e.g., PCLAB data) will be incorporated in the datasets used for habitat modeling of red grouper. This will allow us to improve the predictions made by the binomial GLMs described in SEDAR42-DW-04. Thus, we will be able to better predict the probability of presence of adult red grouper on the West Florida Shelf and, therefore, to better simulate the production of red grouper eggs over space in the CMS. The life history working group brought up concerns regarding the aggregated use of all adult red groupers in determining the number of eggs released at red grouper spawning sites. There is evidence in red grouper that the fecundity of large adult females is considerably higher than that of small adult females. To account for this, the IEA group will use data compiled by the life history group to calculate mean age at depth for red grouper. This information will be useful to estimate the number of eggs released at each red grouper
September 2015 SEDAR 42 – Gulf of Mexico Red Grouper
14
spawning site based on (1) the probability of presence of adult red grouper at that site; and (2) the relative fecundity at that site. The relative fecundity at each spawning site will be determined from: (1) the depth at that site; (2) the mean age at depth profile; and (3) the fecundity-at-age (number of eggs released during a spawning event at age) profile. Also, the CMS index should be extended to cover 2014 to provide insight into potential recruitment for the first year of projections.
Recommendation 5: Enhance fish kill reporting, particularly in offshore regions
Current understanding of fish killed by red tide events largely originates from the Florida Fish and Wildlife Conservation Commission and Fish and Wildlife Research Institute fish kill database, which is informed by a statewide fish kill hotline (http://research.myfwc.com/fishkill/). Many of the observations are based on fish that washed ashore following red tide events. Enhanced reporting of red tides, in addition to observations from offshore waters by recreational and commercial fishermen, could increase understanding of how red tide events impact offshore species. This could be achieved through the creation of a national program or increased citizen science through outreach educating fishermen and other Gulf patrons on their ability to improve fish kill reporting.
− Assessment Workshop Recommendations:
The AW Report included a Recommendation Section, but the individual recommendations were for methodological improvements and not specifically for future research to produce new data. Nonetheless, the recommendations address problems or issues for improvements in the quality of SEDAR workshop reports, and testing of hypotheses may be necessary to further develop the methods recommended. The recommendations, as stated in the AW Report, are: 1) Evaluate existing methods for deriving historical discard numbers and discard rates and
improve methods as appropriate. 2) Develop/evaluate methods to maintain continuity of fishery-dependent indices in light of
management regulations and IFQs. 3) Considering red tide as an unpredictable event, but can be a significant source of
mortality, a response protocol should be developed for data collection and incorporation of the information into updated assessments.
4) The start of this assessment in 1986. Future assessments should investigate extending the assessment model further back in time.
5) Develop protocol for reliable estimation of fishery discards.
− Review Workshop Recommendations (numbered in order of priority) 1) Questions were raised in workshop discussions about changes in reproductive success
with age and with population concentration. Although it is known that reproductive success is mitigated by social factors, the degree and extent of mitigation is not well understood. More data are needed to better address the topic, including addressing time-varying changes within age categories. How much variation exists in size at age?

September 2015 SEDAR 42 – Gulf of Mexico Red Grouper
15
Insufficient information leads to greater uncertainty and can have impacts on reference points.
2) The review panel raised questions throughout the evaluation of the assessment reports about the basis or bases of decisions to use the variables actually used. The recommendation is for analysts to provide a justification or rationale for the selection criteria. Review panel evaluations could be more accurately motivated if the selection criteria were better reported. Selection criteria would thereby be carried forward in the evaluations.
3) Paralleling the AW Report, discussions in the Review Workshop focused on initial conditions of the red grouper stock, including assessment of the stock from 1986 to 1993. Composition data was more complete from 1993, raising questions about methods to approach composition prior to that data, in effect, how to decide on what methods and procedures to use and how to establish preferences. The sense of the Review Workshop members was that procedures of ramping up were needed.
4) The core problem in the red grouper assessment was the data on discards. Procedures for reporting discards were not consistent across the fleets, and the fit to indices were poor, leading to major sources of uncertainty. Numerous sensitivity runs helped to reduce the lack of fit, especially up-weighting the commercial fishery dependent data, but problems remain. Discards were missing from the shark longline fishery, raising questions about the amount of resultant uncertainty. Research to address best practices in the reporting of discards is needed in regard to the red grouper stock. Especially useful, also, would be to increase the number of observers and observations among the commercial fleets.
5) Develop a standard protocol for ensuring that appropriate uncertainty in recruitment is applied when developing projections. Using a long-term average recruitment, as the median was used in this assessment, may lead to very different projections, and thus different management advice, compared to a lower or higher average recruitment based on a more recent time-period that may be more likely to reflect the biological/environmental realty of the stock.
6) Research is needed to help address questions about how fecundity can best be measured. Fecundity is a preferred measure for stock biomass and is a function of the number of eggs produced, but it has to be measured indirectly. Gonad weight can be used as a proxy, but obtaining reliable weights can be problematic, dependent in part on methods and timing of data acquisition. Research to address more accurate measurement of gonad weight and to develop protocols would be helpful.
7) Actual measures of individual growth are needed within age categories, as opposed to relying on common assumptions about growth rates and outcomes. Differential growth rates may occur in stock sub-structure within localized species, due to characteristics of the stock and ecosystem variables, or both. They may also affect schedules for hermaphroditic changes, impacting sex-age class composition.
8) Sensitivity runs to assess the impact of the 2005 red tide event on red grouper landings did not show any significant differences from the base model, including fit to discards. Documentation of the red tide mortality, however, presents methodological difficulties. Although analyses of data suggest that red tide primarily affected ages 0+, composition of
September 2015 SEDAR 42 – Gulf of Mexico Red Grouper
16
the red tide kills are difficult to measure, given problems of access to the red tide zones and incomplete records of age, size, and sex in the kills. In addition, red tide events may be best considered in reference to ecosystem considerations (SEDAR42-5W-01). As environmental indices become incorporated into single stock species, criteria for inclusion have to be tested and measured, toward a goal of balanced biological and mechanistic explanation, statistical significance, and predictive performance. More research for red tide impacts on red grouper stock status is especially appropriate, given that the majority of landings are on Florida’s West Continental Shelf, where high concentrations of red tide tend to be located.
9) Red grouper are found throughout the Gulf of Mexico and in the Atlantic from Brazil to the southeastern US. Catch levels and age composition data from Cuba, the Caribbean, and especially Mexico would allow for more complete stock assessment. Data could be obtained from the Mexican organization MEXAS.
10) The average age and thus size of females changing to males are known, but a more complete understanding of the conditions under which the changes occur would be helpful for assessing stock size. The number of males in relation to minimum stock size would be a useful metric for stock assessments.
a) Clearly denote research and monitoring that could improve the reliability of, and
information provided by future assessments with particular emphasis on the Deepwater Horizon Oil Spill. SEDAR 42 did not directly address the impacts of Deepwater Horizon on red grouper
stock status. Earlier SEDAR Workshops, for example, SEDAR 31 (red snapper), contained discussions and research recommendations. SEDAR 42 contains analyses and recommendations relevant for events such as oil spills, however, in the attention given to the 2005 and 2014 red tide events. Oil spills can be measured as environmental events in a variety of ways, including the event as equivalent to a fleet source for fishing mortality. Ecosystem considerations (see 9 above) can also be utilized to assess impacts on stock status. b) Provide recommendations on possible ways to improve the SEDAR process.
A topic of discussion throughout the Review Workshop was the need for more attention to commonly used assumptions in categories of data and analyses. The rationale was to make assumptions more explicit and for consideration to be given to criteria for selection of options. The selection criteria would therefore become a part of the record as analyses move forward, and they would be subject to considerations of clarity, efficiency, and parsimony.
The three days of Review Workshop proved insufficient to enable the pre-prepared assessment to be presented and address areas of concern through developing additional work. For the workshop component of the review to be effective (i.e. developing alternatives or options where issues are identified), some additional time would need to be made available to the Assessment Team during the Workshop.
7. Consider whether the stock assessment constitutes the best scientific information available
using the following criteria as appropriate: relevance, inclusiveness, objectivity,
September 2015 SEDAR 42 – Gulf of Mexico Red Grouper
17
transparency, timeliness, verification, validation, and peer review of fishery management information.
Despite the many concerns, suggestions, and recommendations outlined above the Review Panel concluded that the SEDAR 42 Gulf of Mexico red grouper stock assessment constitutes the best scientific information available. The data used in the assessment were generally sound and robust. Likewise, data generally were applied properly and uncertainty in data inputs was appropriately acknowledged. Further, the Review Panel was very impressed with the performance of the assessment team. It was clear the analytical team had put considerable thought into the development of the assessment model, which by necessity is very complex.
8. Provide guidance on key improvements in data or modeling approaches which should be considered when scheduling the next assessment.
The assessment report provides useful recommendations for further research, covering research on red grouper biology and improved monitoring data. Research on life history and growth has provided a good basis for the stock assessment modeling. However, the Panel had concerns with the lack of more detailed information on red grouper’s reproductive biology (especially regarding social and population factors associated with sexual transition), as well as with the landings and discard data series. Further recommendations consist of improvements in biological sampling for lengths and age across all fisheries, development of a fishery independent recruitment index, and improved recreational catch data reporting. The proportional standard errors are very high for all estimated landings and it seems unlikely that catches will vary so significantly year by year as currently estimated. Some of these problems are historical, and recent years’ catches appear more accurate. Dealing with past errors is an issue of improved robust estimation only, whereas ongoing improved sampling and estimation procedures could reduce errors in future.
9. Prepare a Peer Review Summary summarizing the Panel’s evaluation of the stock assessment and addressing each Term of Reference.
This report constitutes the Review Panel’s summary evaluation of the stock assessment and discussion of the Terms of Reference. The Review Panel will complete edits to its report and submit a final document to the SEDAR program for inclusion in the full set of documents associated with SEDAR 42.