section vi: wireless
TRANSCRIPT
Section VI:
Wireless

19 9 8 A N N U A L R E V I E W O F C O M M U N I C A T I O N S ■ 817
This essay discusses the marketplace for wireless local loop(WLL) in broad terms. It begins with an overview of wirelesslocal loop in emerging regions and then explains some of theobstacles to wireless local loop uptake that have become ap-parent over the last year or so. Next, it provides case studies,one from Hungary and one from Argentina, and concludeswith an outlook for wireless local loop.
Wireless Local Loop Market Overview
Pyramid Research defines WLL as a system that connects sub-scribers to the public switched telephone network (PSTN)using radio signals as a substitute for copper wire for all orpart of the connection between the subscriber and the switch(see Figure 1). This definition includes cordless access systems,proprietary fixed radio access, and fixed cellular systems.
As Figure 2 shows, wireless local loop is being deployed inevery major emerging market region around the world.Several typical deployment patterns for wireless local loophave developed. In the first, competing operators use WLL toprovide services quickly in order to compete with entrenchedplayers. This is the case for Atlantic Telecommunications,Ltd. in the United Kingdom, which is using wireless localloop to establish subscribers quickly to compete with BritishTelecom, Cabletel, United Artists, and Mercury. Elsewhere,emerging firms are using wireless local loop as a tool to meetlicense requirements and service targets established by regu-latory authorities. This is the case, for example, for PT AsiaWest in Indonesia, which the government has required to in-stall 500,000 new main lines over three years. The company is
Wireless Local Loop in EmergingMarketsNicole BakerResearch Associate, Wireless Advisory ServicePyramid Research/The Economist Intelligence Unit
F I G U R E 1Wireless Local Loop Architecture
F I G U R E 2WLL Deployment Plans

818 ■ 19 9 8 A N N U A L R E V I E W O F C O M M U N I C A T I O N S
W I R E L E S S
using wireless local loop for 97,000 of these lines. Wirelesslocal loop is also being used in some cases to provide afford-able rural service. In Hungary, Matav uses wireless local loopfor this purpose, and in Russia, Tatincom uses wireless localloop as a hybrid fixed mobile service for its subscribers.Finally, wireless local loop can be used to provide service forsmall business applications.
Wireless local loop has been a buzzword in the industry forthe last couple of years. Regulatory authorities, operators, andvendors are all interested in wireless local loop because it hasthe potential to provide faster network build-out than is cur-rently possible with copper solutions, and at a lower cost.WLL has the potential to fulfill rural needs where copperlines would be too difficult or costly to install. Also, WLL en-ables competition. With WLL, new operators can build net-works quickly in competition with entrenched providers.Finally, wireless local loop offers flexibility: The system canbe expanded as demand grows, and wireless local loop sys-tems can be moved from one area to another as copper-wiresolutions become available.
Despite wireless local loop’s potential to provide a low-costalternative to copper, deployment has been slow. As Figure 3indicates, a wide disparity exists between the number of sub-scribers contracted and the number of subscribers actually in-stalled in the top nine emerging wireless local loop marketsas of year-end 1996. In total, emerging markets by the end of1996 had less than 1 million installed subscribers.
Obstacles to WLL Uptake
There are several reasons for wireless local loop’s slow up-take. Delayed licensing, spectrum allocation, and pricinghave dampened wireless local loop rollout in virtually everymajor emerging market. Of these reasons, spectrum allocationis the single most important. Wireless local loop’s success de-pends on efficient use of scarce frequencies, adequate alloca-tion of frequencies by regulatory authorities, andcompatibility with a wide range of standards. Wireless ser-vices are gobbling spectrum, and how regulatory authoritieschoose to allocate this resource will have a significant impact
T A B L E 1WLL Uptake Hamstrung by Regulators
F I G U R E 4WLL Pricing Based on Selected Contracts
F I G U R E 3WLL Subscribers, Contracted vs. Installed

19 9 8 A N N U A L R E V I E W O F C O M M U N I C A T I O N S ■ 819
on start-up cost, network expansion, and the level of competi-tion. Spectrum allocation is likely to differ significantly fromcountry to country depending on objectives.
Regulatory issues have held up wireless local loop uptake insome of the biggest potential markets, as regulatory authori-ties continue to struggle over how to define wireless localloop services, license operators, and allocate frequencies. InMexico, for example, the regulatory authority has dragged itsfeet on frequency allocation for wireless local loop, delayingnetwork rollout indefinitely (see Table 1). Mexico opened localservices to competition during 1997, and operators such asTelinor are planning extensive wireless local loop rollout tocompete with the former entrenched monopoly, TELMEX. InIndia, repeated delays have stalled plans to license operatorsby the Department of Telecommunications in twenty-one re-gional circles, pushing network build-out plans well into 1997and possibly beyond. Although China’s MPT has yet to adopta national standard, local and provincial authorities have de-ployed the first pilot wireless local loop systems. However,widespread acceptance still hinges on the MPT’s decision.
Figure 4 helps explain the pricing obstacles to WLL uptake. Itshows wireless local loop pricing based on contracts awardedbetween 1990 and 1997. Although a growing number of wire-less local loop contracts are coming in below $600 per line, theaverage still ranges between $800 and $1,200 per line, whichis a competitive—although not a compelling—alternative tocopper. Many of the most aggressive plans for wireless localloop hinge on attaining price points of around $500 per line.Such prices have made wireless local loop attractive to opera-tors such as Matav in Hungary and Entel in Uruguay, whichhave made significant wireless local loop procurement deci-sions in recent years. However, pricing at that level has re-mained elusive for most other carriers.
Wireless local loop uses a wide array of standards (seeFigure 5). No single wireless local loop product adequatelyaddresses the broad range of applications, performancespecifications, and population densities typical of emerging
markets. Analog cellular wireless local loop systems areprobably the least expensive. However, voice quality suf-fers, and less capacity is available on these systems. Theirbest use is for hybrid fixed/mobile applications. Proprietarysystems are more flexible in terms of the spectrum they canuse, and they promise faster data rates. However, these sys-tems are unproven and cannot offer mobility. Their best useis for newly licensed operators in competition with incum-bent carriers. Finally, cordless access systems provide a low-cost, low-power solution, and they promise faster data rates.However, cordless access systems cover smaller cell radiiand are, therefore, best used in dense urban settings and forhybrid fixed/mobile applications.
Wireless local loop also has been held up because it does nottypically offer quality of service equivalent to copper-line.Voice quality continues to be an issue, particularly for analogcellular-based systems. Also, most commercial implementa-
T A B L E 2
MATAV (Hungary)
N I C O L E B A K E R
F I G U R E 5
Wll Subscribers by Standard
820 ■ 19 9 8 A N N U A L R E V I E W O F C O M M U N I C A T I O N S
tions provide data speeds of only 9.6 kbps. However,some of the digital and proprietary systems are address-ing these issues and making improvements to voice qualityand data rates.
Case Studies
Pyramid Research interviewed several wireless local loopoperators to determine the reasons they selected WLL, thestandards they chose, how they chose a vendor, how wellthe system has performed since installation, and, finally, fu-ture deployment plans. This section will look at the re-sponses from Matav in Hungary and TASA in Argentina ascase examples.
HungaryMatav, the former state-run monopoly provider in Hungary,was privatized in December 1993 and Magyarcom, a consor-tium of Deutsche Telecom and Ameritech, now owns 67 per-cent. In 1995, Matav transferred 18 of its 54 primary districtsto private companies that will provide local telephony in theirrespective concession areas. Matav, Deltav, Hungartel, andPapaTel all currently provide wireless local loop systems, andthe country’s cellular operators are not permitted to providethese services (see Table 2).
Deployment Status. In June 1995, Matav awarded a $100million contract to Motorola for the installation of 200,000lines of analog WLL. Initial plans called for the installationof all 200,000 lines by year-end 1996. By mid-December,however, capacity was installed for only 100,000 subscribersand service was actually provided to 65,000. Even thoughinstallation has been behind schedule, Matav still believesthat the roll-out was faster than would have been possiblewith a copper solution.
Technology Choice. The overriding factor Matav cited forchoosing wireless local loop was price. Motorola’s systemcost approximately $500 to $600 per line, which is much less
expensive than a copper solution. The need for rapid deploy-ment was another key factor in Matav’s selection of wirelesslocal loop. Matav is required to provide a certain number oflines, and the company uses wireless local loop for 40 percentof them.
Standards. The standard Matav chose was an analog wirelesslocal loop system, which was the best standard available inthe 890B897.5 MHz and 935B942.5 MHz bands that it was as-signed for wireless local loop.
Vendor Selection. Matav held a competitive tender in 1995and tested systems from Ericsson, Nokia, and Motorola.Nokia was eliminated from contention due to the high priceof its wireless local loop system in comparison with Ericssonand Motorola. Motorola subsequently won the contract foroffering a better price and a faster deployment schedulethan Ericsson.
Performance. According to Matav, the Motorola system pro-vides acceptable voice quality, although it is not equivalent tocopper. Matav’s wireless local loop network provides faxtransmission at 9.6 kbps and data transmission at 7.2 kbps.
Future Deployment. Looking to the future, Matav has begunevaluating code division multiple access (CDMA) wirelesslocal loop. The company wants a system that will be able toprovide integrated services digital network (ISDN) and highdata rates. One of the options that Matav is currently evaluat-ing is the CDMA wireless local loop system that Motorola istrialling in Warsaw.
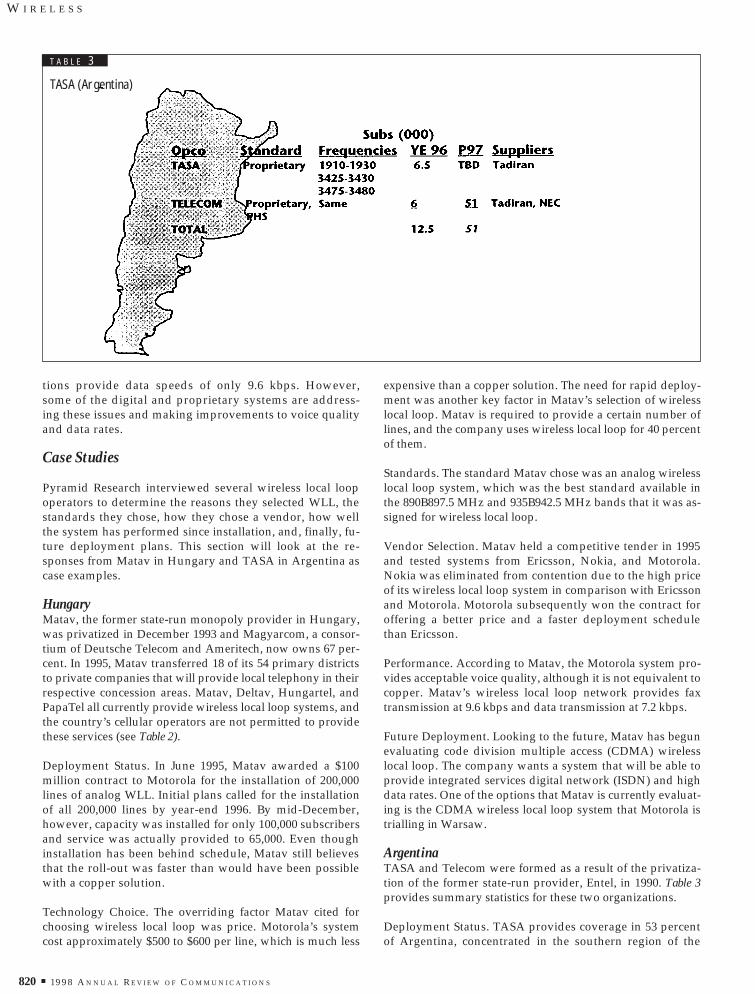
ArgentinaTASA and Telecom were formed as a result of the privatiza-tion of the former state-run provider, Entel, in 1990. Table 3provides summary statistics for these two organizations.
Deployment Status. TASA provides coverage in 53 percentof Argentina, concentrated in the southern region of the
T A B L E 3
TASA (Argentina)
W I R E L E S S

19 9 8 A N N U A L R E V I E W O F C O M M U N I C A T I O N S ■ 821
country. Telecom holds a license to operate fixed wirelessservice in the northern half of the country, and Argentina’sfive cellular operators are not permitted to provide wirelesslocal loop services. TASA issued a tender offer for wirelesslocal loop equipment in late 1995 and subsequentlyawarded the contract to Tadiran. Installations began in 1996,and by year-end TASA reported approximately 6,500 sub-scribers in service, principally in suburban areas aroundBuenos Aires. Investment requirements for the project areabout $8 million. Initial investment plans were for $25 mil-lion to $35 million and for the installation of 25,000 lines ofwireless local loop, primarily in rural areas. However, theoriginal plans were scaled back, possibly due to the highprice of wireless local loop.
Technology Choice and Price. The overriding factor thatTASA cited for choosing wireless local loop was its ease of in-stallation, which allowed the operator to extend coverage toareas where no existing copper or outside plant was avail-able. Price will be a key factor in determining TASA’s futurewireless local loop plans. At $1,250 per line, TASA’s system iscomparable to the cost of a copper-wire solution. TASA chosea proprietary system from Tadiran because it was the onlysystem capable of operating in the 3,425B3,430 MHz and the3,475B3,480 MHz bands. TASA tested the personal handy-phone system (PHS), but found problems with its interface topublic phones. TASA anticipates digital European cordlesstelephony (DECT) frequencies and 900 MHz cellular to be-come available in the future.
Vendor Selection. TASA conducted trials of Nortel’s andSiemens’ systems, and it awarded the contract to Tadiran be-cause its equipment complied with all the technical require-ments specified, whereas Nortel and Siemens did not satisfyas many. TASA considers the system’s voice quality and faxcapabilities acceptable.
Future Plans. TASA’s plans for wireless local loop in the fu-ture seem to hinge on the development of a regulatory policyfor the allocation of spectrum. TASA hopes that the appropri-ate frequencies become available for more open standards,such as DECT. Reduced costs, economies of scale, and vendorinteroperability—especially between the terminal equip-ment—would be the key advantages of an open system.Another key factor for TASA’s future will be the ability ofwireless local loop systems to extend coverage to rural areascost-effectively.
Outlook
Despite recent setbacks, the future of wireless local loop con-tinues to look bright. Pyramid Research has pushed back itsforecast for wireless local loop, but we still expect it to be asubstantial market with approximately 17.4 million sub-scribers by the year 2000 in emerging markets and just under$7 billion in cumulative infrastructure between 1997 and theyear 2000 (see Figure 6).
Demand for wireless local loop will be driven by its antici-pated advantages over copper-wire solutions such as speedof deployment, price, and suitability for applications suchas extending coverage to rural areas and enabling competi-tion. WLL will offer improved voice quality and data rates,with the potential of evolution to wireless broadband. Theaccelerating trend toward privatization and deregulationworldwide will encourage wireless local loop uptake, par-ticularly in emerging markets, although deployment pat-terns will vary and the market will be characterized byfierce vendor competition.
N I C O L E B A K E R
F I G U R E 6Wireless Local Loop Forecast

19 9 8 A N N U A L R E V I E W O F C O M M U N I C A T I O N S ■ 823
As can be seen in Figure 1, customers prefer untethered,portable communications, even when operating in a verygood fixed telephony environment. Trials indicate that inwired residences with a cordless phone, up to 75 percent ofresidential minutes of use (MOUs) are logged on the cordlessphones. Users like to roam. They appreciate mobility—theability to migrate from place to place with the same ser-vices—and would like to have that mobility supported elec-tronically. This paper provides an overview of personalmobility and how it differs from the mobility currently avail-able, outlines options for implementing personal mobility inthe North American network, and concludes with a discus-sion of the future of mobility.
What Is Mobility?
Mobility is the ability for telecommunications users tomove from place to place with the same services. This typeof mobility exists in a variety of existing communicationsservices, including cellular telephony, paging, and cordlesstelephone. However, there are many other mobile servicesthat do not require a mobile terminal. Consider, for exam-ple, calling cards. Calling cards allow subscribers to origi-nate from foreign phones while billing the call to theirhome numbers. The service supported is the origination ofa telephone call, and the mobility demonstrated is that ofbilling. The succeeding section discusses some types ofmobility and states how the calling-card example fitswithin them.
Types of Mobility
There are three types of mobility: terminal, personal, and ser-vice. Terminal mobility describes users’ ability to take theirterminal (such as a phone or a pager) with them and still re-ceive service. This type of mobility is seen with cellular phonesand roaming. For this type of mobility to function, both thehome and visited networks must provide similar system capa-bilities, such as a physical interface. For example, a NorthAmerican cellular phone simply will not work in Europe.
Personal mobility is the users’ ability to bring their identitieswith them and receive service using a terminal whereverthey happen to be. For example, in the global system for mo-bile (GSM), this type of mobility is well supported by theseparable subscriber identity module (SIM) card. The SIMcard detaches from the phone and can be plugged into an-other handset, which enables it to receive the same servicesas the first, independent of the physical interface to the net-work. In GSM, there are two common frequency bands usedwithin Europe: 900 Mhz and 1800 Mhz (also referred to asDCS1800). While dual-band phones are possible, the separa-ble SIM allows a subscriber to use either system through asingle-banded (dedicated) phone. Even with personal mobil-ity, limitations exist. Some network-based services, such asvoice-activated dialing (VAD), may not be available in all lo-cations, even when the subscriber identity is known. Voice-activated dialing difficulties stem from basic issues: if theservice is provided by the user’s home network and the user
On Implementing Personal Mobility inthe North American NetworkRonald T. CrockerPrincipal Staff Engineer, Systems Architecture & RequirementsMotorola Cellular Systems Group
F I G U R E 1The User Speaks Cordless telephony Penetration in the U.S.: 1985 to 1995

824 ■ 19 9 8 A N N U A L R E V I E W O F C O M M U N I C A T I O N S
W I R E L E S S
is roaming at a great distance, it is not practical to use thisfeature due to the significant backhaul cost and delay associ-ated with starting the call, speaking a name, calling back tothe home network, and returning a routing number. Even ifthe local network offers voice-activated dialing, the user’sdictionary would have to be transferred, with the hope thatsuch dictionaries are compatible.
These difficulties lead to service mobility, or the third type ofmobility. Service mobility describes the ability for users’ ser-vices to follow them as they move about networks. True ser-vice mobility would likely require a broadband signalingnetwork, which is several years away, as well as significantstandardization efforts regarding compatibilities. One near-term example of service mobility is Java. The Java environ-ment uses a common virtual machine (the Java VirtualMachine) that is locally implemented and conforms to theJava API specification. Java applications, called applets, canbe moved around the network and will execute everywhereas long as the Java Virtual Machine implementation is con-forming. While not from the communications domain, theJava example highlights the amount of commonality requiredfor such mobility.
Table 1 places some existing services into the categories de-scribed above.
Mobility vs. Wireless
It is not necessary to be wireless in order to be mobile, nor isbeing wireless necessarily being mobile. Figure 2 helps clarifythis distinction. The telecommunications arena is divided intofour quadrants, where the first covers existing capabilities.Quadrant III represents wired and fixed services, such as tele-phone or cable television (CATV) service and advanced intel-ligent networks (AIN). Quadrant II signifies wireless andfixed, covering mostly transmission equipment such as wire-less local loop, cordless telephone, or direct station select(DSS). Quadrant I represents the traditional mobile arena, in-cluding paging and cellular service. Quadrant IV (mobile andwired), unlike the others, is not very well addressed. This isthe area of universal personal telecommunication.
Universal Personal Telecommunications
Universal personal telecommunications (UPT) is a set ofstandards defined by the International TelecommunicationsUnion–Telecommunications Sector (ITU-T) to support per-sonal mobility, where “the fixed association between termi-nal and user identification is removed.” UPT servicesinclude authentication (to verify the bona fides of the user),registration for location update, InCall for call delivery forincoming UPT call, outgoing UPT call (OutCall) for call orig-ination, and more than twenty optional services. UPT hasbeen trialed in Europe and was found to be a good service,but not a big commercial success. This may be due to thefact that UPT was a new service and people did not knowenough about it to be interested.
There are certain notable differences between UPT and cellu-lar. Cellular currently provides many of the same services asUPT: roaming supports essential UPT services such as regis-tration, call delivery, and the ability to make outgoing calls ifthere is a roaming agreement between the two carriers.However, there are several services that cellular does not sup-port. One of these is mobility-to-fixed terminals. Except for
Service Category
Calling Card Personal Mobility
Call Forwarding Personal Mobility
Cellular Roaming & Hand-Off Terminal Mobility
Nationwide Paging Terminal Mobility
Cordless Phone Terminal Mobility
“One-number” Service Personal Mobility
“Plastic Roaming” (smart-card based subscriber identities) Personal Mobility
E-mail Service Mobility
World Wide Web Service Mobility
Local Number Portability Personal Mobility
T A B L E 1Existing Services
F I G U R E 2Mobile vs. Wireless

19 9 8 A N N U A L R E V I E W O F C O M M U N I C A T I O N S ■ 825
R O N C R O C K E R
the five percent of North America that uses PCS1900 (GSM inNorth America), it is not possible to separate the user’s iden-tity from his or her terminal. Cellular also does not supportintelligent network services, although it will when wirelessintelligent networks (WINs) are deployed. Finally, cellulardoes not have very good integration with fixed network ser-vices such as the virtual private network (VPN).
Implementation Options
Given the current state of the North American network, thereare three ways in which true mobility could be achieved: AIN-based, cellular-based, and Internet-based personal mobility.
AIN-Based Personal MobilityThe first possibility is to leverage the capabilities of AIN toprovide mobility. In AIN-based personal mobility (see Figure3), users have home bases—places where they are locatedmost often—and from which the personal mobility serviceprovider is accessed. This service provider provides servicefrom the service control point (SCP). In this instance, locationregistration is a manual process. The user would call an 800number and enter an ID number and a PIN. It would also bepossible to have a shortcut for configuring from the home lo-cation. Remember that in the wired mobile case, the home lo-cation is well known.
Given that the user’s location is registered, a trigger can be setin the home service switching point (SSP) so that a call to theuser’s UPT number triggers a request to the SCP for routingdirections. Information regarding the destination UPT num-ber (as multiple UPT users can be registered at a given termi-nal) as well as the calling party identification will be sent tothe destination for presentation.
One of the most positive aspects of the InCall part of thisapproach is that billing is quite straightforward—a billingrecord is generated for both the initial call as well as for theforwarding leg. But, as mentioned, there are only manualregistrations. There is no way to automatically register,even from the mobile network. It is possible that at sometime in the future, service providers and cellular operatorscould determine a way to arm WIN triggers, but this is notan option today.
When away from the home location, OutCall subscribersmust use a calling card to receive the bill at the right address,and there is no VPN support. Both of these are potentiallymajor problems. AIN-based personal mobility, then, only of-fers the ability to have calls delivered from the home to wher-ever the user may be, which is already possible through theuse of pagers or mobile phones.
Cellular-Based Personal MobilityAnother approach for UPT implementation is to leveragethe capabilities of mobile networks. Figure 4 shows how cel-lular-based personal mobility could work. This arrange-ment begins with a cellular system consisting of a mobileswitching center (MSC) and a home location register (HLR)instead of SSPs and SCPs. The support for personal mobilityservice involves a straightforward extension of basic cellu-lar and mobility as it is today. The registration procedure isautomatic on a mobile phone as long as the UPT user andmobile user are the same. Additional complexity comesfrom separating the terminal’s inherent identity from theUPT user. The standards support this today, though it isdoubtful that it is implemented. On a fixed phone, it is nec-essary to register manually, again through an 800 number,automatic number identification (ANI), and also throughPIN entry.
Calls in this scenario are delivered to mobile phones via IS-41procedures and to fixed phones via call forwarding. Thebilling for this scenario is straightforward, both for call deliv-ery as well as for the forwarded leg of the call. One issue thatcomplicates billing, both in this case and that of AIN-basedmobility, is that the mobile party pays for air time in NorthAmerica. Unless a way to separate the user identity from thephone is devised—such as the GSM SIM—the person towhom the terminal is registered will be charged regardless ofwho is using the telephone.
Cellular-based mobility has the same problem with OutCallthat exists in AIN-based mobility. There is no explicit billingsupport, and it is necessary to use a calling card. There is alsono VPN support in this scenario. If there is a roaming agree-ment, then the mobile subscriber will receive the bill ratherthan the UPT user.
F I G U R E 3AIN–Based Personal Mobility
F I G U R E 4Cellular–Based Personal Mobility
826 ■ 19 9 8 A N N U A L R E V I E W O F C O M M U N I C A T I O N S
W I R E L E S S
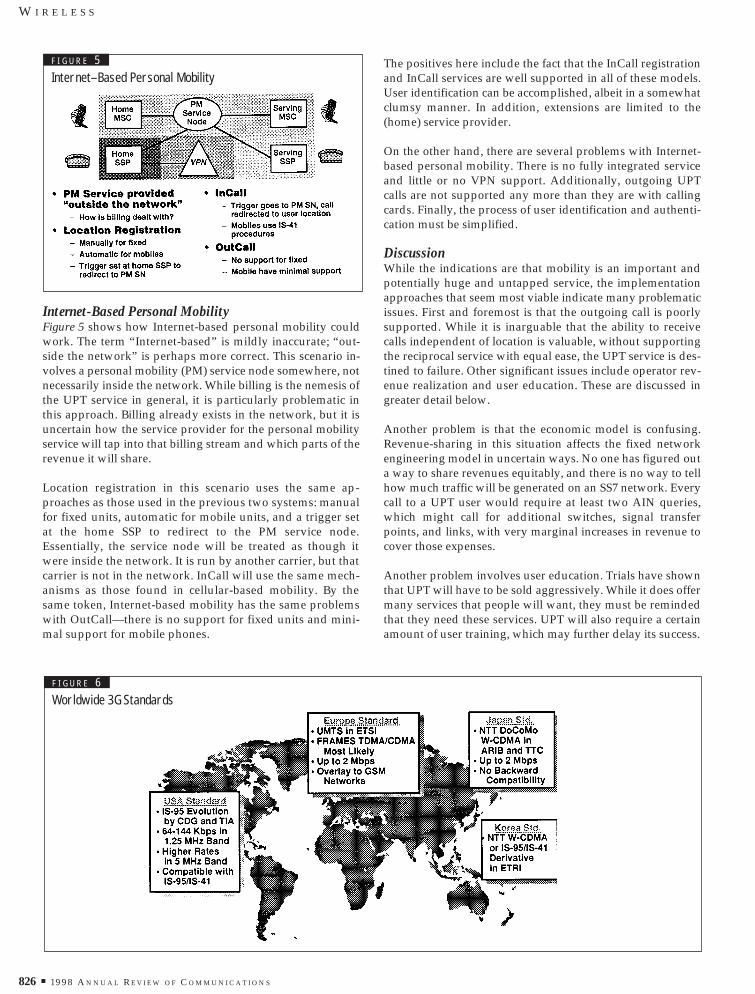
Internet-Based Personal MobilityFigure 5 shows how Internet-based personal mobility couldwork. The term “Internet-based” is mildly inaccurate; “out-side the network” is perhaps more correct. This scenario in-volves a personal mobility (PM) service node somewhere, notnecessarily inside the network. While billing is the nemesis ofthe UPT service in general, it is particularly problematic inthis approach. Billing already exists in the network, but it isuncertain how the service provider for the personal mobilityservice will tap into that billing stream and which parts of therevenue it will share.
Location registration in this scenario uses the same ap-proaches as those used in the previous two systems: manualfor fixed units, automatic for mobile units, and a trigger setat the home SSP to redirect to the PM service node.Essentially, the service node will be treated as though itwere inside the network. It is run by another carrier, but thatcarrier is not in the network. InCall will use the same mech-anisms as those found in cellular-based mobility. By thesame token, Internet-based mobility has the same problemswith OutCall—there is no support for fixed units and mini-mal support for mobile phones.
The positives here include the fact that the InCall registrationand InCall services are well supported in all of these models.User identification can be accomplished, albeit in a somewhatclumsy manner. In addition, extensions are limited to the(home) service provider.
On the other hand, there are several problems with Internet-based personal mobility. There is no fully integrated serviceand little or no VPN support. Additionally, outgoing UPTcalls are not supported any more than they are with callingcards. Finally, the process of user identification and authenti-cation must be simplified.
DiscussionWhile the indications are that mobility is an important andpotentially huge and untapped service, the implementationapproaches that seem most viable indicate many problematicissues. First and foremost is that the outgoing call is poorlysupported. While it is inarguable that the ability to receivecalls independent of location is valuable, without supportingthe reciprocal service with equal ease, the UPT service is des-tined to failure. Other significant issues include operator rev-enue realization and user education. These are discussed ingreater detail below.
Another problem is that the economic model is confusing.Revenue-sharing in this situation affects the fixed networkengineering model in uncertain ways. No one has figured outa way to share revenues equitably, and there is no way to tellhow much traffic will be generated on an SS7 network. Everycall to a UPT user would require at least two AIN queries,which might call for additional switches, signal transferpoints, and links, with very marginal increases in revenue tocover those expenses.
Another problem involves user education. Trials have shownthat UPT will have to be sold aggressively. While it does offermany services that people will want, they must be remindedthat they need these services. UPT will also require a certainamount of user training, which may further delay its success.
F I G U R E 6Worldwide 3G Standards
F I G U R E 5Internet–Based Personal Mobility
19 9 8 A N N U A L R E V I E W O F C O M M U N I C A T I O N S ■ 827
R O N C R O C K E R
There are several other smaller issues that will have to be ad-dressed as well. One is that terminals are “stupid”—as theUPT service allows multiple parties to register at a given loca-tion, called-party identification becomes important. These,and many other similar issues, remain to be resolved prior toUPT becoming a real and broadly available service.
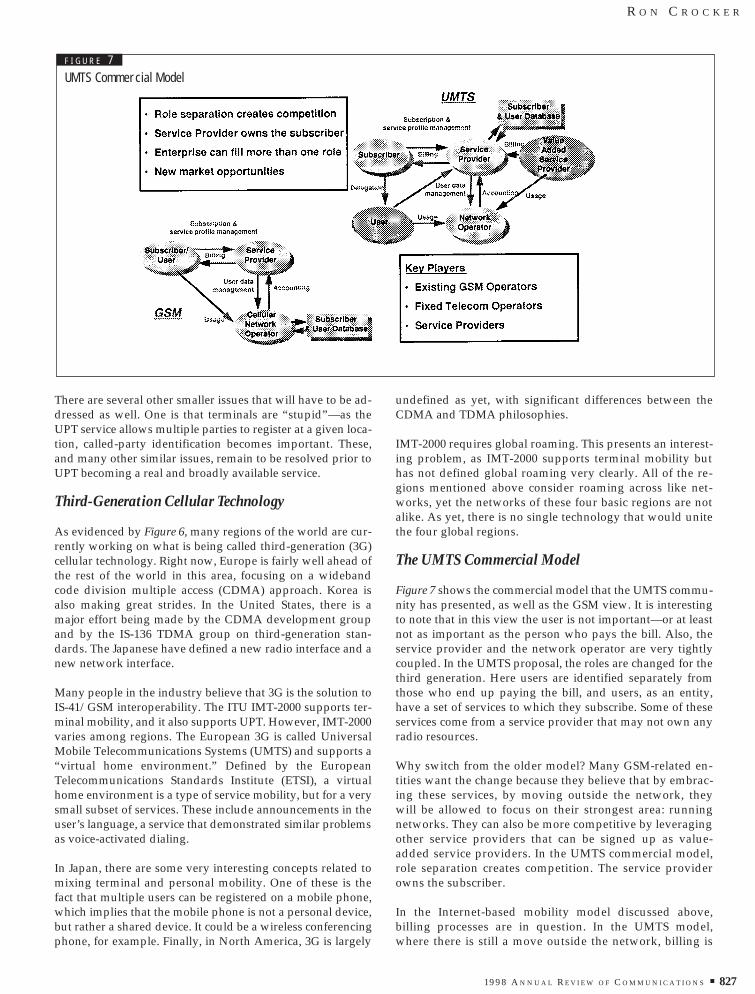
Third-Generation Cellular Technology
As evidenced by Figure 6, many regions of the world are cur-rently working on what is being called third-generation (3G)cellular technology. Right now, Europe is fairly well ahead ofthe rest of the world in this area, focusing on a widebandcode division multiple access (CDMA) approach. Korea isalso making great strides. In the United States, there is amajor effort being made by the CDMA development groupand by the IS-136 TDMA group on third-generation stan-dards. The Japanese have defined a new radio interface and anew network interface.
Many people in the industry believe that 3G is the solution toIS-41/GSM interoperability. The ITU IMT-2000 supports ter-minal mobility, and it also supports UPT. However, IMT-2000varies among regions. The European 3G is called UniversalMobile Telecommunications Systems (UMTS) and supports a“virtual home environment.” Defined by the EuropeanTelecommunications Standards Institute (ETSI), a virtualhome environment is a type of service mobility, but for a verysmall subset of services. These include announcements in theuser’s language, a service that demonstrated similar problemsas voice-activated dialing.
In Japan, there are some very interesting concepts related tomixing terminal and personal mobility. One of these is thefact that multiple users can be registered on a mobile phone,which implies that the mobile phone is not a personal device,but rather a shared device. It could be a wireless conferencingphone, for example. Finally, in North America, 3G is largely
undefined as yet, with significant differences between theCDMA and TDMA philosophies.
IMT-2000 requires global roaming. This presents an interest-ing problem, as IMT-2000 supports terminal mobility buthas not defined global roaming very clearly. All of the re-gions mentioned above consider roaming across like net-works, yet the networks of these four basic regions are notalike. As yet, there is no single technology that would unitethe four global regions.
The UMTS Commercial Model
Figure 7 shows the commercial model that the UMTS commu-nity has presented, as well as the GSM view. It is interestingto note that in this view the user is not important—or at leastnot as important as the person who pays the bill. Also, theservice provider and the network operator are very tightlycoupled. In the UMTS proposal, the roles are changed for thethird generation. Here users are identified separately fromthose who end up paying the bill, and users, as an entity,have a set of services to which they subscribe. Some of theseservices come from a service provider that may not own anyradio resources.
Why switch from the older model? Many GSM-related en-tities want the change because they believe that by embrac-ing these services, by moving outside the network, theywill be allowed to focus on their strongest area: runningnetworks. They can also be more competitive by leveragingother service providers that can be signed up as value-added service providers. In the UMTS commercial model,role separation creates competition. The service providerowns the subscriber.
In the Internet-based mobility model discussed above,billing processes are in question. In the UMTS model,where there is still a move outside the network, billing is
F I G U R E 7UMTS Commercial Model

828 ■ 19 9 8 A N N U A L R E V I E W O F C O M M U N I C A T I O N S
W I R E L E S S
well defined. This “outside the network” service providercould receive billing information and service triggers as wellas operating UPT service.
This UMTS model could also move some of the services awayfrom the access network and into the terminal and the net-work. This concept is exemplified in Figure 8. Through in-creased focus on the service provider role, the access networkwould become a sort of a dumb pipe. Most of these servicesfall into the category of originating services. The terminal hassupport for those originating services, and, by collaboratingwith the service provider, it can receive and maintain them.One of those services could be a dialing plan, which, becauseof the virtual home environment and this extension, willwork as well.
While this idea works for originating services, terminatingservices are still problematic: If the service is in the phone andthe phone is unreachable, then where is the service?Proponents of the UMTS service still believe that this solutionwill be faster than trying to develop network-based or intelli-gent network–based mobility solutions.
There are classes of services that are very amenable to the ap-proach shown in Figure 8, and it will be done this way inGSM extensions. It should also be noted that because the ser-vice is on the subscriber-identity module, the addition of an-other capability—the SIM tool kit—makes it possible to usevarious capabilities on the terminal. This means that the ter-minals are not stupid anymore, and that user identities areseparable along with the services. Hence, this solution pro-vides for both service mobility and intelligent terminals.
Another emerging service is mobile Internet protocol (mo-bile IP), which is another type of service where data is en-croaching into the communications network. With mobileIP, the terminals themselves can migrate from place toplace and maintain their IP address, which allows them tohave access to their home services. This concept, shown inFigure 9, would support services in a manner similar to cel-
lular mobility: location registration would be similar to lo-cation update, inbound packet routing would be similar tocall delivery, and outbound routing would be similar tocall origination. It is arguable whether mobile IP consti-tutes terminal mobility or personal mobility. This does notneed to be determined immediately, since mobile IP is notyet robust enough for commercial service—it still has un-solved issues regarding authentication, billing, and (radio-level) mobility.
Different Perspectives
There have been a variety of reactions to these types of ser-vices. One of them, the operator perspective, has been largelyone of disbelief. Many do not believe that these services couldever exist outside the network. Likewise, they are not surewhy they should participate in these advances and are unsureas to what their cost benefits might be, since there would al-most certainly be additional overhead.
The Internet community, on the other hand, has appearedfairly enthusiastic. Internet entities are excited by the chal-lenges inherent in this type of system. If the phone networkwill not support these services, then the phone network cansimply be used as a dumb pipe. Users can dial up to theirInternet services providers (ISPs), who will provide serviceover this link. In addition, billing complications do not appar-ently daunt Internet parties—surely it should not be difficultto charge a fee at the ISP.
Finally, users are beginning to be more aware of and vocalabout their needs, and they are enthusiastic about theprospect of this type of service, if somewhat skeptical aboutits advent. Users definitely want the ability to take their ser-vices with them. Many are already using ISPs, conferencebridges, and other “outside network” services, and they haveno trouble envisioning the expansion of these services.Finally, should they be expanded, users do not seem averse topaying more for mobility, which could provide great benefitsto them in their communication needs.
F I G U R E 8Service Plane

19 9 8 A N N U A L R E V I E W O F C O M M U N I C A T I O N S ■ 829
R O N C R O C K E R
Summary
It seems inarguable that personal mobility will eventually be areal service in the phone network. It will not, however, be inthe fixed network in the near term. One reason for this is thedisbelief on the part of the operators discussed above. Indeed,it is not unreasonable for these parties to be resistant toputting so much energy and expense into their networks withno certainty of return. It should be realized, however, thatpersonal mobility might never be in the fixed network unlessit can be proven to be a real service, one that can be commer-cially viable and create revenue.
This may be a moot point, however, if this and other teleser-vices are taken over by Internet telephony. If this happens,fixed and wireless operators may end up being reactive—struggling to figure out how to capture a large group of peo-ple who have migrated away from them. Above all, it isimportant not to discount the Internet as a source of compe-tition. There is little doubt that within a relatively short pe-riod of time the Internet will provide real telephony withgood quality service, low prices, and high availability.Certainly, it is critical for fixed and mobile telephony com-panies to understand the inevitability of personal mobilityand plan accordingly.

19 9 8 A N N U A L R E V I E W O F C O M M U N I C A T I O N S ■ 831
This essay explains the approach that Century MobileCommunications has taken to achieve success in the wirelesscommunications industry. The company’s approach is like apyramid: It has a broad foundation in the chief executive offi-cer’s strategic plan, then becomes more narrow with a profileof Century’s strategic strengths, and finally builds to a peak,which is the description of critical success factors in the in-dustry. Those factors include customer service, quality net-works, timely service delivery, and efficient operations. Thecommon thread that runs throughout this discussion is that toget and keep a customer, the wireless service provider mustdeliver service that is fast, fair, and frequent.
To provide a little background, Century provides local, cellu-lar, long-distance, Internet, and personal communications ser-vices (PCS) in geographic clusters located primarily in theMidwest and the mid-South. Century is the 12th largest cellu-lar company in the country and the 16th largest local ex-change company, with over 1 million customers.
Strategic Business Plan Elements
The foundation for Century’s PCS wireless services is madeup of the strategic elements that the CEO identifies, which cutacross all business units—wireless as well as wireline.Providing convenience and choice for the customer throughmultiple services is one of these basic elements. Another isquality of service (QoS). The provider must make sure thewireless network provides a high degree of availability anddoes not allow calls to be dropped. Addressing customerneeds is another critical element, and the provider must learnwhat the customer’s needs are in order to be able to addressthem. Strong relationships—both with customers and withvendors—are also important. Vendors, in fact, are strategicpartners in meeting customer needs. Maintaining strong rela-tionships requires some effort—they cannot be accomplishedsimply by voice mail messages instead of direct conversa-tions. Finally, employee roles are another key strategic factor.The company must communicate exactly what each em-ployee’s role is in the company from the top down, startingwith the CEO. Adequately communicating roles avoids ineffi-ciencies. These strategic elements are the foundation uponwhich all other business decisions are based.
Strategic Wireless Strength Profile
After identifying the overall directives and elements of thestrategic business plan, the next step for a cellular companyis to develop a wireless strength profile. What does the com-pany do well?
For Century Mobile Communications, the first wireless strengthis financial fortitude. Wireless is a very capital-intensive businessand requires hundreds of millions of dollars in order to put in-frastructure into the field. Cellular and PCS are not like anInternet start-up, where an entrepreneur can throw in a fewbucks and work from his or her garage. In our type of business, acompetitor must have the ability to acquire capital. Otherstrengths include management vision and the ability to commu-nicate that vision to the employees. From management visioncomes employee enthusiasm. If employees know what is ex-pected of them, if management’s goal is clear and clearly com-municated, then employees will be enthusiastic about that goal.
Flexible pricing and speed to market, other importantstrengths, directly relate to one of the core strategic goals: pro-viding choice and convenience for the customer. A wirelessservice provider should be able to react quickly to changes inthe market. Wireless providers also must keep their core mar-ket share and, of course, try to build more.
Not every wireless provider has the same strengths thatCentury offers. By extension, ours is not the only way to dobusiness. As Figure 1 shows, the wireless market has beengrowing steadily, and continued growth is anticipatedthrough 2004. The other companies contributing to thatgrowth do not necessarily have the same strengths as Century,but they all have some strengths on which they build to pro-duce this kind of success and growth in subscribers.
Critical Success Factors
Four other strengths in the strategic wireless strength profileare customer service, quality networks, timely service deliv-ery, and efficient operations. These are critical factors for suc-cess. These factors are necessary if a wireless provider is tocompete effectively in acquiring and keeping customers.
Key Business Factors to AchievingSuccess in the Wireless ArenaSteven J. Daigle Donald J. MillerDirector of PCS Development, Vice President of Operations, Mobile Communications Group Mobile Communications GroupCentury Telephone Enterprises, Inc. Century Telephone Enterprises, Inc.

832 ■ 19 9 8 A N N U A L R E V I E W O F C O M M U N I C A T I O N S
W I R E L E S S
Customer ServiceIn Century’s case, customer service involves bringing to-gether all services in a one-stop shop. Customers want timelyand accurate billing statements that reflect Internet access,local service, long-distance service, PCS, and cellular serviceall in one bill. They want a readable bill. The detail-orientedaccountants, for example, probably want to see detailedbilling that reflects every call made. Other customers justwant a bottom line. If that bottom line goes up or down 20percent, they are satisfied. If it goes up 70 percent, on theother hand, customers will want to know why such a changeoccurred. The wireless provider needs to be flexible enoughto provide billing that satisfies both types of customers: thedetail-oriented and the “bottom line-er.”
Another important aspect of customer service is maintain-ing a dialogue with the customer about value. That meansbeing able to communicate to customers why they shouldstay with a firm rather than take their business elsewhere.We are endeavoring to do that today using technology andsome of the new solutions that vendors offer. Another wayto discuss the value of staying with your firm is throughphone calls. The introductory call is a response to signingthe contract in which the service provider calls to thank thecustomer for joining. It’s also an opportunity to ensure thatthe customer is receiving a fair exchange: a worthwhile ser-vice for the money. Then, ten months later, two months be-fore the contract expires, the provider calls again to say, “Ihope you have enjoyed the service. We really want you tostay.” This type of approach communicates to the customerthat you care. Responding to customer needs quickly sendsthe same message.
Customer service also means transforming call-in situationsinto opportunities. Customer service representatives in thewireless industry take many calls each day, and most of themare negative. Customers call to complain that a call droppedor that they found a dead spot or they do not understandtheir bill. These call-ins, however, can be transformed fromnegative situations into positive ones. For example, a cus-tomer in Michigan was convinced that voice mail neverworked. He did not want it, he saw no value in it, and he sawno reason to have it. This customer called in with a problem,and somehow the conversation turned to voice mail. He told
the representative that he was so against voice mail that heeven urged his friends not to try it. A short demonstration ofthe value of the product by the representative, however,proved to the customer that the voice mail system actuallydoes work. It really does store all the messages, and he reallycan access them easily by calling his own number. The cus-tomer subscribed to the voice mail system and convinced hisfriends to get voice mail, too. This is a good example of trans-forming a call-in situation into an opportunity, of making thenegative into a positive experience.
Expanding customer service technology and mining billingsystems are other ways to provide positive customer service.Both of these approaches involve keeping track of the servicesa customer uses and deploying technology to meet needs inthe most cost-effective way.
Quality NetworksThe second critical success factor is quality networks. This in-volves technology, but customers in general really do not carewhat technology is used as long as they perceive quality asthe result. They want a system that “stays up,” and they wantsolutions to their needs.
Quality networks mean system capacity—getting a connectionalmost every time. It means features such as voice mail, calleridentification, and short message service (SMS). It means of-fering a superior outage response time through having a coreteam of technicians in place who can respond to an outage andbring the network back up quickly. Note that in most cases,outage response time is not technology related; it is personnelrelated. It is a function of having a well-trained staff.
Vendor relationships are a part of a quality network as an ex-tension of being a strategic partner. A good relationship witha vendor allows the service provider to try new services andbuild a quality network infrastructure.
Timely Service DeliveryA third critical success factor is timely service delivery—thatis, sales, distribution, and the policies and procedures thatallow sales to be handled efficiently. “Sales” means more thanjust selling the product; it means making sure customers’needs are fulfilled and that they receive what was promised.
F I G U R E 1Wireless Market Growth

19 9 8 A N N U A L R E V I E W O F C O M M U N I C A T I O N S ■ 833
S T E V E N J . D A I G L E A N D D O N A L D J . M I L L E R
New distribution channels can contribute to timely servicedelivery. Century has expanded into Wal Mart, Radio Shack,and its own retail stores. In addition, the company uses directmarketing more frequently. Distribution is no longer just abusiness-to-business relationship. Instead, we are reachingthe end customer directly. Consequently, the company mustprovide a product that appeals to consumers rather than justto businesses. Finally, operating policies and procedures holdtogether all of the people who make up sales and distribution.
Efficient OperationsThe last critical success factor is efficient operations. Wirelessproviders must reduce customer acquisition costs by provid-ing innovative pricing plans on the handset. The old methodof giving the handset away is very, very expensive. If the cus-tomer base turns over by 1.5 to 2.5 percent monthly, the com-pany gives a $350 handset away to 1.5 to 2.5 percent of
customers every month—all while producing an average rev-enue of only $50 per customer. At that rate it would takeseven months just to break even on the handset, not to men-tion the cost of the rest of the infrastructure. Hence it is very,very important to keep customer acquisition costs down.
Investment in departmental communication technology al-lows the sales and distribution staff within the corporation tocommunicate. Reducing interconnection and transmissioncosts is good engineering that promotes efficiency. Bundlingservices meets customer demand at the same time as it lowersthe cost of advertising and sales campaigns. A careful infra-structure investment is also good engineering that any effi-cient company must pursue. Pricing to acquire and retaincustomers is a necessity, though it can be both a plus and aminus at the same time if a plethora of pricing plans lead tocustomer confusion.
Summary
What did Century Mobile Communications do to pursue suc-cess in the wireless arena? Table 1 recaps the steps. We tookthe CEO’s strategic business plan and used its tenets as pillarsupon which to build. Next, the company narrowed that plandown for its wireless business unit, focusing on Century’sstrengths and developing a wireless strength profile. Then weidentified four critical success factors that are necessary forsuccess in the future: customer service, quality networks,timely service delivery, and efficient operations. In summary,then, wireless services providers must always remember thethree “F”s—they must endeavor to provide service, which isfast, fair, and frequent.
gg
Wireless Strength ProfileWireless Strength Profile
Critical Success FactorsCritical Success FactorsCustomer ServiceCustomer Service
Quality NetworksQuality Networks
Timely Service DeliveryTimely Service Delivery
Efficient OperationsEfficient Operations
T A B L E 1Summary

19 9 8 A N N U A L R E V I E W O F C O M M U N I C A T I O N S ■ 835
This paper examines the past, present, and future of wirelesscommunications with an emphasis on the role of broadbanddigital radio technology. AirNet CommunicationsCorporation is a world-leading pioneer in the introduction ofsuch equipment, and the case is made here that this technol-ogy creates a true paradigm shift. The paper presents manyaspects of the wireless broadband technology paradigm, veri-fies its robustness for commercial application, and provides aglimpse of how different the future of wireless will become asbroadband equipment enters the market.
Introduction
Cellular technology is well over a decade old, yet it remains arapidly evolving discipline. The early analog systems suf-fered from their own success and quickly ran low on capacityin dense urban areas. Worldwide deployment of second-gen-eration digital systems has been underway for several years,and these systems are now undergoing the fine-tuning re-quired of any new technology functioning in a complex, real-world environment.
Providers hope to obtain greater capacity from the new digitalprotocols but must deal with the quandary of making com-plex choices concerning protocols and equipment. The proto-cols chosen must be compatible with their service area andequipment suppliers, and they must permit easy integrationof new equipment into existing infrastructure. Cellularproviders must also deal with potential future competitionfrom wireline, cable, and satellite media that are also expand-ing their service options. Success is by no means assured inthe face of more competitors, services, and complex technol-ogy; the odds will favor providers who have made choicesthat do not lock them into expensive and rigid technologythat is not easy to upgrade.
The PCS arena presents much technological uncertainty, of-fering a plethora of options to service providers. Not all ofthese technologies are firmly proven in the field, and issuesover voice quality, system capacity, realizable cell radii, andother concerns will have large effects on a provider’s startupcosts, revenue, and eventual market penetration.
Even as the second generation of wireless is being deployed, athird generation of cellular infrastructure is emerging. This
new generation justifiably represents a new wireless para-digm, involving a broadband transceiver system (BTS), withall signal processing being done digitally. The BTS permitsone broadband (5 MHz) radio to do the work of many nar-rowband transceivers. This new approach provides greatflexibility to the provider, because the base station (BS) is pro-grammable much like a digital computer. As the demand forservices changes, the base station can be reprogrammed toencompass new contexts. This architecture is intrinsicallylower in cost, maintenance, size, and complexity than tradi-tional architectures.
This paper will discuss the pending choices facing serviceproviders and will contrast traditional cellular techniqueswith third-generation wireless broadband base station tech-nology. It is our belief that this new architecture introduces awireless communications paradigm that provides far andaway the most flexible approach to the high-technology,high-velocity wireless communication market of the future.
A Brief History of Cellular
Spurred by apparently insatiable demand, wireless commu-nications technology has exploited innovative concepts inboth digital information processing and radio frequency (RF)technology to reach its present status as a major worldwideindustry. The growth of cellular capacity worldwide has beenthe result of innovations sometimes evolutionary. A historyof commercial wireless services will provide a perspective onthe state of wireless today and why wireless broadband tech-nology is poised to play a major revolutionary role in world-wide wireless development.
Mobile Telephone System
The original commercial wireless systems were based on mo-bile telephone system (MTS) technology, which afforded itssubscribers mobility in a local area. MTS systems used eachRF channel only once in a given service area. The RF chan-nels, all broadcast from a single base station, were operated atpower levels high enough to ensure effectively that mobilesubscribers would have continuous coverage provided theyremained within the service area. Operating RF channels athigh-power levels assured mobility to subscribers throughoutthe service area but prevented any RF channel from simulta-
A New Paradigm— Broadband Digital WirelessJohn R. DonerChief Scientist, AirNet Communications Corporation

836 ■ 19 9 8 A N N U A L R E V I E W O F C O M M U N I C A T I O N S
W I R E L E S S
neously serving two customers within the service area. As aresult, the demand for MTS services greatly exceeded thesupply, and subscribers became accustomed to long queuingdelays when attempting to place calls.
The Advent of Analog Cellular
The inability of the MTS industry to meet the apparent de-mand inspired the birth of cellular telephony, which ad-dressed the huge imbalance between supply and demand byallowing reuse of each RF channel within a service area. Thistechnique depends on operating the allocated RF channels atrelatively low power levels so that an RF channel in use inone part of the area diminishes to an acceptably low interfer-ence level by the time it propagates to an area where the samechannel may be used again. Since a cellular RF channel isused at a lower power level than with MTS, subscribers couldnot maintain continuous communications with a single BS asthey moved about in the service area.
The cellular paradigm resolved this difficulty by using a newmechanism called handoff. Handoff involved a given mobilesubscriber unit being automatically directed to change fre-quency to a new RF channel transmitted from a closer basestation, at which moment the landline side of the call was alsoswitched to the new base station. Handoff was thus a revolu-tionary concept that provided a large multiplier to the valueof each allocated RF channel. The typical architecture of a cel-lular system is depicted in Figure 1, where the mobile unit isshown moving into the area of a new cell.
The first cellular systems all used analog frequency modula-tion (FM) to establish the radio links with subscribers and RFbandwidths of 25 or 30 kHz per traffic channel. In the UnitedStates, the advanced mobile phone system (AMPS) beganwith a total frequency allocation of 20 MHz per serviceprovider, which was shortly expanded to 25 MHz to meet therapidly increasing demand arising in major urban centers.The 25 MHz allocation of channels actually provided 395 traf-fic channels directly supporting subscriber conversations.
The Art of Frequency Reuse
Each AMPS service provider thus had up to 395 separate (butreusable) traffic channels available to generate revenue fromsubscribers, and a large body of practice grew up around the
science of making the best use of those channels. The adventof the cellular paradigm permitted reuse of frequencies in aservice area. In practice, frequency reuse adhered to the con-cept of dividing the whole RF channel set into subsets andthen allocating those subsets to the cells so that a single sub-set was allocated to cells in a regular, repeating pattern asshown in Figure 2. This regularity of the reuse pattern en-sures that reuses of an RF channel occur at a fixed distancefrom each other.
Figure 2 demonstrates a four-cell frequency reuse pattern, butmany other patterns are possible. The choice of a reuse pat-tern is driven by the need to ensure that the interference levelexperienced by the receivers supporting a call is not too largeto overshadow the valid signal information arriving at the re-ceiver. From this arises the concept of the minimum signal-to-interference ratio (S/I) for a receiver, which is the factor bywhich the signal must exceed other RF energy at the same fre-quency in order for the subscriber to experience acceptablevoice quality.
The minimum S/I needed in a cellular system depends uponthe radio protocol in use; for analog systems such as AMPS, itis in the neighborhood of 17 dB. It is not difficult to calculatethe average S/I expected for a specific frequency plan, andTable 1 shows minimum S/I values for a range of frequencyreuse plans.1 Some of these reuse plans include the use of di-rectional antennas at each cell site to “sector” the cell into sep-arate RF areas, which limits the direction of propagation ofRF energy, lowering the average interference levels arising innearby cells.
The number of channels per cell site that a provider may sup-ply is primarily determined by what minimum S/I is possiblefor the RF protocol in use, which in turn determines the closestdistance at which frequencies may be reused, which finallydetermines which frequency-reuse schemes have adequateco-channel spacing to support the minimum S/I specified. If aprovider can use a four-cell reuse scheme, then a single cellsite can offer one-fourth of all the allocated channels to sub-scribers in the cell. That is clearly better than using a seven-cell reuse scheme, which provides only one-seventh of allfrequencies to a single cell.
The interference experienced by a receiver due to the reuse ofthe same RF channel in other cells is called co-channel inter-
F I G U R E 2A 4-Cell Frequency Reuse Pattern
1 2 1 2 1
1 2 1 2 1
3 4 3 4 3
3 4 3 4 3
F I G U R E 1Mobile Unit Entering a Handoff Region Between Cells
19 9 8 A N N U A L R E V I E W O F C O M M U N I C A T I O N S ■ 837
J O H N R . D O N E R
ference, but a system designer must also attend to the factthat two adjacent RF channels (i.e., right next to each other inthe allocated spectrum) should not be used in the same cell.This is because receivers generally cannot adequately rejectRF signals very close to the frequency that they are tuned to,and some part of the adjacent channel signal may interferewith the receiver’s assigned channel. Standard cellular systemdesign uses an “every N-th frequency” rule in the frequencyallocation scheme, meaning that if an N-cell reuse plan is tobe used, a given cell will be assigned all frequencies mutuallyspaced N-channels apart. If the 395 traffic channels for AMPSare allocated among the 7 cells in a reuse pattern, the 7 fre-quency subsets will have the forms:
• Set 1 Channels 1, 8, 15, ,393,• Set 2 Channels 2, 9, 16, ,394,• Set 3 Channels 3, 10, 17, ,395,• .• .• .• Set 7 Channels 7, 14, 21, ,392,
comprising 56 or 57 channels available per cell.
The subsets of channels that have been allocated according toa frequency reuse plan may be further subdivided if the cellsare sectored. A sectored cell subdivides the service area byusing directional antennas, usually three with a mainbeamwidth of 120°, thus splitting the service area into equal“pieces of the pie.” Directional antennas provide greater gainin the sector that they serve but transmit very little signal out-side that sector.
Proper use of sectoring results in lower co-channel interfer-ence, but there is a tradeoff: even though the same numberof channels per cell are available in a sectored cell, the cellcan support fewer subscribers. This is due to the statisticalprinciple of trunking efficiency, which states that as thenumber of channels available decreases, the number of sub-scribers that can be served at a fixed grade of service de-creases faster. Thus, sectoring does not decrease the totalnumber of channels per cell, but does decrease the numberof subscribers that can be served in the cell if a fixed gradeof service is to be maintained.
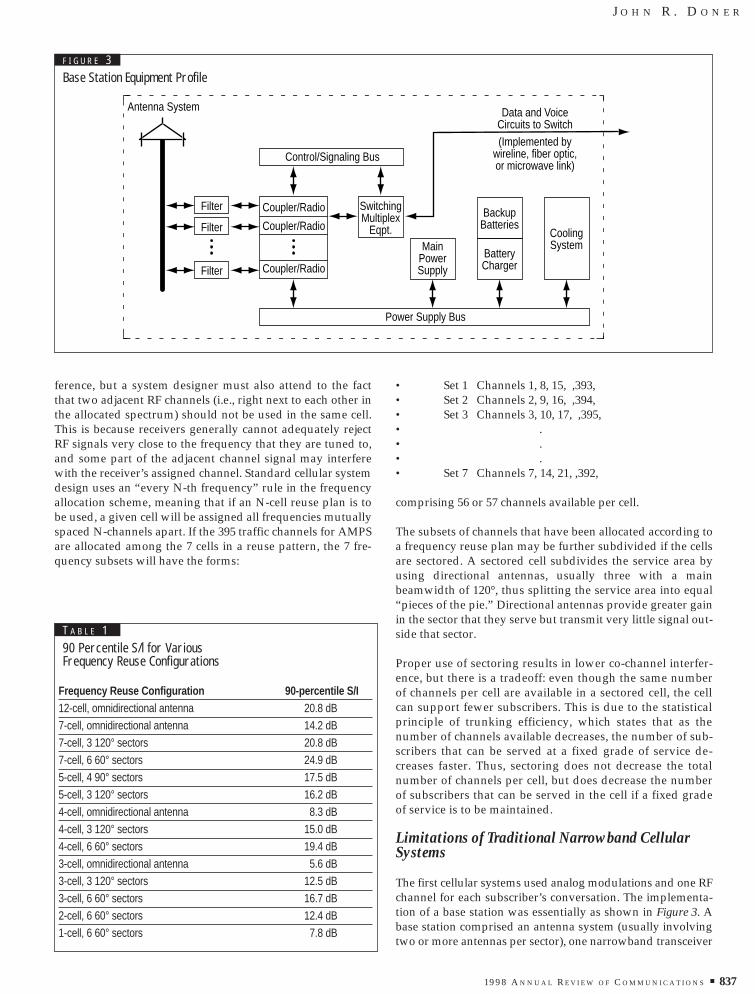
Limitations of Traditional Narrowband CellularSystems
The first cellular systems used analog modulations and one RFchannel for each subscriber’s conversation. The implementa-tion of a base station was essentially as shown in Figure 3. Abase station comprised an antenna system (usually involvingtwo or more antennas per sector), one narrowband transceiver
Frequency Reuse Configuration 90-percentile S/I12-cell, omnidirectional antenna 20.8 dB7-cell, omnidirectional antenna 14.2 dB7-cell, 3 120° sectors 20.8 dB7-cell, 6 60° sectors 24.9 dB5-cell, 4 90° sectors 17.5 dB5-cell, 3 120° sectors 16.2 dB4-cell, omnidirectional antenna 8.3 dB4-cell, 3 120° sectors 15.0 dB4-cell, 6 60° sectors 19.4 dB3-cell, omnidirectional antenna 5.6 dB3-cell, 3 120° sectors 12.5 dB3-cell, 6 60° sectors 16.7 dB2-cell, 6 60° sectors 12.4 dB1-cell, 6 60° sectors 7.8 dB
T A B L E 190 Percentile S/l for Various Frequency Reuse Configurations
Filter SwitchingMultiplex
Eqpt.
Coupler/Radio
Control/Signaling Bus
Data and VoiceCircuits to Switch(Implemented by
wireline, fiber optic, or microwave link)
Power Supply Bus
MainPowerSupply
Coupler/Radio
Coupler/Radio
BackupBatteries
BatteryCharger
CoolingSystem
Filter
Filter
Antenna System
F I G U R E 3Base Station Equipment Profile

838 ■ 19 9 8 A N N U A L R E V I E W O F C O M M U N I C A T I O N S
W I R E L E S S
per RF channel, and a number of telephone trunk lines overwhich subscriber traffic from the base station was multi-plexed and connected to a traffic switch, allowing intercon-nection with the wireline telephone system. As can be seenfrom Figure 3, there is also a substantial amount of supportingequipment required at the base station.
In most systems, multiple base stations are controlled from acommon site called the base station controller (BSC). The BSCmaintains a global view of the operations at the base stationsand is involved in the handoff process when a mobile station(MS) moves across a cell boundary.
Traditional narrowband analog systems required that manyseparate radios all be attached to a single transmit antenna asshown in Figure 3. Each connection of a transmitter to a com-mon antenna must be filtered to prevent damage from the en-ergy from all other transmitters combined to the sameantenna, which introduces a significant loss (60 percent) be-tween the transmitter and the antenna.
Another problem arises because the filters only work ade-quately if there is a substantial gap between the RF channelsall attached to the same antenna. Traditional analog AMPSrequires that this gap be around 20 RF channels, so onlyevery twenty-first RF channel may be attached to a singleantenna. This severely limits the frequency-planning possi-bilities for a cellular system, and, for analog AMPS, explainswhy the most popular frequency plan by far uses a seven-cell pattern with three 120 sectors per cell (i.e., every twenty-first channel per sector).
Another substantial limitation of the first-generation analogsystems is the lack of downlink (base station to mobile) trans-mit power control. The analog cellular protocols did use up-link (mobile to base station) power control to preserve thebattery life of the hand-held mobile units. The primary tech-nique relied on measuring the signal strength of the MS-transmitted signal at the BS receiver, adjusting MS power upor down so that only enough power is transmitted to main-tain a successful radio path. This process is called reversepower control, and besides the benefit of longer MS batterylife, it results in less RF interference propagating in the systemthan would be the case if they all transmitted at full power allof the time.
But the mobile units were not designed to provide a symmet-rical technique for controlling the power of the BS transmitter.This would require the MS to measure the signal strength ofthe BS signal it receives and report back some data to permitthe BS to modulate its transmitting power on the downlink.Downlink power control can contribute greatly to the reduc-tion of interference in a cellular system, which in turn can in-crease the average S/I ratio at the MS.
The lack of downlink power control seems to have led to arule of thumb in the cellular industry, which is to use as muchtransmitting power as possible on the downlinks to the MSs.Depending on the equipment available, this means that manycellular operators are supplying between 40 W and 100 W perdownlink to maintain a connection with an MS that may have
a maximum transmit capability of only 0.6 W! This is clearlynot an imbalance but instead a “better safe than sorry” ap-proach constrained by the limitations of typical narrowbandcellular technology.
With an operational downlink power-control algorithm, thecellular industry could use a better frequency plan (e.g., mov-ing from N=7 to N=4). Unfortunately, the better frequencyreuse would be difficult to implement because of the 21-chan-nel spacing rule. Also, downlink power control would realizea savings on the order of 67 percent of actual transmit powerneeded at the BS, with concomitant savings in the cost ofpower supplies, battery backup systems, and air conditioningat the BS sites.
The Introduction of Digital Cellular
Traditional analog cellular represented a huge leap forwardin capacity compared to the previous MTS systems.However, narrowband analog cellular still operated with onesubscriber per channel and suffered from two intrinsic limita-tions that placed a ceiling on the capacities of systems: the 21-channel spacing rule imposed by multiple transmittersoperating on a common antenna created a severe limitationfor frequency reuse, and the inability to control power on thedownlink created unnecessary interference, limiting the useof potentially “tighter” frequency-reuse plans, which wouldhave permitted greater capacity per cell.
As time passed and lessons were learned from deployment ofthe first generation of cellular, scientists and engineers inmajor communications companies are learning from the pastto design better systems for the future. While extant analogsystems made evolutionary steps in the field, the advancedproduct teams in major corporations were busy birthing arevolutionary step—the advent of digital signal processing(DSP) techniques in voice communications.
A voice waveform can be sampled at a high rate and ex-pressed digitally, and DSP scientists had already developedmany ways of “compressing” digitally expressed informa-tion to remove the redundancy contained in the informa-tion. The purpose of this compression had been to makemore efficient use of the communications bandwidth avail-able in any transmission medium. It was well-known thatvoice could be compressed to 64 kbps but that did not yettranslate into any improvement over FM analog voice re-quiring a 30-kHz RF bandwidth. However, while analog cel-lular was still cutting its teeth in the field, back in thelaboratories voice-compression technology reached thepoint where a single voice conversation could be transmit-ted using only 8 kbps of digital data.
Also, new RF modulation technologies were emerging coinci-dent with this improvement in voice compression. The largecapacity of analog cellular compared to MTS was rapidlybeing absorbed by demand levels beyond the wildest dreamsof economic forecasters, and the industry recognized that dig-ital technologies and the decreasing cost and size of computa-tional hardware pointed toward far more efficient ways touse the available spectrum. In the United States, the industry

19 9 8 A N N U A L R E V I E W O F C O M M U N I C A T I O N S ■ 839
J O H N R . D O N E R
began the standards-definition process for digital AMPS(DAMPS), which transmitted voice digitally and used a mod-ulation that could place a voice channel in one-third of thespectrum required for an analog voice channel.
The standards process took pains to create backward fre-quency compatibility with the existing AMPS system, and itdid so by packing the voice information for three conversa-tions into the same bandwidth previously occupied by asingle AMPS call. This was done by splitting a single 30kHz AMPS RF channel into a repeating cycle comprisingsix time slots, with a single DAMPS subscriber using onlytwo of the six slots. A single subscriber channel now be-came effectively 10 kHz wide, which in theory tripled thecapacity provided by the same spectral allocation of an ana-log AMPS system.
This technique, called time division multiple access (TDMA),was also being adopted by another major standard evolvingfrom a cooperative European effort. The European commu-nity was defining a standard called global system for mobilecommunications (GSM), which also used voice-compressiontechniques and TDMA to pack eight subscriber channels intoa 200-kHz RF bandwidth, with a given subscriber effectivelyusing 25 kHz of bandwidth.
There is a distinction here with respect to digital-cellulartechniques that contains valuable lessons. First, the use of25-kHz subscriber channel bandwidth for GSM was par-tially due to a more generous bandwidth allotment for GSMdigital voice encoding. In retrospect, experience with thetwo systems has shown that U.S. DAMPS voice quality ismarginal in the judgment of most users, while the GSM pro-tocol is now widely used and accepted throughout theworld with good voice quality.
A second very important lesson is that the effective use of RFbandwidth for any cellular protocol is not just dependent onthe RF bandwidth per subscriber channel. Within that band-width are transmitted the encoded voice, error correctiondata, and other data intended to allow the demodulationprocess to correct for deficiencies in the transmission path.Additionally, some RF modulation techniques are inherentlymore robust against interference sources: for example, FMcommercial radio provides far higher quality audio signalsthan does AM radio.
The distinctions between RF modulation techniques anderror-amelioration processes built into different cellular pro-tocols imply distinctions between the minimum acceptableS/I ratios for the protocols. A lower acceptable S/I ratiomeans that the allocated RF channels for the system can oper-ate in a frequency-reuse plan allowing closer spacing. For ex-ample, the GSM protocol has in practice been deployed in a4-cell reuse pattern, while DAMPS is still used in the tradi-tional seven-cell, three-sector arrangement of analog AMPSsystems. Consequently, the apparent 25 kHz bandwidth ofGSM actually achieves an edge over the DAMPS 10 kHzbandwidth (i.e., the number of subscribers served in a servicearea per Hz of available RF bandwidth is higher for GSMthan for DAMPS).
In summary, the digital standards that have evolved or areevolving have provided many important lessons. First, com-parisons of digital cellular standards as to capacity offered de-pend not only on actual DSP techniques and RF modulation,but also on how the systems actually reject interference.Second, just as in the analog phase of cellular, the final labo-ratory for testing these systems has proven to be the actualservice areas, and many lessons can only be learned after de-ployment occurs and real subscribers use the equipment.
Most importantly, the real breakthroughs in increasingspectral efficiency have been driven by improved integra-tion of computing power to control the modulation andspectral utilization. MTS yielded to analog cellular whenjust enough computing power could be built into mobilephones to permit them to be switched among RF channelswhile a call was active. Digital cellular became feasiblewhen small, inexpensive digital signal-processing enginescould be incorporated in the mobile phones. But there is an-other chapter about to be written and that involves the mi-gration of high-computing power into the infrastructureequipment.
The Digital Advantage
The thrust of this paper so far can be summarized in oneshort phrase: the only constant in cellular/PCS technology ischange. Besides the many new protocols already in service oremerging, there will be new services offered by wireline,cable, and wireless providers, and each will need to find waysto cope with a constantly changing competitive field. If everthe provider of wireless services needs a Swiss Army knife,the time is now.
A radically new cellular architecture that offers reducedequipment and maintenance cost, reduced need for real estateand site acquisition, simplified cell-site system architecture,unique frequency-planning agility, and considerable immu-nity to the vagaries of the many emerging standards will bedescribed in detail. These claims will also be examined.
Digitizing Signals
Digital signal-processing techniques continue to benefit fromfaster and smaller integrated circuits, and, for a long while,engineers envisioned the day when a receiver or transmittercould be essentially an all-digital device. However, even anall-digital receiver still requires an analog “front end” (i.e.,that part of the receiver that detects a signal from the antennainput and amplifies and converts it to a lower intermediatefrequency (IF) signal).
The IF signal, in analog form, must be presented to an analog-to-digital converter, which is simply a device that samples thefrequency at regular intervals and converts the voltage levelat the sampling instant to a digitally represented value. Theresulting sequence of digitized samples is then forwarded tofurther digital signal-processing circuits that condition thesignal as desired and extract the transmitted information.Figure 4 provides a schematic representation of such a con-ventional digital receiver.

840 ■ 19 9 8 A N N U A L R E V I E W O F C O M M U N I C A T I O N S
W I R E L E S S
The two most important parameters of the digital receiver areits sample rate and its sample resolution. An important theo-rem of digital signal processing, the so-called NyquistTheorem, states that a signal must be sampled at a rate that isat least double the highest frequency of interest in the signal.The sample resolution represents the level of detail to whichthe sampled signal is recovered. For example, if the digitizedsamples only contain eight bits, then the recovered signal isone part in 256 or 28 bits. Obviously, higher sampling resolu-tion provides a greater representable dynamic range (themultiplicative factor between the smallest non-zero signalvalue and the largest value representable in digital form).Perhaps the most familiar example of this process is the stan-dard compact disc music format, with a sampling rate of 44.1kilosamples/second, with each sample represented by a 16-bit quantity. The sample rate permits all frequencies up to22.05 kHz (which exceeds the range of normal human hear-ing) to be preserved. The 16-bit samples permit 96 dB of dy-namic range for the digitally recorded music.
What is Broadband Digital Radio?
The principles discussed above underlie the new digital com-munications protocols such as (DAMPS), GSM, and theCDMA standard. The advantages of digitization are broadenough so that one might refer to digital communicationstechniques as revolutionary, rather than evolutionary.Broadband digital radio is a revolutionary development, as itis based on the dual concept of broadband RF processing anda digital software-defined base station. Broadband radiorefers to the capability of a radio to receive a very wide band-width of RF spectrum, as compared to a traditional narrow-band radio.
While a standard cellular transceiver receives and demodu-lates a single subscriber channel (i.e., 30 kHz), the broadbandradio receives a 5-MHz RF bandwidth,2 and every other nar-rowband RF channel within that spectrum is available for
both transmission and reception through that single trans-ceiver). In an AMPS system, the single broadband radio canreplace 84 standard AMPS transceivers. In a TACS system,100 25-kHz channels are available, and in a GSM system,with a 200-kHz RF-channel bandwidth, a single transceivercan replace 12 or 13 transceivers and provide service for 92 to100 subscribers.
Another large advantage accrues to broadband radios be-cause there are no limitations as to which channels can beconnected to a common transmit antenna. Channels nolonger need to be at a minimum spacing to prevent narrow-band transmitters from effectively destroying each other. Inother words, only one transmitter is involved, and everyother channel within the 5-MHz range of the transmitter canbe transmitted on a single antenna. A single antenna couldtransmit every other AMPS channel (a maximum of 84) in itsbandwidth, and there are no combiner losses of 4 dB to bereckoned with between transmitter and antenna. But the mostsignificant advantage of this spectral flexibility is that manynew possibilities open up for frequency assignment and fre-quency-reuse plans, as will be discussed in later sections.
Cellular systems using broadband radios thus gain a large ad-vantage in simplifying base station architecture by eliminatingthe many radios and the consequent complex RF distributionand filtering structure. Broadband radios magnify that advan-tage by opening up a previously forbidden range of fre-quency-planning schemes, allowing very different ways ofassigning channels and even permitting dynamic assignmentof channels among cells to follow variations in traffic.
Thus, the broadband radio offers a large simplification in basestation hardware and a great increase in the options availableto the wireless system planner. But even with that, the broad-band paradigm is only half revealed. The broadband radio isthe RF front end for a completely digital approach to demod-ulating the subscriber channels as shown in Figure 5. Note
Mixer Band PassFilter
RetrievedInformation
Analog-to-Digital
Sampler
BasebandDigitalSignal
Processing
AnalogInputSignal
DigitalOutputSignal
The sample resolution determines how closely the sampled digitalvalues conform to the input waveform.
F I G U R E 4An “All Digital” Receiver Architecture

19 9 8 A N N U A L R E V I E W O F C O M M U N I C A T I O N S ■ 841
J O H N R . D O N E R
that in the figure the wideband transceiver outputs a signalthat has been converted to a very rapidly sampled digital rep-resentation of the 5-MHz received bandwidth. That digitalsignal then enters the Carney Engine that separates it intodigital data streams representing all of the narrowband chan-nels within the original 5-MHz bandwidth.3 These separatedsignals are passed to circuit cards containing an advancedand very high-speed DSP architecture to be demodulated andconverted to the baseband (i.e., digital voice) format requiredfor the protocol in use. This entire architecture is called theAirNet broadband transceiver system (BTS). Because both theCarney Engine and the DSP cards of the AirNet architectureare controlled by software, the terminology “software radio”is used to describe the architecture shown in Figure 5.
This digital software radio architecture has several uniqueadvantages over traditional narrowband approaches towireless services. The first is that a single, unchanging hard-ware unit can be configured by software to perform manyfunctions, and, in fact, to support many separate wirelessprotocols and services. This feature would not be of muchvalue in a world where wireless protocols were static, butexperience shows that new protocols and service optionswill continue to emerge.
A service provider operating a system using these BTSs canadapt the base station equipment to most major protocolchanges with only a download of new software into the BTSand minor hardware changes. For example, a provider couldswitch from the 900-MHz nordic mobile telephone system(NMTS) to GSM, operating in the same frequency band withsoftware downloads and small modifications to the RF front-end equipment in the BTS and BSS.4 Of course, the productdevelopment cycle required to implement a new protocol issimplified, reducing the cost of the product and improvingthe time to market.
In fact, a provider can simultaneously support multiple pro-tocols within a single BTS using the same antenna structuresand backhaul infrastructure. A TACS/NMT-900 system, anAMPS/ DAMPS system, a GSM/NMT-900, or GSM/TACSsystem are all possibilities, although the switching equipmentrequired for these combinations is currently different. Theprovider would have the advantage in these cases of havinga dynamically movable capacity boundary between the twoprotocols (e.g., if an AMPS/DAMPS system began with alarge proportion of AMPS customers, who then migrated tothe DAMPS, the BTS would not be changed in any respect,because at any moment its total capacity can be split in anyratio of (30 kHz) channels devoted to AMPS versus DAMPS.
Another large advantage of the broadband software radiois the capability to monitor conditions and exert real-timecontrol at levels that are well beyond the scope of narrow-band architectures. For example, AirNet has developed afour-cell frequency-reuse plan for analog TACS and AMPSand a three-cell frequency-reuse plan for GSM/PCS 1900systems. Both of these configurations represent spectralreuse at higher levels than have been available before andrely on the highly resolved capability of the software-con-trolled BTS to analyze and adapt to the environment in real
time. These frequency plans will be discussed below inmuch more detail.
This completes the top-level description of this latest revolu-tionary step in wireless architectures, and it is likely that thisnew paradigm will eventually overwhelm the narrowbandwireless industry. The broadband/software BTS represents asprofound a change in commercial wireless as did the movefrom MTS to cellular, as will be illustrated in the sectionsbelow. From this new perspective, the traditional techniquesof cellular design must be viewed as of historical value only,and cellular system engineers must open their minds to verydifferent ways of viewing the allocation of resources withincellular systems. The huge flexibility offered in this new ar-chitecture may result in the realization of power-control algo-rithms, channel-assignment techniques, and smart antennasystems with two to five times the capacities already offeredby digital cellular systems. This process has begun with thethree- and four-cell frequency-reuse configurations to be de-scribed in the following sections.
Transmit Power Demand in Broadband Systems
With the BTS, the downlinks for all subscribers are transmit-ted through a single amplifier. This amplifier must be linearover the entire 5 MHz of bandwidth served by the BTS. Acursory analysis of the power demand for such an amplifiercan be misleading, however, if it is based on the traditionalnarrowband paradigm of supplying 40 to 100 watts per chan-nel output from the transmitter.
If the narrowband requirement applied to a broadband sys-tem, then a BTS supporting 96 traffic channels on separate RFcarriers could require as much as 9600 watts of output to theantenna system!5 Such a product cannot be built using cur-rent technology, but, fortunately, the actual power demand ismuch less.
First, because the BTS uses a single 5-MHz signal to transmitall downlinks, the usual cavity combining of transmitters iseliminated. The energy loss associated with a cavity combineris generally more than 60 percent (4 dB), so a broadbandtransmitter begins with a 60 percent advantage in terms ofpower required.
An even stronger advantage comes from the fact that the totalamplifier power of a broadband transmitter can be shared as alinear sum of the individual signal powers needed to supportthe active downlinks. Thus, even though each narrowbandtransmitter must be sized to support a link to the cell bound-ary, it is statistically an extremely remote likelihood that allmobiles would ever simultaneously be at the cell boundary.6
Another factor that must be accounted for in deriving a realis-tic transmit power budget is the fact that the demand forpower to support a link falls off roughly in inverse proportionto the fourth power of the distance from the transmitter.7 Thismeans that at half the distance to the transmitter, only one-sixteenth the power is needed.
Another useful feature of the GSM/PCS 1900 protocol is dis-continuous transmission (DTX), which cuts transmit power to

842 ■ 19 9 8 A N N U A L R E V I E W O F C O M M U N I C A T I O N S
W I R E L E S S
a minimum whenever one side of a (duplex) conversation isinactive. Statistically, this means that a transmitter supportingN channels need only be supplying significant energy to 40percent of the channels at each moment.8 Of course, there issome variance to this, and a transmitter is more safely sized ifa higher voice-activity factor is assumed.
Finally, the most important factor in the analysis of powerdemand is that downlink power and uplink power are re-lated (i.e., if a mobile unit has a total transmission power ofbetween only 0.6 watts to 3 watts, then by what amountdoes the downlink transmit power need to vary fromthat?). A link-budget analysis for the uplink and downlinkwill normally show that about 5 - 8 dB more downlinkpower is needed to support the path than is available onthe uplink.9 Thus, a provider should limit each cell radiusso that the weakest transmission power of any mobile unitis able to complete an uplink, and then the downlinkpower required is 5 - 8 dB (3.16 - 6.31 times) higher thanthe downlink required.
AirNet has derived a transmitter power demand density forfour scenarios and for both analog and GSM/PCS 1900 proto-cols as shown in Table 2.10 The table shows the total powerdemand expected in a cell for various numbers of channelsand for systems with downlink DTX implemented or not im-plemented. It also accounts for the cell shape [i.e., eitherhexagonal (first value of each entry) or circular (second valueof each entry)].11 Finally, it allows for a higher power level (1dB) on each control channel.
The results in the table are quite remarkable, showing that thetotal amplifier power required at a base station is still wellbelow 100 watts in the very worst case illustrated. These levelsof power are easily achieved in linear power amplifiers usingcurrent technology.
In summary, the broadband paradigm must create the sameresult (i.e., a successful subscriber link) as a cellular systemwith very different ingredients. The management of powerfor broadband systems permits high-resolution software con-trol and sharing of the power. Early testing of these concepts
has so far shown that the model of power demand in a broad-band-based cell is valid.
Receiver Saturation in Broadband Systems
While the requirements for broadband amplifiers were ad-dressed in the previous section, it is useful to examine an im-portant aspect of broadband receiver technology. Anyreceiver has a dynamic range that denotes the maximumrange of signal strength that can be accommodated. A typicallower limit of dynamic range for cellular receivers that stillpermits detection and demodulation of the signal is from 105dBm to 115 dBm. This lower limit, together with the co-chan-nel interference levels in a cellular system, determines themaximum cell radius for the system.
There is also a maximum signal level that any receiver canaccommodate, and a higher signal level will overload thereceiver circuitry and prevent successful receipt of the sig-nal. Almost any base station receiver could be overloadedby a mobile transmitter operating very close to the antenna,but the consequences for a narrowband versus a widebandreceiver are different: a narrowband receiver serving onecall might drop the call, while a broadband receiver sup-porting many subscribers might drop or disrupt many calls.
A/D To SwitchBasebandDSPChannelizer
CARNEY ENGINE
BandFilterand
DownConvert
MultiplexSwitch
Interface
ReceiveAntenna
D/A CombinerRF PowerAmplifier
TransmitAntenna
F I G U R E 5Digital Software Radio Architecture
ProtocolChannel PCS 1900 AMPSCount (1 watt mobile (0.6 watt mobile
(includes with 6.3 watts (8 dB) with 1.9 watts (5 dB)control ch) downlink maximum) downlink maximum)
DTX No DTX DTX No DTX24 19/21 20/21 16/21 24/3148 27/33 31/38 25/32 40/5372 32/41 40/50 32/43 54/7396 37/47 48/62 39/52 69/93
T A B L E 299.999 Percentile Power Demand for BTS-based Cell

19 9 8 A N N U A L R E V I E W O F C O M M U N I C A T I O N S ■ 843
J O H N R . D O N E R
The issue of broadband receiver dynamic range thus needscareful attention.
Radio receivers generally ameliorate the problem of potentialreceiver saturation by employing an automatic gain control(AGC) circuit which limits or boosts the level of the input sig-nal to the receiver. If AGC were not available, a very strongsignal might overwhelm the capacity of the initial receiver cir-cuitry, causing temporary loss of the received signal; this ef-fect is called “saturation.”
A broadband receiver employed in a commercial wirelesssystem must deal with the widely disparate signal levels thatmight arrive from subscribers who are both very near andvery far from the receiver. The AGC in a broadband receiveracts only on the total signal energy received across the band-width of the receiver: thus, a very strong signal from nearbywill predominate and trigger the AGC circuit even if a veryweak signal from a distant subscriber is also present. TheAGC applies proportionally to all signals within the receiver’sinput bandwidth, so the receiver AGC, while decreasing thelevel of the strong signal, will also attenuate the weak signalso much so that the receiver can no longer successfully detectand demodulate it.
The broadband receiver has a dynamic range specificationof 80 dB, indicating that the difference between the greatestand weakest signal to be received should not exceed 80 dB.Currently, the receiver can handle signals (at its input) atvalues as high as -35 dBm, and the AGC circuitry operatesto attenuate signals received within the range from -35 dBmto -50 dBm. The overall dynamic range thus spans the rangefrom -35 dBm to -115 dBm, which meets the sensitivity re-quirements for GSM and AMPS/TACS base station re-ceivers. This dynamic range will increase in future AirNetreceiver designs.
The question then arises as to whether there are circum-stances under which nearby subscribers might exceed the -35 dBm signal level and might cause temporary loss of someweaker signals within the receiver bandwidth until the highsignal level ceases. This question has been investigated withrespect to several wireless protocols of interest, with the con-
clusion that receiver saturation is at best a remote possibility,and even that possibility can be prevented by appropriateantenna siting.
In order to establish the context of the discussion, it must benoted that the signal received from a mobile unit is affectedboth by the distance between the mobile and the BTS antennaand the effect of the antenna gain pattern on the subscribersignal. Even if an omnidirectional antenna is used at the BTS,the subscriber’s signal strength at the BTS will be affected bythe angle of arrival of the subscriber’s signal as measured inthe vertical plane. A generic vertical pattern of a standard om-nidirectional 10 dB gain antenna is shown in Figure 6(a).
Note that such an antenna has a main lobe that is centered onthe horizon and has a number of side lobes in which sub-scribers closer to the base station will fall. Most subscriberswill be in the main lobe of the antenna pattern, but signalsfrom subscribers very close to the base station antenna mayarrive within the side lobe region of the antenna pattern. Theside lobes have lower gain than the main lobe, and an exactaccounting of the effect of subscriber position is necessary todetermine when receiver saturation might occur.
Also, it is important to recognize that commercial wirelessprotocols almost without exception include the capability forthe base station to control the power level being receivedfrom the mobile. Generally, the mobile is allowed to initiatecontact with the base station at a maximum power level that isadequate to ensure a successful contact for mobiles anywherewithin the coverage area of the base station. The base stationmay measure the received signal level from the mobile uponfirst contact and then may command a change in mobiletransmit power based on that initial signal-level measure-ment. Thus, the opportunities for receiver saturation can belimited to the occasion of first contact of a mobile with thebase station on the control channel, and it is feasible to reactto and power down a mobile in a very short interval, therebypreventing actual loss of any calls.
In order to exemplify the possibility of receiver saturation, wewill consider the particular case of a mobile with a 0.8-watt maximum transmit power. This transmit level repre-
a) Vertical Antenna Pattern b) Vulnerable Region
17°
27°
F I G U R E 6Example of Cellular Antenna Pattern in the Vertical Plane

844 ■ 19 9 8 A N N U A L R E V I E W O F C O M M U N I C A T I O N S
W I R E L E S S
sents a level as high or higher than is permitted for hand-heldmobile units in GSM or PCS 1900/DCS 1800 applications.Although there are other classes of mobiles that may transmithigher power, the coverage area of the base station must belimited to an extent which can accommodate all classes ofmobiles and so the base station may normally limit the trans-mit power of all classes of mobiles upon initial contact to themaximum power level of the minimum power class mobile(i.e., 0.8-watt in this example).
Given this situation, a typical link budget comprising thegains and losses for the mobile signal was established, andthe mobile was stepped through positions approaching theantenna in 1 degree increments. All of the terms in the linkbudget except the distance and antenna gain in the elevationplane (both due to the position of the mobile relative to theantenna) are fixed. Thus, as we step the mobile through posi-tions approaching the base station antenna, we can computethe signal strength from the mobile at the input to the BTS re-ceiver, thereby determining at what points there is a risk ofBTS receiver saturation.
Figure 6(b) displays the vulnerable region found by steppingthe mobile through successive positions for an actual antennapattern of a standard base station cellular antenna. What isdisplayed is a range of angles for which the antenna gain andsignal strength make the BTS receiver vulnerable to satura-tion. Path loss is computed by use of the Lee propagationmodel at substantial distance, but free space propagation lossis assumed for mobile positions very near the antenna.12
This vulnerable region in fact is an annular ring aroundthe cell-site antenna, corresponding to antenna gain in thesidelobes of the E-plane antenna pattern and contains anarea that varies depending on antenna height as shown inTable 3. As a first approximation, we may assume that thesubscriber population is uniformly distributed within thecell.13 If that is the case, then the proportion of the areasshown in Table 3 compared to the area of the whole cell
represents the probability that a subscriber is in the vul-nerable area. That probability, together with an estimateof how often a subscriber might access the control channel(at full power), will provide some sense of the likelihoodof receiver saturation.
The overall cell area and number of subscribers depends onthe demographics and traffic engineering of the cell. Table 4reflects cell sizes based on the Lee propagation model, fourdemographic categories, and an assumption that subscriberspower up and access the control channel an average of onceper busy hour.14 As shown in Table 4, two of the cases involvecapacity-limited cells (i.e., the area of the cell is not deter-mined by the distance possible for successful propagation,but by the fact that the subscriber density is so high that thedemand uses up 92 channels in an area much smaller thanthat implied by the propagation limit).15
Note that for the capacity-limited cases, the maximummobile transmit power needed to operate out to the cellboundary is much lower than the nominal 0.8 watts. Thus,BTS receiver saturation never occurs, since the mobilescan be directed at powerup (via the control channel over-head message) to use a low initial power. For both subur-ban and rural cases, there is a possibility of saturation, butthe overall cell size is large, so that the proportion that isvulnerable is very small. The resulting probabilities repre-sent saturations per day, if three hours of traffic per day isthe busiest level.
Thus, saturation might occur on the control channel butat a rate of once every three to four days. There are sev-eral factors that may further ameliorate the effects ofthese remote possibilities.
• First, most suburban and rural antennas are in fenced-insites, or at least well away from normally accessed publicareas, so that subscriber access to the vulnerable region isan extremely remote likelihood.
• If such siting circumstances cannot be arranged, thenpresence of a wire-mesh shielding placed below the an-tenna can eliminate the risk altogether.
• Finally, even when a saturation occurs, it should last forat most about 0.5 seconds, which at the rarity shown, willnot noticeably degrade overall call quality.
Antenna Height Inner Radius Outer Radius Vulnerable Area
100 ft. 30.6 ft. 53.2 ft. 5950 ft.2
200 ft. 61.2 ft. 106.4 ft. 23,800 ft.2
Cell Type Population RF Radius Capacity Maximum Vulnerable SaturationDensity (miles) Radius Mobile Fraction14 Rate
per mile2 (miles) Power (per day)
Dense 356,932 1.17 0.42 0.013 W 0 0Urban
Urban 72,190 2.23 0.94 0.025 W 0 0
Suburban 1026 3.72 7.89 0.8 W 4.9 x 10⁻⁶ 0.385
Rural 365 8.72 13.22 0.8 W 3.6 x 10⁻⁶ 0.283
T A B L E 3Radii and Area of Vulnerable Region
T A B L E 4Receiver Saturation Rates for Different Demographics

19 9 8 A N N U A L R E V I E W O F C O M M U N I C A T I O N S ■ 845
J O H N R . D O N E R
The overall conclusion then is that base station receiver satu-ration will not occur in dense urban or urban settings, and is,in fact, avoidable in any context by selecting proper antennasand doing careful site planning.
Four-Cell Reuse in Analog Cellular
Just as the computer vastly expanded the capabilities of thecalculator, the arrival of all-digital, software-controlled radiowill greatly transform the capabilities and capacities of wire-less systems. A four-cell frequency-reuse plan is currently intesting for analog cellular that will provide substantiallygreater capacity than is provided by traditional seven-cellconfigurations. The current four-cell project uses a dynamicfrequency-assignment scheme and is nominally a four-cell,two-sector frequency reuse scheme. If it could be operated at atheoretical upper limit of capacity, then it would provide 78.6Erlangs per cell (2 percent blocking), rather than the 34.3Erlangs possible in a seven-cell, tri-sectored system. Thiswould represent a capacity improvement of 129 percent butthat will not be realizable in practice, because the dynamicchannel assignment scheme involves a form of soft-blocking;that is, there will be circumstances under which a channelmay be free in a cell, but should not be assigned due to ahigh-ambient co-channel noise level. Simulation results todate indicate that actual capacity gain should be in the rangeof 75 percent to 90 percent.
Background
The signal-to-interference ratio for a receiver specifies theratio of the energy within its receiver bandwidth comprisingthe intended signal versus the unintended interference. In cel-lular systems, each RF frequency available to a base stationwill be reused in cells at some distance from the base station.These other base stations using the same frequencies are theco-channel neighbors, and their uses of the same frequenciesaccount for most of the interference present. The seven-cellomnidirectional frequency-reuse scheme for analog AMPSprovides an average S/I of about 18.5 dB, which is adequatefor AMPS receivers.
Dynamic Channel Assignment
A four-cell frequency-reuse plan would normally fall short ofproviding an adequate S/I for analog cellular. However, anumber of techniques to ameliorate interference are possibleusing the advantages of broadband architecture, and thesetechniques will permit a four-cell, two-sector frequency-reuseconfiguration for AMPS (or TACS) as illustrated in Figure 7.
The four-cell configuration requires that certain features thatwere automatically included in the newer digital standardsbe retrofitted as non-standard additions in the analog proto-cols. Specifically, a technique for forward link (i.e., base sta-tion to mobile) power control and for assigning channelsintelligently was created so that co-channel interference levelsfrom nearby neighbors are taken into account.
The essence of the dynamic channel-assignment scheme isbest explained by Figure 7. In that figure, the co-channel cells
in a four-cell frequency configuration are shown with sector-ing. Note that each sectored cell involves six 60 degree sec-tors, but, in fact, alternate sector antennas broadcast the sameRF signal, so that logically, the three commonly labeled 60 de-gree sectors comprise a single 180 degree sector. Thus, theconfiguration is logically a four-cell, two-sector reuse pattern.Note that each sector is also subdivided into an inner andouter tier (illustrated in the central cell of the figure), the pur-pose of which will be explained later.
The co-channel cells in Figure 7 are inadequately separated toprovide an adequate S/I ratio for standard analog-cellularoperation. If no power control were in use, a mobile at theouter boundary of the center cell would receive interferencefrom as many as three surrounding cells in the first ring of co-channel cells. This would result in S/Is of 14.3 dB, 16.1 dB,and 19.0 dB for 3, 2, and 1 active interferers, respectively.
However, with downlink power control, it will rarely be thecase that all of the interfering signals are at full power (i.e.,that the mobiles on the same channel are simultaneously attheir cell boundaries), and, in fact, the average power neededfor a mobile in a randomly chosen location within the cell is1/3 the maximum power needed to close a link to the cellboundary. Accounting for this fact, the S/I above for three ac-tive interferers becomes, on average, 19.0 dB, which is slightlybetter than the 18.5 dB S/I of a seven-cell omni configuration.
Thus, use of forward power control in an analog system can re-sult in an acceptable S/I relationship even in a four-cell fre-quency-reuse configuration. However, the situation can beimproved even more if the assignment of channels to mobilesin a given cell is based on cooperation with the major interfer-ing co-channel cells.
Specifically, the channel assignment plan involves subdivid-ing each sector into an inner and outer tier, separated by aboundary parallel to the outer cell boundary but at 0.707 ofthe cell radius.16 The channel assignment algorithm accountsfor the fact that mobiles using channels in the inner tier oper-
F I G U R E 7The 4-Cell, 2-Sector Frequency Reuse Scheme
A B
A BAB 1
1 1
A B
A BAB
A B
A BAB 1
232 3
323 2
A B
A BAB
A B
A BAB
A B
A B
ABA B
A BAB

846 ■ 19 9 8 A N N U A L R E V I E W O F C O M M U N I C A T I O N S
W I R E L E S S
ate at much lower power levels than mobiles in the outer tier.Each base station advises its neighbor-co-channel base sta-tions of the current channels in use and whether they are inuse in the inner or outer sector. When new calls are assignedchannels, the channel assigned will be selected based on theinterference and power level needed to adequately supportthe call.
The ability to “fit” mobiles to channels based on the powerlevel needed to support the call, compared to the interferenceexpected in every available channel, provides the capabilityto control the S/I to a much finer resolution than would bepossible in a typical AMPS implementation and makes thefour-cell co-channel spacing feasible. Since the decisions as towhich channels to assign are made based on dynamic infor-mation, it is not possible to determine without simulation andfield trials exactly what S/I level would be achieved in thissystem. The 19 dB cited above would appear to be a lowerbound, so the four-cell system will realize RF quality at least atthe level of seven-cell omni systems.
This assignment algorithm has an intrinsic soft-blocking po-tential, because an RF channel may remain available in a cellbut not be assignable to a mobile when it is already in use inall outer tiers of the major co-channel interferers. This hasbeen subjected to a closed-form probability analysis, whichdemonstrated that this soft-blocking effect is very low forchannel allocations per sector of more than 24 channels. Sincethe four-cell configuration is intended to provide high capac-ity to currently congested AMPS/TACS systems, it is unlikelythat fewer than 24 channels per sector would be implementedin this configuration.
Use of Alternate Channels
A four-cell, two-sector configuration, applied to a full 12.5MHz AMPS system, should provide 59 channels per sector or128 per cell. The traditional spacing for this arrangementwould require that every eighth channel be selected for a sec-tor spanning approximately the full 12.5 MHz of AMPS spec-trum, but the BTS cannot accommodate that spacing withinits 5 MHz bandwidth. However, if every other channel isused in a sector, the 5 MHz bandwidth of any BTS comprises83 usable channels, which is more than adequate.
A reasonable concern arises as to whether or not mobile unitscan adequately reject signals on channels so close to the tunedchannel. This problem has been examined, both theoreticallyand in the lab. The analog mobiles can be expected to provideabout 55 dB of attenuation for a signal operating two chan-nels away from the tuned channel. Tests of a mobile unit inthe laboratory have shown that a mobile channel providesgood voice quality even when the two surrounding alternatechannels are operating at a signal level 35 dB higher than thesubject channel.
However, in an actual cell, a mobile operating near the cell-site antennas may require a very low signal level, while a dis-tant mobile served on an alternate channel might require asignal level 30 dB to 50 dB higher. Thus, alternate channelscannot be assigned to traffic arbitrarily: there must be some
attempt made to prevent a near and distant mobile from oc-cupying an alternate channel pair.
To that end, a constrained channel-assignment process hasbeen considered, which will attempt to assign alternate chan-nels in a single sector to mobiles that are at power levelswithin a 30 dB difference. The algorithm for this process wassimulated in an event-driven simulation, incorporatingpseudo-randomly scheduled traffic arrivals, exponentiallydistributed call lengths, and a 30 dB constraint between alter-nate channels. Busy-hour traffic loading was at 51.52 Erlangsfor a 62-channel cell (2% blocking), and mobile positions werealso pseudo-randomly drawn from a uniform positional dis-tribution within the sector. The equivalent of 600 hours ofbusy-hour operation was simulated, and representative re-sults for a 25 dB and 30 dB constraint are shown in Table 5.
In Table 5, two assignment algorithms are compared, the “firstfree channel” and the “tapered” algorithms. First free channelsimply assigns a new mobile to the first inactive channel,working from one end of the channel allocation, which meetsthe power difference constraint (i.e., the center channel iswithin 25 dB or 30 dB of both neighbors). The tapered algo-rithm attempts to assign high-power channels to one end ofthe allocation and work downward toward the lowest pow-ered channels at the other end. Interestingly, the two algo-rithms produced essentially identical results, and, as can beseen, the blocking probability imposed by the constraintclimbed only modestly (by 17%) from the usual (uncon-strained) blocking probability, representing the lack of anyidle RF channel at a call origination.
These results were suitably encouraging to indicate that alter-nate channel assignment should not decrease sector capacityby more than a few percent, and, in any event, there is alsothe possibility that intrasector handoff may be applied to alle-viate the occasional soft block represented by these results. Insummary, the four-cell configuration provides proof that theall-digital software paradigm represents not an evolution of,but a revolution in wireless techniques.
Three-Cell Frequency-Reuse for GSM/PCS 1900Systems
The case has been made that the advantages of broadbandsoftware radio could support a four-cell frequency-reuse con-figuration for AMPS and TACS. Similarly, a dynamic fre-quency-assignment scheme is in development of GSM/PCS
Alternate Blocking ProbabilityChannel
Constraint First Free Taperednone 0.0201 0.0201
30 dB max 0.0234 0.023425 dB max 0.0254 0.0250
T A B L E 5Soft-Blocking Effects Associated for Alternate Channel Usage

19 9 8 A N N U A L R E V I E W O F C O M M U N I C A T I O N S ■ 847
J O H N R . D O N E R
1900 cellular systems that will provide a substantial increasein traffic capacity over traditional seven-cell or four-cell, tri-sectored arrangements. This configuration is nominally athree-cell, two-sector frequency-reuse scheme, and, if it couldbe operated at a theoretical upper limit of capacity, then itwould provide 160.5 Erlangs per cell (2 percent blocking)rather than 109.5 Erlangs as possible in a four-cell, tri-sectoredsystem. This would represent a capacity improvement of 47percent, but that would slightly decrease in practice, becausethe dynamic channel assignment scheme involves a form ofsoft-blocking: that is, there will be circumstances under whicha channel may be free in a cell, but should not be assigneddue to a high-ambient co-channel noise level.
Background
Broadband radio equipment comprises all-digital, software-driven equipment that is capable of permitting highly re-solved, real-time control in cellular systems. This capabilityshould be exploited in all products to offer potential cus-tomers features that they cannot obtain with traditional nar-rowband cellular architectures. The first major technicalbreakthrough in the area of real-time system control was athree-cell, two-sector cellular architecture for the GSM/PCS1900 digital wireless standard. The three-cell architecture isbased on using several noise-amelioration techniques—specifically, power control on both the forward and reverseradio paths to the mobile, discontinuous transmission (DTX),and a channel-assignment scheme that accounts for the cur-rent co-channel activity in nearby cells.
Dynamic Channel Assignment
The three-cell channel-assignment scheme is dynamic in thesense that it attempts to implement cooperation with neigh-boring co-channel cells. The essence of channel assignment isbest explained by Figure 8.
In this figure, the co-channel cells in a three-cell frequencyconfiguration are shown with sectoring. Note that each sec-tored cell involves six 60 degree sectors, but, in fact, alternate-sector antennas broadcast the same RF signal, so thatlogically, the three commonly labeled 60 degree sectors (la-beled with “A”) comprise a single 180 degree sector and like-wise for the unlabeled sectors. Thus, the configuration islogically a three-cell, two-sector reuse pattern. Each sector isalso subdivided into an inner and outer tier (shown in thecenter cell), as was the case for the analog four-cell system.
The co-channel cells in Figure 8 are inadequately separated toprovide an adequate S/I ratio for standard GSM cellular op-eration. If no power control were in use, a mobile at the outerboundary of the center cell would receive interference from asmany as three surrounding cells in the first ring of co-channelcells. The remaining three co-channel cells in the ring alsohave A-sector antennas, but they are pointed away from thecentral cell and contribute interference at a much lower level(somewhat under 10 percent of the total). With power control,it will rarely be the case that all of the interfering signals areat full power (i.e., that the mobiles on the same channel are si-multaneously at their cell boundaries). In fact, the average
power needed for a mobile in a randomly chosen locationwithin the cell is one-third the maximum power needed toclose a link to the cell boundary.
In effect, the interference-amelioration techniques describedfor the four-cell AMPS/TACS system are also applicablehere. GSM and PCS 1900 have closed-loop power control onboth the uplink and downlink, so that feature will be easilyimplemented and is not unique to this system. The dynamicchannel-assignment scheme, as described for the four-cellsystem, will also be implemented, which is unique. Finally,discontinuous transmission is automatically available in theGSM protocol and will further reduce average interferencelevels in the system. The analysis to date indicates that thethree-cell system is feasible and will provide greater spectralreuse than has been achieved prior to this in GSM-based sys-tems, and a 23-25 dB average S/I ratio for subscribers.
The Range Extender—Migration from Low to HighDensity
The three-cell, two-sector configuration can accommodatevery high demand (conservatively estimated at 120 Erlangsper cell). Many PCS 1900 operators are essentially beginningwith no subscriber base (a “greenfield” application) and mustinstall the equipment in the face of no initial revenue.
It is recognized that providers require a reasonable and cost-effective migration path from the no-density through the low-density to the ultimate high-density situation. The idealintegration plan permits cells to be established initially using asingle 200-kHz PCS 1900 carrier (serving 3 Erlangs) and ulti-mately growing through a sequence of density stages to thehigh-density, three-cell, two-sector configuration. Moreover,this migration plan permits different cells in the area to coexistat different densities and facilitates equipment upgrade instages that are very compatible with the increasing demand.The provider can begin with a low-cost system and wait fordemand to grow in the coverage area. The upgrades neededas demand grows are specific to the situation and require
F I G U R E 8The 3-Cell, 2-Sector Frequency Reuse Scheme
A
AA1
A
AA1
A
AA1
A
AA1
A
AA1
A
AA1
A
AA1
A
AA1
A
AA1 A
AA1
A
AA1
A
AA1
A
AA1
2 3
2 3 2 3
323 2
2
32
3
3
2 3
2 3
2 32
3 2

848 ■ 19 9 8 A N N U A L R E V I E W O F C O M M U N I C A T I O N S
W I R E L E S S
much less replanning and complex rearrangement of the sys-tem than in typical cases.
The fundamental element in this migration plan is the AirNetrange extender (ARE) which permits a single GSM 200 kHzcarrier to service a coverage area. A single GSM carrier canserve a capacity of 3 Erlangs at 2 percent blocking or approxi-mately 150 subscribers, assuming a typical 20 milliErlang de-mand level per subscriber.
The range extender is not a repeater, because it translatesthe frequency in-band and implements receive diversityfrom the mobile. This means that the signal on the uplinkfrom the mobile is received at two separated antennas,which strongly compensates for the usual fading losses dueto multipath effects. The ARE thus provides a signal qualityindistinguishable from a transceiver sited at a base station,while a repeater signal would provide a noticeably lowerquality to the customer.
The ARE is not simply a transceiver, however, because atransceiver operating alone to cover an area needs a separateinterface (e.g., T-1 line and associated multiplex equipment),while the range extender communicates via a duplex RF link
back to a BTS as shown in Figure 9. In areas of low customerdemand, up to 12 range extenders can be deployed around aBTS, communicating with the BTS via dedicated in-band airlinks. The range extenders are purely analog-signaling de-vices communicating back to the BTS, and the BTS providesdownconversion, demodulation, and multiplexing/backhaulto the mobile switching center or PSTN.
The initial deployment of range extenders in a twelve-cell, 3-Erlang per cell configuration allows an easy migration to asix-cell, 9 Erlang per cell configuration (450 subscribers) com-prising two RF carriers per cell. This migration is shown inFigure 10.
This pattern is not an ideal 12-cell pattern for frequency reuse(i.e., providing minimum S/I) in that spacing between co-channel cells is not uniform. An ideal 12-cell omnidirectionalpattern has a 20.8 dB S/I as the 90 percentile level. The mini-mum distance shown between co-channel cells in Figure 10indicates that the 90 percentile S/I for this system would ex-ceed 18.3 dB, which is adequate for operation of PCS 1900.
The reason for the nonstandard pattern of Figure 10 is thatthis pattern lends itself to a reconfiguration scheme permit-ting the cutover of low-demand cells supported by range ex-tenders to omnidirectional cells comprising six RF carriers percell (36.5 Erlangs or 1575 subscribers), then to sectored cells(as shown in Figure 8) providing 12 carriers per cell (73Erlangs), and finally to high-demand, three-cell reuse config-uration as discussed in Figure 8. This occurs with minimumimpact on the surrounding low-demand cells, which continueto operate with S/Is, which are well above the level neededfor suitable GSM/PCS 1900 signal quality.
The original low-demand frequency plans (one, two, or sixcarriers per cell) function in a typical fashion, with no needfor coordination between cells. As a provider builds a cus-tomer base, the low-demand cells can be converted, cell bycell, to two-sector cells, in the usual alternating 60 degree sec-tor pattern of a three-cell plan. When a cell is converted to
F I G U R E 9AirNet Range Extender Deployment
BTS
BroadbandTransceiver
System
BTS MS
MobileStation
ARE
AirNet RangeExtender
F I G U R E 1 0Low Demand Configuration Using AREs
C2
A2
C3
A3B2
C0
B3
C1A0
B0
A1
B1
One BTS serves twelve cells,one RF carrier per cell (3 Erlangs)
C2
A2
C3
A3B2
C0
B3
C1A0
B0
A1
B1
Two BTSs serve six cells each, supportingtwo RF carriers per cell (9 Erlangs)

19 9 8 A N N U A L R E V I E W O F C O M M U N I C A T I O N S ■ 849
J O H N R . D O N E R
two sectors, the power control and channel-assignmentscheme of the three-cell system go into effect for the sectoredcell. The co-channel interference levels present for any mix ofthese five densities of cells will always remain acceptable forGSM/PCS 1900 operations.
In summary, there is a feasible, pay-as-you-go migrationstrategy for the product line supporting five levels of demandper cell, and all cells supporting these various demand levelscan coexist with each other in a provider’s service area.Upgrade of equipment is on a cell-by-cell basis, and onlyslight modifications of frequency planning are required,which at most require modifying the frequency band of aBTS. Providers may install the initial system with the confi-dence that they will not need to continue purchasing expen-sive upgrades involving equally expensive replanning efforts.
Broadband Radio and Smart Antenna Technology
Earlier, the paper described the radically new hardware ap-proach to cellular that was taken with this product line. Ithas introduced some of the large advantages that can be re-alized utilizing this equipment and has justified consideringthat the BTS can be revolutionary rather than simply evolu-
tionary. But even the advent of tighter spectral reuse andsmooth migration plans do not exhaust the capabilities ofthis new paradigm.
There is also the new technology of “smart” antennas, whichcan form beams of RF energy directed specifically toward asubscriber’s location. This not only provides the effective ad-vantages of highly directional antennas, thereby lowering in-terference, but also allows the possibility for a singlefrequency to be reused multiple times in a single cell. Thisreuse factor can be from two to five, depending on the envi-ronment in which the signal must be propagated.
What smart antennas have to do with the broadband radiorevolution can be seen in Figure 11, which displays a typicalsmart-antenna architecture. The architecture of Figure 11 bearssome resemblance to the original BTS architecture as shown inFigure 5, but note that there are now multiple receive andtransmit paths in the system. These multiple transceiver pathspermit multiple copies of a single signal to be received andtransmitted. Because of this, a comparison of differences(phase and time-of-arrival) for the multiple copies of a signalpermit the direction from which the signal is arriving to be de-termined. Knowing the direction of arrival from a mobile per-mits the transmitted signal to be focused (again, using themultiple transceiver paths at the BTS) so that it places muchmore energy in the direction of the subject mobile.
Several advantages accrue to this “smart antenna” technol-ogy, as listed below:
• The focused signals do not spread over as much of the ser-vice area, lowering interference in other co-channel cells.
• The total need for transmitter power is decreased by afactor of N2, where N is the number of transceiver pathsoperating.
• Cell radii can be expanded because the computationalgain of the smart-antenna system is equivalent to greaterdirectionality in a standard antenna.
• It is possible to actually support more than one subscriberon a frequency using spatial diversity multiple access(SDMA) from the same cell site, provided there is an ade-quate separation of the azimuths of the subscribers.
In any specific environment, some of these advantages aremore attainble than others. In general, early trials with smartantenna systems applied to mobile wireless applicationshave indicated that spectral efficiency can generally be dou-bled (i.e., twice as many subscribers can be served per avail-able RF channel).
Smart antenna technology is not dependent per se on a broad-band communications architecture. However, if this technol-ogy must be implemented using narrowband radios, then abase station providing M RF channels would have to have notjust M narrowband radios, but M narrowband radios con-nected to each antenna element. In an AMPS seven-cell sys-tem, the 55 channels per cell site operating with a ten-element
Diplexer
Transceiver
Beam Forming Matrix and Controller
CarneyEngine
DSP Card
BPU
to BSC
tx rx
Diplexer
Transceiver
CarneyEngine
DSP Card
DedicatedBus
T1 Card
to Switch/Telco
tx rx
F I G U R E 1 1A Wideband Base Station Supporting Spatial Diversity

850 ■ 19 9 8 A N N U A L R E V I E W O F C O M M U N I C A T I O N S
W I R E L E S S
antenna would require 550 radios and a complex, synchro-nized interconnect architecture to support the exact phasing ofsignals required to form directed beams. A broadband archi-tecture requires only one radio per antenna element (i.e., tenradios can replace the 550 radios of the previous example, andthe interconnect structure is vastly simpler).
The BTS technology is a very natural architecture in which toimplement smart-antenna technology as Figure 11 illustrates.In practice, the narrowband base station using smart anten-nas may never be reduced to economical commercial use, andeconomically feasible smart-antenna technology in commer-cial cellular/wireless applications will depend on broadbandradio technology.
A Synopsis of the Broadband Software RadioParadigm
This paper has provided an extensive treatment of the dis-tinctions between traditional narrowband wireless applica-tions and the new paradigm—broadband, software radio. Itshould be evident that broadband wireless equipment cancompete in the commercial wireless market and offer verysubstantial advantages to service providers—all despite thefact that all prevailing wireless specifications were developedwith no consideration of broadband equipment. But broad-band is very flexible, and we have demonstrated that thecommercial wireless cake can be baked from a different set ofingredients: all that matters, ultimately, is that the mobileunit, designed as a narrowband instrument, will establish andcomplete calls with absolutely no indication as to whether theserving base station is narrowband or wideband.
Even if the subscriber cannot tell what the cake is made of,the ingredients really do matter to the provider. The majordifferences, as discussed in this paper, are reiterated below.
• Complexity. The broadband BTS uses one transceiver toserve all subscribers in a cell, vastly decreasing the inter-connect complexity, power requirements, and air condi-tioning demands at a base station.
• Reliability. This much simplified architecture eliminatesmuch scheduled service time (no frequency tuning everrequired) and likewise will eliminate much unscheduleddowntime because of the vastly lower total componentcount in an AirNet BTS.
• Compactness. The BTS and all supporting equipment,except for the antenna system, occupies less than a 19”half-rack and can be sited in many small spaces in exist-ing buildings.
• Flexibility. Because it is fully software-controlled, theBTS can adapt to protocol changes and can offer multipleprotocols from a single platform.
• High Spectral Efficiency. The software control of theBTS permits real-time measurement and response to con-ditions within the cell and promises to offer frequencyreuse configurations that are not realizable with narrow-band architectures. This means a provider can get sub-stantially more revenue per Hz of allocated spectrumand per voice channel, than any narrowband providercan hope to realize. Table 6 illustrates the greater capacityand higher revenue per voice channel (VC utilization)achievable with this product line for both PSC-1900 andAMPS protocols.
• Economy. Finally, the bottom line: a provider whospends less on hardware per cell site can take advantageof existing buildings for siting, hire fewer maintenancepersonnel, readily add new services, and sell moreErlangs per Hz is a provider who will be in control of thecompetition, and the icing on the cake will be the higherprofit margins possible with such a system.
We feel the case made in this paper should be convincing.The systems of the future may eventually all be broadband,but today, the only way to share the advantages of this para-digm is with AirNet.
Footnotes
1 Hess, Gary, C., Land Mobile Radio System Engineering, (Boston: ArtechHouse, 1993).
2 AirNet’s current radio receives a 5Hz RF bandwidth.
3 Named for Ron Carney, one of the founders of AirNet.
4 Switching equipment for the two protocols is very different and would re-quire upgrade activity.
5 The current upper limit of the AirNet product.
6 This assumes that forward power control is available in the air link proto-col. That is automatically the case in GSM/PCS 1900.
Protocol Spectrum Frequency Plan Channels/sector Erlangs/Cell16 VC Utilization
AMPS 12.5 MHz 7-cell/3-sector 19 36.9 65%
AMPS 12.5 MHz 4-cell/2-sector 49 70.117 72%
PCS-1900 15 MHz 4-cell/3-sector 48 115.2 80%
PCS-1900 15 MHz 3-cell/2-sector 9218 160.4 87%
PCS-1900 5 MHz 4-cell/3-sector 15 27.0 60%
PCS-1900 5 MHz 3-cell/2-sector 32 47.4 74%
T A B L E 6Traffic Capacities – Broadband versus Narrowband Deployment

19 9 8 A N N U A L R E V I E W O F C O M M U N I C A T I O N S ■ 851
J O H N R . D O N E R
7 Lee, William C. Y., Mobile Communications Design Fundamentals, (NewYork: Wiley Interscience, 1993).
8 Studies have shown that normal telephone conversations have a net totalof 40 percent voice activity on both the downlink and uplink.
9 This is because the base station has a higher receive gain than the mobile,due-to-receive diversity at the base station using two antennas with spa-tial separation.
10 Doner, John R., “Amplifier Power Requirements for Wideband WirelessApplications,” Presented at SuperComm’96, Dallas, June 26, 1996.
11 A hexagonal cell has more of its area closer to the base station, thus re-quires less total power.
12 Free-space loss is proportional 1/r2, rather than the usual 1/r4 for cellu-lar, where r is the transmit path length. Free space loss occurs within4h1h2/ where h1h2 are the antenna heights, and is the wavelength.
13 Many cellular antennas are on sites where general access is not possible,and subscribers would never be within the ranges shown in Table 3.
14 Based on Chicago population densities.
15 Based on 92 traffic channels per cell, 2 percent blocking, and 20milliErlangs per subscriber busy-hour demand.
16 The dividing line is actually based on dividing the suscribers evenly be-tween the inner and outer tier.

19 9 8 A N N U A L R E V I E W O F C O M M U N I C A T I O N S ■ 853
Introduction
With the ongoing liberalization in the Indian economy,more and more private participation is expected in thebroadcasting sector. Satellite channels and cable television(CATV) networks that are already growing at a fast rate areexpected to expand further. The global advances in thestate-of-the-art digital video and audio compression tech-nology are expected to spur the growth. Liberalization hasresulted in the expansion and improvement in telecommu-nication infrastructure in the country, paving way for thenetworking of more homes. This will aid in the introduc-tion of near video on demand and interactive audio andvideo services. The above will require increased programproduction and distribution facilities.
The term direct-to-home (DTH), commonly used for satelliteTV signals, in digital mode in Ku band, helps reception, withless than a meter-diameter dish antenna that can be easily in-stalled in individual homes.
Background
On the national front, widespread access to and impact ofsatellite broadcasting signals on individual homes—by DTHor by cable TV distribution—raises a number of regulatoryissues. The inadequacies of the antiquated Indian TelegraphAct of 1885, the Cable TV Act, and the lack of any act to dealwith broadcasting immediately came into focus in dealingwith issues emerging from hardware and software aspects ofsatellite broadcasting. Regulatory policies governing uplink-ing facilities for private entities would need liberalization.Indian private entities’ commercial entry into the business ofsatellite broadcasting and owning or operating satellite net-works may also be facilitated. The whole gamut presents awide spectrum of challenges and opportunities to the na-tional policy makers.
If DTH is the new buzzword in the satellite broadcast in-dustry, it is not without reason. DTH transmission elimi-nates the cablewallah altogether. Moreover, since the signalon DTH is encoded, subscribers can choose their pay chan-nels. At present, if a cable operator is supplying an en-crypted channel’s signal, the signals reach every householdin the area. Under DTH, however, the supplier can individ-ually control the programming in the household. DTHopens up immense possibilities for the channels. It is theonly way to circumvent cable operators.
DTH Operation
The DTH technology hooks every home TV to a satellitethrough a 47- to 60-cm receiver dish antenna and TV set-topbox and integrated receiver/decoder (IRD). Together the re-ceiver dish and the IRD constitute a receiver console by whichthe television owner-subscriber receives programs that thesatellite-TV-service provider beams. The IRD gives condi-tional access to only those subscribers who are authorized bythe DTH company upon payment of a monthly subscriptionfee, which may be higher than the average monthly subscrip-tion fee for cable and satellite channels.
DTH—in sharp contrast to cable TV—lends itself to easymonitoring and control. A regulatory authority can prescribewhich channels are open for transmission and which are notout of the foreign programming content. The other advantageof DTH technology is the large number of channels it offers.Because the platforms use digital compression technology,they can accommodate six to eight channels on eachtransponder as compared to one in the analog format. As a re-sult, a single DTH platform can offer thirty to sixty chan-nels—all with premium programming and laser-disk quality,including a host of niche channels.
Market Potential
Market ProjectionsThere is a window of opportunity for the next five to sevenyears for all players to make direct broadcast satellite (DBS) amainstream communications tool. That is at least how long itwill take cable operators to upgrade their plants to delivertrue high-capacity digital broadband services. At least 30 –40percent of all cable subscribers—more than 20 millionhouseholds—will still have 1970s-style cable services.
It is emphasized that DBS has a broader mission than just con-sumer television. It is more than just a satellite service. It is anenabling technology, a tool that when combined with the ex-isting terrestrial narrowband network will provide all the in-teractivity that customers will need in the foreseeable future.
According to the Carmel Group, a media research firm hasprojected DBS/DTH growth in a moderate scenario—for ESSmedium-power Ku-band (the domain of PrimeStar andAlpha Star) and BSS high-power (including DirecTV, USSBand Echo Star)—from 5.7 million homes and businesses at theend of 1996 to 15.9 million at the end of the year 2000.Carmel’s upbeat hot scenario for year-end 2000 is 18.4 mil-
Direct to Home: Growth and OpportunitiesT.R. DuaPresident—Marketing and SalesShyam Telecom LTD

854 ■ 19 9 8 A N N U A L R E V I E W O F C O M M U N I C A T I O N S
W I R E L E S S
lion in contrast to Kagan’s upbeat aggressive projection of14.8 million.
On the other hand, the moderate projections of Paul KaganAssociates for DBS and DTH (not including the FSS C-banduniverse) are 5.3 million subscribers through 19percent and11.5 million through the year 2000. Kagan’s past forecasts forDBS and DTH have been too modest and it is said that theformer aggressive estimate is now a conservative estimate.
India
Much extensive market research has been conducted thatsuggests that there is a huge market for DTH technology inIndia. The recent market research conducted shows that ofthe 50 million households in India only 12 to 15 million aresatellite and cable homes. Hence, there are at least 35 millionhouseholds, largely in the rural areas, that receive just DD.There is no cable penetration in this huge market. Thereforerural India will be the key market for DTH.
India’s broadcasting network is one of the largest in theworld, with over 185 radio broadcasting centers, 700 TVtransmitters, and 17 satellite channels. While the TV networkhas access to 50 million homes and 250 million prime viewers,the radio broadcasting provides coverage to approximately97percent of the population of over 900 million. The cable TVdistribution network is estimated to provide service to 18 mil-lion homes with penetration varying from 30 percent in met-ropolitan areas, 15 percent in satellite towns, 12 percent indistrict towns, 6 percent in urban villages, and 2 percent inrural villages.
At present, even with 750 terrestrial TV transmitters and asmany as 17 satellite channels operated by Doordarshan, thereare only 50 million TV homes, out of which only a third—16million—are cable connected. Vast unsatisfied potential of TVviewership still exists. Growth of Indian economy with higherdisposable incomes and change in lifestyles and leisure pur-suits offer more scope for multi-choice DTD viewing.
There are several joint-venture proposals pending with thegovernment like from Sinawatra, Measat, and other SouthAsian companies. Star TV has asked the national network tojoin it on its DTH platform on Panamsat 4. The Murdoch-runcompany has already tied up the requisite transponders withPanamsat. While the country has yet to witness DTH, therehas been much talk and activity in this region of electronicmedia. Currently, apart from DD, Star TV, Zee TV, and theModi group have shown keen interest. Of these, only Star TVappears to have finalized things and has signed Sun TV fromIndia onto the platform.
Asia Pacific
A study on the Asia Pacific region conducted by the U.K.-based Cultures Group shows that there will be a demandfor 200,000 decoders in the region by 1998. Of these, 40 per-cent will be from India since the metropolitan markets aresaturated. There is definitely a market in the rural areas andsmall towns.
The population base of Asia Pacific is 3 billion, out of whichIndia will have more than one billion by the year 2000. TheAsia Pacific region is expected to record the highest demandfor fifty-four satellites by year 2000, up from the existingnumber of twenty-six. There are seventy-eight transpondersoperational on INSAT series of satellites and another twenty-four will be commissioned soon. By the year 2020, it is ex-pected that 3000 transponders (including foreign satellites)will be available. Programming is expected to rise to 5000hours per week from the present level of 500 hours per week.Anticipating such spurt of activity, Asia Broadcast Centre inSingapore has recently commissioned state of the art TV pro-duction studios, eight digital on-line suites and satellite up-link facilities. TV advertisement revenues are expected to risefrom 800 crores to 15000 crores.
United States
Comparable DBS figures for the United States suggest some4.4 million subscribers eighteen months after the rollout oftrue DBS. Although Europe’s broadcasters are just beginningto launch digital DBS services via Eutelsat or Astral, the firstdigital satellite in the North American market was launchedby DirecTV in June of 1994. United States SatelliteBroadcasting (USSB) shares the same satellite but offers a dif-ferent programming package and subscribers are able to pur-chase the same 18-inch dish for both services. USSB’s successrelies heavily on its ability to give consumers the choice ofmixing and matching low cost USSB channels with other low-cost tiers available on DirecTV.
By comparison, the U.S. multichannel universe totaled 69 mil-lion homes at midyear. Of those, 63.7 million came from cabledistribution, according to the Nielsen Media Research, and5.3 million from the burgeoning U.S. direct-to-home market,according to the Satellite Broadcasting and CommunicationsAssociation (SBCA).
United States cable penetration, which is the primary multi-channel driver in the country, grew at the rate of just one per-cent in the first half of this year, compared to Europeanmultichannel’s overall five percent growth. However, multi-channel penetration in the United States, which has 97 millionTV households, is still far higher than Europe’s at 70 percent,and U.S. DTH sales are building steam.
Satellite TV networks such as Star TV earn 20 percent incomeby subscription and 80 percent revenue from advertisements.A famous rating agency in the United States estimated thatout of total advertisement spending of $60 billion on allmedia, $20 billion comes from advertisements, and pay TVtakes a 12 percent share of the total.
Latin America
With nearly 77 million television homes surviving on a steadydiet of off-air television and with only a few pockets tuning inthrough cable technology, Latin America could produce morethan 10 million direct-to-home customers. With the hardwareaveraging US$500 per subscriber and subscription rates ataround $20 to $30 a month, the market for Latin America
19 9 8 A N N U A L R E V I E W O F C O M M U N I C A T I O N S ■ 855
T . R . D U A
DTH could be worth US$5 billion in hardware sales andaround US$ 3 billion annually in program subscriptions.Over the next few years at least six more satellites will belaunched that will be used to provide DTH entertainmenttelevision to Latin American viewers with small dishes.
For the high power Ku-band DTH providers, Latin Americamarks the satellite industry’s next biggest market place. Themarket is nevertheless very attractive. Cable is not a signifi-cant competitor except in Argentina where it serves 50 per-cent of TV households. Over all, Latin America represents afertile market for DTH. With 47 million TV households inBrazil and Venezuela alone, garnering just ten percent of thenoncabled market of these two countries would net about 4million subscribers. That itself is enough to make LatinAmerican DTH service profitable.
Europe
Powered by penetration growth in key markets such asBritain and Germany, Europe is about to surpass the UnitedStates as the world’s largest multichannel marketplace.Europe had 68.5 million multichannel homes at midyear, ac-cording to figures released late last month by SocieteEuropeenne des Satellites (SES). Of those, 43.5 million camefrom cable and 25 million came from direct-to-home distribu-tion. That figure represents a 5 percent increase from the 65.5million European multichannel homes reported by SES at theend of 1995. Because of Europe’s faster multichannel growthrate, it is expected to surpass the United States as the world’slargest multichannel market when 1996 figures are compiled.Europe still has only 42 percent multichannel penetration ofits 162 million TV households. The figures put out by SES,which runs the European Astra satellite system, show thatone of Astra’s most significant boosts in Europe came fromBritish DTH growth. One of the SES reports stated that “TheUnited Kingdom is one of the most successful DTH marketsin Europe,” and also that Britain’s satellite market is secondonly to Germany’s. It attributed the British growth to a “pow-erful line-up” of channels. Other places where multichannelgrowth is accelerating in Europe include Scandinavia, Centraland Eastern Europe, France, Italy, and Spain.
While growth is picking up in Britain, the United Kingdomstill ranks behind the Netherlands in terms of total multichan-nel homes, but Holland’s penetration is saturated, so its sub-scriber growth is slower. Britain’s cable industry is just hittingits stride, by most accounts. However, Germany still ranks farahead of all other European countries as the largest multi-channel market, with a total of 27 million cable and satellitehomes, or nearly 40 percent of all European multichannelhomes. Of those, 17 million come from cable and 10 millionfrom DTH.
Considering the estimated 20.5 million DBS receivers inEurope, one can easily forget that before the late 1980s therewas no true European DBS market. Indeed, many years haveelapsed since the 1977 World Administrative RadioConference (WARC ‘77) allocated member countries five fre-quencies for broadcasting DTH television using high-pow-ered satellites before DBS became visible in Europe.
Impediments
As far as viewers’ expectations are concerned, several arecommon:
• ample choice of programs• studio quality picture and sound• more regional language programs
All of the above expectations can be reasonably met by digi-tal compression and DTH reception on a small 60 cm (18”)dish, which can be conveniently installed in the home.
These DTH services, however, are an expensive propositionfor platform owners as well as subscribers. Industry expertssay that setting up a DTH platform requires an investment ofat least $200 million, which includes the cost of leasing atransponder, uplinking and hardware costs. The cost ofmerely leasing the Panamsat transponder package, for in-stance, is around $21 million. That is not all, though: sub-scribers have to fork out at least Rs.40,000 to install DTHequipment, which includes a small dish antenna and an IRDunit. Then they have to pay a monthly subscription fee ofRs.150-300 per channel.
Price is not the only deterrent. The availability of equip-ment is another bottleneck. At present, nobody in Indiamanufactures Ku-band dishes or digital IRD units. Even theleading manufacturers of satellite dishes have no plans tomanufacture Ku-band dishes at the current time. There isno way to tell which manufacturer will get into the busi-ness, since both the size of the market and the quality ofsoftware are still unknown.
A study conducted by a Hong Kong-based company, AIMAsia, along with Delhi-based merchant bankers First CapitalIndia points to yet another problem with which DTH opera-tors will have to contend. The heavy rains during the mon-soon, it says, often cause “rain fade” and a disruption insatellite signals. Apparently, none of the Ku-band transpon-ders currently available in India has the capacity to preventrain fade. Rain attenuation, though, can be taken care of byleaving a wider signal margin. PAS-4 had no problems dur-ing the last tests carried out on Ku-band signals.
It is essential to have open industry standards in DBS ratherthan adopting proprietary technologies like the one adoptedby PrimeStar, DirecTV/USSB. Otherwise, there will be an-other beta versus VHS problem. If an open architecture exists,the DBS industry will not have the same technical baggagethat has burdened cable TV in its attempts to catch up in thenew digital world.
Ultimately, DTH technology will turn out to be commer-cially viable in the long run since the rate at which hard-ware costs in the satellite industry have been falling willprove the point that it is premature to talk about economicviability as hardware prices are constantly changing. In ad-dition, IRD costs in the U.S. market have already crashedfrom over $600 to $200.

856 ■ 19 9 8 A N N U A L R E V I E W O F C O M M U N I C A T I O N S
W I R E L E S S
Regulatory Aspects
DTH, along with other broadcasting forms, will attract regula-tory concerns on national as well as international levels.Internationally the two specialized agencies of the UnitedNations, the UNESCO and the International TelecommunicationUnion (ITU), are directly involved in these aspects.
ITUs Radio Regulation
The ITU recognizes the sovereign right of the member statesto conduct their telecommunications in any manner theydeem fit. However, recognizing the need to universally sharethe two natural resources—the radio frequency spectrum(RFS) and the geostationary satellite orbit (GSO)—the mem-ber states have voluntarily agreed, in ratifying the radio regu-lations, to restrict their absolute sovereign right.
The regulations regarding DTH are as follows:
• specifying frequency bands for different radio services andtheir operating and technical parameters
• ensuring harmonious, coordinated, and interference freeoperation of radio services
• providing equitable access by the member states to thenatural resources, RFS and GSO, which sustain all radioservices
• promoting economic, efficient, and standardized use ofradio spectrum
Provision in radio regulation for fixed satellite services (FSS)and broadcasting satellite service (BSS) are particularly rele-vant in the context of DTH TV systems. In the internationalradio regulatory framework, the term DTH or DTH service isnot recognized. Only FSS and BSS are commonly recognized.Fixed satellite service is essentially a radio service betweenpoint to point radio communication service via satellite. Itwas not intended to convey broadcast signals to the generalpublic. However, technological developments led to the useof C-band FSS signals for satellite TV reception by the generalpublic in recent years. This has obliterated the distinction be-tween FSS and BSS signals. This is posing a major challengeto the ITU in revising the radio regulations to take into ac-count the reality of merging FSS and BSS.
Articles 11 and 13 of Radio Regulations specify regulatoryprocedures for access to orbit and frequency spectrum forESS. The spectrum for FSS’ various frequency ranges such asC band, Ku band and Ka band is specified. In general, theprocedures give access on first-come, first-served basis. Toovercome this bias, in favor of late entrants and developingcountries, certain frequency ranges (in 8/4 and 11/14 Ghz)are covered by allotment plans adopted at WARC-1988. Theallotment plan provides for each country’s national coverageonly coordinated GSO position, along with 800 MHz spec-trum. The Ku-band spectrum for FSS is also relevant to DTHservice exploitation. Radio Regulations also specify detailedtechnical criteria such as limits of signal level at ground to
protect terrestrial radio services, using the same frequencybands with the FSS.
Any satellite service or network using FSS will have to coor-dinate with other countries, as per Articles 11 and 13 for useof orbit and spectrum. Hence, a satellite platform for DTH inFSS bands will require extensive international coordinationfor its technical parameters to ensure protection to other satel-lite and terrestrial networks. This is also necessary to receiveprotection from other networks.
In the broadcasting satellite services, higher signal levels onthe ground are provided for to facilitate better reception bysimpler installations, as compared to FSS. ITU has launched aplan for BSS using Ku-band for Region 1 (Europe/Africa) andRegion 3 (Asia, Australia, etc.). Major characteristics are
• Downlink Frequency Range 11.7 – 12.2 Ghz• Uplink Frequency Range 17.3 – 118.1 Ghz
14.5 – 114.8 Ghz
Developed for analog TV, orbital spacing of six de-grees.. Five channels assigned to each service area, 16channels, C/l protection ratio 31 dB. o±r.p63 -65 Db~iPId~ -103 dB/w/rn2 Channel bandwidth 27 Mhz.
A similar plan for the United StatesAmerica was adopted in1983.
These BSS plans provide assured, coordinated orbit posi-tions and frequency channels to all countries for nationalcoverage, based on projected requirements. India was ableto secure assignments for forty-eight satellite TV beams inthe BSS-77 plan, which is likely to be revised because of sig-nificant changes in technology. Extensive revision of BSS-77plan will be contemplated in forthcoming conferences ofthe ITU.
The European region exploited the BSS-77 plan very early on.In Asia, exploitation is yet to start effectively. Barring an ex-perimental Japanese system, there is no regular service. Forthe deployment of DTH service in this region, though, theBSS-77 plan appears to be most suitable.
Besides specifying limits of signal level on ground for FSSand BSS to protect terrestrial systems, the Radio RegulationNumber 2674 provides an additional stipulation for BSSspace station of the need to reduce, to the maximum extentpracticable, the radiation over the territory of other coun-tries unless an agreement has been previously reached withsuch countries. This illumination of other countries’ terri-tory by BSS signals is not permissible without prior agree-ment. This is, however, possible in FSS, as is presentlybeing done in C-band by Asia Sat, etc., by adherence tospecified technical parameters such as signal level limitsand coordination as per Article 11 and 13 procedures. TheFSS Allotment Plan and BSS assignment plan provide fordeployment of national/domestic service provision to de-velop subregional or regional satellite communication andbroadcasting networks.

19 9 8 A N N U A L R E V I E W O F C O M M U N I C A T I O N S ■ 857
T . R . D U A
UN/UNESCO Guidelines
The United Nations in its Resolution 2916, dated November9, 1972, stressed the need to elaborate principles governingthe use by states of artificial earth satellites for internationaldirect TV broadcasting. The outer space is governed by inter-national law. The development of satellite broadcasting istherefore to be guided by the principles and rules of interna-tional law, in particular the charters of the United Nationsand the Outer Space Treaty. Recognition of sovereignty andequality of all states is the most important element of any in-ternational regulation.
The UNESCO Declaration of November 15, 1972, proclaims aset of guiding principles on the use of satellite broadcastingfor free flow of information, the spread of education, andgreater cultural exchange. This declaration recognizes theneed to reach or promote prior agreements concerning directsatellite broadcasting to the population of countries otherthan the country of origin of the transmission. It also specifiesthat transmission of commercial advertisements will be sub-ject to specific agreement between the originating and receiv-ing countries. Programs for direct broadcasting to othercountries shall be prepared, taking into account differences inthe national laws of the countries of reception.
The UN General Assembly ruled on the following:
• international responsibility for TV broadcasting by satellite,carried out by various states or under their jurisdiction
• cooperation for protection of copyright and neighboringrights with special consideration to the interests of devel-oping countries, in the use of direct TV broadcasting for ac-celerating national development
• notification of the UN regarding activities in satellite broad-casting
A state intending to establish international (satellite) direct TVbroadcasting should also notify the proposed receiving state(s)of such intention and enter into agreement with the receivingstate(s).
Such a TV service should also be in conformity with the rele-vant instruments of the ITU, which will be exclusively applic-able to the unavoidable overspill (outside the nationalboundary) of the radiation of the satellite signal.
Challenges and Opportunities
The greatest challenge that DTH operators face today is howcollection fees from individual beneficiaries. In the UnitedStates, users receive encrypted cards when they pay their bills.The encryption is changed periodically to prevent defaultersfrom receiving the DTH service. Private parties can succeed inproviding DTH service only if they have the facility of an in-teractive return path to individual subscribers to enable themto meet the video-on-demand request. One practical way ofdealing with this problem is either, as has been done in tele-com services, to franchise private operators by auctioning
DTH services to specific areas, locations, and regions or basedon spectrum and bandwidth allocation. Legal issues— to dis-tribute services such as the applicability of consumer act toDTH beneficiaries, broad control of the program content toprevent misuse of DTH for broadcasting sensitive or porno-graphic material, and methods—of preventing DTH access toillegal as well as defaulting users need to be addressed.
The high cost of DTH, which is about a $200 down paymentand a monthly service charge of about $40, would be an in-hibiting factor for the rapid development of DTH in Indiaand, hence, is not likely to impact cable operators in the nearfuture. Consequently, a large percentage of TV homes inurban India will continue to favor cable operators, and practi-cally all of the TV receivers in rural India will depend mostlyon terrestrial transmissions for a considerable period of time.However, as the volume increases resulting in a substantialreduction in the fees, cable operators will face a serious chal-lenge from both DBS and DTH TV in the years to come. Indiais likely to see the emergence of large cable operators acrossthe country who could transform themselves into DTH TV ser-vice providers. The telephone companies are also likely to com-pete in providing DTH TV services. It is obvious that thegovernment policies, modality of revenue collection, and legalissues need to be tackled quickly to meet the challenges posedby the emerging DTH scenario.
Conclusions
With a large number of foreign operators such as Asiasat,Panamsat, Jintelsat, DirecTV, and Measat planning to provideDTH services over India, the government needs to explicate aclear cut, unambiguous policy. Government monopoly onDTH, which is possible if interactive return connection to pri-vate service providers is not permitted and the collecting offees is banned, is not advisable. While most agree that privateoperators should be allowed to uplink, the question iswhether uplinking should be restricted to only Indian satel-lites or whether they should have the freedom to use foreignsatellites, where they will have no control.
The government is working out on the legislation to allow is-suance of licenses and/permission to prospective DTH televi-sion broadcasters. The government is planning to imposelicense fees over a certain period of time. A strategy paper incirculation says that DTH or the DBS service in the countrymay be operated only by the corporate bodies incorporated inIndia. The strategy paper also states that the foreign invest-ment (with restriction up to 25 percent) may be allowed in theDTH corporates in India. It is understood from the guidelinesthat the strategy paper being prepared has many conditionslike foreign-equity participation, cap on foreign investmentcap, advertisement content in channels, and so on.
As per the recommendations of the Kagan InternationalConference organized on the future of cable, there is a placefor only two DTH players in India, the first entrant being aclear winner. This is indeed a fact and should be noted by allthe entrepreneurs wanting to enter this area. Even though anumber of players are scrambling for a piece of the pie, who-ever gets to the post first is the only one who will succeed.

858 ■ 19 9 8 A N N U A L R E V I E W O F C O M M U N I C A T I O N S
W I R E L E S S
The emergence of any new technology is invariably accompa-nied by debate and skepticism, and DTH is no exception.Eventually the success of any DTH platform depends on itspackaging. The success lies in the channel mix on how well themarket is managed—whether the box is purchased, subsi-dized, or leased to the consumer. One thing is certain: DTHwill be here soon. As one industry expert has said: “You can-not wish away DTH. It is the medium of the 21st century.” TheDTH technology will be successful in India certainly, but it isstill important to come up with the right marketing strategy.
Finally, the phenomenal progress made in satellite technol-ogy, optical fibers, development of digital compression tech-
niques, and multiple access protocols combined with theavailability of powerful computers has resulted in the cre-ation of the information superhighway. Comparative advan-tage has shifted to those nations that can instantaneouslyaccess the vast and powerful worldwide database and utilizeit for national development. High-power satellites of todayhave the capability to beam a few hundred channels from asingle location to just 45 cm dish antennas to provide DBSservices. Introduction of interactive capability is the next log-ical step for promoting video-on-demand DTH service,which has the added advantage of providing other value-added services through Internet connection.

19 9 8 A N N U A L R E V I E W O F C O M M U N I C A T I O N S ■ 859
This paper presents the results of a voice clarity survey con-ducted on eight different wireless and wireline platforms inseven different markets. Nothing matches wireline, but puredigital systems are getting close. The sound of digital overlayon existing analog systems appears to be of lower quality,particularly in dense urban markets. Among pure digital sys-tems, call division multiple access (CDMA) consistently out-ranks Global System for Mobile Communications (GSM),time division multiple access (TDMA), and iDEN. On aver-age, digital beats analog.
The researchers believe that voice clarity—one of the “FourCs” of wireless—will help differentiate the multiple com-petitive networks developing in markets across the coun-try by the end of 1998. Wireless pricing approachingwireline levels should boost usage from today’s approxi-mately 150 minutes per month (5-7 minutes per day) to300-700 minutes per month (15-40 minutes per day). Atthese levels, we believe consumers will demand near-land-line quality.
Differences in voice clarity may show up in relative market-ing expense, customer service costs, or higher network capi-tal spending. We believe some of the new pure digitalplatforms may approach wireline in overall voice clarity.Early digital systems overlaid on existing analog systems ap-pear to be of lesser quality. AT&T appears to be tweaking itsoverlay TDMA signal on the uplink portion of the call to im-prove quality. Overlay CDMA providers are improving theirvoice quality as they move to 13-kilobit vocoders.
Multiple live systems were tested across seven markets. Thesurvey was sent to over 1,000 participants, and over 200 re-sponses were compiled. This paper includes not only thesurvey results, but also an opportunity for the reader toretest the systems.
After talking on digital systems for over two months, the re-searchers turned reluctantly back to their own analog hand-sets. Even though some of the digital systems “soundeddigital”—and many of the new ones do not—they regrettedbeing greeted again by the “snap-crackle-pop” of good oldanalog cellular.
The ‘Four Cs” Of Broadband Wireless
The researchers identified four features of broadband wire-less service that they believe will drive investor interest:
1. Clarity. The focus of this report is the voice clarity of broad-band wireless service providers in the 800 and 1900 mega-hertz frequency bands. Based on the analysis, voice claritydoes vary quite substantially, and generalizations can bemade about the relative quality of the major digital plat-forms (see Table 1). The results of this voice clarity surveyare reviewed later in this paper.
2. Cost. The authors believe that innovative pricing plans,such as Microcell’s $40, 400-minute plan, will be used byPCS providers to offset coverage limitations. Under thiskind of plan, the customer perceives a deal for $0.10 perminute, although breakage will likely yield much morerevenue to the carrier. Most of the existing PCS pricingmodels and the incumbent cellular providers’ responseshave been analyzed resulting in the development of anoptimal pricing plan that should provide a bridge be-tween mobility wireless and virtual wireless local loop(see Figure 1). The bottom line is that as price-per-minutedrops and wireless service becomes more ubiquitous,
We Can Hear the Future:Clear Sounding Digital PCS CouldBecome the Next CLECMichael Elling and Michael TuritsEquity AnalystsPrudential Securities Equity Research
T A B L E 1Average Score of All Calls Made on Each System

860 ■ 19 9 8 A N N U A L R E V I E W O F C O M M U N I C A T I O N S
W I R E L E S S
users are more likely to differentiate offerings on thebasis of factors such as voice clarity. Variations in voiceclarity are shown in Figure 2.
3. Coverage. Buildout limitations are likely to be only a short-term issue for A and B block personal communications ser-vice (PCS) providers since they are required to build out 33percent of their population within five years and 66 percent oftheir population within ten years of license grant. Coveragewill remain a concern, however, in terms of strategic differ-ences in the total footprints held by regional and national car-riers. Table 2 summarizes how the recently concluded D/E/Fblock auctions have changed the PCS and cellular landscape.The trend is clearly toward national, or supra-regional, net-
works. Various bidding strategies emerged: footprint expan-sion, increasing spectrum depth, and acquisition of licenses innoncontiguous markets for partnering or trading purposes.Prices ranged from as low as a few cents per point of presence(POP) to over $50.00 per POP. The authors believe that thesevariances—combined with network issues such as the avail-ability of dual-mode, dual-band handsets—will likely lead to awide array of pricing schemes.
4. Capacity. Capacity issues are somewhat more nebulous,since the real-world capacity of certain systems is still un-known (see Table 3). The capacity of existing cellular duop-olies relative to the new PCS systems, however, might beenvisioned this way:
F I G U R E 1PoWeR Pricing Plan
F I G U R E 2Based on Our Analysis, Voice Clarity Does Vary Quite Substantially
T A B L E 2The D/E/F Auctions have Created More SeamlessNational Networks

19 9 8 A N N U A L R E V I E W O F C O M M U N I C A T I O N S ■ 861
M I C H A E L E L L I N G A N D M I C H A E L T U R I T S
• Two tiny analog-minute sweatshops in each market face theprospect of three to five turnkey, high-capacity digital-minute factories going up next door. Each is complete withwalls, roofs, and fixtures.
• Initially, these new digital factories will have only two orthree out of eleven production lines in operation. Thesweatshop companies may have the advantage right nowin terms of customer relationships, but in the end, the newdigital factories will produce a lot of minutes.
The question is, how long will these factories run at just 3–15percent of theoretical capacity? If we look to the historical ex-ample of the paging industry, the answer is, “not long.”Investors should recall that the paging industry started with40–80 first-generation digital POCSAG “cheap-beep” sweat-
shops before being supplanted by eight high-capacity second-generation digital FLEX providers—which will probably ulti-mately yield to three to five two-way inFLEX and reFLEXdigital messaging providers.
Voice Clarity Survey Overview and Results
As a number of digital PCS and cellular systems went com-mercial during November of 1996, the authors traveledacross the country sampling numerous markets and sys-tems (see Table 4). All told, they sampled 12 different sys-tems. Two wireline calls were included as control samples,using a pay phone as a proxy for a “mobile” landline call.Messages were recorded via each system onto an Octeldigital voice messaging system and pooled to create thethree surveys.
T A B L E 3Digitizing New and Existing Spectrum Should Lead to a 15-Fold Gain in Capacity Relative to Full U.S. Coverage
T A B L E 4Markets Visited

862 ■ 19 9 8 A N N U A L R E V I E W O F C O M M U N I C A T I O N S
W I R E L E S S
It is true that digital voice messaging systems tend to distortother digitally originated calls. However, the researchers be-lieve that all the calls recorded on the system are subject toequivalent distortion, although this effect may highlight theweaknesses of the various systems. While they originally at-tempted to play back a single message, variances in tapespeed and battery performance, as well as other audible dif-ferences, required them to record their messages live. Thesemessages were delivered as consistently as possible with thesame content each time.
Clarity May Be AsymmetricThe survey attempts to simulate real-life phone usage.However, since handset-originated calls were recorded on awireline system, only wireless-to-wireline (uplink) communi-cations are evaluated, not wireline-to-wireless (downlink).One thing that was observed in live tests of the system wasthat carriers can boost the signal once it gets into the wirelinesystem, but can do very little to improve voice clarity the otherway around. The net result is that wireless handset users’ ex-perience is the true measure of a system. Unfortunately, since itwas not feasible to fly 100 users around the country, it was notpossible to compare both sides of the call.
The Calls Came From Several MarketsIn total, the researchers tested in eight markets with fivedigital cellular and PCS systems. Of the 31 calls made, 2wireline calls served as proxies. Sixteen calls were station-ary, including 4 CDMA 1900, 6 GSM 1900, 1 iDEN 800, 1TDMA 800, 1 CDMA 800/13 kbps, 2 CDMA 800/8 kbps,and 1 AMPS 800. The only major system not tested wasTDMA 1900.
On Balance, Eight Stationary Calls Were Better…For the most part, the stationary calls rated higher than themobile calls (see Figure 3), with the exception of CDMA-800/8 kbps and CDMA-1900/13 kbps. The highest-ratedstationary call, as expected, was a wireline office phone(see Figure 4). Next came CDMA-1900, followed by TDMA-800. TDMA’s high score may be biased by the greaterdownlink than uplink clarity in the TDMA system tested.GSM and iDEN came in just below the middle of the pack.Analog scored poorly here, as did CDMA-800/8 kbps. Thelatter is surprising but supports both the researchers’ first-hand experience and their notion that digital systems ingeneral, and CDMA systems in particular, must be opti-mized and fine-tuned. The CDMA-800/8-kbps system thatscored relatively well was a first-generation overlay sys-tem installed in Las Vegas, and the researchers experi-enced dramatic improvement between September andNovember of last year. We can only expect the CDMA-800/13 kbps overlay system in San Diego that scored sopoorly will also improve.
A number of observations can be made when we compare thescore of the eight stationary calls with their respective rank-ings in the larger survey (see Figure 5). First, the large numberof samples that participants heard in the complete surveytended to “smooth” the results. Seven of the eight stationarycalls placed in the top 15 in the overall comparison (see Figure6). Analog, CDMA-1900, and TDMA-800 all saw their relativeleads decline, while GSM, CDMA-800/13 kbps, and iDENsaw the largest improvements. CDMA-800/8 kbps stayed atapproximately the same level. Overall, the complete surveysupports the results of the stationary survey.
F I G U R E 3Stationary/Mobile Comparison
F I G U R E 4Stationary Survey
F I G U R E 5Stationary Vs. Complete Scores

19 9 8 A N N U A L R E V I E W O F C O M M U N I C A T I O N S ■ 863
M I C H A E L E L L I N G A N D M I C H A E L T U R I T S
…Than Eight Mobile CallsAs a proxy for a wireline mobile call, the researchers used apay phone in an office building. Surprisingly, this call placedsecond to CDMA-1900 in the mobile call survey (see Figure 7). Itis possible that CDMA’s soft-handoff, rake-receiver, and high-bit-rate sampling gives it the current edge in sound clarity, par-ticularly in mobile situations. Another positive surprise in thissurvey was iDEN, which improved its standing over the sta-tionary test, coming in just behind TDMA. Again, TDMA’spositive ranking was surprising to both researchers and, prob-ably, most people who have had real-world experience withthe systems. The two lowest-ranking systems were the CDMAoverlay systems. It seems probable that all overlay systems arechallenged in mobile environments because of stray signalsfrom the analog system and the fact that the digital system hasbeen built around an optimized analog network.
The researchers were surprised by the comparisons betweenthe eight mobile calls and the complete survey. Most of thecalls scored substantially lower on a relative basis, except GSM-
1900 and CDMA-800/13 kbps (see Figure 8). Only three mobilecalls scored in the top 15 of the complete survey, includingCDMA-1900 (ranked number six), GSM-1900 (ranked 14, al-though this was not the GSM sample included in the eight-callgroup), and the wireline proxy (ranked 15). Instead, most ofthe mobile calls tended to place in the bottom 16 (see Figure 9).
These results are supported by a system-by-system compar-ison of all systems using the complete survey results. Again,stationary calls tended to outperform mobile calls (seeFigure 10). Two systems that bucked this trend and per-formed better in the mobile test were GSM-1900 andCDMA-800/13 kbps. It was found that the GSM systemstend to pick up a lot of background noise outdoors and mayalso perform badly in terms of in-building penetration.Placing the mobile call from a closed and protected car envi-ronment may therefore have benefited the GSM calls. Wecan only speculate that the CDMA-800/13 kbps system per-formed better in the mobile setting because of samplingcharacteristics particular to CDMA. The strongest overall
F I G U R E 6Complete Survey: Top 15 Calls
F I G U R E 7Mobile Call Survey
F I G U R E 8Mobile Vs. Complete Scores
F I G U R E 9Complete Survey: Bottom 16 Calls

864 ■ 19 9 8 A N N U A L R E V I E W O F C O M M U N I C A T I O N S
W I R E L E S S
performer, CDMA-1900, exhibited the least amount of vari-ance between stationary and mobile tests, but scored highestin the mobile environment relative to the degraded perfor-mance of the other systems.
The Complete Survey Supports the Primary ResultsSimilar ranking and dispersion were observed between thestationary and mobile calls in the full survey (see Figures 11and 12). Of the 17 stationary calls, CDMA won six of thetop nine leading slots. GSM-1900 won another two, but alsomade up six of nine worse-rated calls. Among 14 mobilecalls (see Figure 13), CDMA-1900 systems placed threetimes in the top eight, while GSM scored four times in thebottom six. We believe this poor performance is primarily afunction of the particular GSM system used as opposed tothe platform in general. The benefit of the eight-call surveysis that they utilize the best individual system we testedfrom each platform, netting out this type of idiosyncraticperformance. Still, some of GSM’s poor performance in mo-bile calls may stem from its relatively inferior backgroundnoise suppression.
Survey and System Discussion
As noted earlier, digital systems can clearly be tuned and op-timized. GSM is the longest-running first-generation digitalPCS technology, and it is seeing gradual improvement. NewGSM vocoders promise better overall clarity and throughput.With GSM vocoders, however, the handset must be replacedduring an upgrade. CDMA’s variable-rate vocoders allowcarriers to optimize system performance, clarity, and capacityin real time without changing handsets.
Again, the authors wish to stress that this survey only sam-pled the uplink direction of a wireless call, and that all callswere recorded on a digital voice-mail system, which gave theanalog and wireline platforms an advantage. It was foundthat downlink performance varied even more widely than theuplink calls in our survey. Handset voice clarity will becomemore important as digital system usage increases.
And The Winner Was—CDMA…The CDMA 1900 systems of PrimeCo in Tampa, Nextwave inSan Diego, and Centennial in Puerto Rico achieved high scoresin both stationary and mobile situations (see Figure 13). At thetime of the test, researchers were not able to obtain a handset touse on the Sprint (Fon–45 1/4, rated Buy by Guy Woodlief) sys-tem in San Diego, which uses cable backhaul for a portion ofthe system. On calls made from that system to the office PBX(including an hour-long mobile call), however, the system pro-vided the best clarity of any the researchers had heard.
With the exception of a stationary outdoor call in Las Vegas,both 8- and 13-kbps CDMA-800 tended to perform in the bottomhalf of both the stationary and mobile calls. We suspect theseCDMA overlay systems are subject to “cell-dragging,” wheredistant cells interfere with the guardband in the intended cell.
On balance, we found that CDMA 1900 offered near-land-line clarity, its only weakness being the user’s ability to dis-tinguish foreground and background voices in a small,enclosed environment.
F I G U R E 1 0Complete Survey: Comparison by System
F I G U R E 1 1Complete Survey: Stationary Calls
F I G U R E 1 2Complete Survey: Mobile Calls
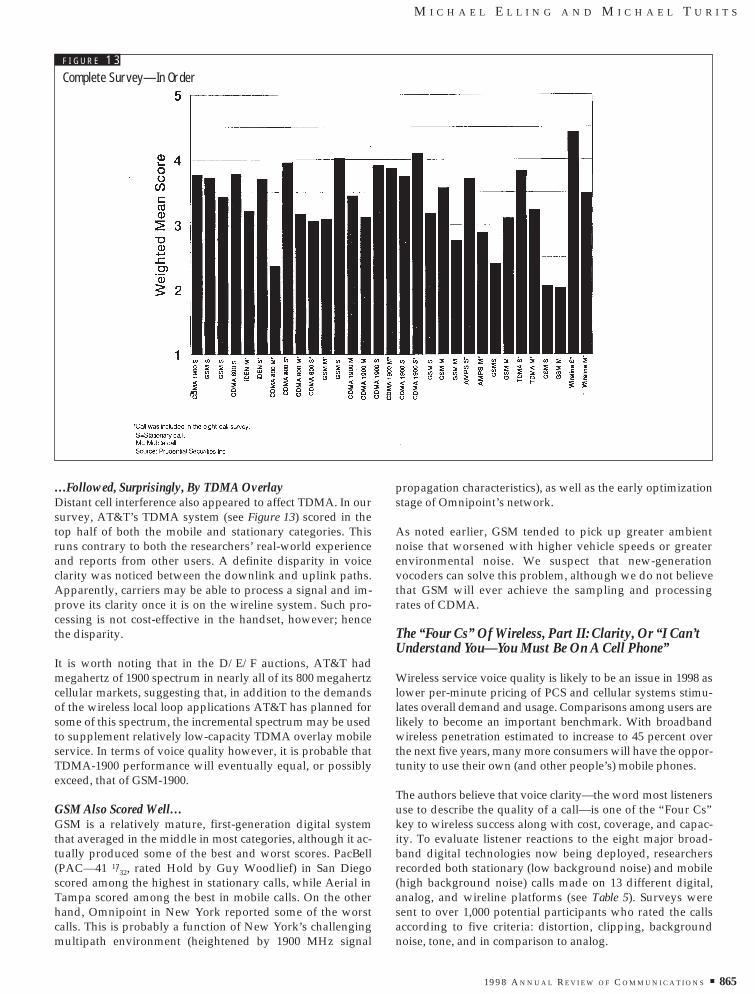
19 9 8 A N N U A L R E V I E W O F C O M M U N I C A T I O N S ■ 865
M I C H A E L E L L I N G A N D M I C H A E L T U R I T S
…Followed, Surprisingly, By TDMA OverlayDistant cell interference also appeared to affect TDMA. In oursurvey, AT&T’s TDMA system (see Figure 13) scored in thetop half of both the mobile and stationary categories. Thisruns contrary to both the researchers’ real-world experienceand reports from other users. A definite disparity in voiceclarity was noticed between the downlink and uplink paths.Apparently, carriers may be able to process a signal and im-prove its clarity once it is on the wireline system. Such pro-cessing is not cost-effective in the handset, however; hencethe disparity.
It is worth noting that in the D/E/F auctions, AT&T hadmegahertz of 1900 spectrum in nearly all of its 800 megahertzcellular markets, suggesting that, in addition to the demandsof the wireless local loop applications AT&T has planned forsome of this spectrum, the incremental spectrum may be usedto supplement relatively low-capacity TDMA overlay mobileservice. In terms of voice quality however, it is probable thatTDMA-1900 performance will eventually equal, or possiblyexceed, that of GSM-1900.
GSM Also Scored Well…GSM is a relatively mature, first-generation digital systemthat averaged in the middle in most categories, although it ac-tually produced some of the best and worst scores. PacBell(PAC—41 17/32, rated Hold by Guy Woodlief) in San Diegoscored among the highest in stationary calls, while Aerial inTampa scored among the best in mobile calls. On the otherhand, Omnipoint in New York reported some of the worstcalls. This is probably a function of New York’s challengingmultipath environment (heightened by 1900 MHz signal
propagation characteristics), as well as the early optimizationstage of Omnipoint’s network.
As noted earlier, GSM tended to pick up greater ambientnoise that worsened with higher vehicle speeds or greaterenvironmental noise. We suspect that new-generationvocoders can solve this problem, although we do not believethat GSM will ever achieve the sampling and processingrates of CDMA.
The “Four Cs” Of Wireless, Part II: Clarity, Or “I Can’tUnderstand You—You Must Be On A Cell Phone”
Wireless service voice quality is likely to be an issue in 1998 aslower per-minute pricing of PCS and cellular systems stimu-lates overall demand and usage. Comparisons among users arelikely to become an important benchmark. With broadbandwireless penetration estimated to increase to 45 percent overthe next five years, many more consumers will have the oppor-tunity to use their own (and other people’s) mobile phones.
The authors believe that voice clarity—the word most listenersuse to describe the quality of a call—is one of the “Four Cs”key to wireless success along with cost, coverage, and capac-ity. To evaluate listener reactions to the eight major broad-band digital technologies now being deployed, researchersrecorded both stationary (low background noise) and mobile(high background noise) calls made on 13 different digital,analog, and wireline platforms (see Table 5). Surveys weresent to over 1,000 potential participants who rated the callsaccording to five criteria: distortion, clipping, backgroundnoise, tone, and in comparison to analog.
F I G U R E 1 3Complete Survey—In Order

866 ■ 19 9 8 A N N U A L R E V I E W O F C O M M U N I C A T I O N S
W I R E L E S S
Wireline calls, as expected, rated among the highest. Mobilecalls fell short of stationary calls, with one exception—CDMA1900. Upbanded CDMA consistently received among thehighest scores for both stationary and mobile calls. CDMAshone in particular on the mobile calls, where mobility andbackground noise put the greatest demands on voice quality.
Digital overlay on analog systems appears to be somewhatproblematic. It remains to be seen whether or not these tech-nical issues can be “engineered” away by incumbent analogcellular carriers. Pure digital PCS providers may have the ad-vantage over cellular carriers in terms of migrating customersto digital from existing analog channels, particularly in high-density urban markets.
…As Did iDENiDEN is a leading-edge digital platform based on time-divi-sion technology such as TDMA and GSM. Where GSM uses200 kilohertz-wide channels and TDMA uses 30 kilohertz-wide channels, iDEN uses 25 kilohertz-wide channels.Importantly, iDEN requires no guardbands, which improvesoverall capacity and allows for a highly efficient vocodersampling algorithm. IDEN, like the commercial “tool” that itis, performed consistently in the middle of the pack on bothsurveys and compared well with analog calls. For this project,the Nextel (NXTL—13 3/8, rated Buy) system in Las Vegas was
tested and found to be consistent with the same system inBoston. Overall, it appears that iDEN has a competitive prod-uct offering. It was not possible to sample the dispatch callclarity in this survey, but it was found to be fairly consistentwith interconnect.
Overlays In General Scored PoorlyIt seems probable that densely packed urban analogproviders will have a hard time keeping up with their digitalcompetitors in voice clarity comparisons going forward.Airtouch’s Los Angeles system was not sampled during thissurvey, but on other occasions it has been found to be inferiorto CDMA overlay systems in less-crowded San Diego andLas Vegas. It remains to be seen how wellBellAtlantic/NYNEX Mobile performs in New York with itsCDMA system. The same issues appear to affect TDMA sys-tems in large metropolitan areas, and, as indicated earlier, itappears that AT&T bought 10 megahertz of new spectrum toaddress this issue. The authors suspect that if GSM had everbeen used as an overlay application, it would have negativelycolored public perception of the technology, just as CDMAoverlay problems colored public perception even of up-banded 1900 MHz CDMA. It is possible that incumbent ana-log providers never wanted to publicize this issue.
These Are Not Lab ResultsSeveral engineers queried by the researchers criticized themethodology of this study. The authors, though, view this as avirtue, particularly given the real-world characteristics of thesurvey. After all, the broadband PCS/cellular wars will befought over real subscribers with real preferences using sys-tems in the real world.
More so than in any other competitive telecommunicationsmodel, the users of wireless services will be confronted withmyriad choices. Therefore, it is probable that carriers willfocus on inherent advantages; e.g., pricing (cost), voice qual-ity (clarity), footprint (coverage), and network technologyand deployment (capacity). As a result, some or all of the“Four Cs” will most likely emerge as the wireless investmentthemes of the near future.
T A B L E 5We Visited Seven Digital Markets

© G T E L A B O R A T O R I E S I N C . , R E P R I N T E D W I T H P E R M I S S I O N ■ 867
Abstract
Wireless local loop (WLL) issues are discussed from a serviceprovider’s perspective. Technology options are consideredfor both voice and data applications in terms of the Erlang ef-ficiency per MHz of bandwidth in each cell site. The compar-isons are made in terms of narrowband second-generationsystems, wider band third-generation systems, and broad-band systems. Numerous issues need to be resolved in termsof defining customer requirements, matching technology tothe identified customer needs and, in the United States, avail-ability of dedicated spectrum.
Introduction
The rapid growth of the cellular telephone industry over thepast two decades, together with developments in digital tech-nology and resulting performance improvements and declin-ing equipment costs, has spurred interest in wider applicationsof wireless systems for the delivery of communications ser-vices. This has led quite naturally to consideration of wirelesstechnology as an alternative to the traditional wired lines con-necting homes and businesses to the public switched telephonenetwork (PSTN). This wireless access to basic telephone ser-vices is referred to as wireless local loop (WLL).
Wireless local loop can be approached from the perspectiveof the subscriber or the service provider. When the sub-scriber picks up the handset, expectations include dial-tone,quick call setup, and toll-quality voice. In addition to a qual-ity of service (QoS) comparable to wireline, where voicequality attains mean option scores (MOS) of at least 4.0 andblocking probability less than 2 percent, the subscribermight expect at least cordless mobility, custom local areasignaling services (CLASS) such as call waiting, call for-warding, conferencing, etc., and data service at a minimumrate of 28.8 kbps. The service provider offers WLL in caseswhere it is less expensive than wireline, where an access net-work can be built more rapidly than wireline (i.e., first tomarket), or where ready access to customers can be gained,thereby bypassing the local exchange. To minimize costswhile providing acceptable quality, the access network musthave minimum complexity, offer the customer expected ser-vices, permit simple access network monitoring, and allowrapid network buildout.
Prior to describing technologies appropriate for WLL, it isworth examining specific opportunities. The most immediateand obvious opportunity is in international markets wheredeveloping countries have limited or nonexistent wirelineservice. In this case, WLL can be deployed rapidly, providingcustomers with voice, data, and Internet access well beforecable can be laid. Successful WLL deployments have alreadybegun in many countries including England, Sri Lanka,Malaysia, Russia, China, and others. In the United States,WLL has been deployed in rural markets where cable lengthsand costs are excessive but in-franchise customers must beserviced. An example of a system in this category is basic ex-change telephone radio service (BETRS), developed in themid-1980s to provide wireless telephone service to sub-scribers in remote areas. BETRS operates under state-certifiedlicenses in 152/158 and 454/459 MHz bands as well as in 10channel blocks in the range from 816 to 865 MHz.
Other WLL opportunities in the United States are potentiallyattractive for service providers seeking revenues from near-out-of-franchise operations. In this case, WLL can be used tobypass the local exchanges. An example of this strategy hasbeen suggested by AT&T Wireless where WLL technology op-erating at personal communications services (PCS) band fre-quencies can be used to penetrate the local market. Since WLLservice in the United States is expected to be flat rate, as in thecase of wireline service, a detailed business case analysis is re-quired to determine if the service provider can gain more rev-enue by using the spectrum for cellular customers who pay byminutes of use. In the United Kingdom, the service providerIonica has begun deployment of WLL systems and has devel-oped a business plan based on capturing a significant portionof the revenue from the major incumbent service provider.1
The remainder of this paper will focus on WLL architecture,technology options, efficiencies of selected technologies, andspecific issues to be resolved prior to a large scale deploymentof WLL technology.
What Is Wireless Local Loop?
WLL is an alternative access mechanism to support existingwireline terminals and communications services, though sup-port of other types of terminals is usually not precluded bythis definition. The WLL replaces all or part of the connection
Service Provider’s Perspective onWireless Local LoopArthur A. Giordano Allen H. LevesqueDepartment Manager Senior Staff ScientistGTE Laboratories GTE Laboratories

868 ■ 19 9 8 A N N U A L R E V I E W O F C O M M U N I C A T I O N S
W I R E L E S S
between the public network and the customer premises, andthe costs of installation and maintenance of the local loop canbe significantly lower than costs typically incurred with con-ventional wired loops. The wireless system also lends itselfto rapid deployment, which can be a valuable feature insome applications.
There are two different types of WLL systems that addressdifferent markets. The first system, termed wireline replace-ment, applies where standard telephone equipment and ser-vices must be supported for users who have the expectationof service that will not differ from that ordinarily provided bytraditional wired access. The basic requirements for wirelinereplacement can be summarized as follows:
1. delivery of toll-quality speech with performance equivalentto wired access
2. support, as a minimum, for Group-3 facsimile and forvoiceband modem transmission at rates up to 28.8 kbps(support for higher data rates will be desirable)
3. optional support for integrated services digital network(ISDN) service
4. fixed radio access equipment at the customer premises
5. optional mobility for end-user terminals, e.g. using cord-less telephones
A second type of WLL system is applicable where the pri-mary requirement is reduced cost or greater speed and ease
of deployment and installation. Here, the requirements forequipment support or the customer's service expectation aredifferent from full wireline support; this type of system is re-ferred to as Wireless Wireline. The basic requirements for thistype of system can be summarized as follows:
1. support of "wireline-like" services
2. voice quality equivalent or similar to that experienced withcellular systems
3. fallback rate support for facsimile devices and voice-band modems
4. optional limited mobility support, e.g. "neighborhoodmobility"
All WLL systems, of either type, should support the basic ser-vices provided by the local central office (CO) switch con-nected to the WLL system.
The local loop is the term used to describe the connection be-tween a subscriber and the local exchange. Typically, the con-nection consists of a distribution network, which interfacesthe switch in the local exchange to a distribution point, andan access network, which connects the distribution point tothe subscribers. For a WLL system, the access network pro-vides a radio interface between a base station located at thedistribution point and the subscriber residence or businessbuilding. Figure 1 illustrates the difference between a wirelessand a wireline local loop. In the wireline case, the switch isconnected to the distribution point and the distribution point
F I G U R E 1What Is the Local Loop?
::
AccessNetwork
Microwave
Copper
Fiber
Wireless Local Loop
Wired Local Loop
DistributionNetwork
DistributionNetwork
AccessNetwork
PUBLIC
SWITCH
PUBLIC
SWITCH
RADIO
BASE
STATION
DISTRIBUTIONPOINT

19 9 8 A N N U A L R E V I E W O F C O M M U N I C A T I O N S ■ 869
A R T H U R A . G I O R D A N O A N D A L L E N H . L E V E S Q U E
is connected to the subscriber by copper pairs or fiber. For aWLL system the distribution network may be copper, fiber,microwave, etc., to a radio base station with an antennamounted on a tower or the top of a tall building. A radio linkthen is used to provide access to the subscriber. Dependingon the subscriber terminal selected, the end user can have astandard fixed or cordless wireline phone, a special terminalthat may or may not have dial tone, or even a cellular phone.
Figure 2 illustrates WLL installation options. In Figure 2a thedwelling has a roof- (or eaves-) mounted antenna with a wire-less interface to a base station in the building. Cordless orfixed terminals with an available dial tone are typical. Manyvendors also provide multiline capability for a mix of voiceand data users. An alternate configuration has been imple-mented in which the user terminal communicates directlywith the base station. This installation option can be problem-atic in that a customer might move the terminal and unknow-ingly degrade signal quality.
The technology solutions for WLL have typically evolvedfrom existing or planned cellular systems. A major differencebetween cellular and WLL is that cellular systems conform towell-established standards such as IS-95 code division multi-ple access (CDMA), IS-136 time division multiple access(TDMA), and Group Speciale Mobile (GSM), whereas WLLsystems can be standards-based or proprietary. Anothermajor difference is that WLL systems are not ordinarily de-signed to support unlimited mobility, but only local mobilityfor cordless terminals and therefore do not need roaming ca-pability. Therefore, infrastructure elements such as home and
visitor location registers (HLRs and VLRs) and IS-41 roamingprotocols are irrelevant. Other major differences between cel-lular and WLL are summarized in Table 1. Notice that in theUnited States, dedicated spectrum for WLL is unavailable,whereas international spectrum allocations are readily avail-able at 2–2.5 GHz or 3.4–3.5 GHz. For example, in the UnitedKingdom, Ionica operates in the 3.4–3.5 GHz band. Handoffbetween base stations, required for cellular, is not needed inWLL. The soft handoff advantage of CDMA, whereby the cellphone gains a combining advantage by communicating si-multaneously with two or more base stations, is normally notavailable, since a minimum complexity network is expectedto be implemented where the subscriber is connected to onlyone base station.
The WLL subscriber antenna need not be omnidirectional asin the cellular case. Typically, the antenna is elevated, is direc-tional with an associated gain, and has a line-of-sight (LOS)path to the base station. As a result, networks can be designedso as to reduce interference to levels much lower than thoseencountered with cellular, and to permit improved frequencyreuse and increased capacity.
Since the WLL propagation path is usually fixed, its path lossis closer to 20 dB/decade (LOS) rather than 40 dB/decade(cellular case). Fast Rayleigh fading is replaced with slowerRician fading, in which there is a strong dominant path plusa random multipath component. Note that traffic require-ments are likely to be higher for WLL than for cellular, partic-ularly where multiple lines are available. Bandwidthallocation is expected to be wider than for cellular in order to
F I G U R E 2Wireless Local Loop Installation
Fixed Residential Installation
Movable Residential Installation
PSTN
Figure 2a
Figure 2b
LocalExchange
BaseStation

870 ■ 19 9 8 A N N U A L R E V I E W O F C O M M U N I C A T I O N S
W I R E L E S S
support data rates of 128 kbps as in ISDN (2B+D). Note thatthe range for WLL will vary widely depending on geographi-cal terrain and land-use characteristics in the serving area. Fordense urban environments the range might be 1.5 kmwhereas for rural areas, the range might extend to 20 km.
Technology Options
There are numerous technology choices available to a serviceprovider in deploying WLL. Restricting the choices to digitaltechniques, Table 2 summarizes the characteristics of severalimportant options.2 In addition to the systems listed in thetable, third-generation systems and local multipoint distribu-tion service (LMDS) need to be included as alternatives.
Third-generation systems are expected to utilize greaterbandwidth and support higher data rates than do first- andsecond-generation systems.
WLL alternatives can be broadly categorized as: (1) narrow-band second-generation systems, (2) wider band third-gener-ation systems, and (3) broadband. Vendors are currentlyproducing narrowband systems operating in cellular/PCSbands (or slightly higher bands for international applications)using IS-95 CDMA, IS-136 TDMA, GSM/DCS-1800, digitalEuropean cordless telecommunications (DECT), and hybridvariations. An example of a TDMA variation is being de-ployed by Ionica in the United Kingdom where ten time slotsare used, instead of three as in IS-136 or eight as in GSM.
T A B L E 1Comparison of Cellular and WLL
Requirement Cellular Wireless Local LoopMobility Vehicle/Pedestrian Speed,
RoamingFixed,No Roaming
Spectrum 824-849 MHz (Mobile to Base)869-894 MHz (Base to Mobile)
None in UNITED STATES3.4 - 3.5 GHz (International)2.0 - 2.5 GHz (International)
Bandwidth 30 kHz to 1.25 MHz 5 - 20 MHzHandoff Hard or Soft N/AChannel Rayleigh Fading, Shadowing Rician Fading, Near-LOSRadio Configuration BS (omni or multi-sector) to
omni at ground levelMulti-sector at BS toelevated directional antenna
Frequency Reuse Required RequiredRange Variable (1-15 km) 15 km (typical)Traffic 15-25 milliErlangs/subscriber 100-150 milliErlangs/subscriberStandards CDMA, TDMA, GSM Proprietary & Standards-Based
T A B L E 2Characteristics of Several Potential WLL Technologies

19 9 8 A N N U A L R E V I E W O F C O M M U N I C A T I O N S ■ 871
A R T H U R A . G I O R D A N O A N D A L L E N H . L E V E S Q U E
Other variations use some combination of CDMA andTDMA. DECT using a frequency hopped TDMA scheme isactually a European cordless system for use in applications,such as wireless PBX, where users have local mobility. Thesesecond-generation systems are limited in data rate to no morethan 128 kbps. Overall, bandwidths of these systems rangesfrom 20 to 35 MHz.
Third-generation wider band systems will be extensions of thesecond-generation systems with the same bandwidth used tooffer higher data rates. For mobile applications the data rate islimited to 384 kbps and for fixed applications to 2 Mbps.
On the other hand, broadband systems such as LMDS operat-ing at 28 GHz have bandwidths of about 1 GHz, resulting indata rates ranging from 10 to 25.6 Mbps. These systems cansupport asynchronous transfer mode (ATM) traffic.
From the service provider’s viewpoint, then, it would seemthat the broadband systems are the logical choice for beingable to offer the greatest range of services. However, otherfactors such as architecture characteristics, network inter-faces, network complexity/cost, and customer premisesequipment (CPE) complexity/cost must be considered. Forexample, the base-station spacing for systems operating inthe PCS band can be much larger than spacing used in anLMDS system. For free space propagation where the loss isinversely proportional to the square of the frequency, a fac-tor of 14 increase from 2 GHz to 28 GHz represents a 23 dBloss. Accounting for terrain and other propagation factors,practical PCS base-station spacings are 10 miles whereasLMDS base station spacing is closer to 1–2 miles, dependingon rain fade margins. Thus, many more base-stations are re-quired for LMDS than for PCS. The LMDS CPE, which sup-ports the higher data rate, is also expected to be higher incost and complexity than a PCS band solution, making thetechnology choice even more difficult. The principal advan-tages of the broadband technology choice are the increase incapacity and the availability of high-speed data services.
At this point, it is useful to compare technologies on the basisof the number of users operating at a specified source datarate with a selected vocoder technology.3 (The last entry for128 kbps is not a vocoder technology but simply an ISDNdata service.) Assuming a 20 MHz available bandwidth witheach user requiring 30 kHz implies that 666 channels can beassigned. Each user is assumed to generate 100 milliErlangs
of traffic. Setting aside 26 channels arbitrarily to provide con-trol channels leaves 640 traffic channels. Table 3 then indicatesthe number of users supported for several vocoder data rates,the corresponding vocoder technologies, and the traffic inErlangs at 1 percent and 2 percent blocking rates.
Efficiency of Technology Options
In this section, the efficiencies of second- and third-generationsystems are compared with the broadband case.4 The casesunder consideration include voice using QPSK/CDMA, datausing QPSK/CDMA and LMDS with QPSK or QAM. TheCDMA cases all assume that the maximum number ofcalls/sector, K, can be computed5 as
K = 1 + (W/R)(F/v)(1/γ )
where W is the channel bandwidth, R is the source data rate,W/R is the spread-spectrum processing gain, the frequencyreuse efficiency is F = 0.667, the voice activity factor is v = 0.45for voice and 1.0 for data, and the required energy contrastratio is γ = Eb/No. For QPSK/CDMA in a cellular systemγ = 7 dB is an accepted value for 13 kbps voice. This valuemust be increased by about 6 dB for the WLL case, where nosoft handoff gain is available, so that the value of γ used inthe above equation is 13 dB. The spectral efficiency assumedfor QPSK is taken conservatively to be 1 bps/Hz.
Using these assumptions with an underlying QPSK/CDMAtransmission format, Table 4 compares the efficiency of secondand third-generation systems with LMDS. The technologycomparisons are based on three-sector cell sites. However,LMDS sectorization is ordinarily accomplished by use of hor-izontal and vertical polarization and is typically implementedwith four-sector cell sites. Note that the efficiency is stated interms of Erlangs/cell/MHz based on an Erlang-B calculationwith 2% blocking. If the operating energy contrast ratio canbe reduced to γ = 7 dB, the efficiencies in Erlangs/cell/MHzcorresponding to the last row of Table 4 become 55.1, 43.5,61.8, and 82.4.
Table 5 provides a calculation for the CDMA case assuming fullduplex data is to be supported with a value of γ = 13 dB. Thedata rates considered include 64 kbps and 2 Mbps, with a cor-responding increase in required channel bandwidth. With γ =7dB, the efficiencies in Erlangs/cell/MHz, corresponding to thelast row of Table 5, become 3.97, 3.56, 0.03, 8.4, and 0.26.
T A B L E 3Number of Users for Specified Data Rate p
VocoderData Rate
VocoderTechnology
Number ofChannels
Erlangs@1%
Users@1%
Erlangs@2%
Users@2%
8 kbps VSELP 640 613 6130 627 627016 Kbps CELP 320 297 2970 306 306032 kbps ADPCM 160 141.2 1412 146.6 146664 kbps PCM 80 65.4 654 68.7 687128 kbps ISDN
(service)40 29 290 31 310

872 ■ 19 9 8 A N N U A L R E V I E W O F C O M M U N I C A T I O N S
W I R E L E S S
The LMDS cases shown in Tables 4 and 5 are artificial in thatthe selected waveform is assumed to be QPSK/CDMAwhereas a QAM format is more likely to be used, in order totake advantage of the increased spectral efficiency of thehigher order modulation format. Tables 6 and 7 provide re-sults for data usage via LMDS where the data rates consid-ered are 64 kbps, 2 Mbps, and 25.6 Mbps using modulationformats of QPSK, 16QAM and 64QAM, respectively. Thespectral efficiency of the 16QAM case is assumed to be2 bps/Hz with required γ = 18 dB; for 64QAM the spectral ef-ficiency is 2.6 with γ = 23 dB. The number of sectors is as-sumed to be four. For this signal format cell sites aredistributed in a hexagonal arrangement and frequency reuse
is utilized. To compute the efficiency in Erlangs/cell/MHzthe following formula for frequency reuse, Fr, is needed:6
Fr = (6γ )2/n/3
where n is the path loss exponent, taken to be 2 for LOS or 4for cellular. Values of n = 3 and n = 4 will be used for the WLLcase. It can be seen from the results that the efficiency inErlangs/cell/MHz increases with a higher path loss expo-nent. For example at 64 kbps, the efficiency for n = 2, 3, and 4is 0.34, 1.9, and 3.86, respectively.
T A B L E 4CDMA Voice Efficiency
SecondGeneration
ThirdGeneration LMDS
Total Bandwidth (MHz) 5 20 1000Channel Bandwidth(MHz)
1.25 5 10
Number of Channels 4 4 100Source Data Rate (kbps) 14.4 14.4 14.4Chip Rate (Mchips/s) 1.2288 3.6864 10Processing Gain 85.33 256 694.4Max No. calls/sector, K 7 19 52Voice channels/sector 28 76 5200Erlangs/sector @2% 20.2 64.9 5200Number of sectors 3 3 3 4Erlangs/cell 60.6 194.7 15,600 20,800Erlangs/cell/MHz 12.1 9.7 15.6 20.8
T A B L E 5CDMA Data Efficiency
SecondGeneration
ThirdGeneration
ThirdGeneration LMDS LMDS
Total Bandwidth (MHz) 5 20 20 1000 1000Channel Bandwidth(MHz)
1.25 5 20 10 40
Number of Channels 4 4 1 100 25Source Data Rate (kbps) 64 64 2000 64 2000Chip Rate (Mchips/s) 1.2288 3.6864 16.384 10 40Process Gain 19.2 57.6 8.2 156.2 20Max. No. of calls/sector,K
1 2 1 6 1
Voice channels/sect 4 8 1 600 25Erlangs/sect @2% 1.09 3.63 0.02 587.2 17.5Number of Sectors 3 3 3 4 4Erlangs/cell 3.27 10.89 0.06 2349 70Erlangs/cell/MHz 0.65 0.54 0.003 2.35 0.07

19 9 8 A N N U A L R E V I E W O F C O M M U N I C A T I O N S ■ 873
A R T H U R A . G I O R D A N O A N D A L L E N H . L E V E S Q U E
WLL Architecture and Economics
An architecture implementing WLL capability is shown inFigure 3. It is assumed that multiple base-station controllers(BSCs) are connected to a central office (CO) which in turnconnects to the PSTN. Each BSC can accommodate a numberof base stations (BSs) with associated transceivers and anten-nas. The customer side of the wireless loop is assumed to in-clude residences, businesses, and multiple-unitdwellings/businesses. The BSC contains vocoders, equip-ment to distribute traffic to individual base stations, operationand maintenance equipment, and network management andcontrol facilities.
To illustrate WLL economics, cost calculations are presentedfor various levels of penetration in a postulated market area. Asingle BS is assumed to cover 30 square km where 100,000 po-
tential subscribers reside. For this computation, 100milliErlangs of traffic per subscriber is assumed. For this ex-ample, three-sector cell sites are assumed with the capacity ofthe base station taken to be 600 subscribers. The assumed BS,BSC, and CPE costs are estimated to be representative of in-dustry pricing. Table 8 provides the results, which illustratethat the CPE is the dominant cost element.
WLL Issues
Several issues confront the service provider choosing to de-ploy WLL. In addition to the technology selection discussedabove, numerous practical items include:
1. lack of dedicated spectrum in the United States
2. lack of WLL standards
T A B L E 6LMDS Data Efficiency for n = 3
Total Bandwidth (MHz)1000 1000 1000
Channel Bandwidth (MHz) 0.064 1 10Number of Channels 15625 1000 100Modulation QPSK 16QAM 64QAMSpectral efficiency(bps/Hz) 1 2 2.6Source Data Rate (Mbps) 0.064 2 25.6? (dB) 13 18 23Frequency Reuse, Fr 8 17 37Voice channels/sect 488 14 1Erlangs/sect @ 2% 474 8.2 0.02Erlangs/cell 1896 32.8 0.08Erlangs/cell/MHz 1.9 0.033 0.00008
T A B L E 7LMDS Data Efficiency for n = 4
Total Bandwidth (MHz)1000 1000 1000
Channel Bandwidth (MHz) 0.064 1 10Number of Channels 15625 1000 100Modulation QPSK 16QAM 64QAMSpectral efficiency(Bps/Hz) 1 2 2.6Source Data Rate (Mbps) 0.064 2 25.6?(dB) 13 18 23Frequency Reuse, Fr 4 7 12Voice channels/sector 976 35 2Erlangs/sector @ 2% 966 26.4 0.223Erlangs/cell 3864 105.6 0.892Erlangs/cell/MHz 3.86 0.1 0.0009

874 ■ 19 9 8 A N N U A L R E V I E W O F C O M M U N I C A T I O N S
W I R E L E S S
F I G U R E 3WLL Architecture
COPSTN BSC
BSC
BSCBS
BS
BS
BS
T A B L E 8Cost per Subscriber Versus Market Penetration
5% 10% 20% 25%Total No. Subscribers 5,000 10,000 20,000 25,000Number of Calls 500 1,000 2,000 2,500Number Calls/Sector 166 332 666 833Number of BSs 1 1 2 2BS Cost $1,400K $2,600K $5,200K $6,400KBSC Cost $600K $900K $1,500K $1,800KCPE Cost $5,000K $10,000K $20,000K $25,000KTotal Cost $7,000K $13,500K $26,700K $33,200KCost per Subscriber $1,400 $1,350 $1,335 $1,328

19 9 8 A N N U A L R E V I E W O F C O M M U N I C A T I O N S ■ 875
A R T H U R A . G I O R D A N O A N D A L L E N H . L E V E S Q U E
3. quality of service requirements for voice and data
4. interface of vendor equipment to U.S. switches
5. availability of standard phone features such as dial-tone,CLASS services, etc.
6. customer need for high-speed data
The spectrum issue is key. If an operator can use spectrum formobile service, where the customer pays for minutes of use,the attainable revenue is typically an order of magnitudehigher than the corresponding revenue from a flat-rate WLLservice. Many WLL technologies are proprietary and thus arenot compatible with existing cellular standards and force theservice provider to be captive to the selected vendor.
The quality of service expected on WLL connections varieswidely. In locations where telephone service is available,cellular voice quality and low-speed data are likely to be sat-isfactory to customers. On the other hand, for capturing newcustomers or for displacing wireline connections held bynew customers, high-quality voice, additional services suchas high-speed data, and perhaps bundling of local and long-distance service are expected.
To date, vendor solutions have not addressed U.S. switch in-terface needs since there will be no strong driving force in theUnited States until such time as the FCC assigns dedicatedspectrum to WLL. Dial-tone and CLASS services can be sup-ported by many vendors and would be considered essentialby most service providers.
The final question raised regarding the need for high-speeddata is problematic. Perhaps asymmetric high-speed data isrequired for home and business Internet service. In general, itis expected that most residences would require much lowerdata rates than are needed for business use.
Conclusion
In this paper, WLL has been described as an alternative tech-nology for subscriber voice and data access to the PSTN. Theservice provider considering deployment of WLL has a widerange of potential applications. In-franchise rural markets can
utilize WLL where the cost of wireline installation is exces-sive. In adjacent out-of-franchise markets, WLL can be usedto rapidly deploy local access, relying on existing infrastruc-ture augmented by the wireless equipment to extend the mar-ket boundaries. As a result, the incumbent local exchangecarrier can be bypassed and lucrative markets can be tar-geted. Due to spectrum limitations in the United States, inter-national markets where frequencies have already beenassigned for WLL currently represent the most attractivenear-term business opportunities.
Several technologies have been identified including systemsbased on existing standards as well as proprietary designs.These technologies have been categorized as second- andthird-generation cellular-based systems and broadband sys-tems spanning bandwidths ranging from 5 MHz to 1 GHz.The efficiencies of the alternative categories, stated asErlangs/cell/MHz, were examined for CDMA voice and dataservices. For voice services, the results show a distinct advan-tage for broadband systems. For data services, the broadbandalternative permits higher data rates and also provides an ef-ficiency advantage at comparable source data rates. The re-sults also show that the spectral efficiencies are higher withreduced operating energy contrast ratios. A WLL architecturewas presented along with estimated costs per subscriber atvarious levels of market penetration. The results clearly showthat the customer premise equipment cost is a dominant ele-ment in the total cost per subscriber. Several outstanding is-sues were identified including the principal issue for U.S.operation, which is the lack of dedicated spectrum.
References
1. J. Searle, et al., “Ionica Fixed Radio Access System”, IEE Colloquium onLocal Loop Fixed Radio Access, 1995.
2. A. Kucar, “Mobile Radio Overview”, chapter in The MobileCommunications Handbook, J. Gibson, ed., CRC Press, 1996.
3. K. Pahlavan and A. Levesque, Wireless Information Networks, John Wiley &Sons, Inc., 1995.
4. V. Garg and E. Sneed “Digital Wireless Local Loop Systems”, IEEECommunication Magazine, October 1996.
5. K. Gilhousen, et al., “On the Capacity of a Cellular CDMA System”, IEEETransactions on Vehicular Technology, Vol. 40, No. 2, May 1991.
6. W. C. Y. Lee, Mobile Cellular Telecommunications, 2nd edition, McGrawHill, 1995, pp. 62–63.

19 9 8 A N N U A L R E V I E W O F C O M M U N I C A T I O N S ■ 877
Abstract
Geostationary satellite links have characteristics that can de-grade the performance of TCP. The propagation time for ageostationary satellite link is on the order of 0.25 seconds.Thus, a satellite can add approximately 0.5 seconds to theround-trip time experienced by a TCP packet and the corre-sponding acknowledgement. This delay time is the primarycause of TCP inefficiency over satellites. There are some thingsthat can be done to enable TCP to better utilize satellite chan-nels. These practices include using the fast retransmit and fastrecovery algorithms, the LFN extensions to TCP, and the useof selective acknowledgements. This paper briefly describesthe satellite environment, the problems arising from that envi-ronment, and the best practices for mitigating the problems.
Introduction
A large portion of Internet traffic uses the transmission con-trol protocol (TCP) for reliable data delivery. TCP is just oneprotocol in the family of Internet protocols known as theTCP/IP protocol suite maintained by the InternetEngineering Task Force (IETF). TCP is used by the FileTransport Protocol (FTP) and for World Wide Web datatransport. TCP started out as a research protocol in the early1970s,1 but has evolved substantially over the years. InOctober 1986, the Internet experienced congestion collapsesand in response, several algorithms were developed to pre-vent or control network congestion.2 These algorithms wereintroduced into the 4.3BSD (Berkeley software distribution)operating system and that version of TCP became known asTahoe (after the name of the machine to which the 4.3BSDwas being ported at the time). TCP-Reno was released in 1990with additional changes and is the minimum benchmark forTCP today.
Users in remote areas, users in regions without well-devel-oped terrestrial networks, and mobile users are all potentialbeneficiaries of satellite services. Given this environment,there has been a great deal of interest in getting the TCP/IPprotocols, especially TCP, to work more efficiently over longdelay paths. There are Internet services available over satellitetoday, so TCP obviously works over satellite, but efforts areunderway to enable better utilization of satellite links.
The long propagation delay of a geosynchronous satellitepath can be a fundamental problem for some applications.Interactive applications, such as a telnet session or a game ofQuake, are frustrating for many satellite users. Even a basicTCP implementation will perform well for low-volume appli-cations, including Web browsing, especially when the satel-lite link is shared among several users. On the other hand,high-volume data transfers such as medial images or largeWeb pages will require the implementation of high-perfor-mance TCP options as described in this paper.
Background
Communications satellites were developed in the 1960s toprovide international telephone service. The geosynchronousorbit (GSO), at an altitude of 22,300 miles, allows ground sta-tion antennas to remain pointed in one direction. The result-ing 250-ms delay because of the propagation time up andback proved not to be a problem for telephone conversations(once echo cancellation was introduced). In the 1970s, satel-lites were used primarily for telephony and for television pro-gram distribution. Today, 45-Mbps satellite services at bit-error rates of 1 in 107 are commercially available. Very smallaperture terminal (VSAT) satellite systems provide 64-kbps orfractional-T1 data channels. Satellite frame relay services arealso being offered.
New GSO satellite systems are being designed that will usehigher frequencies (Ka-band) to offer services from lowrates up to 18 Mbps at bit-error rates less than 1 in 1010.Low-earth orbit (LEO) satellite systems are also being builtthat will provide low data-rate services, but with delayscomparable to, or less than, terrestrial systems. NASA’s ad-vanced communications technology satellite (ACTS) has pi-oneered the use of technologies that these systems will use.The concatenated error-correction coding used by ACTS hasprovided a link quality approaching fiber; that is, the link iseither error-free or not available. As error-correction codingis used more frequently in satellite systems, the problems re-sulting from errors should be mitigated. However, there is alarge installed base of satellite ground stations that do notuse advanced error correction, many of which are in under-developed countries that might be slow to implement tech-nology upgrades.
TCP Performance in a GeostationarySatellite EnvironmentDaniel R. Glover Hans KruseProject Engineer Director, McClure School of Communication Systems Mgmt.NASA Lewis Research Center Ohio University

878 ■ 19 9 8 A N N U A L R E V I E W O F C O M M U N I C A T I O N S
W I R E L E S S
Future satellite systems are being designed that will providepersonal communication services. There are LEO systemsbeing designed and built that will offer mobile voice, messag-ing, and low-rate, remote Internet services. The LEO systemshave low delay as well as lower power requirements com-pared to GSO systems, but require a larger number of space-craft to provide coverage. Several new high-frequency(Ka-band) GSO satellite systems are scheduled for launch inthe next few years. These systems will offer services at datarates from 16 kbps to nearly 20 Mbps.
Internet services are available to the end user today oversatellite systems. Some of these are closed systems that can bedesigned for optimal transfer over high delay links and cantake advantage of the asymmetric nature (that is, highertransfer rates in one direction than the other) of most Internettraffic. One satellite system is offering end users today a 400-kbps peak incoming data rate, which is much higher than thetypical 28.8 kbps modem. In this paper, high data rate meansover 1 Mbps.
TCP is a windowed protocol that uses acknowledgmentsfrom the receiver to clock the sender’s output. New data can-not be introduced into the network until an acknowledgmenthas been received by the sender indicating that data has beenremoved from the network. The windows control the amountof data that can be transmitted at any particular time. A max-imum window size (generally corresponding to the receiver’sbuffer size) is negotiated at the connection setup, and a con-gestion window is used to control the amount of data intro-duced into the network. Two algorithms, slow start andcongestion avoidance, make TCP behave like a good neigh-bor and prevent data from being blasted out onto the net-work at the beginning of a connection or after a loss. Thesealgorithms gently probe the network to find the proper levelof data transmission. TCP assumes any loss is a result of con-gestion in the network and throttles back the transmissionrate severely.
Advantages of Satellites
Satellites have not played a major role in the Internet up tothis time, so one might question why any effort should bespent on making TCP work more efficiently over satellite.Satellites have some potential advantages that should be con-sidered by architects of future networks. One advantage isthat satellites, being wireless, do not require an infrastructureof cables and therefore can bring the network to hard-to-reachareas (e.g., in the middle of the ocean) or to economically dis-advantaged areas that cannot afford a wired infrastructure.Another advantage is that a satellite is a natural for broad-casting the same data to many locations. There may be somefuture opportunities to take advantage of the natural broad-cast characteristics of satellites to make multicast more effi-cient in the overall network.
Fooling TCP
It is possible to get around some of the inefficiencies of TCPby going around the protocol. This must be thought out care-fully, because the congestion control in TCP is there for a rea-
son. However, in some situations, such as at the edge of thenetwork, it may be possible to translate to another protocolfor a satellite hop or to spoof TCP by acknowledging packetsbefore the satellite hop. It is possible to use multiple TCP con-nections to improve overall throughput. This can be done bysplitting a large file up and sending the pieces over separateconnections. It is also done by some browsers, but using mul-tiple connections has been frowned on as an unfair practiceby some computer scientists.
While bypassing TCP’s slow start and congestion control al-gorithms might seem attractive in some cases, care must betaken to make sure that the network as a whole is not abused.This is most easily done at the edge of the network where thelast leg of the connection is controlled. It might make sense insome cases to disable congestion control completely (for adeep space probe, for example, if it were using TCP for somereason). On the Internet, if one person disabled his congestioncontrol, he might notice an improvement in performance, butif everyone disabled their congestion control, there would beno more Internet. In this paper, the concern is how to makeTCP work better for everyone including satellites, not withsatellite-specific solutions.
Satellite Link Characteristics
Satellite links have characteristics that can degrade the perfor-mance of TCP. These include:
• long delay paths (long feedback path)• large delay x bandwidth product• transmission errors (as opposed to congestion loss)• limited bandwidth• asymmetric use• variable round-trip times (for some constellations)• intermittent connectivity (handoffs and outages)
By far, the most common type of communications satellitetoday uses the geostationary orbit. Such satellites have an alti-tude of 22,300 nautical miles and orbit the earth once a day,thus appearing to be stationary in the sky. These satellites donot normally suffer from the listed disadvantages except forthe final two. Asymmetric use is a result of the way satellitesystems are typically configured for end users. The rest of thispaper will concentrate on geostationary orbit satellites andthe first three characteristics. The term “satellite” will betaken to mean “geostationary satellite” throughout.
Long Delay Path
The first characteristic, long delay path, is the primary prob-lem addressed in this paper. It leads to the second, large delayx bandwidth product, even though satellites typically havelimited bandwidth. It also exacerbates the problems arisingfrom channel errors.
Because each satellite in the path will contribute about 0.5seconds to the round-trip time (RTT), connection establish-ment will take longer over satellite. The use of TCP for trans-actions (T/TCP) can help make connection setup quicker bymaintaining a connection for use by multiple transactions

19 9 8 A N N U A L R E V I E W O F C O M M U N I C A T I O N S ■ 879
D A N I E L R . G L O V E R A N D H A N S K R U S E
(request/response sequences).3 HTTP1.1 should provide ben-efits for satellite channels for the same reason. Care should betaken in network design with regard to DNS server locationto avoid DNS lookups over the satellite.
To avoid congestion in the network, TCP ramps up the con-nection rate using the “slow start” algorithm.2 Because slowstart is directly proportional to the RTT, the long RTT makesslow start over a satellite much slower than for terrestrial con-nections. Slow start time (the time to reach full connectionspeed after connection establishment in the absence of loss) isgiven by:
Slow Start Time = RTT log2 (W)
Where W is the window size in packets.2
When using the delayed acknowledgements algorithm(which acknowledges two packets with one ACK), the slowstart time increases to roughly:4
Slow Start Time = RTT log1.5 (W)
Thus, avoiding the use of delayed ACKs during slow startwould appear to help in a satellite channel in the case of smallfile transfers (however, this requires further study). For largefile transfers, delayed ACKs can help avoid congestion lossby controlling the burstiness from large bunches of ACKsand, therefore, is beneficial. Delayed ACKs may also be help-ful in highly asymmetric channels where ACK bunching mayoccur that can lead to burstiness and congestion loss.However, delayed ACKs also cause slower congestion win-dow growth during congestion avoidance. This is still a topicfor research; however, it is clear that for small transfers de-layed ACKs hurt, while for large transfers they can help. Anobvious approach is to turn delayed ACKs on only after slowstart has gotten the connection up to a reasonable rate. Theuse of selective acknowledgments (SACK) can allow betterhandling of the retransmission queue in the event of multiplepacket losses in a single window.5
Large Delay x Bandwidth Product
The delay x bandwidth product is a measure of the capacityof a link in terms of the maximum amount of data that can bein flight at one time. This is a critical parameter in windowedprotocols such as TCP. The window size must be equal to thedelay x bandwidth product to utilize the channel at steady-state fully.
The largest window size in TCP without options is 65,535bytes. For RTT = 0.5 seconds, this limits the throughput toaround 1 Mbps per connection. To reach a steady-state condi-tion where a large delay x bandwidth channel (such as onethat includes a satellite) is utilized to its full potential, the useof long fat network (LFN) extensions is needed.6 These op-tions include window size scaling (or large windows), time-stamps, and protection against wrapped sequence numbers.
Many computer scientists assume that the only thing toworry about on a satellite connection is using large windows.They assume the problem was solved many years ago (thelarge window option has been around since 1990).7 UsingLFN options is something that most users will have to dosomeday, but they are not a solution for all the problemsfaced by satellites. The large-windows option allows TCP toreach a steady state that uses the full bandwidth available,but does nothing for the long feedback path problems.
Table 1 shows the results of window-size calculations for se-lected data rates and round-trip times. Round-trip time for acoast-to-coast terrestrial network is represented by 0.1 sec-onds. A network including a single satellite link should comein under 1 second. Some remote sites (e.g., Alaska) may expe-rience RTT of 2 seconds. Note that for a 2-second RTT, largewindows are not necessary for a channel with bandwidth lessthan 262,140 bps. For a 0.1-second RTT, large windows willbe necessary when the rate is a little greater than 5.2 Mbps.These numbers are for individual TCP connections. If multi-ple TCP connections are in use on the satellite link, each indi-vidual connection can utilize data rates up to the limitdictated by the window size; the utilization of the satellitelink will be the sum of the individual connections. As stated
T A B L E 1Window Sizes for a Single TCP Connection
Rate RTT B*D (window) LFN needed?(bps) (sec) (bytes) (Yes, No)
33.6 k 0.1 420 N
33.6 k 1 4200 N
33.6 k 2 8400 N
128 k 0.1 1600 N
128 k 1 16,000 N
128 k 2 32,000 N
1.55 M 0.1 19,375 N
1.55 M 1 193,750 Y
1.55 M 2 387,500 Y
10 M 0.1 125,000 Y
10 M 1 1,250,000 Y
10 M 2 2,500,000 Y
155 M 0.1 1,937,500 Y
155 M 1 19,375,000 Y
155 M 2 38,750,000 Y

880 ■ 19 9 8 A N N U A L R E V I E W O F C O M M U N I C A T I O N S
W I R E L E S S
earlier, no action may be required if many users are sharingthe circuit, and each user expects to use only a modest datarate. If a single TCP connection is expected to consume theavailable bandwidth, the considerations in this section apply.
Table 2 shows the results of a similar calculation in reverse,the RTT that gives a delay x bandwidth product equal to thelargest possible window in TCP without using window scal-ing options. Note that a 12-kbps connection does not needlarge windows even for several satellite hops, while a 155-Mbps or 622-Mbps connection would need large windowsroutinely even for terrestrial channels. The low rate numbersin these tables may seem familiar today, but in a few years areader might wonder why such ridiculously low rates arebeing examined. On the other hand, limits are being reachedas to what can be done with the existing phone system, andcost/benefit considerations might keep many consumersusing their current modems at home. As data rates increase,more connections will need LFN extensions even over terres-trial networks because of the growth in bandwidth.
Transmission Errors
The long feedback time discussed earlier also affects the re-sponse of congestion avoidance, which is an even slowergrowth phase than slow start. In congestion avoidance, thecongestion window can be increased by no more than onesegment per RTT (and when delayed ACKs are used, it hasan increase rate of only one segment per two RTTs).
A loss event in TCP is always interpreted as an indication ofcongestion and causes TCP to enter congestion avoidance. Ifa loss occurs during slow start, then slow start is terminatedand TCP enters congestion avoidance. Premature terminationof slow start by losses other than congestion losses should beavoided because the congestion avoidance algorithm in-creases the transmission rate at a slower pace than slow start.A loss during steady-state operation will usually result in adrastic reduction of the effective window size at the sender,
followed by congestion avoidance. Modern TCP implementa-tions should use the techniques known as fast retransmissionand fast recovery. The mechanisms attempt to recognize acase where a single TCP segment has been lost (often due toa transmission error); in this case TCP can bypass the conges-tion avoidance stage. To improve the handling of a loss ofmultiple TCP segments, the selective acknowledgment(SACK) option for TCP is needed. While this option and itsperformance characteristics have been extensively studied bynetwork researchers, it is not yet widely available in end-useroperating systems.
For TCP to operate efficiently, the channel characteristicsshould be such that all loss is due to network congestion. Theuse of forward error correction coding (FEC) on a satellitelink should be used to bring the performance of the link to atleast fiber quality. Because of the effect of long RTT, errors ona satellite link have more severe repercussions than on alower RTT terrestrial channel, so an even better error perfor-mance is indicated, if possible.4 There are some applications,such as military jamming, where FEC cannot be expected tosolve the noise problem. Also, there may be a trade-off be-tween coding complexity and delay.
Implementation Issues
Satellite users should keep abreast of updates to pertinentdocuments and ensure that the implementations they use areup-to-date.8 They should also follow the efforts of groupssuch as TCP implementation working group. Efforts are cur-rently underway to update RFC 1323 and RFC 2001. TheTCP over satellite working group in the IETF has been work-ing on identifying the problems with current versions of TCPand recommending the best common practices for satellites.
There is a large installed base of TCP that does not neces-sarily support the options that can improve performanceover satellites. Different implementations also vary in thedegree to which they follow the TCP specifications. Thesespecifications can be difficult to understand because in thepast they have not been clearly written or available in oneplace. The TCP implementation working group is correct-ing these problems.
There has been some talk about working on the next genera-tion TCP or TCPng. A decision was made not to work onTCPng when work on Ipv6 was begun, but now there isgrowing interest in fixing TCP. TCP has evolved through theuse of extensions that make use of the option field in theheader. It may begin to make sense to migrate some of theseoptional extensions to a more regular position. Resistance tochanging TCP could be due, in part, to a wish to avoid thecongestion collapse of 1986. The Internet has become so com-plex that it is not possible to predict how it will react to achange in TCP.
Recommendations
Satellite users should make sure that the TCP implementa-tion that they are using meets the Internet Standards for hostrequirements and for TCP.8-10
T A B L E 2Round-Trip Times Corresponding to the Maximum StandardWindow Size at Various Rates
Rate RTT for 64 KB (bps) B*D (seconds)
33.6 k 15.6
128 k 4.096
1.55 M 0.340
10 M 0.050
155 M 0.003
622 M 0.0008

19 9 8 A N N U A L R E V I E W O F C O M M U N I C A T I O N S ■ 881
D A N I E L R . G L O V E R A N D H A N S K R U S E
The TCP implementation should also meet the RFC for con-gestion control.11 Specifically, a TCP implementation shouldinclude slow start, congestion avoidance, fast retransmit, andfast recovery.
Satellite users with a large delay x bandwidth product shouldalso use implementations that include the proper options,known variously as LFN, high performance, or large windows.6
Satellite users should use selective acknowledgments (SACK).5
Satellite users should use HTTP 1.1 capable servers andbrowsers.12
Conclusions
It is important to remember that TCP works over satellite.There are several companies that offer Internet access oversatellite today. TCP suffers from some inefficiencies over along delay path, but it is not unworkable. There are effortsunderway to make TCP work better, not only over satellite,but for all users. There are also efforts under way to improvethe performance of TCP over satellite at high data rates. Theperformance issues described earlier are on a per-connectionbasis. Trunking TCP channels together does not affect theperformance of TCP.
To utilize the available bandwidth fully it is necessary insome, but not all, cases to use the TCP large windows option.Although this solves the steady state condition, the dynamicsof getting a connection up to speed or recovering after a loss isslow (proportional to the round-trip time) over satellites be-cause of the long delay path. Efforts are underway to improvethis situation.
References
1 Cerf, V. and R. Kahn. “A Protocol for Packet Network Intercommunication.”IEEE Transactions on Communications. Vol. 22, No. 5, pp. 637-648, May1974.
2 Jacobson, V. “Congestion Avoidance and Control.” Computer CommunicationReview. Vol. 18, No. 4, pp. 314-329, August 1988.
3 Braden, R. “T/TCP—TCP Extensions for Transactions FunctionalSpecification.” July 1994. [RFC 1644]
4 Partridge, Craig, and Tim Shepard. “TCP Performance Over Satellite Links.”IEEE Network. 11(5), pp. 44-49, September/October 1997.
5 Mathis, Matt, Jamshid Mahdavi, Sally Floyd, and Allyn Romanow. “TCPSelective Acknowledgment Options.” October 1996. [RFC 2018]
6 Jacobson, V., R. Braden, and D. Borman. “TCP Extensions for HighPerformance.” February 1991. [RFC 1323]
7 _________, R. T. Braden, and L. Zhang. “TCP Extension for High-SpeedPaths.” Oct-01-1990. [RFC 1185] (Obsoleted by RFC 1323)
8 Postel, J. “Internet Official Protocol Standards.” June 1997. [STD-001] (AlsoRFC2200)
9 Braden, R., Ed. “Host Requirements.” October 1989. [STD-003] (AlsoRFC1122, RFC1123)
10 Postel, J. “Transmission Control ProtocolóDARPA Internet ProgramProtocol Specification.” September 1981. [STD-007] (Also RFC-793)
11 Stevens, W. Richard. “TCP Slow Start, Congestion Avoidance, FastRetransmit, and Fast Recovery Algorithms.” January 1997. [RFC 2001]
12 Fielding, R., J. Gettys, J. Mogul, H. Frystyk, and T. Berners-Lee. “HypertextTransfer Protocol—HTTP/1.1.” January 1997. [RFC 2068]
Works Consulted1 Allman, Mark, Chris Hayes, Hans Kruse, and Shawn Ostermann. “TCP
Performance Over Satellite Links.” In Proceedings of the 5th InternationalConference on Telecommunication Systems, March 1997.
2 ____________. “Improving TCP Performance Over Satellite Channels.”Master’s thesis, Ohio University, June 1997.
3 Jacobson, V.”Modified TCP Congestion Avoidance Algorithm.” end2end-in-terest mailing list, April 30, 1990. ftp://ftp.isi.edu/end2end/end2end-in-terest-1990.mail.
4 Martin, James. Communications Satellite Systems. Prentice Hall, 1978.

19 9 8 A N N U A L R E V I E W O F C O M M U N I C A T I O N S ■ 883
Whether due to increased competition among providers orincreased sophistication among users, much focus is currentlybeing placed on the provision of enhanced services.Enhanced services should not cannibalize or take over a net-work, but rather should enhance and complement what a net-work provider—wireless, wireline, international, ordomestic—has as a core product offering. This paper will ex-plore ways in which vendors can distribute valuable en-hanced services to better serve their customers. It will outlinethe provision and value of several services at a high level, andexamine, from a customer perspective, some of the issuesfaced in service deployment.
One of the most important matters for any provider to re-member is that customers of communication services make abuying decision every month. Providers do not have the lux-ury of being as important as food, gasoline, clothing, or otheressentials, so their services must really provide value to theircustomers. Certainly, wireline providers could argue that cus-tomers need telephone service, and that is true. Nevertheless,given some of the changes in the telecommunications bill andsome of the new competitive factors, this may not be the casefor long. Hence, it is important to focus on the customer inevery possible way.
The services that providers are deploying must certainly becutting edge, but they must also have value. It is important toremember that a provider will not simply be selling some-thing and then walking away. Rather, there is an ongoing re-lationship with the customer. This must be cultivated andconstantly updated with services that provide value.Generally, customers are not concerned with having ad-vanced intelligent network (AIN) services per se, but ratherwith having services that allow them to communicate easilyand effectively. Regardless of how services are designed froman engineering perspective, they should always be easy andconvenient for carriers to deploy and customers to accept.
Value is a very intangible concept. A monthly invoice, how-ever, is very tangible. The customer’s decision point is simple.As can be seen in Figure 1, the value of the service in the cus-tomer’s mind must be greater than the invoice. If customerssee the value of that service as greater than the monthly in-voice, then they may continue to retain that concept, creating ahigher chance for customer loyalty. If, however, the perceived
value of that service is less than the invoice, there will proba-bly be a high churn rate. Enhanced services can increase per-ceived value and, hence, help in carrier differentiation anddrive revenue.
People today are communicating far more effectively thanever before. Almost every user can find a communicationsmechanism that suits his or her particular needs: cellularphone, pager, calling card, facsimile, etc. Each one, however,communicates individually. Enhanced services should facili-tate network utilization through a particular carrier and driveas much revenue as possible. This can be done by integratingsome of the networks that exist today.
The cellular switch can serve as a good example. As shown inFigure 2, a cellular switch can have a number of point solu-tions, including personal number services, short message ser-vice, voice mail, voice-activated services, and debit/billing.Having all of these point solutions, however, creates severalnetwork issues. For instance, there is no integration of ser-vices, which leads to both technical and marketing issues.There is also inefficient signaling and trunking in this sce-nario, as well as issues involving maintenance, training, andadministration. There is a need for a reasonable integrationsolution—one that will provide a return on investment.
One solution could be an enhanced services platform, such asa service node (see Figure 3). In this scenario, carriers couldcustomize service offerings including voice mail, outgoingcalling, facsimile mail, personal number service, and voice-ac-tivated services, all of which could all exist on a single plat-form. The benefit to this scenario is that it is an integrated
Deploying Enhanced SubscriberServices and IN: How and Why Michael GulledgeDirector of Marketing, Integrated Network GroupGlenayre Electronics
Decision Point
Value of Service Monthly Invoice
Loyalty
Value of Service Monthly Invoice
Churn
F I G U R E 1Decision Point
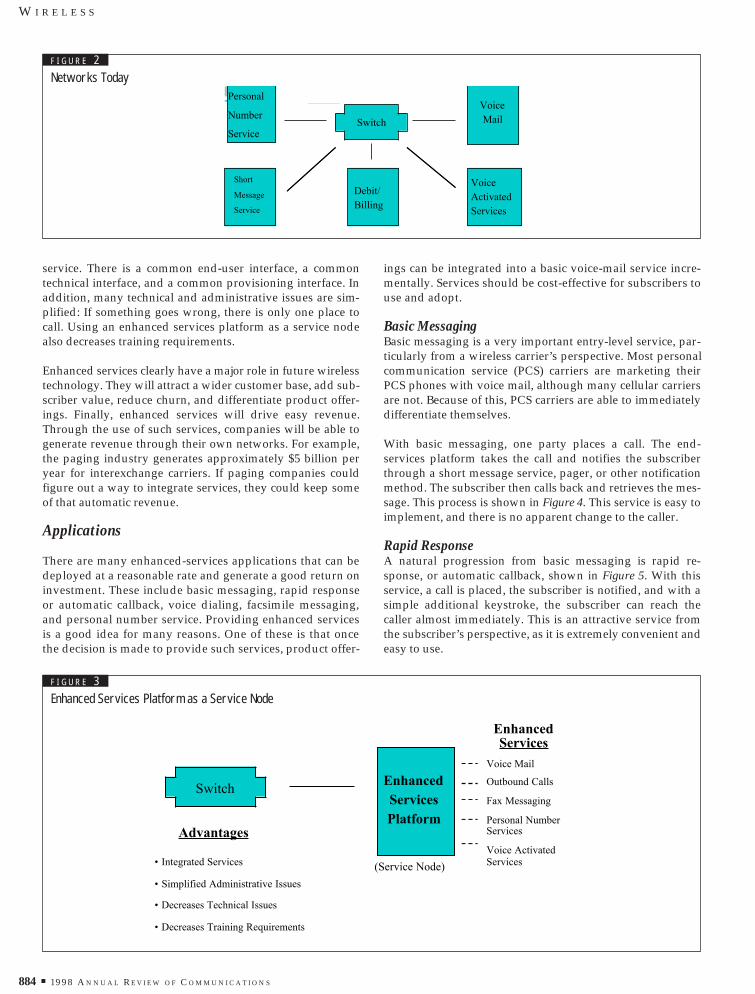
884 ■ 19 9 8 A N N U A L R E V I E W O F C O M M U N I C A T I O N S
service. There is a common end-user interface, a commontechnical interface, and a common provisioning interface. Inaddition, many technical and administrative issues are sim-plified: If something goes wrong, there is only one place tocall. Using an enhanced services platform as a service nodealso decreases training requirements.
Enhanced services clearly have a major role in future wirelesstechnology. They will attract a wider customer base, add sub-scriber value, reduce churn, and differentiate product offer-ings. Finally, enhanced services will drive easy revenue.Through the use of such services, companies will be able togenerate revenue through their own networks. For example,the paging industry generates approximately $5 billion peryear for interexchange carriers. If paging companies couldfigure out a way to integrate services, they could keep someof that automatic revenue.
Applications
There are many enhanced-services applications that can bedeployed at a reasonable rate and generate a good return oninvestment. These include basic messaging, rapid responseor automatic callback, voice dialing, facsimile messaging,and personal number service. Providing enhanced servicesis a good idea for many reasons. One of these is that oncethe decision is made to provide such services, product offer-
ings can be integrated into a basic voice-mail service incre-mentally. Services should be cost-effective for subscribers touse and adopt.
Basic MessagingBasic messaging is a very important entry-level service, par-ticularly from a wireless carrier’s perspective. Most personalcommunication service (PCS) carriers are marketing theirPCS phones with voice mail, although many cellular carriersare not. Because of this, PCS carriers are able to immediatelydifferentiate themselves.
With basic messaging, one party places a call. The end-services platform takes the call and notifies the subscriberthrough a short message service, pager, or other notificationmethod. The subscriber then calls back and retrieves the mes-sage. This process is shown in Figure 4. This service is easy toimplement, and there is no apparent change to the caller.
Rapid ResponseA natural progression from basic messaging is rapid re-sponse, or automatic callback, shown in Figure 5. With thisservice, a call is placed, the subscriber is notified, and with asimple additional keystroke, the subscriber can reach thecaller almost immediately. This is an attractive service fromthe subscriber’s perspective, as it is extremely convenient andeasy to use.
W I R E L E S S
F I G U R E 2Networks Today
Networks TodayVoiceMailSwitch
Debit/Billing
Personal
Number
Service
Short
Message
Service
VoiceActivatedServices
F I G U R E 3Enhanced Services Platform as a Service Node
Service Node
Switch
Voice Mail
Outbound Calls
Fax Messaging
Personal NumberServices
Voice ActivatedServices
EnhancedServicesPlatform
EnhancedServices
Advantages
¥ Integrated Services
¥ Simplified Administrative Issues
¥ Decreases Technical Issues
¥ Decreases Training Requirements
(Service Node)

19 9 8 A N N U A L R E V I E W O F C O M M U N I C A T I O N S ■ 885
This is also a good service for providers, because the toll mar-gins are very good. As mentioned above, one of the benefitsof enhanced services is their ability to drive easy revenue. If itis possible to package a toll product with a messaging prod-uct, more revenue should be gathered than with a simplelong-distance calling card service with competitive rates.
Voice DialIn keeping with the concept of adding services that are easyto use and improve communications efficiency, providerscould choose to offer voice-dialing capabilities. Certainly,pushing one button to place or return a call is very easy, but itwould be even easier for users to return calls via voice. Thismight mean speaking phrases such as “call home,” “call JimSmith,” or “dial 555-1234.” In addition, the subscriber’s per-sonal directory is very secure. Finally, like rapid response,voice dialing is another service that can drive toll revenue forthe provider.
While voice-dialing applications are certainly easy and conve-nient, they probably have a limited life in terms of being astand-alone service. The more likely future of voice-activatedservices involves integration with the mailbox, allowing users
to operate a mailbox with voice commands such as play, save,erase, delete, and so on. Nonetheless, voice dialing can be avery beneficial service offering for the present, although thetechnology is still imperfect.
One of the keys of voice dialing as an enhanced service offer-ing is that the technology is being put on a service node-typeof architecture rather than acting as a stand-alone point solu-tion. This means that the capital cost can be leveraged overmultiple revenue streams, which reduces the risk of deploy-ing this type of service.
Facsimile MessagingFacsimile messaging, shown in Figure 6, is a slightly differentenhanced service. This involves being able to receive a fac-simile message in the same mailbox as a voice message, usingthe same interface and capabilities to perform functions. Thesubscriber would be notified of having received a facsimileand would be able, with a few additional key presses, to printthe facsimile.
This service adds another communication method for mobilesubscribers. Most of these subscribers have already learned
M I C H A E L G U L L E D G E
MWI via
SMS, Pager
( p )
F I G U R E 4Basic Messaging
SubscriberRetrieves Message
Call Returned via RapidResponse
MWI via
SMS, Pager
(ANI Captured)
Benefits:• Very Convenient and Easy to Use for Subscriber• Toll Margins are Very Good
F I G U R E 5Rapid Response: -Automatic Callback
Benefits:
• Easy to Implement
• No Change to Caller
• Different Types of Notification
Messages Retrieved
MVI via SMS

886 ■ 19 9 8 A N N U A L R E V I E W O F C O M M U N I C A T I O N S
basic services and how they interact with the mailbox on abasic level. Facsimile messaging, then, would simply involve asmall, incremental difference in function. As a premium ser-vice, facsimile messaging can drive revenue for the provider.
As yet, facsimile services have not been widely deployed inthe wireless market by large carriers. This may be a distribu-tion and focus issue, as some smaller providers are offeringthis service and finding it lucrative. There is a demand for thistype of service, but many carriers with vertical markets haveyet to take advantage of this demand. Enhanced serviceproviders have been very focused on distribution channels,and they are able to get these types of messages very easily.Their customers are given the ability to receive a voice mes-sage, receive notification, make telephone calls, and receivefacsimiles from a single unit.
This is wise on the part of service providers, because suchcompanies are not counting on a single service to generate alltheir revenue. If, for instance, facsimiles become obsolete,then the enhanced service provider who has spread its invest-ment over a number of points can still leverage costs and con-tinue to draw revenue from other services.
Personal Number ServiceMuch focus has been placed on a newer service offering—personal number service. This service allows subscribers to bereached at any location via a single number. In this scenario, acall is placed and the enhanced services platform answers the
call, which connects to a series of personal communicationdevices and presents the call. The subscriber has several op-tions: connect to the caller, forward the caller to voice mail, orredirect the caller to an assistant (see Figure 7).
Here again, if a provider were selling personal number ser-vices in a stand-alone environment without any relationshipwith customers, it might be difficult to explain how to use thistype of service from the ground up. However, if the sub-scriber already has a mailbox and uses some enhanced ser-vices, personal number service is just another, incrementallearning step. Another eight or ten new additional keystrokeswill provide users with a powerful communications solution.
Building on Enhanced Services
Providers can significantly increase their marketability by of-fering some or all of these enhanced services. It is interestingto note how local number portability, now an FCC mandate,may affect the impact of enhanced services. While personalnumber service may be a good selling point at this time, thereis a chance that it will no longer be valuable as a commoditywhen it becomes possible to transfer numbers between carri-ers. Nevertheless, this may not be such a major concern: Evenif a competitor tries to lure customers from their originalprovider, the competitor may not be able to offer all of the en-hanced services that these customers want. Even with num-ber portability, then, providers who offer enhanced serviceswill have an advantage.
W I R E L E S S
Primary fax
GeneralfaxCurrent line(fax, PC)
Pager,SMS
MWIvia
Benefits:• Adds Another Communication Method for Mobile Subscribers• Premium Service, Drives Revenue• Keeps Documents Confidential
Fax Message
F I G U R E 7Personal Number Service
F I G U R E 6Fax Messaging
Subscriber Options:• Connects to caller• Forward caller to voive mail• Redirects caller to assistant

19 9 8 A N N U A L R E V I E W O F C O M M U N I C A T I O N S ■ 887
M I C H A E L G U L L E D G E
The key to building on enhanced service product lines is mod-ularity. This provides both the provider and the subscriberwith a great deal of flexibility. Indeed, many subscribers donot need all of the services mentioned above. Some may besatisfied with just voice messaging and direct dialing. Somemay want direct dialing and personal number services, butnot facsimile services. Others may want all of the available ser-vices. What is important to remember is that people differ inhow they communicate. Being able to deploy these services ef-fectively and easily in an incremental fashion should help toincrease the penetration of some of these kinds of services.This is why deployment as a service node is recommended.
Carrier Issues
There are some significant areas to be addressed by wirelesscarriers, including billing, distribution, and focus. Deployingenhanced services requires a billing strategy. Generally, com-panies offering billing solutions do not like calls that originatefrom somewhere other than the mobile telephone switchingoffice (MTSO). This can be problematic, since many enhancedservices platforms initiate calls to locate someone on the per-sonal number service, deliver a facsimile, or make an out-bound call. This can be confusing to billing systems, whichraises questions involving how to rate calls that come into thenetwork from something other than the MTSO.
To solve this problem, carriers are exploring the possibility ofdebit and/or prepaid solutions. Debit and prepay are meter-type services not only for core services, but also for the out-bound services that some customers may have relating toenhanced services. Switch-based billing is another option andwould involve relaying calls back to the switch as though themobile unit had made the telephone call. This would clarifythings for the billing system, creating something that lookedlike a normal, switched-call detail record. This solution has yetto be refined and, again, requires a particular carrier strategy.
There is also pressure being placed on billing companies tooffer more flexible, open types of billing systems. In the past,billing companies have actually impeded carriers, since someservices were so complicated to bill that carriers simply couldnot offer them. Now, however, with increased competitionand the value of enhanced service, carriers are pushingharder for flexible solutions that will allow them to offer moreservices and hence create a differentiation strategy.
Distribution is another critical issue, in terms of both core ser-vices and ancillary services. Many companies are not ade-quately encouraging their sales forces to concentrate onenhanced services. Many customers have not bought en-hanced services because they have not been encouraged to doso. This is because representatives are paid a far smalleramount to sell a voice mailbox than to sell a new number.
If it is true that enhanced services and customer retention isthe way of the future, then more attention must be paid to theway that distribution channels are compensated. There cer-tainly needs to be new distribution channels, perhaps morerelated to telemarketing or other alternative distributionchannels than to direct-agent sales. Many carriers have hadsuccess with specialized telemarketing or enhanced-servicesrepresentatives who have received training in selling particu-lar services. This type of training would probably be the re-sponsibility of the vendor.
Finally, carriers must consider their focus. Many people con-sider enhanced services from a very high level, never reach-ing the market level in terms of how important these servicescan be. One way to change the focus is to make executivesaware of the potentially powerful return on investment fromdeploying enhanced services. In general, if the people at thehead of an organization understand the revenue-generationcapabilities of a set of services, then their importance will becommunicated throughout that organization. If everyonethen understands the importance of enhanced services, thedecision can be made to actively market them.
Conclusion
There are several important results of a successful enhanced-services product line. First, it will provide carriers with prod-uct differentiation and the ability to offer services that theyknow their customers need and want. Second, it will be possi-ble to generate new and diverse revenue streams. Many ofthese revenue streams exist now, but through different net-works. Finally, an enhanced-services product line will addsubscriber value.
When considering enhanced services, providers should allowreturn on investment to drive their strategy. The provision ofthese services should be looked at it in its entirety rather thanconsidering each point solution separately. This will allowcosts to be leveraged and return to be gathered from differentsources.
Multiple application platforms—that is, platforms deployedas service nodes—allow the most flexibility to deploy ser-vices, test new services, and solve administrative and technicalissues. Overall, however, providers must remember that thefocus should always be on the services. Services should beeasy to accept, flexible, powerful, and cost-effective to deploy.By providing these type of services, carriers should be able toattract and maintain a larger customer base than companieswho do not offer enhanced services, while at the same timedrawing “easy” revenue.

19 9 8 A N N U A L R E V I E W O F C O M M U N I C A T I O N S ■ 889
Just as the wireline portion of the telecommunications indus-try is grappling with local number portability, so is the wire-less part of the industry. From a standards perspective, manydecisions remain regarding how Interim Specification 41 (IS-41) protocol implementation will support local number porta-bility. The Cellular Telecommunications Industry Association(CTIA), specifically through the TR45.2 group, will outlineparticular protocol changes.
In addition to concentrating on the effects of local numberportability (LNP) on IS-41, it is important to recognize simi-larities or differences that service providers who have imple-mented Global System for Mobile Communications (GSM) inthe United States may encounter when implementing LNP inthe wireless environment.
Overview of Cellular Networking
Figure 1 is a cellular network reference model. From its in-ception, cellular started as an intelligent network. In fact,cellular inherently operates according to geographic porta-bility because a wireless terminal allows a user to roamanywhere.
The upper portion of Figure 1 correlates to intelligent net-work (IN) applications in the wireline environment. This in-cludes the visitor location register (VLR), the home locationregister (HLR), and the authentication center (AC). The HLRmanages subscription and location information and is de-ployed either as a stand-alone element or integrated withthe MSC. The AC manages authentication information andis usually integrated with the HLR. The visitor location reg-ister provides temporary subscription and authenticationstorage and is usually integrated with the MSC. Informationfrom all of these control points is communicated to andfrom the MSC via either the IS-41 protocol or in GSM via theMAP protocol.
The MSC compares to a service switching point (SSP) in thewireline environment. It provides a call switching functionbetween the public switched telephone network (PSTN)and the radio network and has at least two modes of opera-tion: a serving and an originating mode. In the originatingmode, the MSC receives a call entering the wireless net-work; in the serving mode, the MSC uses the base stationcontroller (BSC) to allow the wireless subscriber communi-cation. The BSC provides radio transport and cell-site con-trol functions.
Numbering and Identification
To make a wireless network operate, numbering and identifi-cation terms have been created, and these must be under-stood in order to appreciate the impact of LNP on wireless.The first concept is a mobile directory number (MDN), whichis essentially the subscriber’s phone number. Depending onthe network, it is either a 10-digit North AmericanNumbering Plan (NANP) string, or a 15-digit E.164 format.IS-41 revisions A and B are NANP-specific, althoughRevision C and all GSM revisions support the E.164 format.The GSM term for mobile directory number is MS-ISDN ormobile station ISDN number.
The second dialed number in the network is a temporarylocal directory number (TLDN). This number is used for rout-ing calls to mobile subscribers when they are roaming. It is asimilar concept to a location routing number (LRN) and localnumber portability with the exception that these numbers aredynamically allocated on a per-call basis. As such, they aremanaged by the serving MSC.
There are two station identification numbers in existence. Allthe analog mobiles in the world today support a mobile iden-tification number (MIN), which is a fixed 10-digit number. Itwas invented in the United States and is patterned after theNANP. International markets have developed ad hoc stan-dards groups to create international numbering conventionsfor specific countries.
Wireless Local Number PortabilityKenneth A. GustafsonMember of Technical Staff, Cellular Infrastructure GroupMotorola
F I G U R E 1Network Reference Model

890 ■ 19 9 8 A N N U A L R E V I E W O F C O M M U N I C A T I O N S
The second number, which offers a long-term solution, is theinternational mobile station identification (IMSI). This is avariable-length number that can be as many as 15 digits long.It contains a mobile country code and a mobile network code,and it is managed by the International TelecommunicationsUnion (ITU). The newer digital protocols in the United Stateswill support IMSI, and the GSM protocols will do the same.
There are a number of global title translations (GTTs) thatoccur within a cellular network. The first one is a MIN-to-HLR translation. Typically, this is implemented as a six-digittranslation, and it is performed either in a serving MSC or in asignal transfer point (STP) somewhere in the network.
The second translation introduced by IS-41 revision C is anMDN-to-HLR translation. This is also a six-digit translation,and it is only performed within the originating MSC functionin the network.
For systems that use IMSI, there is an IMSI-to-HLR transla-tion that is supported in these networks. This translation is ofvariable length (3 to 6 digits) because of country codes, net-work codes, and construction of the IMSI. This is performedin a serving MSC or STP.
Registration Procedure
The registration procedure in a cellular network allows a cel-lular phone that is moved into a new market to communicatewith the home system. That system has to send an indicationto the user’s home system so that it knows the user’s currentlocation. This is accomplished through registration.
The registration message flow requires the serving MSC to usethe global title translation (GTT) capability within an STP toreach the home location register of the subscriber (see Figure 2).The serving MSC must first select the STP based upon a localanalysis of the MIN. The STP will then perform a completeGTT and route the message to the subscriber’s HLR. The HLRwill update the location and issue a response back to the serv-ing system containing the subscriber’s profile. In most cases,the STP is part of the home network, serving as a gateway STPthat allows the home network to move subscribers betweenHLRs without affecting translations in serving system markets.
The origination procedure in cellular is fairly simple (seeFigure 3). Because a copy of the subscriber data was sent tothe VLR during the registration transaction, the serving sys-tem can completely process call attempts by the subscriberwithout involving the HLR. This is designed to achieve effi-ciency in performance and increase the number of transac-tions on the network.
The termination procedure involves an originating MSC (seeFigure 4). When a call comes in for a subscriber, the HLR isqueried for the location. The HLR forwards a request to theserving system for a TLDN, which is subsequently returnedto the originating switch. At that time, the call is routed usingthat TLDN from the originating switch to the serving switchusing PSTN trunking.
The operations involved are called the location request,which is routed from the originating MSC to the HLR usingthe six-digit MDN-to-HLR translation. The HLR then formu-lates what is known as a routing request, which is sent fromthe HLR to the serving MSC where the temporary routingnumber is allocated.
Wireless Local Number Portability Architecture
There are many similarities between the wireless and wirelinelocal number portability architectures. This is sensible be-
W I R E L E S S
F I G U R E 2Registration Procedure
F I G U R E 3Origination Procedure
F I G U R E 4Termination Procedure

19 9 8 A N N U A L R E V I E W O F C O M M U N I C A T I O N S ■ 891
cause in terms of numbers, cellular phone numbers are still asubset of the total number of lines in the nation, and it wouldmake the most sense to leverage as much of the wireline LNPwork as possible.
The assumption is that the wireless carrier’s network wouldcontain a local service order administration or service man-agement system. Within this wireless carrier’s network, theHLR and an additional local number portability SCP functionare included (see Figure 5). This could be on a traditional SCPor it could be built within an STP. There are a number of waysin which these functions can be implemented. There is also theneed for STPs within the wireless carrier’s network as well as arequirement for ISDN user part (ISUP) connectivity betweenthe wireless carrier and the other access carriers in a region.
Architectural Impacts of Wireless LNP
Wireless LNP requires the introduction of an LNP-SCP intothe network. This LNP-SCP will need to support the wirelinedata model in order to maintain a single provisioning modelfor all types of carriers. In addition, the wireless LNP-SCPwill need to support the trigger format from the wirelessswitches. Wireless switches—IS-41 switches, for example—generate IS-41 triggers; they do not generate advanced intelli-gent network (AIN) triggers.
The serving MSC function is also affected by LMP. The firstfactor is support for an office-based trigger similar to what isbeing added to the AIN implementation in wireline. There isalso a need to support outbound LRN call generation. Theoriginating MSC function must support the inbound LRN callbecause the originating MSC will potentially receive callsfrom ported numbers. In addition, the STP function in thenetwork will now have to route queries to the LNP-SCP.
One of the main impacts of LNP on cellular is its effect on theregistration scheme. The reason for this is the convention ofusing the MDN as the MIN assignment in analog phones.Virtually every analog phone in the United States today hasthe mobile directory number planted in the handset.
This creates a problem because the serving systems need todetermine a user’s home carrier when the phone is turned on
outside the home serving area. The reason for this is that op-erators have multiple roaming and routing agreements forqueries that are carrier-specific. LNP changes all the rules be-cause it will be impossible to determine a home carrier basedon the phone number alone. As a result, this will be thebiggest factor to affect cellular.
Potential Solutions for Registration Issues
Three principal registration solutions are available. The first ismobile directory number-based, a solution that will allow theindustry to keep the mobile directory number in the cellularphone as it is today. The second solution would involve atransition IMSI. The third solution is to use what has been themobile directory number and change it into a logical identifier.
The mobile directory number–based approach involves alarge amount of IN equipment (see Figure 6). Using this solu-tion requires multiple translations to register a mobile unit be-cause the serving system must query an LNP-SCP to retrievethe ten-digit translation of the mobile directory number so thatthe registration can be routed to the proper carrier and HLR.
Figure 7 shows MDN-based registration in IS-41 messages.When the registration occurs at the serving system, the vis-ited serving system would generate a registration notificationby employing mobile directory numbers. This would berouted to an STP located in that serving system’s market. Partof the purpose of the STP is to support redundancy of theLNP-SCPs in the serving region. It is important for the archi-tecture to support replication of these elements due to thenumber of transactions that will occur.
This STP essentially performs a partial GTT and routes it toone of the LNP-SCPs in the serving market. This LNP-SCPwould need to use the MDN to determine the address of agateway STP for that subscriber. Once this is determined, itcan reroute the registration to the appropriate gateway STP,which would perform the final GTT and respond directly tothe MSC-VLR in the serving region.
The obvious benefit is that this solution is currently compati-ble with IS-41 Revision B. There are no fundamental IS-41changes required to support this. However, there are numer-
K E N N E T H A . G U S T A F S O N
F I G U R E 5Termination Procedure
F I G U R E 6W-LNP Architecture

892 ■ 19 9 8 A N N U A L R E V I E W O F C O M M U N I C A T I O N S
ous drawbacks, the first of which is a nationwide databaseproblem requiring MIN-to-HLR information to be propa-gated to every serving system in the United States. Currently,the LNP information is propagated within a rate center, butthis would open it up to the whole country.
Another problem is the introduction of wireline NPAC in-compatibility because of the added HLR address informa-tion. It also adds an LNP dip for registration. In cellularnetworks, registrations tend to be the largest transaction be-cause of the rate at which people move around, meaningsuch a configuration would add even more overhead to thecellular network.
The second possible solution is IMSI-based registration (seeFigure 8), which is much simpler. In new GSM systems, or thenewer cellular systems, the IMSI has a separate numberingrange from the MDN now in the mobile. Therefore, it is easyto program the IMSI to relay to the home network of the sub-scriber and allow registration to occur without introducingextra hardware and software into the network.
A translation protocol is defined in IS-41 for IMSI-to-HLRtranslations (see Figure 9). This serving system examines themobile country code and mobile network code digits (gener-ally the first five or six digits of the IMSI) to determine thegateway STP of the home carrier for that subscriber. This STP
can do the final GTT and route the registration to the properHLR, which will open a direct path back to the serving sys-tem when responding with profile information.
One benefit of using IMSI is the international numberingscheme, since the traditional ten-digit numbering system didnot extend well into the international scheme. The IMSI fixesthat problem by using a large, hierarchical numbering space.For example, just a few digits indicate the operator involved.In the United States, provisioning global title tables withincellular switches involves thousands of ranges that must bepopulated because of the layout of the NANP. The IMSI re-duces this process to one range per operator.
A main disadvantage to this approach is that it requires IS-41Revision D. Revision C has just come out, so it would be verydoubtful that revision D could be finished, validated, and de-ployed in time to make the Federal CommunicationsCommission dates for LNP. In addition, the ten to fifteen mil-lion analog cell stations in use will not support IMSI.
The final option for solving the registration problem is to re-tain the MIN, but not to encode the MDN in it (see Figure 10).The objective is to place another number in the MIN that cancoexist with the currently assigned MDNs, but to allow thenetwork to identify the home carrier more directly. With suchan approach, the routing of the network becomes similar tothe routing in IMSI, in which the serving system can route therecords to gateway STPs in the home market for registration.
W I R E L E S S
F I G U R E 7MDN-Based Registration
F I G U R E 8IMSI-Based Registration
F I G U R E 9IMSI to HLR Translations
F I G U R E 1 0

19 9 8 A N N U A L R E V I E W O F C O M M U N I C A T I O N S ■ 893
From an IS-41 perspective, the MSC/VLR would be used inthe registration notification (see Figure 11). Because this is nota true MDN, the six-digit analysis that occurs in this servingsystem can be used to determine the gateway STP for thathome market. Once it is routed there, that STP would per-form its normal six-digit final translation on the registrationrouter and allow the registration to complete.
To make this work, the MDN must be returned to the servingsystem during registration because the MIN is no longer ade-quate for billing and calling line identification purposes. Anew IS-41 parameter must exist to pass back the actual direc-tory number during the registration process.
With this system, analog mobile stations can be supportedwithout any change, which is a great benefit. Customers withexisting units who want to port to another analog carrier willbe able to do so. Debates within the CTIA ensue, however, sothe proposed solution is still in flux.
This capability of passing back the MDN during registrationis an IS-41 Revision C feature. Revision C has just finished itsballot, so a race to update U.S. carriers to Revision C function-ality will have to take place, or else there must be other work-arounds that will allow the installation of nonmobiledirectory numbers in phones.
Once again, international numbering conflicts have to bedealt with due to the analog problem. In addition, subscriberswill have the added complication of the subscribing unit notknowing the MDN value anymore. A potential for confusingsubscribers exists because the operation of a subscribing unitwill change somewhat. This is similar to the registrationstory. Hence, using the base registration approach is reallythe only practical solution at present.
On the other hand, mobile origination is much simpler, be-cause it uses straight mapping into the LRN method (seeFigure 12). This requires the introduction of office-based trig-gers at the serving MSC. There must also be a way to informthe switch that it should generate the appropriate forwardcalling indicators and ISUP for gap parameter handling spec-ified in the LRN method. These are issues that TR45.2 willconsider as they develop IS-41 protocol support.
The Network Perspective
Although an STP is not shown in Figure 13, a local STP willdistribute queries from the serving switch to the LNP data-base. When a call is made, a query is generated from a serv-ing MSC to the LNP database. The SCP will determine theLRN associated with the called number and return this infor-mation to the serving MSC.
IS-41 has an existing trigger message called the origination re-quest. Currently, the plan is for this message to be extendedto support office-based triggers, providing the ability to spec-ify that the LRN routing is being performed. Once that triggerresponse is received, the ISUP destination number will be as-signed to the LRN, and the gap parameter will have the orig-inal directory number (DN). The forward calling indicatorwould show that the translation function had been performedalready so that the call can be properly routed.
Figure 14 shows what happens on the mobile terminationside. Because the MSC needs to recognize the reception of aninbound call from a ported number, it will use the gap para-meter for the called-party address instead of the DN. Theremust be an option to generate a wireless LNP trigger if thecall is not translated, and the MSC will need to have the abilityto generate that trigger. If the call was translated, an IS-41 lo-
K E N N E T H A . G U S T A F S O N
F I G U R E 11MTN-Based Registration
F I G U R E 12Mobile Organization
F I G U R E 13Mobile Organization

894 ■ 19 9 8 A N N U A L R E V I E W O F C O M M U N I C A T I O N S
W I R E L E S S
cation request is generated. Some work has to be done withTLDN-delivered calls to indicate that the call was translated. Itis not efficient to route a call via TLDN and force the servingsystem to do an LRN dip, because it was just queried previ-ously to acquire the number.
When the call enters the wireless network from the servinglocal exchange carrier (LEC), the LNP database would havebeen previously queried for an LRN (see Figure 15). The LRNcall would be delivered to the MSC-VLR and the cellular net-work serving as the originating switch. This MSC-VLR willquery the HLR for the routing information of the subscriber,and then route the call to the serving subscriber.
In terms of messaging, if a LEC were originating the call, anIAM message would go to what would presumably be an-other switch within the PSTN. When the call comes in fromthe PSTN, the initial address message (IAM) prompts theMDN-to-HLR translation in order to generate the location re-quest, which is sent to the HLR. The serving MSC-VLR thenreceives back the TLDN for routing the call.
Other Issues
One issue of concern with the dawning of LNP is mobile-to-mobile call routing optimization, and another is number man-agement within the HLR. Figure 16 shows the routing flow ina mobile-to-mobile call. A serving MSC-VLR queries an LNPdatabase, after which the call is sent across the PSTN to anoriginating MSC-VLR switch that happens to have the LRN
assignment. This originating switch will have to do a queryonce again from a serving switch.
One of the most obvious inefficiencies is routing the callthrough three switches that might be in the same carrier’s net-work. Eliminating one of these switches from the route willreduce a carrier’s operational expense. Work is needed to op-timize the LRN procedure in order to prevent such occur-rences. Furthermore, two database dips are happening. Everymobile-terminated call will hit an HLR and an LNP-SCP. Inthe wireless competitive market, it would be beneficial tominimize extra queries and call routes.
A possible solution is to combine the LNP query functionalityinto the location request query functionality, which makessense for a wireless carrier when they use their original num-ber blocks because fewer than one percent of mobiles may beported out of those blocks.
Without integration between the location request and theLNP query, two messages are required. However, if theswitch generates a location request for certain number blocksand handles ported numbers as an exception, 99 percent ofsubscribers could be terminated in a single query, whichwould be a fairly substantial cost benefit for operators.
HLR Number Management
An important issue in the area of HLR number managementis MDN-to-HLR mapping. Over time, LNP will result in avery sparse mapping of MDNs to the HLR. Today, blocks ofnumbers are given to wireless carriers. The wireless carriersknow that the entire block happens to be on an HLR, andLNP will make that mapping sparse. This creates problemsfor network planners. If a competitor goes out of business, or asuccessful marketing campaign attracts new subscribers whowere using the competitor before, then a block which used tohave one active number in it may now have a thousand. Thiscreates havoc in terms of planning, because HLRs have finitetransaction capacity, especially if they are switch-based.
Additional issues with multiple MDNs exist as well. This isespecially true with GSM, where there can be more than onedirectory number pointing to a subscriber, which may be sup-ported by IS-41 as well. This creates more complex mappingdue to the added possibility that two MDNs may need topoint to the same subscriber, but their GSM global titles havebeen directed to two different HLRs. It seems the perfect so-lution is to use a ten-digit translation like an LNP-SCP ap-proach to route the MDN to the serving HLR. There are costissues associated with this, however, especially for smallercarriers. The most economical solution may be larger, central-ized HLRs that allow for more number ranges to be concen-trated in a single network element in order to help sitesovercome such problems.
Summary
Wireless LNP is leveraging off the wireline architecture. Inparticular, the industry is leveraging off the SCP data modelso that all the work being done on provisioning and by the
F I G U R E 1 4Mobile Termination
F I G U R E 1 5Mobile Termination

19 9 8 A N N U A L R E V I E W O F C O M M U N I C A T I O N S ■ 895
local utility commissions does not have to be redone or mod-ified for wireless. The ISUP LRN routing method makes sensebecause wireless numbers are a minority, so it is practical toconform to the practice of the wireline network with respectto call routing.
The CTIA has chosen the MIN-based registration method.Wireless LNP may turn out to be a killer application for largecentralized HLR platforms, because as numbers become in-creasingly scattered, it may be more cost-effective to install alarge, centralized platform that can handle more numbersthan to perform increasingly complicated AIN routing.
K E N N E T H A . G U S T A F S O N
F I G U R E 16Mobile Origination (to Wireless)

19 9 8 A N N U A L R E V I E W O F C O M M U N I C A T I O N S ■ 897
Over the last decade, the growth of wireless services world-wide has been strikingly high. This trend is likely to continueas more and more people in the world discover the benefits ofwireless communications. Unfortunately, there are manyareas in the world where it is not economical for wireless op-erators to deploy service using traditional switching architec-tures. In these areas, the required infrastructure, technicalknowledge base and subscriber density is low. A potential so-lution to this dilemma lies with a concept called distributedwireless switching. This concept is based upom small, scal-able, full-featured wireless switching platforms specificallydesigned for profitable use in rural and other low-traffic mar-kets. This essay will discuss the target market for distributedwireless switching, compare and contrast it against tradi-tional wireless architectures, and show how it can be appliedspecifically to a digital architecture such as global system formobile communication (GSM).
Distributed wireless switches are generally extremely smalland can support approximately 15,000 to 20,000 subscribers.They are full-featured wireless switching platforms based onnonproprietary technology with an emphasis on theclient/server concept. The switches tend to push intelligenceand processing power closer to subscribers and end users,and they use off-the-shelf hardware, such as Intel processors.As a result, the switches themselves are extremely low-costand follow the computer industry’s cost curves (e.g., Moore’sLaw), where processing power continually doubles andprices are consistently cut in half. Most importantly, sincethey are small switches, interoperability with multiple ven-dors is a must. Therefore, distributed wireless switches areopen and follow standard interfaces, wherever those stan-dards are defined.
Market Characteristics
Distributed switches are specifically designed for low trafficdensity areas. A low-traffic density market is one with a tele-density (telephones per head) of 1 percent or less.Traditionally, these areas are not well served through standardwireline or wireless telecommunications. They have either ex-tremely old public switched telephone networks (PSTNs) or noPSTNs at all. These are very dispersed areas, such as remotevillages, towns, and small cities surrounding larger cities andareas with some form of geographic barrier. Poor infrastruc-
ture, no roads, and a lack of power facilities make the businesscase for installing telecommunications networks in these areasvery difficult. These characteristics are not unique and tend todescribe rural markets worldwide.
In the United States, wireless operators always build out theirnetworks in large cities first. This makes sense in countries likethe United States, where population is concentrated in cities.However, 70 percent of the world’s land area and populationare not in big cities. They live in low-traffic density areas (orrural areas) worldwide. Operator tendencies to concentrate pri-marily on cities has lead to the following startling statistic: Halfof the world’s population has never made a phone call andhave no access to telecommunications. For example, 99 percentof the one billion people who live in India have no access totelecommunications. To compare this statistic to the UnitedStates, it would be necessary to look back to the 1920s. Eventhen, the general store in a small town had a pay phone and aprivate operator. This does not exist in India. In sub-SaharanAfrica, 99.5 percent of the people have no access to telecommu-nications. When telecommunication services have been madeavailable to these rural areas, especially wireless service, themarket penetration rates exceeded those in larger metropolitanareas. The reason for this is that the population needed the ser-
The Business Case for DistributedWireless SwitchingMartin A. IroffSenior Consultant San Francisco Consulting Group
Worldwide TeledensityWorldwide Teledensity
ÒThe per capita GDP relationship between the Haves and Have Nots of Teledensity implies that the cost per linemust decrease by 75% to 80% before emerging markets can fully be served.Ó Montgomery Securities
Complied by Bear Stearns
0
10
20
30
40
50
60
70
en
sit
y
F I G U R E 1Worldwide Teledensity
Tel
eden
sity

898 ■ 19 9 8 A N N U A L R E V I E W O F C O M M U N I C A T I O N S
vices much more. They also needed wireless much more. Inrural areas, people are not tethered to a specific location, suchas an office. A farmer, for example, is out in the field with atractor. The only way to reach him is through a cellularphone. Less-developed regions such as Latin America, Brazil,African countries, Southeast Asia, China, and India are theareas with the lowest levels of teledensity penetration (seeFigure 1). Interestingly, Sweden—not the United States—isnumber one in teledensity.
The market requirements for low traffic density rural areasare different and much more stringent than for high trafficdensity areas. Because there is a very low initial subscriberbase, start-up costs must be extremely low. The initial vendorequipment needed must be inexpensive. It also must bequickly and easily deployed in order to make the businesscase positive. Since low traffic density areas have little experi-ence with telecommunications service, people will line up toget it once service is in place. Therefore, support for incre-mental network growth is important. The equipment must beoptimized for low-traffic density areas and must be able to ac-count for poor infrastructure, poor power facilities, and diffi-cult terrain.
In addition, the network must be extremely easy to maintainand operate on a day-to-day basis. The switch itself has tobe extremely easy to operate remotely without much train-ing. The power requirements for a switch or a base stationhave to be similar. For instance, the switch might work offthe same facilities as the base station being deployed so as tosimplify colocation.
Proven technology must be used in order to keep the tech-nology risk as low as possible. Any problems that requiresending a person out to the site sacrifices profit because ofthe high travel costs to get to these areas. Proven technologythat has progressed as far as possible down the experiencecurve and that has been reduced in cost because of mass de-ployments elsewhere is essential before entering a low trafficdensity market.
In light of these requirements, the best technologies to ini-tially investigate for low traffic density markets today wouldbe analog technologies such as advanced mobile phone ser-vice (AMPS) or digital technologies like GSM. For the near fu-ture, they will have the largest market share worldwide.AMPS or analog technology seems to be decreasing with thegrowth of digital technologies such as GSM and code divisionmultiple access (CDMA) (see Figure 2). Again, the best choicesare the ones that are already available and that have gone asfar down the cost curves as possible.
Comparing Architectures
The traditional architecture used for wireless networks is acentralized switching system deployed in a major metropoli-tan area. Essentially a telephone company mainframe, it is anextremely high-cost, large, centralized system that is very reli-able, but requires complex support to operate and maintain.It was not designed for low traffic density areas, but to serve alarge number of people in metropolitan areas at a low sub-scriber cost. Such systems are not suitable for the majority ofthe world’s land areas.
W I R E L E S S
Large CityMTSO
PSTN
Terrestrial Microwave Transport
Remote Location - Village, Small City
¥ Traditional Architecture
¥ High Transport Cost¥ Increases with Distance¥ Not Flexible
Local
BTS
Microwave tower Microwave tower Microwave tower Microwave towerRemote
BTS
F I G U R E 3Traditional Approach for Serving Rural Areas–Backhaul
0.0%
10.0%
20.0%
30.0%
40.0%
50.0%
60.0%
70.0%
1994 1995 1996E 1997E 1998E 1999E 2000E
Sh
are
GSM
Analog
PDC
CDMALow Mobility
D-AMPS
Source: UBS Securities LLC
GSM and/or AMPS are the best technology choice forRural, Low Traffic Density markets
F I G U R E 2Market Share by Wireless Technology

19 9 8 A N N U A L R E V I E W O F C O M M U N I C A T I O N S ■ 899
There are several different ways of deploying the traditionalwireless architecture to serve large, low traffic density areas.The most common approach is called backhaul (see Figure 3).Essentially, a large mobile telephone switching office (MTSO)already deployed in a large city is connected to a remote basestation placed out in a village or small town to cover thatarea, with some type of transport facilities between the two.Terrestrial microwave is by far the most common transportfacility. The problem with this approach is the extremelyhigh-cost of these long-length transport facilities. Also, the ar-chitecture is not very flexible. This approach serves two com-pletely different markets with essentially the same softwareand the same feature set. The costs also increase dramaticallywith distance. For example, if a village is 50 or 60 miles out-side of the large city MTSO, the terrestrial microwave back-haul may be much more expensive than installing a switchthere. This situation highlights the case for distributed switching.
Distributed switching takes the traditional MTSO and ex-plodes it into its different components (see Figure 4). Theswitching component is deployed close to the end user,pushing the intelligence of the switch close to the customer.The signaling components and the network managementcomponents can be shared across many different distributedswitches. For instance, the IS-41 gateways or GSM map ap-
plication can be shared across many different distributedswitches. Operations, maintenance, administration, and pro-visioning (OMA&P) can be performed either through cen-tralized locations or on an individual node basis. All thisreduces costs and simplifies the equipment actually locatednear the customer.
To use distributed wireless switching instead of the backhaulapproach, a single base station is deployed along with a dis-tributed switch out in a remote location (see Figure 5). This ap-proach provides great flexibility. The public switchedtelephone network (PSTN) facilities can be used where theyare available for backhaul and connectivity to the largecity–based mobile telephone switching office (MTSO).Distributed wireless switching keeps local traffic local, so asnot to place any burden on the large-city MTSO. This also re-duces opportunity costs since large MTSO capacity is not usedto serve remote locations and can be better used to serve morelarge-city customers. Common resources are shared, such asthe signaling hub for roaming between distributed switchesand the large city. The entire system can also be managed ei-ther from the large city or out in the remote location.
The space requirements for these small distributed switchesare the same as the base stations. A distributed switch couldfit easily in the same rack as a base station, or next to it. Thepower requirements are very low, so an existing powersource that is already serving the base station can probably beused for the distributed switch as well without any additionalupgrades. Distributed wireless switching is extremely scal-able for growth. Additional base stations can be added toserve more subscribers out in the remote location, or anotherlocation can be added with a distributed switch and addi-tional base stations. Importantly, these switches are extremelyeasy to operate. Their network management systems arebased on a Windows 95 graphical user interface (GUI) as wellas Internet browser technology, making them extremely easyto learn and use.
Comparing Cost
Microwave is the largest incremental cost component of thebackhaul architecture. There is the microwave equipmentcost, the cost for the microwave license if required, towercosts, and real estate costs for the towers. With a flat terrainand good weather conditions, the microwave cost may bemodest; however, this cost quickly increases if the terrain in-cludes jungle or mountains. For example, four or five mi-crowave hops may be required to go around a mountain.Traffic engineering costs also must be considered. These arethe opportunity costs of taking traffic capacity off the large-city MTSO and using it for a remote area. There also may beincremental PSTN costs or satellite interconnection costs dueto the incremental traffic. Additionally, there are the costs oftraining workers on the new microwave facilities and makingsure that the microwave link is continually up and running.
On the distributed switching side, the largest incrementalcosts are for the switching equipment, which includes net-work management and signaling for roaming. Network man-agement and roaming can both be shared across numerous
M A R T I N A . I R O F F
OAM&P For
All Network
Components
Distributed andNetworked
Switches
IS-41, GSM MAPApplication
Processors
TraditionalMTSO
MSC
MTSO
Visitor Location
Register
Operations, Admin.,
& Maintenance
Base Stations
Explode Traditional Wireless Switching into base components
Home Location
Register
Large CityMTSO
PSTNGlobalHub Series II
Optional NMS
RS-232/422
X.25
Large City
Signaling Hub8
GlobahHub Series II
Distributed SwitchE1E1
Remote Location - Village, Small City
¥ Distributed Architecture¥ Lowers Transport Costs¥ Increases Flexibility¥ Scaleable for growth
¥ Shared common resources (NMS, billing, signaling)¥ Small footprint¥ Easy to operate and maintain
Local
BTS
Optional NMS
Co-located
Co-located
Remote
BTS
F I G U R E 5Distinuted Wireless Switching Approach for Serving RuralAreas (BTS: Base Transciver Station; NMS: NetworkManagenment System)
F I G U R E 4Distrinuted Switching

900 ■ 19 9 8 A N N U A L R E V I E W O F C O M M U N I C A T I O N S
distributed switches, spreading out the cost across a largersubscriber base. There may be additional access fees for cer-tain PSTN calls. These are the calls that normally would routethrough the large-city MTSO in a traditional architecture butare now sent directly to a PSTN connection by the distributedswitch. This cost can be viewed as a revenue opportunity ifsuch calls can be classified as long-distance to customers. Likethe backhaul approach, incremental PSTN facilities areneeded, along with data links to collect billing informationand bring it back to a centralized site. Staffing and trainingcosts to take care of the equipment will be extremely low be-cause of the simple user interface for network management.
Figure 6 compares the cost of backhaul versus distributedswitching. The break-even point is a 45-mile distance to thecity, or about two to three microwave hops (depending uponthe geography and terrain). This is a worst-case scenario, be-cause with more than one base station there is a larger sub-scriber base. The cost for distributed switching is essentiallyflat, while for backhaul it increases with distance and thenumber of remote sites served.
Distributed Switching for GSM
GSM was standardized over a ten-year period and was de-signed specifically for western Europe. Before GSM, westernEurope had cellular networks that did not communicatewith each other. They had very poor roaming with differentprotocols for each country. GSM is a great success andsolved these problems by standardizing everything.However, since it was meant for western Europe, which is ahigh traffic density area and GSM is also very expensive inits current form for deployment in a low traffic density area.The requirement for rural areas is to reduce backhaul by re-ducing all the different network components to just what isneeded to serve the low traffic density market. The idea istherefore to take the intelligent network components, whichfor GSM are traditionally oversized for large cities, and scalethem down appropriately for low traffic density areas.Instead of a home location register (HLR) that handles one
million subscribers, an HLR that handles 10,000 subscriberswould be used. The platform requirements to run thesecomponents are drastically reduced. In the spirit of open-ness, GSM’s common interfaces are preserved for growthand seamlessness.
Figure 7 illustrates one way of applying distributed switchingtechnology to GSM. The original standard GSM architectureis in the box at the bottom. The base station controller (BSC)is combined with the mobile switching center (MSC) and theintelligent network databases, such as the HLR, the authenti-cation center (AUC), the visitor location register (VLR), andthe equipment identity register (EIR). In a low traffic densityarea there likely would not be a need for more than one BSC.Therefore, in a low traffic density area, the BSC function is re-dundant if run on a separate processor initially. The goal is totake all of the basic GSM functions (e.g., MSC, HLR, BSC, etc.)and run them on a single hardware platform, while preserv-ing the common GSM interfaces that have been defined be-tween the network elements. This will allow the GSMfunctions now running on the same hardware platform to bemoved to separate hardware platforms any time in the futureand as the market demands. This significantly lowers the costof entry for GSM.
W I R E L E S S
Backhaul vs. Distributed Switching
-
100,000
200,000
300,000
400,000
500,000
600,000
700,000
800,000
900,000
15 30 45 60 75
Distance from Remote Site to Large City MTSO (Miles)
t P
rese
nt
Val
ue
($)
Backhaul
Distributed
F I G U R E 6Backhaul vs. Distributed Switching Results
Optimized for large / high traffic-density such as major metro areas
HLR
OMC
$200-500K $1.5-5M $150-500K
BSC
BTS
BTSMSC
$1.8 - 6M
F I G U R E 8Traditional GSM Architecture
F I G U R E 7Distributed GSM Architecture for Rural Areas (PLMN: PublicLand Mobile Network; SS7: Signaling System 7)
¥ Worst case scenario: single remote BTS
¥ Cost to Backhaul increases significantly with distance
¥ Distributed switching costs are essentially constant
¥ Break-even at less than 45 mile distance to city (or 2-3microwave hops)
Distance from Remote Site to Large City MTSO (Miles)
Backhaul vs. Distributed Switching

19 9 8 A N N U A L R E V I E W O F C O M M U N I C A T I O N S ■ 901
As Figure 8 shows, a traditional GSM architecture optimizedfor high traffic density areas will range from $2 million to $6million for an initial start-up configuration supporting a fewthousand subscribers. A large percentage of that cost is in theswitching component itself. With growth, the base stationswill become a larger percentage of the cost. For a distributedGSM architecture (see Figure 9), all of the components areplaced into a single platform, which makes for a much lowercost of entry. The radio frequency (RF) costs are about thesame, but the overall cost savings for deploying and activat-ing a network are approximately $1 million to $5 million. At15,000 subscribers, the cost savings is approximately 30% to40%, but at 3,000 subscribers it can be as high as 80% (seeFigure 10). The smaller the number of subscribers, the greaterthe cost difference.
One of the most important aspects of applying distributedswitching technology to GSM is that the architecture outlinedabove preserves the individual standard GSM functions.These functions exist as separate and distinct software entitiesrunning on a single hardware platform. They are completelymodular and can be physically separated, which allows forincremental growth. When run on different platforms, theycommunicate with each other and with other GSM networkcomponents through well-defined, standard GSM interfaces.There is nothing proprietary in the network.
For example, consider an operator starting off at year one (seeFigure 11). They buy an all-in-one system that contains anAUC, HLR, VLR, MSC, and BSC on one platform and whichsupports up to 10,000 subscribers. This system gets the opera-tor past the incremental hurdle and begins to generate in-come and build a subscriber base. The operator keeps addingsubscribers and can add another switch to increase capacitybeyond 10,000 subscribers. When they do this, they can sharethe HLR and AUC facilities between the two differentswitches. As the operator grows to three switches, they candesignate an MSC as a gateway switch, again sharing theHLR, AUC, and other intelligent network components be-tween the different switches, with a capacity now of up to20,000 subscribers.
As another example, consider an operator who has a GSM net-work already in place with a traditional architecture. This net-work has an existing large-city MSC with base stationcontrollers, but has coverage gaps in the network where sub-scriber density is low (see Figure 12). These low traffic densityareas are not currently covered because they are not cost-effec-tive to cover with the GSM traditional architecture. The opera-tor can easily place a distributed switch out in these low trafficdensity areas and connect it back into the large-city MTSO viaa mobile application protocol (MAP) link for roaming, if de-sired. This preserves the complete standardized GSM architec-ture. The operator can even manage the components centrally.
Network Design
Optimal network configurations are based on individual cus-tomer needs and applications. The design process for lowtraffic density areas is in most ways similar to larger metro-politan areas. However, some factors must be accounted forthat are normally taken for granted in a large metropolitanarea, such as where to put facilities and shelters. PSTN con-nectivity, calling patterns, power requirements, and trafficcharacteristics are important considerations and may drivedecisions concerning low traffic density areas. These factorswill help create the business case for which architecture theoperator should actually use. Also to be considered is the nor-mal RF coverage, number of cells, where to place the cells,where the switches can be placed within the cell sites, and thenumber of channels for each base station. Tower sizes and
M A R T I N A . I R O F F
10%
20%
30%
40%
50%
60%
70%
80%
90%
100%
50
Number of Traffic Channels
ffer
ence
150 350250 550450
X10,000 Subs
X5,000 Subs
X15,000 Subs
X 3,000 Subs
Comparison of sample average selling price based on equivalent network configuration
F I G U R E 1 0Distributed Architecture Price Advantage vs. TraditionalArchitecture
$500-800K
MSC/BSC/HLR/VLR/AUC BTS
BTSOMC
~$100K
$600 - 900K
F I G U R E 9Distributed GSM Architecture
Year 1 Year 2 Year 3
Start up system.Fully integrated.Up to 10,000 subs.
One of thedistributed switchesacts as HLR andGateway.15,000 subs.
Separated localdistributed switchingsystems fromHLR and Gateway.20,000 subs.
BSC
MSC
HLR
AuC
VLR
BSC
MSC
HLR
AuC
VLR
BSC
MSC
VLR
G-MSC
HLR
AuC
BSC
MSC
VLR
BSC
MSC
VLR
F I G U R E 1 1System Growth Plans

902 ■ 19 9 8 A N N U A L R E V I E W O F C O M M U N I C A T I O N S
transmitter power have to be considered as well. It is onlythrough careful planning and foresight that an operator canensure that a network design is optimal for the chosen sub-scriber base. This work is difficult and tedious and must bemonitored closely to assure that vendors, contractors, andconsultants address all factors important to the operator andpotential subscribers.
Conclusion
In summary, rural areas are excellent opportunities for wire-less operators, yet such opportunities must be approachedwith the right network architecture. The best technologies touse in these low traffic density areas are AMPS and/orGSM—at least initially—because they are the most proventechnologies to date. Distributed switching provides a key tosolving the entry cost problem to ensure a positive businesscase for these low traffic density areas. The small, scalableswitches are specifically designed with the needs of low trafficdensity rural markets in mind. They allow for rapid deploy-ment and rapid evolutionary growth in these markets, withlow start-up costs. The operator can grow as the subscriberbase grows and add components incrementally. Distributedwireless switching is extremely simple to operate and main-tain. It takes only a couple of hours to learn how to operatethe system. Distributed wireless switching is a better alterna-tive in many cases to backhaul using traditional switching ar-chitectures and should be considered.
W I R E L E S S
PSTN Other MSCs HLR
ExistingMSC
BSCBSC
Existing traditional GSM Networkinstalled in metropolitan or denselypopulated regions
NMS
Distributed Switching to complementthe system in sparsely populated and/orremote areas with local traffic
MAPBSC
MSC
VLR
BSC
MSC
VLR
OMC
F I G U R E 1 2Expansion of Existing Networks

19 9 8 A N N U A L R E V I E W O F C O M M U N I C A T I O N S ■ 903
Of all the new technologies and services emerging in thewireless arena, the government-mandated ones do not seemto be the most exciting. They are, however, extremely impor-tant. This paper will focus on one of these: wireless enhanced911 (E911). It will begin by offering some historical perspec-tive and will then outline the FCC mandate for wireless E911.Finally, it will offer suggestions about the future of wirelessE911.
Historical Perspective
Prior to the FCC mandate, wireless 911 services were sketchyat best. Wireless phone users could dial 911, press the sendbutton, and sometimes, in certain areas, be connected toemergency services. In some places it was necessary to dial adifferent code such as *999 to be connected to an emergencyservice provider. With this basic 911 service, the caller had toprovide all of the necessary information. A caller who couldnot provide a phone number or precise location was often notable to get assistance.
In the wireline arena, on the other hand, enhanced 911 serviceis provided to about 80% of wireline subscribers. With en-hanced 911, the calling-party information is provided auto-matically. When a subscriber calls 911, the name, address,and phone number of the caller are displayed on the emer-gency services terminal. In some cases, emergency medicalinformation may be displayed as well.
The dichotomy between wireless and wireline services wascause for concern. There were several reasons to focus oncomparable wireless and wireline E911 service. One of thesewas the growing popularity of mobile communications. Asmore people got mobile phones either for their cars or forgeneral personal use, wireless calls were making up 10% to25% of all 911 calls. This was particularly high consideringthat about 25% of these callers could not identify their exactlocation, or at least not exactly enough to make their locationknown to the public safety answering point (PSAP).
A first attempt to improve wireless 911 service was cell sitelocation–based routing; however, this was often geographi-cally inaccurate. A user could dial the necessary emergencynotification digits and be routed to public safety personnelbased on the serving-cell location, but due to the idiosyn-crasies of radio the serving cell may be far removed from thecaller’s location. This meant that users could be routed to apublic safety person in another region of the country whomight not know how to get to the caller, even if the caller
could identify where he or she was. Obviously, this causedproblems in trying to get assistance to the 911 caller.
A final area of concern was that even when a caller gotthrough to the PSAP, the call-back number might not beknown. When 911 is called from a mobile phone, emergencypersonnel may receive an indication that the call is comingfrom a mobile phone rather than the calling party number.Although wireless service has been improving consistently, itis still not unusual to be disconnected. Whether due to dri-ving through a tunnel, losing radio, or simple static, manycallers disconnect themselves or were disconnected. Since thenumber of the originating unit was unknown at the PSAP,personnel have no way of getting back to the caller. In somecases it was possible to provide a seven-digit automatic num-ber identification (ANI), which may or may not be the seven-digit directory number for the caller’s phone. However, evenwhen this was possible the proliferation of area codes made asimple seven-digit number fairly ineffectual. It is essential tohave 10 digits in order to get back to a caller, even when thecall is being placed from a home environment.
The FCC Mandate
Realizing that something had to be done to better enable mo-bile subscribers to access emergency resources, in August1994 a Joint Experts Meeting (JEM) was held concerning 911.This involved experts from the telecommunications industry,the FCC, wireless communications, and public safety person-nel. The goal of this meeting was to discover what would benecessary in order to offer enhanced service—that is, the abil-ity to provide information automatically—for 911 calls in awireless environment.
One result of this meeting was a prioritized list of emergencyservices features. These included location-based routing, call-related information, and system-congestion control. With lo-cation-based routing, rather than routing on the serving cellwhich may not be in the same geographic location as the call-ing party, an attempt is made to pinpoint the location of thecaller and route based on that location.
These features were then mapped to an evolutionary path.This was broken out into two phases of implementation, al-though some issues were left for the future. Information flowsbetween the wireless system and the emergency services sys-tem were developed for both phases. The information to beconveyed includes the calling party’s location and a full, 10-digit call back number. In addition, radio-based location tech-
Wireless Enhanced 911Betsy KidwellMember of Technical Staff, Wireless Standards DevelopmentLucent Technologies

904 ■ 19 9 8 A N N U A L R E V I E W O F C O M M U N I C A T I O N S
niques were studied to determine how they could be appliedto 911 service.
In November 1994 the FCC came out with a Notice ofProposed Rulemaking. This notice was based on the outputof the JEM and sent out to industry for comment. The Noticeof Proposed Rulemaking was designed to cover both PBXand wireless E911 service, because even landline PBXs hadsome issues with 911 similar to those being encountered inthe wireless industry. Basically, the notice was a call for com-ment on the proposed list of emergency service features, thelocation technologies, and the implementation schedule putforth by the JEM.
After going through some iterations with the proposals,September 1996 became the effective date of the final FCCruling on wireless E911. Again, the objective was to providewireless E911 service that would include automatic display ofthe calling party information. In the final order, the ruling ap-plied to cellular, broadcast PCS, and special-radio mobile li-censees. It expanded the original scope somewhat while alsoexcluding landline PBXs that had significant differences de-spite the similarities.
The mandate specified two phases of deployment. The firstwas to be implemented within 18 months of the September1996 date (that is, March 1998). After this date serviceproviders are expected to deploy E911 capability within sixmonths of receiving a request from the PSAP in their region,but vendors must have the capabilities available by March1998. Service providers may have more time to actually de-ploy enhanced 911, since the public safety equipment mustalso be upgraded. Phase 2 was to be implemented within fiveyears to allow the location technologies time to mature. Eventhough some good advances have been made, it was not feltthat the technology would be ready for practical use untilsomewhere around 2001.
Phase 1
Phase 1 includes many important aspects. One of the re-quirements is that all 911 calls be supported, including callsfrom non-subscribers. Any cellular phone user dialing 911,even noncode identified mobile units, should be connected
to a PSAP. In addition, a call-back number must be pro-vided. It must be possible to transport through the networkthe full, 10-digit mobile directory number of the callingparty to the PSAP.
The use of location-based routing is also mandatory. ForPhase 1, since sophisticated location technology is as yet un-available, every system must use a cell/sector routing mecha-nism, and each serving cell/sector will be associated with aspecific PSAP. It should be noted that this solution does notprovide the necessary granularity—there is still a chance thata caller might be directed to the wrong PSAP because of theidiosyncrasies of radio. Nevertheless, this solution does givea reasonable approximation of connecting the caller to theright PSAP. Finally, Phase 1 calls for support for TTY access.
Figure 1 provides an overview of the architecture in place forPhase 1. When mobile phone users call 911, they are servedby a base station, and the information about this base stationis used to route the call through a selective router and on tothe PSAP. The serving cell/sector information is availablebecause the calls went to a particular station and were beingserved off one of a limited number of cells or cell sectors.This will provide emergency personnel with some idea ofthe caller’s location. Feature group D signaling might still beused, but there is a need to enhance it, use the full 10-digitcall-back number, and ensure that number is delivered tothe PSAP.
Despite the fact that the deadline is fast approaching, thereare still some open issues for Phase 1. One of the most impor-tant of these is how to handle E911 for noncode identifiedmobiles. Even though it is a requirement in Phase 1, there isno call-back number available for such callers as of yet. Thecaller has no mobile directory number (MDN) because theydo not subscribe for service. It may be possible to providebasic 911 services for these types of phones, but a solutionthat will allow E911 has not yet been discovered. Anotheropen issue involves support for the TTY devices. Support foranalog TTY devices is available, but support for digital TTYdevices is still an emerging technology.
Phase 2
Phase 2, as mentioned above, is due to be implemented byOctober 2001 and mainly refines the location requirements.The location must include latitude and longitude, and it mustbe accurate to within 125 meters 67 percent of the time.Location-based routing must still be provided, and in thiscase it must be provided based on the location coordinates.Whereas in Phase 1 location-based routing will be performedbased on the serving cell or sector, Phase 2 will require a rout-ing mechanism that looks at the latitude/longitude coordi-nates and then routes to the PSAP nearest to thosecoordinates, regardless of the serving cell.
There are several additional feature candidates also includedin Phase 2. In Phase 1, basic features involved allowing calldelivery of 911 calls from any type of mobile phone, provid-ing the call-back number, and using location-based routing.The additional features in Phase 2 may include call-attempt
W I R E L E S S
F I G U R E 1Phase 1 Architecture
Analog (CAMA) or
Digital (ISDN)
Analog (CAMA) or
Digital (ISDN)
Route On
* Serving Cell/Sector
Route On
* Serving Cell/Sector
SelectiveSelective
RouterRouter
PCS or 800 MHzPCS or 800 MHz
......
MSCMSC
BaseBase
StationStation
MFMF
911911
* Serving Cell/Sector* Call Back Number
* Serving Cell/Sector* Call Back Number
Phase 1Phase 1Phase 1
PSAP
BaseBase
StationStation
Phase 1 ArchitecturePhase 1 Architecture

19 9 8 A N N U A L R E V I E W O F C O M M U N I C A T I O N S ■ 905
reporting, subscriber-information delivery, and congestioncontrol. Call-attempt reporting means that all 911 call at-tempts must be reported in real time to the PSAP. If a callerdials 911 in an emergency and then disconnects, the 911 per-sonnel, already having the caller information, will call back toensure that the call was disconnected intentionally.
This process should be possible even for abandoned orblocked calls, which present a major technical challenge.What this means exactly must be clarified with the FCC andpublic safety groups. There are certain points at which a callermight be dialing a mobile phone, but no call events have yetoccurred and so can not be reported. If a call is blocked orabandoned at certain points in call setup, there may or maynot be sufficient information available to send a call-backnumber or the location information to the PSAP. For example,it may take a few seconds to calculate the latitude/longitudefor a caller. If a user quickly hits the end button or powers offthe mobile phone, there may not have been sufficient time togather the essential information.
Subscriber-information delivery has created several issues.There was much discussion in the JEM and in successivemeetings about what kind of information is useful whensomeone calls 911. Obviously, in landline situations the calleris at a fixed station. This makes information such as name, ad-dress, and phone number very useful. In the wireless arena,an address is obviously impossible to provide. On the otherhand, it may be possible and helpful to provide a serving sys-tem ID, a subscriber identifier that could be the user’s nameor the name to which the mobile phone is registered, a mobiledirectory number, or the 10-digit call-back number. Theremay also be some value in knowing which phone made thecall, which would require a mobile station identifier. There isongoing discussion about appropriate information elementsand how to make them available.
Once the essential information has been agreed upon, deliv-ery options must be considered. There are two apparent ap-proaches to delivery. One is to provide information on initialcall setup. In this scenario, as much information as is availablewhen a caller dials 911 and hits send is sent to the PSAP alongwith the call origination setup message. The other option ison-demand delivery. In this scenario, the system waits for arequest from the PSAP for additional information about thecaller. It may be that both of these approaches are used.
Emergency system congestion control, specific to the wirelessarena, is a particularly interesting challenge. In a possible sce-nario, the PSAP notifies a wireless system about multiple in-cident reports, where the number of calls about a singleincident is overwhelming. After a broadcast message is sentfrom the PSAP to the wireless service provider, that providermight screen out duplicate requests. Repeat callers would bequestioned as to the reason for their calls, and if the incidentwas a new one, the caller would be put through. Another sce-nario has the wireless system broadcast a message to mobileusers notifying them that the situation has already been re-ported. This mechanism could also be used to notify mobileusers of emergency conditions and, if necessary, suggest al-ternative routes.
A final congestion control mechanism is an emergency areacongestion control, basically controlled by the wireless sys-tem. Whereas in the previous scenarios the control is initi-ated by the PSAP when it notifies the wireless system thatit is experiencing congestion, in this case the wireless sys-tem would limit 911 calls from the same geographic areawithout having been notified by the PSAP. The number ofemergency services trunks from a particular serving systemto its PSAP may be a limiting factor. When those trunks arefull, it is not possible to send more calls to 911, and callsmay have to be dropped. It should be noted that this maynot be a required service.
Figure 2 shows the architecture proposed for Phase 2. As theMSC processes the E911 call, it queries a location processor inthe intelligent network to determine the geographic locationof the phone. This requires a digital transmission method (i.e.,ISDN) to carry the additional location information to a selec-tive router. The router can then use that information to deter-mine which PSAP should receive the call. This architectureuses the latitude/longitude information rather than thecell/sector information to route to a PSAP. An enhancementto PSAP equipment for this stage will be the ability to graphi-cally represent the mobile location. For example, the lati-tude/longitude coordinates may be applied to a local streetmap to indicate the caller’s location graphically rather thansimply displaying the coordinates.
Geolocation
The geolocation technologies may well be the most excitingpart of E911 services. One of these is direction of arrival(DOA) technology. DOA involves a number of antenna ar-rays communicating with a mobile phone; based on the lineof bearing from the mobile, it is possible to calculate thecaller’s location relatively accurately. This approach is goodbecause it works with unmodified mobile units. In manycases, it may be possible to have only two base stations in-volved in this triangulation. Also, due to a long integrationperiod, this approach has a low signal-to-noise ratio.Unfortunately, DOA does require fairly large antenna arrays,and multipath degrades the accuracy. This means that in sce-narios where more base stations are involved, accuracy willnot be optimal. DOA is probably most useful in rural areas.Another approach that has been discussed a good deal is timedifference of arrival (TDOA), which is somewhat similar to di-
B E T S Y K I D W E L L
F I G U R E 2Phase 2 Architecture
7XL01415X. 24
INTELLIGENTINTELLIGENTNETWORKNETWORK
Phase 2Phase 2Phase 2
..................
Analog (CAMA) or
Digital (ISDN)
Analog (CAMA) or
Digital (ISDN)
Route On
* Latitude/Longitude
Route On
* Latitude/Longitude
SelectiveSelectiveRouterRouter
PCS or 800 MHzPCS or 800 MHz
...
MSCMSC
BaseBaseStationStation
911911
PSAPPSAP
BaseBaseStationStation
* Latitude/Longitude * Mapping* Call Back Number
* Latitude/Longitude * Mapping* Call Back Number
LocationLocationProcessorProcessor
SS7TCAP
SS7TCAP
Location
Application
Processor
LocationLocation
ApplicationApplication
ProcessorProcessor
Phase 2 ArchitecturePhase 2 Architecture
SS7TCAP
SS7TCAP

906 ■ 19 9 8 A N N U A L R E V I E W O F C O M M U N I C A T I O N S
rection of arrival. TDOA can work in one of two ways: signalsare sent either to a mobile unit or from a mobile unit to a re-ceiving station, and the time difference of these various signalsbeing received by the target is calculated to produce positioncoordinates. This technology also works with unmodified mo-biles and may be able to use existing antennas. This solutionrequires at least three base stations for triangulation. LikeDOA, however, TDOA’s accuracy is degraded by multipath.Also, the base stations must be tightly synchronized.Intersystem timing issues may occur in border areas if timingis not synchronized between adjacent systems.
Another geolocation mechanism is ranging. Here, a signal issent to or from the mobile unit and reflected back to the orig-ination point. The position is calculated based on the roundtrip of that signal (e.g., from the mobile to the target and backagain). This scenario may also use existing antennas and,again, a long integration period enables low signal-to-noiseratio operation. While the accuracy is fairly good, ranging re-quires some cooperation between mobile units and some en-hancements to the units. As yet, there has been no protocoldefined to support this. Ranging is not as fault tolerant asother methods and, again, has a problem with multipath.
Figure 3 compares these three approaches. DOA results in acone of uncertainty. Given that there are two base stationsand one mobile unit involved, the caller is somewhere withinthis cone. TDOA provides a bundle of uncertainty based on ahyperbola; again, the mobile unit is somewhere in this range.Finally, ranging defines a ring of uncertainty encompassingthe mobile’s location.
The Future of E911
As mentioned above, the FCC has left several areas for futuredevelopment and study. These include refining location re-quirements and interactions with priority services. There wasmuch discussion about including altitude in Phase 2, but itwas not done. Particularly in large metropolitan areas, how-ever, altitude could be very helpful information. If there werean emergency in a skyscraper, for instance, simplelatitude/longitude coordinates would not accurately pin-point a caller. Increasing the location accuracy is also desired.Currently, the requirement is to be accurate within 125 meters67 percent of the time. In the future, accuracy should bewithin 40 feet 90 percent of the time. Obviously, this will re-quire much more precise location techniques.
Interactions with priority services are also essential. One typeof priority access provides police or local government officialsa higher priority for call delivery than regular subscribers incertain emergency situations. This could cause problems,however, since the occurrence of a major disaster will cer-tainly not forestall other emergency situations—even some-thing as serious as a bombing should not make a user unableto access emergency services in case of an accident.
W I R E L E S S
F I G U R E 3Geolocation
GeolocationGeolocationGeolocation
Base
Station 2
Base
Station 2
BaseBase
Station 1Station 1
MobileMobile
DOA - Cone of uncertaintyDOA - Cone of uncertainty
TDOA - Bundle (of hyperbolas) of uncertaintyTDOA - Bundle (of hyperbolas) of uncertainty
Ranging - Ring of UncertaintyRanging - Ring of Uncertainty

19 9 8 A N N U A L R E V I E W O F C O M M U N I C A T I O N S ■ 907
Abstract
The realization of nomadic computing and communicationsis upon us. Innovations in wireless network technology aswell as user-device software and hardware are increasingtheir utility for nomadic users. In addition, with the emer-gence of the Internet acting as a major catalyst, there is astrong consensus of converging wireless voice and data ser-vices in the future. A critical element of this paradigm shift isthe recognition that users need to access information nomadi-cally, and they face dramatic and sudden changes as theymove from home to office to meeting rooms to airport tohotel, and so forth.
In order to provide a rich set of capabilities and easy-to-useservices in a transparent form, providers must focus on keysystem parameters that are critical. These parameters includebandwidth, latency, reliability, processing power, interoper-ability, battery life, user interface, and cost. Specifically, solu-tions must include the fact that a user has only limitedcarrying capacity (i.e., minimum number and type of equip-ment and interfaces that they have to cope with). In thispaper, some of the key system parameters needed to supportnomadic computing and communications will be reviewedalong with the technical challenges they present. A number ofrelated, but parallel, technological evolutionary paths that areconverging for resolution of these challenges are also shown.
The User’s Landscape
The global market for wireless communication network andinformation services has enjoyed significant growth over thepast decade. Wireless network technologies have evolved tosupport a much wider set of services for the user. Beyond tra-ditional voice, these services include: voice-activated dialing(VAD), voice messaging, caller ID, short-messaging service(SMS), e-mail, and Internet access. Network access has alsoevolved to include both advanced analog and digital signal-ing. In addition, wireless phones and pagers have becomecommon appliances in many countries.
Despite these advances, the interface between advanced ser-vices and its users remains stuck in the past. To use an ad-vanced service, a user often has to put up with long andconfusing sets of voice prompts to which the user must re-spond by inputting digits from a menu or digits that are com-
mitted to memory. The digits are often followed by more longand confusing sets of recorded voice prompts. This approach,called interactive voice response (IVR), evolved out of theneed to accommodate the lowest common denominator incustomer premises equipment (CPE) and network accesstechnologies: dual tone multi-frequency (DTMF) capability.
Today, the growing diversity of vertical voice services sup-ported by evolving wireless intelligent networks (WINs) re-quires centralized servers, such as service control points(SCPs), intelligent peripherals (IPs), or service nodes (SNs)to engage subscribers in increasingly complex sequences ofdigit entries and voice prompts. For example, subscribersmust enter an incredible amount of data to take advantageof robust mobility management or personal number ser-vices. Time-of-day routing, day-of-week options, locationoverrides, location-hunting sequences, screening and prior-ity list administration, and the interaction of various featureoptions are only a few of the items users must juggle.Although personal number service is one of the most well-established IN services on the market, it requires even thenovice user to administer in excess of 40 to 50 different pa-rameters. One wonders how much more popular one-num-ber services would be if the IVR interface to them were notso cumbersome.
Most users cannot recall what the options are at a givenbranch in the IVR tree, let alone how they got there or how toget out. What can a user do, except resort to writing thingsdown on scraps of paper and trying to coordinate them withthe IVR sequence? The limitations of IVR are not exclusive tocomplex services. Even basic features, such as voice dialing,can quickly build up unmanageable lists. If a user cannot re-member which 50 people are on their current list, how willthey know which ones to delete to make room for more?Carriers should consider leveraging the user-interface advan-tages supported by new CPE and access technologies, or itwill become a limiting factor in the development, deploy-ment, and acceptance of new services.
Increased competition is pushing service providers to seeknew ways to enhance their services and differentiate their of-ferings from previous regulated services. To remain competi-tive, service providers must improve the ease-of-use andaccess to existing services while adding new capabilities, suchas news, information, and data services to their portfolios.
Evolving the User Interface forAdvanced Network ServicesDavid Marutiak Biswa BanerjeeDirector of Wireless Technology and Technical Marketing Director, Advanced TechnologyWink Communications AirTouch Communications

908 ■ 19 9 8 A N N U A L R E V I E W O F C O M M U N I C A T I O N S
W I R E L E S S
The recent explosion in on-line services and World Wide Webaccess illustrates the growing demand for data services andelectronic information. Web browsers and on-line services arerapidly evolving to exploit the computing resources of desk-top PCs and to provide users with powerful graphical tools topresent reams and reams of such data.
Parallels in User Interface Evolution
Figure 1 shows that when users grow accustomed to superioruser interfaces offered by these technologies, their expecta-tions of other communications offerings will grow accord-ingly. Unfortunately, the gap between desktop solutions andtelecommunications devices is widening, not closing. Voiceand information services require new interface technologiesto keep pace with growing expectations of the user’s view.Figure 2 shows the relationship between three common de-vices used by nomadic users. The increasing cost for highercapability devices is paralleled by an increase in size. Theoverlapping areas indicate multi-functional devices, or areaswhere more than one device can provide a given function.
Note that the general direction of decreasing prices over timefor consumer devices will force each of these device spacesinto more overlap. Users will expect devices to do more forless, as technology improves over time. Users will also expectmore portability in their devices (e.g., HPCs) and more con-sistency in their user interfaces (e.g., WinCE). It is likely thatmore multi-personality devices will be developed, and earlyversions of wireless computing, mobile Internet access, andvoice adjuncts or services on data communications networksare already widely available.
Evolving Technologies
In parallel with the evolution of the user’s expectations forgraphical interfaces and programmable applications on main-stream wireless devices, a number of related technologieshave been evolving steadily in the same direction(s). Whether
this synchronicity was random luck or effective product man-agement remains unclear. What is clear is that the wirelessconsumer immediately benefited from the evolution of:
• display technology• data-compression technology• client/server software technology• digital wireless network infrastructures• new standards in content format and storage
Figure 3 shows the progression of the user’s interface experi-ence and how it improves after each technical hurdle ispassed.
Display EvolutionOne of the most visible evolutions is that of the typical wire-less handset’s display, as shown in Figure 4. The type of dis-play has evolved from a single-line light-emitting diode(LED) string capable of showing only digital information to aseries of liquid crystal displays (LCDs). The initial LCDs notonly added alphanumeric capabilities, but increased the num-ber of lines of information that were available to the user overtime. The next step was to add a row or two of icons thatcould be used to present essential graphical information tothe user, usually the signal strength, battery condition, andpresence of messages in a mailbox. Subsequently, the use oficons was accompanied by the need to display languages thatare not character-based (e.g., Japanese, Korean, and so on).
Soon, it became more common to find bitmapped displays,where the entire set of pixels in the LCD could be used toform graphical images. As with the original alphanumericdisplays, these started out with a small size and horizontal as-pect ratio, and over time grew to have more pixels. Aboutthat time, the original smart phones started to appear, and thedisplays became some fraction of a variable graphics array(VGA) ratio (640 x 480) in order to display portions of a Webpage more easily. The design issues therein are numerous, asthe manufacturers have to trade off the desire for small form
F I G U R E 1Parallels in User Interface Evolution
Arpanet Internet Web-HTML Web-Graphical Tools
Evolution of the networking user interface
CPM DOS SmallTalk PARC Mac Windows Win Ô95
Evolution of the computing user interface
Slide Rule Calculator (numeric) Programmable (alpha) GEOS WinCE
Evolution of the portable terminal paradigm (e.g., handheld devices)
Spoken Rotary Dial DTMF (tones) Spoken (ASR) Text (alpha) UP WAP Wink
Evolution of the communications user interface
Graphical UserInterfaces

19 9 8 A N N U A L R E V I E W O F C O M M U N I C A T I O N S ■ 909
D A V I D M A R U T I A K A N D B I S W A B A N E R J E E
F I G U R E 2Evolution of Consumer Device Characteristics
Complexity ofDevice
Phones
PDA/HPC
Computers
F I G U R E 3User Interface Perception Hurdles
Cost of Device

910 ■ 19 9 8 A N N U A L R E V I E W O F C O M M U N I C A T I O N S
W I R E L E S S
factors with the constraints of the hypertext markup language(HTML) files and the visual ability of the typical user(s).Recently, manufacturers have been displaying LCDs thatallow different levels of gray scale and even color. The cur-rent state of technology is being pushed by high-density dis-plays with high color resolution that can be coupled withpassive lenses to form virtual displays.
Data-Compression TechnologiesThe growth of graphics and high-end desktop capabilitiesfor the Web (e.g., video and GIF animation) has been sorapid that it quickly outpaced even the most optimistic pro-jections for the abilities of constrained devices that a nomadis likely to carry. Both the bandwidth required for transmit-ting this information and the processing and memory neces-sary to take advantage of it on the nomad’s primarycommunications device are prohibitive. Thus, an entire mar-ket niche has developed around the ability to intelligentlystrip out much of the information the Web author puts inand to convert the relevant parts back down to lower levelinformation suitable for nomadic devices. The field of proxyservers has been extended to include these abilities, somedriven by simple algorithms and the evolving ones usingsimple artificial intelligence. The results are impressive—typical factors of 90 percent reduction for fully graphical in-formation and 50 percent to 66 percent for pages thatinclude graphics plus text.
Client/Server Software ArchitecturesThe evolution of client/server (C/S) architectures in thehandset market allows the application developer to benefitfrom their traditional strengths. These include a degree of op-erating system (OS) independence and transport indepen-dence that reduces the dependency of an application on aspecific design choice of different manufacturers or carriers,as shown in Figure 5. This provides the ability to reuse con-tent across different manufacturers with differentHW/FW/OS implementations, and the cross-platform abilityfor sending one application to many devices without havingto know their unique nature or keep track of them in associ-ated application subscription databases.
Another advantage of C/S architectures is the ability to dis-tribute processing across either unit. In this context, it pro-vides the ability for the nomad’s device to do its own localprocessing within an application. Local processing reducesthe necessary communications bandwidth and can greatly as-sist in session-level consistency during mobile transitions(e.g., hand-offs). The natural evolution of this distribution willbe to have the client tell the server its capabilities and statusas part of the session initialization sequence. The term micro-browser has been coined to represent this technology in thehandset market, and over the past two years many vendorshave offered possible solutions, including Unwired Planet,Wink Communications, JavaSoft, and so on. So many ven-
F I G U R E 4Handset Display Technology Evolution
Handset Display Technology Evolution
Single Line Digital Single Line Alpha Multi-line Alpha Bitmapped Text Messaging
Bitmapped Text Client
Bitmapped - HTML Browser
BitmappedGraphical Client
BitmappedGraphical Text

19 9 8 A N N U A L R E V I E W O F C O M M U N I C A T I O N S ■ 911
D A V I D M A R U T I A K A N D B I S W A B A N E R J E E
dors have offered alternatives that the ad hoc WirelessApplications Protocol Forum is defining a proposed standardto simplify the deployment of services across handsets fromdifferent vendors.
Digital Wireless Network InfrastructuresIf the wireless device is to operate in the variousclient/server modes, it will be necessary to have a variety ofdata-transmission capabilities. Newer, digital network infra-structures provide messaging capabilities (short-messageservice) that can be used for pushing information, alerting,or silently downloading new services to the user. Their abil-ity to eliminate the Personal Computer Memory CardInternational Association (PCMCIA) cards necessary formodem operation means that even the mainstream handsetcan be used as a data communications device, both for teth-ered operations and for on-board applications. It also meansthat the nomadic user can operate on the batteries of thehandset, rather than having to power a separate modemfrom their device. Circuit-switched data provides a reason-able method for delivering larger applications and can beused in conjunction with the messaging capabilities to con-struct convenient service and feature combinations. Digitalnetworks also provide an adequate transport level protocolfor error correction and encryption, reducing the need forthe applications to provide this overhead. Network-basedinterworking units/functions have evolved direct IP inter-faces to reduce call set-up time, and eventually packet datatransmission technology will further improve theclient/server capabilities of the typical handset.
Standards for Content Format and StorageAnother key technology is, of course, the uniformity pro-vided by the Internet as a transmission and storage mediaand the Web as the greatest single content resource. Whileearly versions of HTML were suitable only for the desktopparadigm, the most recent specifications are broad enough toallow effective operation in consumer devices (e.g., wirelesshandsets, television displays, etc.). However, even with theimprovements of HTML 4.0 (dynamic HTML), the nature ofwireless networks required extensions for the nomadic userto effectively use these new application. Recent submittals tothe World Wide Web Consortium (W3C) of the HDML andHDTP developed by Unwired Planet and the ad hoc develop-ment of the Wireless Applications Protocol by leading ven-dors have begun to extend the use of Web-based contentmore appropriately for the nomadic user. Another competingalternative submitted to the W3C is that of compact HTML.
In addition, the growing base of wireless subscribers has at-tracted the attention of different media organizations—manyfrom a historically different market (i.e., television and themedia). Examples of major players that are addressing wire-less now include CNN and The Weather Channel, both ofwhich are already distributed across a slew of access tech-nologies beyond television. As the business grows, the mass-media market characteristics will come into play, includingthe use of advertising as a revenue source. Finally, the evolu-tion of content includes the ability for third-party applicationsto extend to nomadic users on a greater scale. Early verticaladopters, such as the dispatch market or the sales force, will
F I G U R E 5Wireless Client/Server Architectures
Network
PAGER
PHONE
S PM HA OR NT E
HPC
ClientAgent
Various Clients Various Servers
OffnetServerAgent
NetworkServerAgent
912 ■ 19 9 8 A N N U A L R E V I E W O F C O M M U N I C A T I O N S
W I R E L E S S
be followed by other casual users (e.g., White pages access,access to map databases, and so forth) as more and more con-tent providers use common interfaces to their legacy systems.
As the sources of content proliferate, they also require in-creasing amounts of storage as they incorporate more graphi-cal and interactive content. The constrained environment ofthe handsets, however, is evolving at a slower pace. Recently,the global system for mobile communications (GSM) specifi-cations were expanded to allow for larger subscriber identitymodule (SIM) cards (16 KB) and for applications on SIMcards to access handset UIs (SIM toolkits). Even more re-cently, Siemens has led an effort to adopt the multimedia card(MMC) as a standard for adding off-board memory to wire-less devices. The MMC promises 256 KB of space and has op-tions for flash to allow writable persistent storage. The SIMcards are large enough for applications that want to count onresident micro-browsers, while the MMC cards can carry theentire client as well as a suite of applications.
User Interface Requirements and Directions
As discussed in the opening section, the wireless device userwill grow more and more to expect their device to be a portalto many network and information services. As Vinton Cerf,Vice President of MCI’s Internet Architecture, has said, “Inyears to come, the term ‘smart phone’ will seem as redun-
dant as the term ‘horseless carriage’ does today.” Each suc-ceeding generation of device will add more display capabil-ities, better client/server software, and improveddata-transmission capabilities as outlined in the technologi-cal evolution section. These combined forces will dictateuser requirements that are increasingly:
• graphical user interfaces• simple, intuitive, and fun to use• adept at processing data locally (when disconnected or
resident)• able to reduce air costs and increase battery life• able to interconnect easily with related devices (e.g., PDAs,
input devices)• useful for both work-related functions and personal features• able to store and download multiple applications• portable, pocket-sized form factors• complementary to voice-controlled features and input• simpler to input text for advanced services• addressable in groups and used for bridged calls• upgradeable via software updates after market
The user will seek out devices and network operators thatcomplement their ever-growing experience with desktopand intelligent television services, and, in many cases,look for these devices to be companions to their otherconsumer devices.
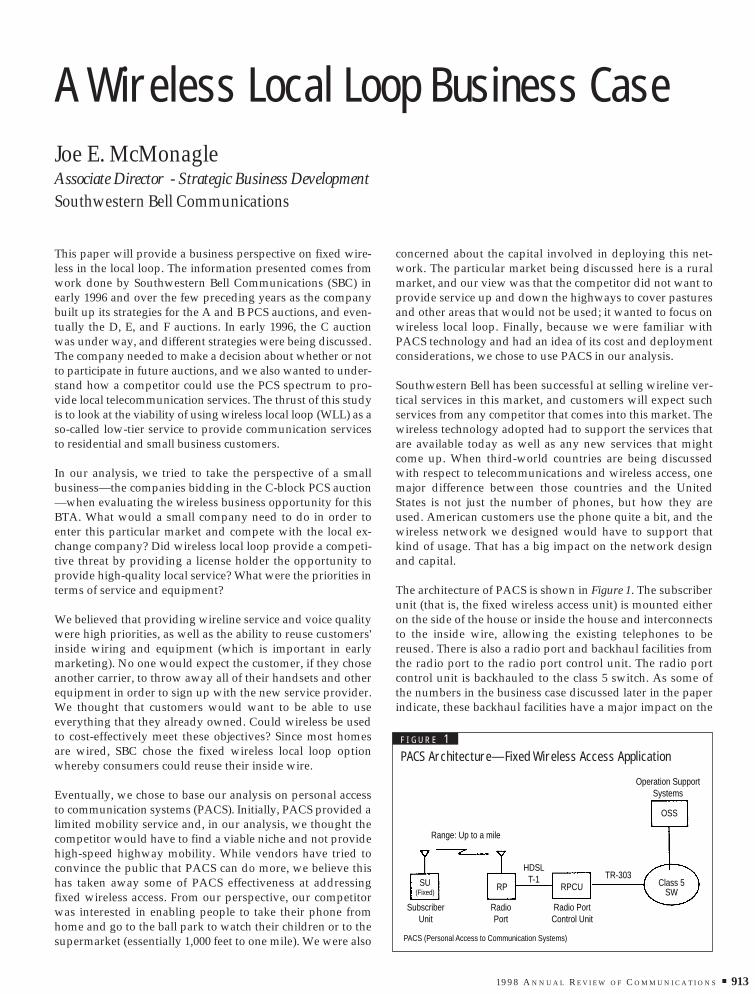
19 9 8 A N N U A L R E V I E W O F C O M M U N I C A T I O N S ■ 913
This paper will provide a business perspective on fixed wire-less in the local loop. The information presented comes fromwork done by Southwestern Bell Communications (SBC) inearly 1996 and over the few preceding years as the companybuilt up its strategies for the A and B PCS auctions, and even-tually the D, E, and F auctions. In early 1996, the C auctionwas under way, and different strategies were being discussed.The company needed to make a decision about whether or notto participate in future auctions, and we also wanted to under-stand how a competitor could use the PCS spectrum to pro-vide local telecommunication services. The thrust of this studyis to look at the viability of using wireless local loop (WLL) as aso-called low-tier service to provide communication servicesto residential and small business customers.
In our analysis, we tried to take the perspective of a smallbusiness—the companies bidding in the C-block PCS auction—when evaluating the wireless business opportunity for thisBTA. What would a small company need to do in order toenter this particular market and compete with the local ex-change company? Did wireless local loop provide a competi-tive threat by providing a license holder the opportunity toprovide high-quality local service? What were the priorities interms of service and equipment?
We believed that providing wireline service and voice qualitywere high priorities, as well as the ability to reuse customers'inside wiring and equipment (which is important in earlymarketing). No one would expect the customer, if they choseanother carrier, to throw away all of their handsets and otherequipment in order to sign up with the new service provider.We thought that customers would want to be able to useeverything that they already owned. Could wireless be usedto cost-effectively meet these objectives? Since most homesare wired, SBC chose the fixed wireless local loop optionwhereby consumers could reuse their inside wire.
Eventually, we chose to base our analysis on personal accessto communication systems (PACS). Initially, PACS provided alimited mobility service and, in our analysis, we thought thecompetitor would have to find a viable niche and not providehigh-speed highway mobility. While vendors have tried toconvince the public that PACS can do more, we believe thishas taken away some of PACS effectiveness at addressingfixed wireless access. From our perspective, our competitorwas interested in enabling people to take their phone fromhome and go to the ball park to watch their children or to thesupermarket (essentially 1,000 feet to one mile). We were also
concerned about the capital involved in deploying this net-work. The particular market being discussed here is a ruralmarket, and our view was that the competitor did not want toprovide service up and down the highways to cover pasturesand other areas that would not be used; it wanted to focus onwireless local loop. Finally, because we were familiar withPACS technology and had an idea of its cost and deploymentconsiderations, we chose to use PACS in our analysis.
Southwestern Bell has been successful at selling wireline ver-tical services in this market, and customers will expect suchservices from any competitor that comes into this market. Thewireless technology adopted had to support the services thatare available today as well as any new services that mightcome up. When third-world countries are being discussedwith respect to telecommunications and wireless access, onemajor difference between those countries and the UnitedStates is not just the number of phones, but how they areused. American customers use the phone quite a bit, and thewireless network we designed would have to support thatkind of usage. That has a big impact on the network designand capital.
The architecture of PACS is shown in Figure 1. The subscriberunit (that is, the fixed wireless access unit) is mounted eitheron the side of the house or inside the house and interconnectsto the inside wire, allowing the existing telephones to bereused. There is also a radio port and backhaul facilities fromthe radio port to the radio port control unit. The radio portcontrol unit is backhauled to the class 5 switch. As some ofthe numbers in the business case discussed later in the paperindicate, these backhaul facilities have a major impact on the
A Wireless Local Loop Business CaseJoe E. McMonagleAssociate Director - Strategic Business DevelopmentSouthwestern Bell Communications
Range: Up to a mile
Operation SupportSystems
SubscriberUnit
SU(Fixed)
RP RPCU Class 5SW
OSS
RadioPort
Radio PortControl Unit
HDSLT-1 TR-303
PACS (Personal Access to Communication Systems)
F I G U R E 1PACS Architecture—Fixed Wireless Access Application

914 ■ 19 9 8 A N N U A L R E V I E W O F C O M M U N I C A T I O N S
financial viability of this business. It should be rememberedthat our goal in looking at this opportunity was not just to geta license and deploy capital and networks, but to develop a fi-nancially viable business.
Basic Network Assumptions
When looking at this type of business opportunity analy-sis, many assumptions must be made: network assump-tions, subscriber assumptions, revenue assumptions,expense assumptions, and financial assumptions. We madeour basic network assumptions first. In entering the partic-ular BTA discussed here, we assumed that the competitorwould have 30 MHz of spectrum to work with. The tech-nologies involved will work on 10 MHz, but it costs a littlebit more, and the capital involved tends to be higher withonly 10 MHz. We toured the BTA and examined the facili-ties that were available in the area, such as telephone andpower poles, building space, the topology of the land, andother various facilities. We assumed that the wireless com-petitor would be able to place the network radio ports in aone-mile grid, with an antenna height of 40 to 45 feet. Thishas an impact on the quality of service, because thereneeds to be some radio coverage overlap in order to ensuregood quality service; nevertheless, since the ultimate goalwas to have a financially viable business, we chose to de-ploy using the one-mile grid. The particular town in thisexample is in tornado alley, so it has many new, tall tele-phone poles.
The wireless network was designed to accommodate up to a40 percent access line penetration rate over a 10-year period.Whether or not that level of penetration could be achievedwas unknown, but we looked at business-plan sensitivitiesfor various penetration levels. It was assumed that mainte-nance and installation expense is driven by penetration, net-work deployment, and in taking the perspective of a smallbusiness we sought to keep these costs down. The wirelesslocal loop equipment costs in this business model are basedon quotes provided by equipment vendors.
Other basic network assumptions involved backhaul facili-ties. We looked at both leased and owned backhaul facilitiesto interconnect wireless components. Leased facilities wereavailable from the LEC or other providers, and tariff pricesfor T-1s and DS-3s were used in our analysis. We also lookedat building the backhaul network using existing poles wherepossible, 19- and 22-gauge cable to connect the RPs to theRPCUs, and fiber to connect the RPCUs to the switch.
Subscriber Assumptions
Next, subscriber assumptions were assessed. In the BTAbeing discussed, there were about 200,000 people, 80,000households, and 6,000 businesses. We thought the competitorwould choose not to address this entire market: there are oneor two cities within the BTA that are dense, and the rest of thepopulation is in small towns that we thought a small com-pany entering this market might choose not to address. Of the200,000 population base, we decided to address about 120,000people, 43,000 households, and about 3,300 businesses—overall, just over half of the entire market. The residentiallocal and toll minutes of use per month totaled about 1,300minutes, while business local and toll came to about 1,350minutes per month. We assumed that 54 percent of the min-utes of use were originating minutes, and also assumed thepresence of 1.2 access lines per household and business. Fourdifferent levels of customer penetration were examined.
Revenue Assumptions
In laying out its revenue assumptions, we were able to per-form sensitivity analysis and therefore, we did not spendmuch time discussing what the numbers would be. We as-
W I R E L E S S
Acce
ss L
ines
F I G U R E 2Wireless Access Lines — 30% Penetration: 2005
Total Capital per Subscriber (Lease)Year 1 Year 2 Year 3 Year 4 Year 5 Year 6 Year 7 Year 8 Year 9 Year 10
10% 8,415 3,993 2,384 1,590 1,261 1,110 1,079 1,061 1,066 1,06920% 4,436 2,182 1,360 989 833 754 735 735 740 74330% 3,075 1,598 1,043 799 697 643 629 626 630 633
Total Capital per Subscriber (Build)Year 1 Year 2 Year 3 Year 4 Year 5 Year 6 Year 7 Year 8 Year 9 Year 10
10% 8,961 4,273 2,550 1,694 1,347 1,195 1,171 1,162 1,181 1,19620% 4,707 2,324 1,444 1,041 886 809 797 806 822 83530% 3,253 1,694 1,101 839 740 689 679 685 697 709
T A B L E 1Capital Investment/Access Line

19 9 8 A N N U A L R E V I E W O F C O M M U N I C A T I O N S ■ 915
sumed that calls terminating on the competitor’s networkwould yield 1.8 cents per minute. At the time of the study inthe particular market under consideration in this analysis,Southwestern Bell basic residential telephone service costabout $14.00, and we assumed a competitor would try tocome in below that price. Our pricing assumption was thatresidential service would be priced at $12.50 per month.Essentially, this would put service at about one cent perminute in terms of usage. The residential average vertical ser-vice was about $5.00. The business flat rate was settled at$25.00 per month, and business average vertical service was$4.00. The new company also planned to be in the long-dis-tance business, reselling another firm's long-distance servicefor 16 cents per minute, in addition to providing access tosome of the other exchange carriers for 5 cents a minute.
Expense and Financial Assumptions
We assumed that local interconnect charges would be 1.8cents per minute while wholesale long-distance cost wouldbe 8 cents per minute, creating a 50 percent margin. Billingcosts would be $2 per subscriber per month, and advertisingwould have a fairly small budget, about one dollar per pop.G&A would be 12 percent of revenues, which is a reasonablenumber. The PCS C block license cost about $4 million for thisBTA, but, taking into account the discounts and the financingthat the FCC gives small businesses, that $4 million can be re-duced to $2 million (if the present value of $4 million isspread out over a 10-year financing period, and the discount istaken into consideration).
Finally, we assumed the cost of capital to be 11.5 percent. Thismay not be high enough, depending on the financials of thesmall business. We assumed the debt ratio was 46 percent.Some small businesses will have to assume a much higherratio than this, and that impacts the evaluation. There would
also be an 8.25 percent interest expense and a 10-year time pe-riod for equipment depreciation.
The Business Case
Wireless Access LinesFigure 2 provides an example of how the market develops. Atthe 30 percent penetration level, the competitor would startwith a few thousand customers in the first year, and by theend of the 10-year period, the company should have a littlemore than 15,000 customers. A 10 percent penetration ratefollows this same kind of curve, but has 5,000 customers atthe end of 10 years.
Capital Investment Per Access LineCapital investment for assets is important. Although many inthe industry say that wireless service can be provided morecheaply than wireline, it is only possible with the right kindof penetration rates, usage patterns, network design, and cus-tomers. Table 1 provides an idea of the capital investment re-quired per access line for penetration levels of 10 percent, 20percent, and 30 percent if the facilities are leased (top) or built(bottom). Assuming 30 percent penetration and $633 per sub-scriber, around $10 million in capital is being spent by leasingand $11 million by using built facilities.
Monthly Revenue and ExpenseTable 2 shows the revenues and expenses for the situation inwhich the backhaul network facilities are leased from thelocal telephone company. The section at the top is the averagerevenue per subscriber per month for the years 1996, 2000,and 2005, assuming a 30 percent penetration rate. Below therevenue ratios are the total operating expenses per averagesubscriber. In looking at the first column, it does not take agreat deal of math to realize that if $47 per month is beingmade per subscriber while $245 is being spent, there is no
30% Penetration Lease InterconnectMonthly Revenue and Expense Ratios 1996 2000 2005Subscribers 1,113 10,909 15,574Local Service Revenue/Average Subscriber 13.46 13.12 12.71Vertical Service Revenue/Average Subscriber 4.92 6.00 7.68Long-Distance Revenue/Average Subscriber 12.51 12.47 12.41Switched Access Revenue/Average Subscriber 6.65 6.63 6.60Term Local Interconnect Revenue/Average Subscriber 9.48 7.44 5.99Monthly Revenue/Average Subscriber 47.02 45.66 45.38
Customer Care Expense/Average Subscriber 6.19 2.80 2.12Marketing Expense/Average Subscriber 18.33 1.09 0.66Sales Expense/Average Subscriber 18.75 5.46 2.83G&A Expense/Average Subscriber 5.64 5.02 4.99Leased Facility Expense/Average Subscriber 100.16 14.11 10.52Network Maintenance Expense/Average Subscriber 78.75 7.07 3.09Local Interconnect Expense/Average Subscriber 11.12 8.74 7.03Long-Distance Expense/Average Subscriber 6.26 7.04 8.16Total Operating Expense/Average Subscriber 245.20 51.33 39.39
T A B L E 2Wireless Access Lines - 30% Penetration: 2005
J O E E . M C M O N A G L E

916 ■ 19 9 8 A N N U A L R E V I E W O F C O M M U N I C A T I O N S
W I R E L E S S
profit. One of the big expense items is the leased backhaul fa-cility cost per subscriber. There are many radio ports that takeT-1s back to some point, and leasing these lines has a big im-pact on the business case. When the lines are loaded up, thenthe cost per subscriber comes down.
Table 3 shows what the revenues and expenses are likewhen the backhaul facilities are built—it is a very differentpicture. There are still some leased facilities being used,but these are the telephone poles and equipment that haveto be attached, as well as some right-of-way expenses. Theleased facility expense essentially goes away, and the pic-ture starts looking better. In analyzing business cases forPCS and wireless, it is common for the provider to spend agreat deal of money in the early years, so cash flows looknegative for the first few years. However, these start be-coming positive by years five and six, and this example isnot much different.
Net Income
Net income projections for the leased and built backhaul net-work options are shown in Figures 3 and 4, respectively. For theleased option at 10 percent, 20 percent, or 30 percent penetration,net income never becomes positive. However, if the wirelesscompetitor were to build its own network, partner with anotherfirm, or negotiate a different leasing rate, then there are some netincome curves that look better (Figure 4). These curves are typicalof the situation for PCS providers; the magnitude of the numbersare smaller because the example under consideration is a smallmarket. In a large market such as Dallas or Chicago, a lot ofmoney is being spent. The magnitude might change, but theshape of the curves are pretty much the same. In Figure 5, thethree bars on the right represent the net present value (NPV) ofthe cash flows for the backhaul lease option, and the three on theleft are for the backhaul build option. At 20 percent penetration inthe build option, the NPV is almost zero; this could turn to about$3 million positive NPV given 30 percent penetration.
30% Penetration Build InterconnectMonthly Revenue and Expense Ratios 1996 2000 2005Subscribers 1,113 10,909 15,574Local Service Revenue/Average Subscriber 13.46 13.12 12.71Vertical Service Revenue/Average Subscriber 4.92 6.00 7.68Long-Distance Revenue/Average Subscriber 12.51 12.47 12.41Switched Access Revenue/Average Subscriber 6.65 6.63 6.60Term Local Interconnect Revenue/Average Subscriber 9.48 7.44 5.99Monthly Revenue/Average Subscriber 47.02 45.66 45.38
Customer Care Expense/Average Subscriber 6.19 2.80 2.12Marketing Expense/Average Subscriber 18.33 1.09 0.66Sales Expense/Average Subscriber 18.75 5.46 2.83G&A Expense/Average Subscriber 5.64 5.02 4.99Leased Facility Expense/Average Subscriber 7.89 0.47 0.28Network Maintenance Expense/Average Subscriber 87.13 7.57 3.39Local Interconnect Expense/Average Subscriber 11.12 8.74 7.03Long-Distance Expense/Average Subscriber 6.26 7.04 8.16Total Operating Expense/Average Subscriber 161.31 38.19 29.46
T A B L E 3Build Backhaul Network Option
$ K
Net Income(Lease Option)
Year
F I G U R E 3Net Income: Lease Backhaul Network Option
$ K
Net Income(Build Option)
Year
F I G U R E 4Net Income: Build Backhaul Network Option

19 9 8 A N N U A L R E V I E W O F C O M M U N I C A T I O N S ■ 917
J O E E . M C M O N A G L E
It is important to remember that this particular companypicked one specific market to pursue for a number of reasons.That may not be the type of market another company wants togo after, since there are many factors that impact the businesscase. Figure 6 is a “tornado chart”—a way of evaluating therelative importance of various factors to NPV. The horizontalline in the middle represents the $3 million positive NPV markfor the 30 percent penetration case, and we call it the base case.Each variable (penetration rate, local rates, sales cost, etc.) hasbeen changed plus or minus 50 percent. For example, the in-tersection of the horizontal “base case” line and the verticalpenetration line represents $3 million NPV at 30 percent pene-tration. If 45 percent penetration can be achieved, then thebusiness case looks good (over $8 million NPV).
The next vertical line represents the percentage of originatingcalls; if more calls could be terminated on the new company'snetwork, NPV would improve. Right now, companies are giv-ing away free minutes for incoming calls in an attempt to haveusers give out their wireless numbers. The intended result is thatmore calls will terminate on the company's network in the longrun. The next line in Figure 6 represents local rates, plus or minus50 percent. If one could charge $20 a month rather than the$12.50 mentioned previously, this would have a big impact onNPV. It would also have a big impact on customer penetrationas well. Many people in the industry dwell on the factor of capi-tal which is important because it involves a great deal of up-frontmoney. However, capital expense is not the key driver in thebusiness case. Earlier, it was mentioned that the competitivecompany spends about $10 million (plus or minus $5 million) asshown in Figure 6, and it does not have that much of an impactbecause of depreciation and other issues. Other factors repre-sented in Figure 6 follow the same pattern.
Conclusions
The business case discussed in this paper was for a domesticapplication of wireless local loop, and it should be remem-bered that the international arena is different. This applicationis a risky opportunity involving a lot of money up-front. Byoffering a limited-mobility service, can a market penetrationin excess of 20% be garnered by charging a little bit less thanthe incumbent telephone carrier? This is the key question thatmust be answered.
Many companies that are considering going into the wirelessbusiness are looking at attracting the second-line business. Inmaking such a move, a potential carrier must examine themechanics of the business case, the existing competitor, theinfrastructure, and costs involved. Wireless local loop is notjust a simple yes or no solution. It requires a great deal ofanalysis and the right set of strategies, vertical services, andso on. The right kind of partners associated in a project canprove to be one of its biggest assets in terms of addressingbackhaul options, obtaining cell sites, setting up structures,and mitigating costs.
Issues associated with interconnection and switched accessrates will be important for the wireless loop business. In ad-dition, companies must ask themselves how they plan to dif-ferentiate their service. Limited mobility will help, but theremust be more than that. Strong penetration rates are requiredfor success. Application of wireless local loop overseas couldbe a much different option. Foreign markets are being enteredthat have no telephone service today, and once subscribersstart using it, they may use very few minutes per month. Thathas a big impact on network design and cost. The case dis-cussed in this paper is not intended to apply to internationalapplications. The scenario we looked at was local bypass ofthe incumbent LEC using wireless local loop.
$ K
NPV ($000)
% Penetration With Build or Lease Option
F I G U R E 5Business Case Net Present Value
NPV
($M
)
Pene
tratio
n
% O
rigin
atin
g
Loca
l Rat
es
LD M
OU
Cap
ex
Inte
rcon
nect
Rat
e
Switc
hed
Acce
ss
G&A
Sale
s C
ost
% C
hurn
10
8
6
4
2
0
-2
-4
-50%
Base
50%
F I G U R E 6Sensitivity Analysis
19 9 8 A N N U A L R E V I E W O F C O M M U N I C A T I O N S ■ 919
Within the telecommunications industry, wireline and wire-less technologies are merging into a single set of services.Wireline services offer zero mobility and a low cost of $15 to$18 per month for 700 to 800 minutes of use in the local callingarea. Cellular wireless provides mobility, but it costs muchmore, anywhere from 25 to 30 cents per minute. Customersare willing to pay 10 to 20 times more on a per-minute basisfor mobility because it seems to add value. Now, the industryis saying that since billions of dollars are invested in the wire-line side and billions are invested in the wireless side, thesetechnologies should merge into a service that offers local loopcordless, mobile data, and wireless video. PCS is all aboutbringing these technologies together. The FederalCommunications Commission (FCC) is in the process of auc-tioning off personal communication services (PCS) frequen-cies. This essay will discuss how those frequencies can beused to offer local loop service or local loop plus some mobil-ity as an integrated service offering.
The FCC is allocating six sets of frequencies in the UnitedStates, labeled A through F. These licenses are defined as met-ropolitan trading area (MTA) licenses and basic trading area(BTA) licenses. They total 2,074 licenses within the frequencyband of 1850–1990 MHz. This is the operating frequency forPCS. These licenses have to be purchased; the FCC set upfranchises so that taxpayers can get some revenue for thepublic use of the airwaves. The A- and the B-block licenses,which are the MTA licenses, sold for about $7.5 billion. TheC-block licenses sold for almost $10 billion. The D, E, and Flicensing process is underway, and they might sell for an-other $2.5 to $3 billion.
Options for Wireless Technologies
The companies who own the licenses have to figure outwhat sort of service to offer. Wireless local loop, PCS ser-vices, wireless data, wireless video, and other wireless ser-vices are among the different technology choices. Table 1lists a number of different options for license holders.Digital European cordless telephone (DECT), which hasbeen renamed digital enhanced cordless telephone, is aEuropean standard that is being deployed in many parts ofthe world outside Europe. Personal handiphone system(PHS) is a Japanese standard, but it is also growing withinSoutheast Asia, China, and Latin America.
PCS 1900 is based on the global system for mobile communi-cations (GSM) standard. It was a European standard, but hasbeen accepted in many countries around the world. IS-136 is atime division multiple access (TDMA) digital cellular stan-dard being used for mobile cellular applications. IS-95 is acode division multiple access (CDMA) standard. These tech-nologies are all ways of providing wireless services.
The first three technologies listed in Table 1 are low-tier or mi-crocellular technologies. They provide coverage anywherefrom 100 to 1,000 meters away from the cell site or radio site.Although many sites are needed, low-tier technologies haveseveral advantages. They provide wireline voice quality andthey can offer 80 to 100 milli-Erlangs of traffic (800 to 1000minutes of use) to every customer. The next three technolo-gies are considered high-tier. A 100-foot tower outfitted withantennas transmit over a three- to five-mile radius and pro-vide 100 to 150 minutes of mobile cellular service to everysubscriber, or typically 10 to 15 milli-Erlangs of traffic.
Several other ways of differentiating between the technolo-gies are listed in Table 1. Operational availability refers towhether the technology has been extensively tested and/or isready for commercial deployment. Cost and service expecta-tions are the other differentiating characteristics. The firstthree systems are designed to offer little or no mobility (al-though PACS–based systems can also support full highway–speed mobility). Zero mobility means wireless local loop, andmore mobility means neighborhood PCS. A portable devicewould work in and around a neighborhood or in the caralong the highway. The other three systems, PCS-1900 (GSM),IS-136 (TDMA), and IS-95 (CDMA), are designed primarily tooffer mobile cellular service.
Differentiating PACS from Cellular Service
In choosing personal access communication system (PACS)technology, will carriers make money? Will subscribers usethe system? The answers to these questions lie in the factorsthat differentiate PACS from other wireless systems.
PACS technology is very simple. It is not the same asCDMA. Millions of dollars are not needed to bring it to mar-ket. PACS is based on TDMA, a technology that has beenused in the satellite business and the wireless industry for 30
Wireless Technologies in the LocalLoop: The Case for PACSVinay PatelMarketing Director, Hughes Network Systems, Inc.

920 ■ 19 9 8 A N N U A L R E V I E W O F C O M M U N I C A T I O N S
W I R E L E S S
years. It is designed to minimize network equipment andsubscriber costs.
PACS is a standard that many different companies are in-volved in promoting. There is a users’ forum that promotesthe benefits of PACS, with member companies includingHughes, Siemens, Bellcore, Panasonic, NEC, Motorola,Lucent, and others. PACS is a well-rounded, open-interfacestandard that many companies can use to build equipment.
The first uniqueness of PACS is in its area of usage. WithPACS, carriers can provide a wireless local loop equivalent tothe wireline usage rate of 800 to 1,200 minutes per month for aresidential line. A cellular system is designed for an averageusage of 100 to 150 minutes per month. The estimatedmonthly fee is linked to usage. PACS access for the local loopcan be priced anywhere from $20 to $30 per month, which isin line with what wireline telephone companies charge forlocal access. Compare this PACS-based WLL service to cellu-lar where the average bill is about $50 per month (for about100 minutes of use), so cellular customers pay twice as muchas PACS but receive 10 times fewer minutes of use! This costcomparison provides a big differentiation between PACSwireless local loop and cellular.
In terms of mobility, a microcellular system will have a rangeof 100 meters to 1,000 meters. PACS has a range of almost1,600 meters. These microcellular systems can be installed ex-actly where the customers are and therefore can be deployedin a well-focused strategy. In contrast, a cellular system canput up one tower and cover a large area of geography, butcannot focus the coverage where the WLL subscribers arelikely to be located.
PACS was designed by Bellcore and originally was called wire-less access communication system (WACS). It was designedspecifically for wireless local loop, and in that formulation there
was a limitation of 25 to 35 miles per hour on traffic speed, justas with the personal handiphone system and the DECT system.The standards committees realized that if wireline voice qualitywas possible using wireless, then there should not be a limita-tion on whether the phone could be used on the highway.When the system specifications were changed to evolve WACSto PACS, improvements were made in the standard to allow fora highway speed of 65 to 70 miles per hour.
The first handsets for PACS will be single-mode at a cost ofaround $200. Eventually, a dual-mode handset will be neededwith a default mobile use for national roaming through theuse of analog cellular. In Europe, the standard used for mo-bile cellular will be GSM, and PACS will face an uphill battlein Europe because DECT is already there.
When a wireless local loop system is installed in the home, awireless access fixed unit (WAFU) is used to connect all theexisting telephones in the house to PACS. It has an RJ11 inter-face, so all the telephones connect normally, but the transportis wireless via a PACS system. The WAFU would have a tele-phone number, and all the existing telephones would connectthrough that device. The voice quality is equivalent to wire-line quality because PACS uses a very good voice coder: 32 kbps adaptive differential pulse code modulation(ADPCM).
PACS is wireless wireline service. Wireline voice quality, veryhigh coverage, and 1 percent grade of service differentiatePACS from cellular service. When trying to make a cellularcall during rush hour, the call is often blocked because thesystems are designed for 3 percent to 5 percent blocking.PACS is designed for 1 percent blocking and hence wouldallow many more users to access the network.
Wireless will probably not be able to provide broad band-width. To provide 1.5 Mbps using wireless would be very ex-
Air Operational Service Primary ServiceInterface Availability Quality Cost Expectation
PACS PCS1 ✓ ✓ ✓ • Mobility• WLL• High traffic usage• WCTX/WPBX• High-speed data
DECT ✓ ✓ • Cordless telephony
PHS ✓ ✓ • Pedestrian telephony
PCS-1900 (GSM) ✓ • Mobile cellular2
IS-136 TDMA ✓ • Mobile cellular2
IS-95 CDMA • Mobile cellular2
Omni Point ✓ • Mobile cellular2
1 PACS Service: Wireline voice quality, 1% GOS, 80 to 100 me traffic/subscriber, 97% coverage2 Mobile cellular: Mobile voice quality, 3 to 5% GOS, 10 to 15 me traffic/subscriber, 90% coverage
T A B L E 1PCS Technology Options

19 9 8 A N N U A L R E V I E W O F C O M M U N I C A T I O N S ■ 921
pensive, but providing 28.8 kbps or 64 kbps is probably avery good application, and there is a good market for it. Forexample, students on campus could have laptops with wire-less modems to access the university database or the Internet.
In a PACS network, a number of different radio ports providea number of different services. Radio ports can be deployed inthe neighborhood to provide wireless local access, but PACSdoes not stop there. Higher-speed data and wireless central-ized exchange service (Centrex) are other PACS applications.In urban areas, PACS can be used for personal mobility, andthe same system and equipment can be used along highways.Carriers can start off with a local loop system and then addthese different applications with few if any incremental costs.
PACS is designed to support 80 to 100 Erlangs of traffic persubscriber, 10 times more traffic than is carried today by cel-lular. With analog cellular systems, there is a lack of privacyand security. With PACS, all transmissions are encrypted, sopeople cannot easily listen to a radio channel and eavesdrop.Before a user makes a PACS call, the system asks for specificinformation for an authentication algorithm. This securitysystem minimizes fraud, which is a big problem in the wire-less industry today.
PACS has a built-in short-messaging service, so customers donot have to carry both a PACS phone and a pager. The pagerfunctionality becomes part of the phone. The advanced intel-ligent network (AIN) functionality of the wireline networkcomes through to the wireless user for the most part becausePACS is based on simple technology and a simple interface toa class 5 switch. In fact, PACS interfaces using the integratedservices digital network (ISDN) to existing end officeswitches. All the investments in the wireline network can beused in a wireless local loop application that uses PACS,which results in lower costs: leveraging existing transport fa-cilities, existing AIN functions, and existing switches mini-mizes expense.
PACS is environmentally friendly. Hundred-foot towers andbig shelters are unnecessary for the service. Instead of buying
land to put up a tower, PACS equipment can be put on a tele-phone pole, a street lamp, or on the side of a building. Theradio port equipment is the size of a laptop computer.
On the network side, the voice coding for PACS has a delayof only five milliseconds one-way, or 10 milliseconds roundtrip, so echo cancellation in the network is not needed. Thisserves to reduce network cost. In CDMA, there is about 150milliseconds delay one-way, and it is like talking on a satel-lite system. The delay in CDMA and GSM systems requireecho cancellers.
PACS allows for reuse of a transport network and the T1 fa-cilities already installed by the telephone companies. AIN, theswitching system, and class-5 end offices all can be reused. Inthe PACS 16-cell reuse pattern, the first 16 cells take up all thefrequencies of a 10 megahertz license. The 17th cell reuses thefirst frequency, the 18th cell the second frequency, and so onthrough the 32nd frequency. The 33rd frequency is on thefirst channel again.
The frequency planning aspect of PACS is also important.In existing cellular systems and some PCS systems, exten-sive frequency planning is required. PACS uses an auto-mated algorithm designed by Bellcore called quasi-staticautomatic frequency assignment (Q-SAFA). All the radioports monitor all the known channels in the network andthen make a list of the observed signal level on each chan-nel. The system then rank-orders the channels from “nosignal” status to “some signal” status. When a channel hasno signal, it is free and a radio port can use it. Each one ofthe radio ports does this automatically, eliminating theneed for a staff of people to count all the different channelsin the network.
PACS Architecture
The frequency range that PACS covers is the band from 1,850MHz to 1,990 MHz. The radio frequency (RF) channels aresmall, taking up about 300 kHz of spacing. PACS uses 32 kilo-bits ADPCM with a frame duration of 2.5 milliseconds.
V I N A Y P A T E L
F I G U R E 1PACS PCS System Architecture

922 ■ 19 9 8 A N N U A L R E V I E W O F C O M M U N I C A T I O N S
Handoff in the system occurs at high speed, even at 65 to 75miles per hour, from radio port to radio port.
The transmit power for the portable and radio port equip-ment is less than one watt. CDMA, GSM, and IS-136 cellularsystems use anywhere from 20 to 45 watts of radio power.The lower the power, the less costly the service will be. Lowpower lessens the range but allows for smaller equipmentand minimizes the fear people have of developing cancerfrom the use of portable phones. The 200-milliwatt subscribertransmission power of PACS is among the lowest power sys-tems available today. Existing cellular phones use 600 milli-watts, and GSM uses up to 1.5 watts; these higher powerlevels tend to use up the battery. In addition, the 200-milli-watt power level of PACS is adaptive; the farther away theuser is from a radio port, the higher the power level. Thecloser the person is to the radio port, the lower the powertransmitted. This adaptation improves talk time.
As a TDMA system, PACS uses a frame with specific slots totransmit voice or data. PACS frames have eight slots: one isused as a control channel, and seven are used for traffic.Hence, seven simultaneous calls can be on the radio port onthe base station. Each frame is 2.5 milliseconds, so there are400 in one second. A short frame is good for propagation pur-poses, because if a frame is lost through interference, it can bethrown away by muting the audio for 2.5 milliseconds. Thehuman ear cannot hear a gap in a conversation of less than 15to 20 milliseconds so the loss of a few frames will not even benoticed. Even if five to six of these frames are lost, the cus-tomer will not notice it. DECT has a 10 millisecond frame,
and PHS has a five millisecond frame. In those cases, the lossof two or three frames is noticeable. The longer the framelength, the greater the likelihood of degraded quality in an in-terfering environment.
The PCS spectrum is divided between 10-MHz and 30-MHzallocations, between MTAs and BTAs. The A, B, and Clicenses are 30 MHz; the D, E, and F licenses will be 10 MHz.A 10-MHz licensee could have one radio channel at eachradio port (see Table 2). The voice channels per radio portwould be seven, allowing for 2.5 Erlangs of traffic in thatradio port. Assuming typical WLL subscribers have a trafficload of 80 to 100 milli-Erlangs, an RP can support anywherefrom 25 to 30 subscribers.
There are three ways to increase capacity. One is to add moreradio ports, which allows for more subscribers. The secondway is to cut the voice coding rate in half to 16-kbps voicecoding, which increases traffic capacity at each radio port by2.5 to 3 times. Half-rate voice coding frees up the frame toallow for fifteen voice channels instead of seven with 32 kbps.The third method of increasing capacity is to add more fre-quency. For example, by using 10 + 10 MHz spectrum, 2RFchannels can be used at each RP, and with 15 + 15 MHz, 3channels can be used.
The PACS PCS architecture is illustrated in Figure 1.Subscriber units are portable units used by a pedestrian or in acar. The wireless access fixed unit (WAFU) would be used in alocal loop environment. The subscriber units communicatethrough a common air interface to radio ports that connect toradio port controller units (RPCUs) through a T1 or high-speed digital subscriber loop (HDSL) facility. The radio portcontrollers talk to existing class 5 switches. The switch re-quires an ISDN interface and an AIN generic 0.1 interface.With those in place, existing class 5 switches can be used. InPACS, mobility management functions are offloaded fromthe switch into peripherals called access manager/visitor lo-cation register (AM/VLR) and home location register (HLR).These are intelligent peripherals that manage the mobility as-pects of the system and communicate with the switch by sig-naling system 7 (SS7). This radio system can be dropped inplace in an existing telephone company’s network.
Figure 2 depicts an indoor radio port. It has 20 milliwatts oftransmit power and is 9 by 12 by 2.5 inches, or about the sizeof a laptop computer. It weighs only four pounds. The portplugs into the wall for AC power, and with a T1 facility, itprovides the capability to serve 2.5 Erlangs of traffic.Normally this unit would be used in an office environment.
W I R E L E S S
F I G U R E 2Indoor RP (Ceiling Mounted)
32-kbps Channels 16-kbps ChannelsPCS Spectrum RF Channels/RP VCs Erls at 1% VCs Erls at 1%
5 + 5 1 7 2.5 15 8.1
10 + 10 2 15 8.1 31 21.2
15 + 15 3 23 14.5 47 35.2
T A B L E 2PACS Traffic Capacity

19 9 8 A N N U A L R E V I E W O F C O M M U N I C A T I O N S ■ 923
Depending on the traffic, 30 to 100 subscribers could beserved per radio port. The range of the unit covers one floorof a building as well as the floor above and below it.
Outside traffic is handed off to an outdoor radio port, which ismore rugged. It has an outdoor enclosure and built-in anten-nas (see Figure 3). It is about 13 by 17 by 4 inches and weighsabout 18 pounds. These units can be equipped with batterybackup. If the power goes out, the battery provides four to sixhours of operation. The radio power is up to 800 milliwattsand the only external connections are AC power and either anHDSL or T1 line for transport. One of the interesting thingsabout HDSL is that it provides both the transport facility andDC power. The outdoor port can operate at temperaturesfrom negative 40 to positive 50 Celsius. The range from theoutdoor radio port is up to one mile, or 1,600 meters.
The radio port controller unit is a large rack of equipment.One rack of two RPCUs will handle up to 336 radio ports. Thewhole system is controlled by an operations and maintenancecenter. The center is connected to each radio port controllerwith an Ethernet connection to the RPCUs (see Figure 4). TheRPCUs control the outdoor and indoor radio ports. The func-tion of the operations and maintenance center is to keep trackof the radio network, which includes fault isolation and diag-nosis, alarm monitoring, performance monitoring and log-ging, configuration management, radio element managementand control, and testing.
The PACS portable handset unit has indicators for roaming, ashort message service, receive signal strength, battery, andother functions. The talk time is about four hours, andstandby time is 168 hours, which is four to five times longerthan the typical cellular phone today. The longer battery lifeis due to the 200 milliwatts maximum power, power adapta-tion, a sleep mode, and the simplicity of the technology. Toperform 32 kilobits ADPCM, only one bank of digital signalprocessors is needed. With GSM, CDMA, and IS-136 systems,more processing power is needed, and processing power cutsdown the battery life. PACS requires very little processing inthe portable unit.
Implementing PACS in the Local Loop
When wiring a neighborhood for PACS, radio ports can be in-stalled on existing facilities such as telephone poles. The radioports allow wireless access by the wireless access fixed units(WAFU) installed in a house or office building. A typical cus-tomer premise equipment installation would involve a wire-less access fixed unit that would be installed in a house andplugged into the wall for AC power. It has an RJ11 connec-tion to plug in existing telephones. More than one phone can
V I N A Y P A T E L
F I G U R E 3Outdoor Radio Port
• RF power output: 800 mW
• Outdoor enclosure
• Employs spatial antenna diversity
• Network interface DS1 (T1/HDSL)
• Powering options: AC with battery backup orbattery feed from plant
• Environmentally friendly
• Size: 13” x 17” x 4” (884 cubic inches)
• Weight: approximately 18 lbs.
• Operating temperature: -40° C to +50° C
F I G U R E 4Operations and Maintenance Center (OMC)
• Fault isolation and diagnosis
• Alarm monitoring
• Performance monitoring and logging
• Configuration management
• Radio element management and control
• Testing

924 ■ 19 9 8 A N N U A L R E V I E W O F C O M M U N I C A T I O N S
be connected because the unit will drive up to three ringerequivalents (REN). The WAFU has a built-in tool to help lo-cate the optimal placement for the best signal. Total set-uptime should be no more than 15 minutes.
Some clients have had concerns about not getting enoughsubscribers. In a suburban area, a radio port mounted on atelephone pole will cover about 1.2 square miles or 768 acres,which equals about 1,000 to 1,500 homes. Given that oneradio port supports 2.5 Erlangs in a 10-MHz allocation andthat about 30 subscribers can be supported at 0.08 Erlangseach, only a 2% penetration, or 20 to 30 homes, is needed toload one radio port. The issue will not be whether there areenough subscribers for the radio port, but whether there areenough radio ports for the subscribers.
The operating environment for PACS could be urban, subur-ban, or rural. The radio port can be mounted 8 to 16 metersabove the ground, and the expected cell radius would be 300to 1,600 meters, depending on how high the radio port ismounted and the type of environment.
PACS Technology Trials
The most recent PACS technology trial was carried out byPacific Bell in San Francisco. Pacific Bell had the back-haul (T1facilities) and the switches. The company wanted to demon-strate a wireline voice quality system and achieve mobility ina microcellular PCS environment. It also wanted to show howPACS could integrate into the company’s DMS-100 class 5switch. As it turned out, the most important issue was localzoning in San Francisco. Local ordinances prohibited moreantennas in view. However, PACS is so small that it could beplaced inside of a building against a window.
The trial was a six–radio port installation. Two were installedin Moscone Center and four outside (see Figure 5). The system
provided continuous coverage from inside Moscone Center,where the PCS show was being held, to throughout the areashown in Figure 5. The system was installed and commis-sioned in less than four weeks, including identifying the sitesand ordering the T1s. The environment was downtown SanFrancisco, which contained numerous high-rise buildings.The voice quality was excellent, and handoff between radioports was demonstrated. The two indoor radio ports coveredthe entire Moscone Center. The PACS range in an urban envi-ronment was confirmed to be 300 to 400 meters. PACS suc-cessfully interfaced with a DMS-100 using two basic rateinterface (BRI) lines.
At the April 1996 CTIA show in Dallas, PACS’ ability to con-nect to an off-the-shelf fax-phone machine was demonstrated.The machine was connected to a PACS subscriber unit andthe telephone system using the PACS interface. With theradio interface into the controller and with a BRI connectioninto a class 5 switch (an AT&T 5ESS, the demonstrator pickedup the handset and successfully made a call. A fax was sent inthe fax machine at 9,600 bps. In this case, the environmentwas very stable (the radio port had a line of sight to the sub-scriber unit) and 9,600 bps delivery was possible. Note thatPACS guarantees 4,800 because of the 32-kbps ADPCM. Thetest showed that 9,600 bps can be accomplished with a clearline of sight or an adequate fade margin in the radio paths.
Another demonstration was done in September 1995 inOrlando. The purpose was to show the capability of PACS toprovide high-speed wireless data service. The demonstrationcombined two slots on the air and put a laptop with a 28.8modem on it. As mentioned previously, the TDMA frame haseight slots. By combining two slots and using 64-kbps pulsecode modulation (PCM) coding a clean channel was availableon the air. The laptop was then able to dial up on a 28.8 kbpswireless data line through the system. With a leased analogline from BellSouth and an account with an Internet serviceprovider, 28.8 kilobit wireless Internet access was accom-plished using PACS. At the time, no other wireless systemcould do that. After the demonstration, GSM and PHS startedto tout this capability. Moving forward with PACS, all sevenslots can be combined for high-speed packet data delivery onthe order of 200 kbps packet data. The basic platform allowsfor that capability.
The earliest demonstration of PACS put to rest the notion thatPACS could work only at pedestrian speed. In 1995, BellAtlantic installed telephone poles for mounting four radioports. The ports were brought back to an RPCU and con-nected to a 5ESS end-office switch using BRI lines.Demonstrators drove up and down a road at up to 60 milesper hour. The demonstration showed that communicationwas possible at 60 miles per hour with PACS. Handoff wasaccomplished and wireline voice quality was maintained atthat speed.
PACS has been demonstrated in various applications: wirelesslocal loop, wireless Internet, as well as for high-speed mobil-ity. It also has the ability to work in an urban environmentsuch as San Francisco. PACS is a next-generation PCS technol-ogy that offers highway-speed mobility with handoff. Higher-
W I R E L E S S
F I G U R E 5PacBell PACS Technology Trial

19 9 8 A N N U A L R E V I E W O F C O M M U N I C A T I O N S ■ 925
speed data transmission is possible through slot aggregation.There are standard interfaces to the switch, so the existingPSTN network can be reused, and the low complexity andlow-power equipment make for easy installations and lowcost to the operator. Finally, deploying PACS does not requiremuch spectrum. It works with 10 MHz, which makes PACSavailable to the D, E, and F PCS operators as well as the A, B,and C operators. The A, B, and C operators have 30 MHz andcould use 20 MHz for CDMA, GSM, or IS-136 and 10 MHz forPACS. This strategy will catch on as more companies discoverthe benefits of PACS and examine its capabilities.
In terms of current PACS deployments, GCI bought a B-blockPCS license for Alaska, and the company will deploy PACS.21st Century Telesis is a C-block winner. This company has17 markets in the PCS band covering 4 million people, and ithas committed to using PACS. Windkeeper Communicationsis the U.S. Virgin Islands winner for C-block, and it will beusing PACS as well.
V I N A Y P A T E L

19 9 8 A N N U A L R E V I E W O F C O M M U N I C A T I O N S ■ 927
Abstract
Wireless networks are growing rapidly around the world, andthe projected demand for higher capacity, coverage, data rate,and flexibility and range of services motivates the need to de-velop a new generation mobile standard. The InternationalTelecommunications Union (ITU) has been coordinating thestandardization of the future land mobile telephone system(FPLMTS), which it recently renamed international mobiletelephone-2000 (IMT-2000). The IMT-2000 system is promotedas a truly global, third-generation mobile-network standardthat will eventually replace current disparate second-genera-tion standards. The service initiation goal for IMT-2000 is theyear 2000. Japanese, American, and European companies andstandards bodies are currently finalizing candidate standardsfor the IMT-2000. A key decision in a mobile standard is themultiple-access system since it strongly influences the imple-mentation of many other system features. The leading con-tenders for multiple-access schemes are TDMA and CDMA.This paper explores the comparative advantages and disad-vantages of these two approaches for IMT-2000.
Introduction
ITU-R (Task Group 8/1) has been studying IMT-2000 stan-dardization as a global wireless access standard to serve anestimated one billion users early in the 21st century. The keygoals of IMT-2000 can be summarized as follows:
• Multi-rate services: A minimum of 2 Mbps indoor, 384 kbpspedestrian outdoor, 144 kbps mobile outdoors.
• Multicell, multi-mobility, and multi-density capability:Seamless coverage across pico, micro, and macro cells sup-porting different mobilities and user densities using terres-trial networks and global coverage with satellite networks.Also proposed are tandem links for relay services withintrains and aircraft.
• Multi-operator capabilities: Easy sharing of frequency bandacross operators with the lowest degree of granularity.
• High spectrum efficiency: Maximum b/s/Hz per base station.
• Multiple quality of service (QoS): BER target of 10-3 forvoice to 10-6 for data, maximum delay of 50 ms for voice(radio access) to variable delay limits for data.
• High communications security: For voice and data.
• Low granularity and high flexibility: In service buildoutand provisioning.
The minimum performance capabilities for IMT-2000 arelisted in Table 1. The IMT-2000 specification is driven by thephilosophy of a horizontally layered architecture with well-separated modular functions and clearly defined interfunc-tion interfaces. Moreover, it emphasizes the maximumindependence of the air interface. The radio is definedthrough a set of generic radio bearers, each with specifieddata rates and QoS, thus allowing flexible evolution of thestandard. The ITU is currently in the phase of accepting pro-posals from regional standards bodies. It is expected to evalu-
Third-Generation Wireless Systems:TDMA vs. CDMA RevisitedArogyaswami PaulrajInformation Systems LaboratoryStanford University
T A B L E 1Minimum Performance Capabilities for IMT-2000 Candidate Radio Transmissions Technologies
Test Indoor Office Outdoor to Indoor VehicularEnvironments and PedestrianMobility Low Medium HighHandover Required Required RequiredPacket Data Required Required RequiredAsym. Service Required Required RequiredMultimedia Required Required RequiredVar. Bit Rate Required Required RequiredMin. Data Rate 2048 Kbps 384 Kbps 144 Kbps

928 ■ 19 9 8 A N N U A L R E V I E W O F C O M M U N I C A T I O N S
W I R E L E S S
ate these proposals in 1998, and after a phase of consensusbuilding, it will embark on the specifications phase in 1999with the expectation of completing this by the year 2000.
Three major mobile radio standards bodies are expected tomake proposals to the ITU; these are Japan’s ARIB, Europe’sETSI, and the United States’ TIA. ARIB is likely to propose awideband CDMA (W-CDMA) system developed under theleadership of NTTDoCoMo. ETSI is currently considering sixmultiple-access schemes. One leading contender is an ad-vanced TDMA (A-TDMA) proposal backed by Siemens,Nortel-Matra, and Alcatel, among others. This proposal hassome degree of backward compatibility with GSM, a leadingsecond-generation TDMA system. The other contender is W-CDMA, which was proposed by several companies includingEricsson and Nokia. This has a slightly different flavor fromthe ARIB version of W-CDMA, but the two can be harmo-nized if ETSI adopts W-CDMA. The U.S. proposal is likely tobe yet another version of W-CDMA, motivated by backwardcompatibility with IS-95, a second-generation narrowbandCDMA standard.
This paper studies the trade-offs of the two leading multiple-access schemes, namely, A-TDMA and W-CDMA. ForTDMA, a baseline system proposed under the FRAMES pro-ject in Europe is used here. For W-CDMA, a generic versionthat incorporates baseline features of all three CDMA propos-als is adopted in this paper. These two multiple-access sys-tems are compared from two points of view: spectrumefficiency and flexibility/ease of implementation.
First, one basic difference between the two multiple accessmethods must be addressed. In TDMA, the spectrum is di-vided into frequencies and time slots yielding a finite set offully orthogonal channels that do not interfere with eachother. In CDMA, the use of quasi-orthogonal cover codesover orthogonal or quasi-orthogonal code sets yields an effec-tively infinite channel set in which each channel is quasi-or-thogonal to every other channel (possibly orthogonal withina subset). This means that every user in the CDMA networkcan have a unique channel with which all the other channelsinterfere weakly. In TDMA, since there is a finite but orthogo-nal set, the same channel must be reused, and physical sepa-ration must be employed between reuse cells to keepinterference manageable. Of course, if frequency channeliza-tion is used in CDMA, channels in a given frequency set re-main orthogonal to those from another frequency. Thisdifference in orthogonality and in the number of channels hasa strong influence on the performance variances between thetwo multiple-access schemes.
Points of Comparison
In this section, the generic factors that influence spectrum ef-ficiency and flexibility/ease of implementation are addressedas a prelude to the discussions of the two multiple accessschemes later in the paper. Spectrum efficiency is of criticalimportance in IMT-2000 and is traditionally the main battle-ground for competing multiple-access schemes. The main fac-tor driving spectrum efficiency is the degree of reuse that canbe sustained in the network. This leads to the fundamental
metric of spectrum efficiency—keeping the mean and stan-dard deviation of signal to interference ratio (SIR) for eachuser as low as possible and consistent with the required BER.As the standard deviation of SIR increases, however, the SIRmean has to be increased to maintain required BER. Also, ifthe SIR is sustained above the minimum necessary value, theexcess transmitted power increases interference to otherusers, which reduces spectrum efficiency.
A number of approaches used to improve spectrum efficiencywill be described below. Fundamentally these seek to mini-mize the STD of the signal and the interference power whilereducing the mean transmit power to meet minimum perfor-mance thresholds.
• Signal diversity: Diversity plays a central role since it canmitigate fading, a significant cause of SIR fluctuation.Diversity significantly reduces the required mean SIR tomeet the target BER.
• Power control: Since the signal and interference power ina wireless network fluctuate continuously, power con-trol ensures that each link has just enough transmitpower, no more and no less, to be consistent with thetarget BER. Power control can be used in both forwardand reverse links.
• Channel allocation: Channel allocation ensures that each useris allocated a channel for setting up a radio link to the fixedinfrastructure that needs the lowest transmit power inorder to meet the target BER.
• Channel estimation: In order to mitigate multipath and co-channel interference and to demodulate symbols effec-tively, the receive or transmit channels must be estimated.
• Interference grouping: This is related to channel allocationand relates to coordination of channel allocation within andbetween cells such that SIR for all the users is maximallyequalized (i.e., strong users are matched with strong co-channel interferers).
• Interference cancellation: This technique uses spatial and tem-poral differences in the user-signal signatures to reduce in-terference prior to demodulation. Clearly the ability tomitigate interference can improve spectrum efficiency.
• Interference diversity: This is analogous to signal diversityand minimizes the interference power fluctuation by aver-aging over multiple interferers.
Both TDMA and CDMA offer different advantages with re-spect to each of these spectrum efficiency-enhancing factors,which will be discussed later in the paper. IMT-2000 will besubstantially more flexible in services and operations than thecurrent second-generation systems, as was previously dis-cussed. Both TDMA and CDMA offer different advantages inthis respect, which will be addressed as well.

19 9 8 A N N U A L R E V I E W O F C O M M U N I C A T I O N S ■ 929
A R G Y A S W A M I P A U L R A J
Spectrum Efficiency
This section examines factors that enhance spectrum effi-ciency and discusses how TDMA and CDMA differ in spec-trum efficiency. Features that are common to both schemes,however, are not discussed; only points of difference will beexplored. Also, note that the forward link is usually the limit-ing link for spectrum efficiency. Therefore, the following dis-cussion will focus on the forward-link problem.
Signal DiversityTDMA can use frequency hopping (FH) to capture frequencydiversity across the entire operating band by using interleav-ing and forward error correction (I/FEC). FH is not readilyfeasible in W-CDMA due to problems with power control.
Multipath propagation also offers (path) diversity for bothsystems. TDMA captures this in the equalizer and CDMAthrough the RAKE receiver. Since the CDMA operates with awider bandwidth, the number of resolvable paths can ex-pect to be larger and offer higher diversity. In TDMA, theViterbi equalizer grows exponentially in complexity withchannel length (delay spread), whereas the RAKE grows lin-early in complexity.
Both TDMA and CDMA can use soft handover to realizemacro diversity gain. Two or more base stations transmitthe same information signal so as to arrive closely time-aligned at the subscriber unit. The equalizer in TDMA andthe RAKE in CDMA combine such multiple-base stationsignals to effect data detection. In TDMA, any differentialdelay between the arriving signal bursts will appear asdelay spread and therefore exponentially increase theequalizer complexity. In CDMA, the RAKE handles thiswith linear complexity. Since accurate timing synchroniza-tion will not be possible in large cells, due to differentialtransmission delays, macro diversity is complicated inTDMA. Therefore, TDMA systems employ hard handoff,which, if done instantaneously, can provide macro diver-sity gain comparable to that of soft handoff. However, hardhandoff needs adjacent cell carrier measurements and con-trol signaling, which take one to two seconds, and frequentping-pong handoffs are not desirable. Therefore, a three tofour dB hysteresis threshold is often employed to reducethis ping-pong effect, which reduces macro diversity gainfrom hard handoffs in TDMA.
Power ControlTight power control is difficult to implement on the forwardlink in TDMA because the mobile receives and transmits indifferent slots and cannot return received signal-power infor-mation. Similarly, on the reverse link, the base is unable tomeasure mobile power levels continuously and cannot imple-ment tight power control. TDMA systems can be designed tocope with little or no power control by using higher reuse fac-tor. Nevertheless, poor power control translates to the loss ofspectrum efficiency.
In CDMA, power control is essential to system performanceunless sophisticated multiuser detection (MUD) is employed.However, since both links are continuously active for every
user, it is possible to implement tight power control on eachlink. The availability of better signal and interference diversityin CDMA also makes SIR fluctuations smaller, improvingpower control performance. In large cells, slow-moving sub-scribers at the edge of the cell that are not in soft handoff,could need high transmit power during deep fades to sustainBER performance. This can result in amplifier saturation (clip-ping), causing poor power control and/or an outage.
Channel AllocationChannel allocation performance is best deployed if there area large number of channels or channel pools from which tochoose. In TDMA, it is possible for the base station and sub-scriber unit to scan these channels during slow periods andchoose the best channel. In TDMA, if the reuse factor is small,there are large numbers of channels available in each cell. InCDMA, typically only one carrier may be available for eachoperator in a cell. Moreover, the subscriber unit cannot scanother carriers to check for good channels. Unlike TDMA, allchannels (codes) within a carrier have the same SIR perfor-mance, diminishing the value of channel grouping.
Channel EstimationIn TDMA, the response of the channel to a single symbol mustbe estimated, and the total channel length is the sum of thedelay spread and the symbol duration. Such a response can beestimated by transmitting a training sequence that must beabout three to four times the channel length. If the channel istime varying, it must be tracked by frequent retraining.Moreover, if interference cancellation is used, further estimationand tracking of the interference channel is necessary. In unsyn-chronized networks or synchronized macrocells, the signal andinterference slot may be misaligned, which causes suddenchange in the interference channel during a slot. These factorsmake channel estimation and tracking expensive in TDMA.
In CDMA, the use of unique spreading sequences directly of-fers a training resource. Estimation of channel parameterssuch as path delays can be done without explicit training sig-nals. Moreover, paths separated by more than one chip arequasi-orthogonal and do not interact; the channel of a path isdescribed by a single tap (complex scalar). Therefore, thechannel can be estimated using one or two training symbols.Also, in CDMA, signals flow continuously, which avoidsproblems associated with slotted operation in TDMA. Thismakes channel estimation easier in CDMA.
Interference GroupingIn TDMA, the ability to scan across all the channels makes iteasy to group users with channels such that the SIRs aremaximally equalized. Use of tiered cells and different reusefactors are examples of this flexibility. In CDMA, suchgrouping is not possible. A strong interferer can reduce per-formance or even shut down the network by interferingwith all channels. In addition, grouping across frequencychannels is not possible since the subscriber unit does nothave cross-frequency visibility.
Interference CancellationIn TDMA, the interference pattern is typically characterizedby, at most, one or two strong interferers. Spectrum efficiency

930 ■ 19 9 8 A N N U A L R E V I E W O F C O M M U N I C A T I O N S
W I R E L E S S
can be bought by reducing interference power by spatial pro-cessing and can use a better reuse factor. This requires theability to null interference, which, in turn, requires accuratechannel knowledge. Interference cancellation in the temporaldomain is not practical in TDMA unless MUD is employed.Even so, this requires accurate channel estimation for desiredand interfering signals, which is hard to achieve.
In CDMA, temporal interference cancellation is possible sincesignals have inherent signature waveform differences andchannel estimation is easier. Moreover, spatial interference re-duction is easier since, in CDMA, the interference pattern is alarge number of weak interferers. Therefore, a simple robustbeamforming rather than the less robust interference nullingis needed in TDMA.
Interference DiversityIn TDMA, interference diversity is obtained through randomfrequency and time hopping and is extracted through I/FEC.Since the desired signal “sees” a different interferer in everyframe, the I/FEC can correct situations when one frame hasan exceptionally poor SIR. However, since the interleaverdepth is limited by the delay tolerance, the available interfer-ence diversity is also limited. In CDMA, interference diversityis available at symbol level, since all the interferers are activeand contribute to the SIR at each symbol. The degree of aver-aging is much higher particularly for W-CDMA.
Summary Clearly both CDMA and TDMA have advantages and dis-advantages for maximizing spectrum efficiency. While thispaper does not attempt a quantitative analysis of thesetradeoffs, the results of a quick study show that widebandCDMA has, on balance, an advantage over TDMA throughits advantages in signal and interference diversity and tightpower control.
Flexibility and Implementation
This section examines the differences between TDMA andCDMA in flexibility and ease of implementation.
Multi-Rate ServicesTDMA supports this via multi-slot (M-SL) and multi-carrier(M-CA) methods. Multi-slot methods aggregate a number ofslots to provide the necessary data rate. If M-SL is not suffi-cient, M-CA aggregation can be added. Use of M-SL and M-CA techniques reduce the possibility for signal andinterference diversity via frequency and time hopping. CDMAsupports multi-rate services by multi-spreading factor (M-SF),multi-code (M-CO), and perhaps also M-CA. M-SF adjusts thespreading factor to support different rates, and M-CO sup-ports higher rates by aggregating multiple code channels. M-CO requires a RAKE receiver for each code channel increasinghardware complexity compared to M-SF. However, as thespreading factor reduces, inter-symbol interference—normallyabsent in CDMA—can become a problem.
Multicell, Multi-Mobility, and Multi-Density OperationsTDMA and CDMA do not have strong differentiation inmulti-mobility and multi-density operations. In multicell
operations, TDMA has an advantage since different cells arestrictly orthogonal to each other—despite their disparatepower levels—as long as they are assigned different channels.In CDMA, code channels are quasi-orthogonal and thereforethe cells cannot be adequately isolated from each other. Thiscauses several difficulties in deployment.
Multi-Quality-of-Service (QoS)In TDMA, the slotted operation makes it less flexible to pro-vision different QoS services because power control cannot beused for establishing different BER. In CDMA, continuousbearers make this easier.
Multi-Operator ServicesIn TDMA, use of narrower channel bandwidths allow multi-ple frequency channels, which can be shared among carri-ers. In CDMA, use of wide bandwidths reduces thisflexibility. A more interesting opportunity for multi-opera-tor services is sharing at a much lower granularity such astime slot or code. Here, TDMA, with orthogonal channels,offers easier coordination.
Power Amplifier DesignIn TDMA, the peak amplifier power is equal to Ns times theaverage power level, where Ns is the number of slots perframe. In A-TDMA, Ns is high due to multi-rate services, andthe peak power becomes very high, which results in highercosts and amplifier pulsing along with attendant EMC prob-lems. CDMA uses continuous transmission and can, there-fore, work with lower peak power, which makes forelectromagnetic, interference-friendly amplifiers.
Control ChannelsIn TDMA, logical channels are mapped to slotted physicalchannels. This sometimes complicates the control flexibilityin TDMA. For example, in TDMA, forward power control isdifficult to implement since the subscriber unit needs to lis-ten to slots—other than its own traffic-bearing slot—forcontrol information access or the unit needs look-ahead an-tenna diversity. This makes it imperative to transmit allslots at full power to make them visible to all subscriberunits. CDMA uses continuous bearers and, therefore, offersnatural advantages.
Frequency PlanningTDMA requires channel reuse factors ranging from 3 to 9.This requires careful frequency planning to reflect propaga-tion and traffic density variations. In CDMA, the reuse factoris one and, as a result, this effort is unnecessary. However,both multiple schemes still need considerable network plan-ning to decide base station location, antenna height and downtilt, and beacon power level.
Conclusions
This paper has presented a qualitative discussion of TDMAvs. CDMA. A quantitative discussion is beyond the scope ofthis paper. On the balance, W-CDMA has a higher spectrumefficiency, while TDMA has advantages in deployment flexi-bility. The final choice of multiple access scheme will alsohave to keep backward compatibility issues in mind, which

19 9 8 A N N U A L R E V I E W O F C O M M U N I C A T I O N S ■ 931
A R G Y A S W A M I P A U L R A J
could undermine the ITU goal of one world standard andlead to multiple (possibly three) standards for the IMT-2000.
References
1 European Commission. Toward the Personal Communication Environment:Green Paper on Mobile and Personal Communications, DGXIII, April 27, 1994.
2 Grillo, D., S. Chia, and N. Ruelle. The European Path Toward AdvancedMobile Systems. IEEE Personal Communications, vol. 2, no. 1, pp. 2-3,February 1995.
3 Paulraj, A., “Diversity Techniques,” CRC Handbook on Communications, ed.by J. Gibson, CRC Press, vol. 11, pp. 213-223, December 1996.
4 ——— and J. Sorelius, “CDMA for Mobile Communications,” WileyEncyclopedia on Electrical and Electronics Engineering, ed. by J. Webster,Wiley, 1998.
5 ———. “The Evolution of Mobile Communications.” Communication,Control, Signal Processing, and Computers, ed. by A. Paulraj, C. Schaper, andV. Roychoudry, pp. 141-154, Kluwer: New York, February 1997.
6 Urie, M. Streeton, and C. Mourot. An Advanced TDMA Mobile AccessSystem for UMTS. IEEE Personal Communications, vol. 2, no. 1, pp. 38-47,February 1995.

19 9 8 A N N U A L R E V I E W O F C O M M U N I C A T I O N S ■ 933
For three decades, communication satellite systems haveplayed a key role in international and long-distancetelecommunications services. This role, however, haslargely been that of a support facility rather than a primarysystem. Satellites were always well removed from the enduser. Consumers received their bills from the telephonecompanies, cable-television provider, cellular phone com-pany, or a software company. Satellites were trapped welldown the value-added ladder and were often owned andcontrolled by monopoly telephone providers. Space activi-ties, including space telecommunications, were small in-dustries in comparison to transportation, energy,insurance, banking, or the broad fields of telecommunica-tions and information.
In the coming decade, however, new types of “direct access”satellite systems will be making a bid to play center-stageroles. There is approximately a decade-long window of op-portunity for direct-to-the-consumer satellite services to growto a global scale and play a major role, along with fiber-opticcable and wireless communication systems in a hybrid ormerged information market. This new merged market, whichsome have called the global information highway or theglobal information infrastructure (GII), will be huge.
By the year 2001, global information and computer serviceswill represent nearly $2 trillion (U.S.), and global telecom-munications services will represent close to $1 trillion. Thismeans that about one out of every $15 spent on the entireplanet would be in this sector of the economy. This wouldmake information and telecommunications the largest partof the world economy—larger than energy, transportation,or agriculture.
The Dynamic Tension Between Satellite and Fiber-Optic Networks in the Age of Multimedia
The dominant pattern in telecommunications, at least in theindustrial countries, has been the widespread deployment ofterrestrial networks of copper wire, coax, and fiber-optic sys-tems, especially in connecting to the end user. Suddenly, theoptions for providing telecommunications to the local loop—the so-called last mile—have changed. Now, new types ofsatellite networks can provide comprehensive communica-tions solutions that reach all the way to the consumer withnew economic strength and service flexibility.
In particular, high-tech providers of new micro-terminals thatcan receive television directly from the satellite and return adigital pathway to the satellite are promising a revolution.This evolving type of satellite service that does not yet exist asan operational service is called “interactive direct broadcastsatellite (DBS)” in this report. This service can evolve from thenext generation of DBS satellites or the new Ka-band multi-media high data-rate satellites. (In fact, a review of filingsmade with the FCC and the International TelecommunicationUnion (ITU) suggests that both types of satellite systemswould intend to provide video entertainment and interactivetelecommunications services).
If organizations such as Motorola, Hughes Network Services,NEC, Ericsson, or even new players such as LG (Goldstar ofKorea) or Nokia can deliver interactive micro-terminals andsell these products for under $1,000 around the years 2000-2001, there is a real potential for a satellite revolution intelecommunications as we enter the next century.
Terabits for Sale
Today, some 50 satellite carriers have deployed some 200GHz of capacity in earth orbit. Within the decade, based onspecific filings for new satellite systems, there could be two tothree times as many satellite carriers and up to 2,000 GHz ofcapacity in low-earth orbit (LEO), medium-earth orbit (MEO),and GEO orbits. This is sufficient capacity to deliver over fourterabits per second of capacity anytime and anywhere onearth. This is the amount of capacity needed to make satellitescapable of entering new multimedia and broader-band ser-vices. These are not your father’s satellites. These are a wholenew breed of “smart” and broadband satellites with many-fold frequency re-use that can provide prodigious amounts ofcapacity anytime and anyplace.
This satellite revolution arises out of three key sources. Thesecauses are converging in a powerful way. These sources arenew satellite and ground-terminal technologies, the restruc-tured and competitive telecommunications markets, and newregulatory processes that allow a bypass of traditionaltelecommunications networks. This process is now at work inthe United States and many of the industrialized countries ofthe world.
Satellites to Beat Wired Networks attheir Own GamesJoseph N. PeltonProfessor, Interdisciplinary Telecommunications ProgramUniversity of Colorado

934 ■ 19 9 8 A N N U A L R E V I E W O F C O M M U N I C A T I O N S
W I R E L E S S
The Satellite Revolution Can Happen In AnyCountry—Developed or Developing
Satellite communications in developing countries and ruraland remote areas are different, but a revolution will happenhere as well. The use of the new satellite technologies appearsto make a great deal of sense in areas where traditionaltelecommunications networks are lacking. This, in fact, tendsto give satellites more of an edge, but regulatory constraintsin some of the countries can slow satellite growth.
The truth is that the satellite revolution can happen in anycountry at any level of economic development. It is surpris-ing that new and highly efficient satellites that are designedto provide mass-consumer services can begin to challengefiber-optic networks even in urban environments. In manyways, this trend is parallel to the emergence of plans to usewireless networks to penetrate to the home in the U.S.telecommunications market by AT&T and Sprint Spectrum.The same type of logic suggests that satellites, such as ter-restrial wireless, can also provide a new form of direct ac-cess. For a cost similar to that of the installation of a cableTV system in the greater New York area, a national directbroadcast satellite system for the continental United Statescan be deployed. Furthermore, new customers can be acti-vated one at a time anywhere in the entire service area with-out installing new infrastructure beyond the customerbuying or leasing a small and easy-to-install dish.
The Move to Truly Mass Markets
As the next century quickly approaches, a new and dynamicrole for satellite systems seems to be quickly emerging. New,direct broadcast satellite systems and mobile satellite net-works are increasingly providing mass-market services di-rectly to pizza pan-sized micro-terminals and hand-heldtransceivers. Although broadcast satellites and mobile satel-lite systems first defined this trend toward direct consumeraccess, there will likely be an expanding circle of mass-marketsatellite services in the next century that, in some cases, willbypass conventional telecommunications networks. This, infact, is the economic key to satellite’s 21st-century success.These new systems can and will bypass the traditional wire-based and static terrestrial systems of the past.
Regulatory Barriers and Constraints of Trade WillHold Back New and Innovative Satellite Services
The major barrier for satellite systems to overcome in thecoming decade is not in implementing new technology (al-though clear technical challenges do exist). The real test willbe successfully surmounting the regulatory barriers that pre-vent satellite systems from bypassing the established terres-trial networks and skipping over the traditional carriers.Records of the European Commission Directorates IV, XII,and XIII, for instance, reveal how new carriers seeking toenter the telecommunications market have filed dozens ofcomplaints against established carriers and the roadblocksthey can deploy to block new entry and bypass of their terres-trial networks. Particularly in countries where telecommuni-cations monopolies still exist, direct-to-the-consumer satellitesystems will be slowed. Even those countries participating inthe World Trade Organizations’ GBN agreements to opentheir national markets to competition face numerous loop-holes that can block new satellite entry.
The Power of Digital Convergence
The next wave of the direct-to-the-consumer satellite revolu-tion will likely come from the new Ka-band multimedia highdata-rate satellite systems. These innovative new satellite sys-tems with a broad block of spectrum to use for broadbandservices promise to push this direct-to-the consumer revolu-tion to new levels. If these trends continue, satellites willmove dynamically forward, exploding into a wide range oftelecommunications, entertainment, information, and naviga-tional services. These new satellites seem optimized for theera of digital service convergence and the new integrated of-ferings of the so-called ICE age of information, communica-tions, and entertainment. The forces of this revolution comefrom several key sources, which can be summarized asshown in Table 1.
The Local Loop: The Achilles’ Heel of TraditionalTelecom Systems
There are fundamental forces of technology and market atwork here. First, satellites (as well as wireless systems) are apowerful way to bypass existing terrestrial networks. This is
T A B L E 1Traditional Hierarchical Telecommunications Network Architecture
19 9 8 A N N U A L R E V I E W O F C O M M U N I C A T I O N S ■ 935
J O S E P H N . P E L T O N
key because the shift in the market (i.e., the bypass of the localloop) suddenly allows satellite and wireless systems to com-pete economically with fiber.
This is perhaps the most important point. Wireless bypass ofthe “wired” local loop means that fiber does not automati-cally win. A satellite system that connects directly to the con-sumer can deliver service at the critical threshold of under$1,000 per household. The copper wire-based local loop at theend of fiber networks remains the Achilles’ heel of traditionaltelecommunications carriers.
Thus, new competitive systems will frequently use wirelessrather than wired access. This is because they will typically beunwilling to invest in a complete, expensive, and slower to in-stall fiber network. Second, in the new globally restructuredmarket, it may well be ironically true that a new competitiveentrant in one new market is, in fact, the established domi-nant carrier in another. AT&T and Sprint are the major newentrants using wireless technology to seek local access in theU.S. market. Because of their enormous expense, if Ka-bandmultimedia satellites are to succeed, they will need to attractlarge amounts of capital from dominant carriers.
New Patterns of Globalization of Satellite Systemsand Services
Clear-cut examples are Korea Telecom’s decision to invest inthe ICO mobile satellite system and also their probable back-ing of Lockheed Martin’s Astrolink. Furthermore, AT&T hasinvested in Teledesic and DirecTV and almost made a multi-billion dollar commitment to a Ka-band VoiceSpan systembefore getting cold feet, withdrawing from the field, and sell-ing off the Telstar system to Space System Loral. In the comingmonths, dozens of similar examples will abound as now con-fidential negotiations are completed and announced. Playerswill likely include MCI, Telecom Italia, France Telecom, andGlobal One.
For the previous reasons and more, this study concludes thatthe new mass-market-oriented satellite services will claimmore customers, generate more revenues, and utilize morespectrum over the next decade. Overall, the new types ofsatellite systems will stake out an increasing portion of thetrillion-dollar pie represented by the rapidly expandingglobal telecommunications market. Satellites will, in short,succeed, grow, and reach increasingly toward end-user cus-tomers. To put this projected success of the satellite industryin perspective, the satellite share of the market will remainwell behind fiber and wireless systems. Nevertheless, by2005, it could claim some 10 percent of the global total of thetelecommunications market.
In parallel with these trends, there is also the spread of thesatellite communications market across the global economy—both as a key telecommunications service and an expandingindustrial market. A current study conducted by NASA andthe National Science Foundation concludes that there isgrowing capability, investment, and operational participationin satellite communications on a global basis. In addition tothe United States, Europe, Russia, and Japan, there are new
design, space, and ground-system manufacturing andtelecommunications services emerging in Brazil, Canada,China, India, Israel, and South Korea.
Some of these countries, such as the Republic of Korea, aremaking multi-billion dollar investments in new internationaland regional satellite systems, creating sophisticated cleanrooms and high bay-area test and integration facilities, whichequal the most sophisticated in the world and reflect sincereintentions to be serious competitors in the world space mar-ket. Other countries such as China, India, Indonesia, andBrazil, with nearly 40 percent of the world’s population, arecommitted to the deployment of satellite systems to meet asignificant portion of their future telecommunications needs.These new industrializing giants are rapidly developing satel-lite communications capabilities in partnership with high-technology partners such as the United States, Japan, Russia,and Europe. Overall, satellite systems will grow rapidly acrossthe globe.
Satellites can become an important part of the so-called na-tional information infrastructure (NII) in the United Statesand likewise constitute a key part of the global informationinfrastructure (GII) on a worldwide basis. The so-called com-ing satellite revolution has several interlinked parts.
The Direct Broadcast Satellite or Direct-to-the-Home Satellite Revolution
In the early part of 1995, officials of TCI, the largest cable tele-vision MSO, reached an agreement to purchase the so-calledfourth direct broadcast satellite (DBS) license, which was thenin jeopardy of default for non-performance. The negotiatedprice was a healthy $34 million. The FCC considered thispending transaction and declared it null and void. They notonly declared the license in default but also proceeded tohold an open auction to determine the final price. When MCIended up bidding an astonishing $654 million for this na-tional direct broadcast license, it established two things. First,it showed that the FCC’s financial judgment in this matterwas pretty sound. Second, it clearly signaled the beginning ofa new age. A vibrant and commercially expansive stage forthe satellite industry had clearly begun.
In the U.S. market, DirecTV has over two million subscribersand is growing strong with ownership now extending be-yond the original GM/Hughes Communications Corporationto include Microsoft and AT&T. Soon, this same technologywill be beamed by Hughes’s Japanese partner SatelliteCommunications Corporation (SCC). This will begin with theprovision of 100 compressed digital channels to Japanese con-sumers in competition with other new digital DBS systemsthat will also begin in 1998 in Japan.
There is already strong competition in the United States’ di-rect-to-the-home television market. This comes fromHubbard Broadcasting’s USSB system, the Primestar networkbacked by TCI (and perhaps soon also in partnership with theNews Corporation and the Fox network), and the recently de-ployed Echostar and the incipient MCI DBS system. Echostar,although deployed only some months ago at the “Dish
936 ■ 19 9 8 A N N U A L R E V I E W O F C O M M U N I C A T I O N S
W I R E L E S S
Network,” already has several hundred thousand sub-scribers. With all of these DBS systems, it appears that 10 mil-lion or more subscribers to satellite television can be achievedin two years from the current base of over seven million DTHand conventional satellite-TV subscribers. (This figure dividesabout five million DTH/DBS subscribers and two millionconventional backyard satellite systems).
In Japan, there are already over 10 million analog DBS sub-scribers. The next stage is now just beginning. Digital sub-scribers on the Japanese Perfect TV (via JCSAT) and theDirecTV offering via the SCC Supersat systems are expectedto rocket upward when service begins in earnest in 1998.
In Europe and Asia, there are also now millions of DBS/DTHsubscribers on systems such as Astra, British SkyBroadcasting, TV-Sat, TDF, AsiaSat, Apstar, and the already-cited JCSAT and SCC. In short, this revolution is now goinginto full swing on a global basis. The first digital satellite tele-vision service delivered through JCSAT is known under thetrademark “Perfect TV,” and so far these systems have in-deed performed flawlessly in both a technical and marketsense. Part of this story is that satellites are now attracting ex-tensive capital investment from financial markets, and inter-national participation by the dominant players in the world ofglobal telecommunications are crisscrossing global bound-aries with ease and regularity.
Satellites can no longer be considered a minor adjunct to theoverall field of modern telecommunications but a key force inthe overall wireless revolution that has become a major themeof the 1990s. In this regard, DBS is leading the way in makingsatellites a direct-to-mass-consumer market. On a globalbasis, with lightening-like speed, the News Corporation hasmanaged to move toward a nearly global direct-to-the-homecapability via a network of different direct broadcasting sys-tems. These include British Sky Broadcasting in Europe, plusAsiaSat on the Asia mainland, and now a pending merger inthe United States. (This was first to have been with Echostarand when this went awry negotiations began with Primestar.)Finally, to cover Latin America, the News Corporation hasleased capacity on Intelsat 8 and 8A satellites for additionalDBS coverage.
The DBS/DTH service is clearly the most rapidly growingsatellite telecommunications offering. The DBS/DTH indus-try now represents at least 25 million subscribers at some $9billion in annual revenues on a global basis. These numberscould increase by a factor of more than two times in terms ofsubscribers and revenues. It is growing faster than cable tele-vision, personal communication services, paging, or anyother major telecom service. Furthermore, the next generationof DBS/DTH satellites will be offering more than just videoentertainment. Instead, a host of interactive capabilities willbe offered by these flexible, multi-purpose systems.
The Mobile Satellite Communications Revolution?
This revolution is still in its infancy, and some doubt it willever duplicate the force and velocity of the direct broadcastsatellite revolution. It will be another three to five years be-
fore the jury of consumer opinion will definitely be in on mo-bile satellite services. The current generations of mobile satel-lite systems such as those represented by the InternationalMaritime Satellite Organization (Inmarsat), the AmericanMobile Satellite Corporation (AMSC), the Hughes-led consor-tium that serves the North American market, and the TelesatMobile Incorporated (TMI) are not “revolutionary” in theirvolume of traffic or market impact. To date, revenues andmarket growth for these services are disappointing.
Inmarsat has an established maritime and moderately grow-ing aeronautical base of customers. Nevertheless, its poten-tial for rapid expansion over the next decade is limited.AMSC and TMI are desperately trying ways to find a “con-vincing and viable” customer base for land-mobile services,including the offering of promotional rates for multimediamobile services.
On the horizon are a half a dozen new satellite systems thatare poised to offer truly personal mobile communications toindividual consumers with hand-held phones (but still fairlylarge and heavy cell phones) at rates ranging from $1 to $3per minute. It is clearly a radical breakthrough in terms of ex-otic new technology, but “gee-whiz” technology is notenough. Exotic marvels do not necessarily pay the bills. Themarket success must still be demonstrated. Already, theMotorola Iridium system has deployed the first phase of its66-satellite network in bid to be first into this market, andGlobalstar and ICO are not far behind. Many market analystsbelieve that most of the profits in land-mobile satellite ser-vices will come from the sale of ground equipment ratherthan from the sales of satellite service.
Before the year 2000, there are likely to be three or four ofthese new low- and medium-earth orbit constellations in ac-tual operation and actively seeking customers. It is not clearwhether there is sufficient market for other systems thatmay follow. In short, while the direct-to-the-home/DBSsatellite systems have huge potential and great market per-formance to date, the mobile satellite market seems muchmore uncertain.
The Ultimate Satellite “Bypass Revolution”—TheBroadband Direct-to-the-Consumer Challenge
The re-emergence of satellite communications as a force in therapidly expanding global information systems of the 21st cen-tury will not come from a single source but from several ofthem combined. As noted in Table 1, it is a combination of newtechnologies, market convergence, competitive regulatory en-vironments, demand for mobile, digital, and flexible services,and standards allowing terrestrial and space networks to linktogether that are all a part of the recipe for change and innova-tion in the new world of satellite telecommunications.
Overall, this satellite revolution (and the wireless telecommu-nications revolution along with it) does have one commondenominator. It is the move from large, hierarchical, and mo-nopoly-oriented satellite systems to new competitive spacenetworks that deliver mass-consumer-oriented services di-rectly to end users in the home and office.

19 9 8 A N N U A L R E V I E W O F C O M M U N I C A T I O N S ■ 937
J O S E P H N . P E L T O N
As shown in Figure 1, traditional telecommunications havetended to concentrate into a vertical hierarchy. This concen-trated traffic is then routed via high-capacity broadband linkssuch as fiber-optic cable to connect major nodes together. Atthe other end, the traffic is deconcentrated and routed to theend user through the local loop. Because of their ability to di-rectly link many points to other points through wireless localloops, satellites can follow a much different network architec-ture. They are most efficient as a mesh or horizontal network,as shown in Figure 2.
This “democratic” networking capability of satellites is whybypass economics suddenly seem so attractive. This satelliterevolution certainly has more to it than technology and newtypes of network architecture. Equally, it has a great deal todo with law, the national licensing of satellite systems (some-times call landing rights), regulatory policy, trade regulations,frequency allocation, and partnerships with local carriers. It isstill too early to tell how successful new global systems suchas Teledesic, Hughes Spaceway, and others will be in provid-ing cheap “bypass” services to business users if they cannotobtain easy and non-restrictive access directly to their cus-tomers. Many of these new systems are technologically bril-liant, but the challenge is indeed regulatory.
In many ways, the power of the Internet revolution derivesfrom the Internet’s non-hierarchical structure and its flexible,almost random way of interconnecting. The power of the con-sumer-oriented satellite networks and its new flexible archi-tecture are remarkably parallel.
The next step in the evolving satellite revolution is the mostcritical. The challenge is to develop broadband high data-rate satellites that can deliver any and all services to busi-ness and home consumers. New high-capacity, high-power,high data-rate satellites will test whether satellite systems
can truly aspire to compete with fiber-optic networks headto head. Already, conventional satellites can deliver all typesof services from low-rate data service to micro-terminals at1.2 kbps to high data-rate services at 155.5 Mbps through 72-MHz transponders. The next steps will be to have the sys-tem capacity and onboard processing capacity providecost-effective interactive multimedia services. The most ad-vanced designs of Teledesic, Spaceway, Astrolink, and M-Star seem to promise cost-effective space segment capacity.The development of the cost-effective ground segment (ofunder $1,000 per interactive micro-terminal) is the elementthat is most in doubt.
In short, the broadband, direct-to-the-consumer satellite rev-olution is increasingly real. The most critical test in this re-gard will come from the broadband personal mobilecommunications satellites where billions of dollars in new in-vestment have been boldly proposed. This new “revolution”is no less than an attempt to establish parity between satelliteand fiber-optic cable networks.
When the September 29, 1996, Ka-band filings with the FCC fornew high data-rate or multimedia satellites systems were com-plete, it was clear that the telecommunications revolution of the1990s was truly firing its guns into space. When the smoke hadcleared, there were a total of 15 Ka-band satellite systems onfile with the FCC, with five of these for domestic U.S. serviceand ten for global coverage. In addition, Intelsat has indicatedthat it will deploy Ka-band satellite systems for global services.Furthermore, the Alcatel-backed Skybridge satellite systemwill also vie for this market when it is consolidated withCyberstar. Recently, on Friday, June 13, 1997, Motorola filed anew Ka-band system called Celestri that will directly competewith Teledesic for spectrum and market. Clearly, the estab-lished Intelsat system is in for a major challenge that goes wellbeyond that posed by today’s competitors.
F I G U R E 1Traditional Hierarchical Telecommunications Network Architecture

938 ■ 19 9 8 A N N U A L R E V I E W O F C O M M U N I C A T I O N S
W I R E L E S S
Even more significantly, these new systems are not just a se-ries of systems planning to compete with the Intelsat globalsatellite network. These new high data-rate satellite systemsare aimed at competing with ground-based broadband fibernetworks. These satellite systems are aimed at competingwith the mainstream terrestrial telecommunication systemsand are targeted to go directly to business offices and thehome. The bypass revolution cited previously will be foughtwith these innovative high data-rate satellites that requireonly small low-cost micro-terminals no more than 50 to 65centimeters in size.
If they are all built, only the proposed capital investment inthese new Ka-band satellites and launch services will exceed$50 billion. Table 2 summarizes the key features of these pro-posed new satellite systems, which collectively suggest an al-most complete change in the landscape of the satelliteindustry. The true meaning and implications of the 19 sys-tems summarized in Table 2 must be put in perspective. Onthe basis of past experience with FCC-competitive satellite fil-ings, it seems likely that at best only a third to half of thesesystems will actually be built and deployed. Indeed, the con-
solidation and withdrawal process has already begun. Yet,even if a greatly reduced number of these systems were actu-ally placed in service, it still implies a huge investment and asea change in the way satellite telecommunications are of-fered to the end users.
Huge Capital Investments in New Satellite Systems
The total proposed investment is nearly twice the totalamount of investment in all cellular telephone systems in theUnited States since the start of these new mobile services in1984. Even if the proposed investments were reduced to athird of the initial filings, it still means new capital commit-ments equivalent to U.S. investments in wireless and satellitesystems through 1995.
Satellites can no longer be considered an obscure telecommu-nications footnote. Along with wireless terrestrial, satellitetelecommunications mobile services are likely to have thegreatest percentage growth of any new telecommunicationsservice over the next decade including fiber-optic systems.Satellites have now become a very big business.
F I G U R E 2Horizontal or Mesh Networks of Satellite Systems

19 9 8 A N N U A L R E V I E W O F C O M M U N I C A T I O N S ■ 939
J O S E P H N . P E L T O N
T A B L E 2 . 1Key Satellite System Features
Operator-Name Orbit #Satellites
Services EstimatedCost
Deployment Dates
Alcatel - Skybridge(Ku-band-
noninterferingw/GEO (SATIVOD)
LEO To bedecided
(after beingmerged withCyberstar)
Voice, data, andmultimedia
* 2001 or later
Alenia - Euroskyway(Ka-band)
GEO 4 Voice, data, andmultimedia
$800 million 2001/2
AT&T – Voicespan(Ka-band-Canceled)
GEO 18 Voice, data, andmultimedia
Proposalwithdrawn
Filing withdrawn
Echostar (18/12 GHz) GEO 2 + spare Direct broadcast(U.S. system)
plus interactivemultimedia
$340 million 1997-1999
GE – GE*STAR (Ka-band)
GEO 9 Broadcast TV,voice, data, and
multimedia
* 2002 or later
Hughes – Spaceway(Ka-band)
GEO 20 Voice, data,multimedia, and
broadcast TV
$5.2 billion 2000
INTELSAT – IS 9/10Ku- and Ka-band
GEO N/A Voice, data,multimedia,
broadcast TV
* mid- to late 2000s
Lockheed-MartinAstrolink (Ka-band)
GEO 9 Voice, data,multimedia, and
broadcast TV
$4.2 billion 2001 or later

940 ■ 19 9 8 A N N U A L R E V I E W O F C O M M U N I C A T I O N S
W I R E L E S S
T A B L E 2 . 2
Operator-Name Orbit # Satellites Services EstimatedCost
Deployment Dates
Loral Ð Cyberstar(Ka-band)
GEO 3+ spare Voice, data,multimedia,
and broadcastTV
$6.2 million 1999 or later
Matra Ð MarconiEast and West
Systems
GEO/MEO
At least 14Satellites
Voice, data,multimedia,
and broadcastTV
$2 billion+ 2001/2
Morning Star (start-up venture)
GEO 4 Voice, data,and
multimedia
$936 million 2000
Motorola Ð Celestri LEO 66-72 Multimedia,mobile, data,
and voice
$4 billion 2002/3
Motorola Ð M-Star(43.47 GHz)
LEO 72 Multimedia,mobile, data,
voice
$1.1 billion 2004 or later
Motorola/CommInc. Ð Millenium
(Ka-band)
GEO 4+ spare Video, data,broadcast TV,
andmultimedia
$2.3 billion 2002 or later
Orion GEO 6 Video, data,and
multimedia
$1.6 billion 2000
NetSat Ð Start-Up GEO 1+ spare Video, data,and
multimedia
$250 million 2000
Panamsat GEO 2 + spare Video, data,and
multimedia
$409 million Will likely beconsolidated withHughes Spaceway
Teledesic (includesAT&T, Boeing, and
Microsoftinvestment) (Ka-
band)
LEO 280 + spares(1st phase)
840 + spares(Final phase)
Voice, data,multimedia,
rural,supercomputer
connect
$4-6 billion(1st phase)
$12 billion+(Finalphase)
2002 or later
Visionstar GEO 1 Video $208 million 2000

19 9 8 A N N U A L R E V I E W O F C O M M U N I C A T I O N S ■ 941
Abstract
Space is truly one of the “final frontiers” when it comes tonext-generation wireless communication systems. Large-scalepenetration of such systems into our daily lives will requiresignificant reductions in cost and increases in capacity thatonly spatial dimension can hope to offer. This is attested to bythe fact that a significant number of companies have recentlybeen formed to bring products based on such concepts to thewireless marketplace. Approaches range from “switched-beam” to “fully adaptive” with benefits provided by variousapproaches differing accordingly.
At one end of the spectrum is spatial division multiple access(SDMA) technology, a technology with roots in various de-fense-related development programs, which ArrayComm iscurrently incorporating in its IntelliCellTM line of products.SDMA technology employs antenna arrays and multi-dimen-sional nonlinear signal-processing techniques to provide sig-nificant increases in capacity and quality of many wirelesscommunication systems. It is especially well suited to the cur-rent and next-generation cellular systems termed personalcommunications service (PCS) and to provisioning of first-mile access using wireless local loop (WLL) systems. Antennaarrays coupled with adaptive signal-processing techniquesemployed at base stations improve coverage, capacity, andtrunking efficiency, allowing lower-cost deployments withcells of moderate to large size.
Introduction
In a majority of currently deployed wireless telecommunica-tion systems, the objective is to sell a product at a fair price,the product being information transmission from one or morelocations to one or more locations. From a technical stand-point, information transmission requires resources in theform of power and bandwidth. Generally, increased trans-mission rates require increased power and/or bandwidth in-dependent of the medium. While transmission over wiredsegments of the links could generally be performed indepen-dently for each link (ignoring cross-talk in land lines), this isnot the case for wireless segments. While wires (fibers) are ex-
cellent at confining most of the useful information/energy to asmall region in space (the wire), wireless transmission ismuch less efficient. Reliable transmission over relatively shortdistances in space has traditionally required a large amountof transmitted energy, spread over large regions of space,only a very small portion of which is actually received by theintended user. Most of the energy is considered interferenceto other potential users of the system (frequency reuse). It isprecisely this aspect of wireless communication inefficiencythat SDMA technology addresses.
Somewhat simplistically, the maximum range of such sys-tems is determined by the amount of power that can be trans-mitted (and therefore received), and the capacity isdetermined by the amount of spectrum (bandwidth) avail-able. For a given amount of power (constrained by regulationor practical considerations for example) and a fixed amountof bandwidth (the amount one can afford to buy at auctionthese days), there is a finite (small) amount of capacity(bits/sec/Hz/unit-area, really per unit-volume) that opera-tors can sell to their customers and a limited range overwhich customers can be served from any given location.Thus, the two basic problems that arise in such systems are:1) how to acquire more capacity so that a larger number ofcustomers can be served at lower costs in areas where de-mand is large, and 2) how to obtain greater coverage areas toreduce infrastructure and maintenance costs in areas wheredemand is relatively small.
Background
As its name implies, SDMA technology exploits informationcollected in the spatial dimension in addition to the temporaldimension to obtain significant improvements in wireless in-formation transmission. Spatially selective transmission andreception of RF energy provides substantial increases in wire-less system capacity, coverage, and quality. Various ap-proaches to exploiting the spatial dimension have beenattempted in the past, including finely sectorized systems andmicrocellular techniques. As the issue of trunking efficiencyhas become more pronounced, focus has recently shifted tomore advanced techniques ranging from switched-beam to
An Overview of Smart AntennaTechnology: The Next Wave in Wireless CommunicationsRichard H. RoyChief Technology OfficerArrayComm, Inc.

942 ■ 19 9 8 A N N U A L R E V I E W O F C O M M U N I C A T I O N S
W I R E L E S S
fully adaptive, uplink-only to uplink and downlink, withbenefits provided by various approaches differing accord-ingly. Clearly, as one of Qualcomm’s founders AndrewViterbi stated, “Spatial processing remains as the mostpromising, if not the last frontier, in the evolution of multipleaccess systems.”
Switched Diversity Technology
One of the earlier attempts at addressing the difficulties of themobile RF environment was to employ two antennas sepa-rated by several wavelengths, each instrumented with conven-tional receivers. The basic principle underlying such designs isthat in complex RF environments, there is sufficient scatteringof the RF fields to practically decorrelate signals received fromantennas sufficiently far apart. The import of this is that theprobability of the signals in both of the antennas becoming ex-tremely weak at the same time is small, and selection of thestronger signal will always improve matters. While these tech-niques are still in widespread use today, they do not increaserange or capacity. However, they do address an importantproblem facing mobile systems today, that of fading (uplinksignal quality) in complex RF (dense urban) environments.
Switched-Beam Technology
In what could be thought of as a shape-transformation ap-plied to microcellular concepts, switched-beam technology isbeing investigated as a method of increasing range and ca-pacity. The design of such systems involves high-gain, nar-row azimuthal beamwidth antenna elements (usingconventional or Butler matrix array technology), and RFand/or baseband digital signal-processing hardware andsoftware to select which beam or sector to use in communi-cating with each user. In order to overcome the well-knowntrunking efficiency problem of small cells, pooling of radio re-sources is being investigated by several proponents of thistechnology. Additionally, many of the system-related issuesdealing with access and control channels require some specialcare, and there are certainly interesting challenges to be facedconcerning the downlink in such systems. While previous un-successful attempts at such solutions date back to the 1970swhen six-sectored systems were tested as improvements overthree-sector technology, advances in DSP technology mayprovide solutions to the challenges faced by highly restrictedfields-of-view in rapidly changing mobile environments.
Intelligent Antenna Technology
Truly opening up this new dimension in wireless communi-cations is spatial division multiple access technology, em-ploying antenna arrays, standard RF and digital components,and multidimensional nonlinear signal-processing techniquesto provide significant increases in capacity and quality ofmany wireless communication systems in a manner compati-ble with all currently deployed air interfaces.
A combination of antenna arrays and adaptive digital signal-processing techniques bring the fourth dimension to thethree-dimensional world of wireless communications.Employed at base stations, SDMA technology improves cov-
erage, capacity, and trunking efficiency, allowing for lower-cost deployments with reduced maintenance costs. In addi-tion to these immediate benefits, the flexibility of thetechnology also allows for the creation of new value-addedservices that can provide a significant competitive advantageto operators offering these services. SDMA is not restricted toany particular modulation format or air-interface protocoland is compatible with all currently deployed air interfaces.
SDMA is a fully adaptive approach, combining antenna ar-rays, analog radio frequency (RF) and digital electronics, esti-mation and detection techniques, and resource allocationalgorithms to affect efficient use of system resources. Thistechnology is embodied in ArrayComm’s IntelliCell line ofproducts. Figure 1 shows a block diagram of a typical intelli-gent antenna system configuration. With this basic configura-tion, the issues of capacity and coverage can be addressedwith a common architecture. Optimal processing of the out-puts of multiple antennas (see Figure 2) at a base station yieldssignificant improvements in signal quality through increasingdesired signal strength and reducing levels of interference (i.e.,increased SINR). While the details of the algorithms employeddepend on various factors, including the temporal modulationformat and the complexity of the RF environment, the objec-tive of maximizing capacity and quality remains the same. It isa goal that is achieved through appropriately analyzing the RFenvironment and using the information collected to receiveand transmit signals selectively.
In the uplink direction, multiple receivers are used to selec-tively receive information from one or more users on thesame channel at the same time, reducing the total amount ofreceived noise and interference power while increasing thedesired signal power. In the downlink direction, multiplelow-power transmitters are used to selectively transmit in-formation to one or more users on the same channel at thesame time, reducing the total amount of transmitted powerrequired (interference to other users in other cells). These
F I G U R E 1Typical Intelligent Antenna System Configuration
DDB8
1 2 3
4 5 6
7 8 9
8 8 8
8 8 8
ERICSSON
DDB8
1 2 3
4 5 6
7 8 9
8 8 8
8 8 8
ERICSSON
DDB8
123
456
789
888
888
ERICSSON

19 9 8 A N N U A L R E V I E W O F C O M M U N I C A T I O N S ■ 943
R I C H A R D H . R O Y
fundamental capabilities come about through efficient ex-ploitation of the spatial dimension and provide for significantincreases in capacity and range.
To illustrate this, a graphical comparison of a conventionalWLL omni-system deployment in a suburban area with a cor-responding IntelliCell deployment is given. Figure 3 showsthe coverage areas of three conventional omni-cell sites (BSs),assuming that all three were attempting to establish linkswith subscriber units (SUs) on the same time slot on the samecarrier at the same time. A 10 W power amplifier is deployedat each site, and the COST-231 propagation model is used todetermine the requisite path loss as a function of SU location.Under the assumptions made, the nominal range of one of thecells in the absence of neighboring interference is somewherebetween 2 km and 4 km. While the locations of the SUs weresuch that in the absence of the other SUs, each link could havebeen established, successful establishment of all links simul-taneously from the corresponding BSs was not possible due
to interference. The signal-to-interference plus noise ratios(SINRs) measured by each of the SUs were all significantlybelow the threshold necessary to establish a clear traffic chan-nel (TCH) connection.
The dramatic effect that intelligent antenna array processinghas in this deployment is shown in Figure 4. Therein, multi-ple elements spatially sample the incoming RF fields, iden-tify the necessary parameters of the RF environment,selectively receive multiple co-channel signals of interest,and distribute energy “optimally” so as to allow the success-ful establishment of all three links. The quality of links is di-rectly measured by SINR and is given in the figure for eachof the SUs. Whereas the conventional system could not es-tablish links successfully with 10 W power amplifiers, theIntelliCell system is capable of simultaneously establishingthree high-quality links with significantly less transmittedpower—in this case several orders of magnitude less power.
Summary of IntelliCell WLL Benefits
To quantify the system-level benefits of intelligent antennatechnology, Table 1 provides typical examples of the improve-
F I G U R E 212-Element 1900 MHz WLL Antenna Array
F I G U R E 3Downlink Power Distribution of Three Co-channelSingle Sector WLL Base Stations with One 10 W PowerAmplifier Each
F I G U R E 4Downlink Power Distribution of Three Co-channelIntelliCell WLL Base Stations with 8 500 mW PowerAmplifiers Each
T A B L E 1Typical 12-Element IntelliCell WLL PerformanceImprovements (g=3.5)
Uplink Related* SNR Improvement 10 dB * Range (Area) Increase 1.9 (3.7)* SINR Improvement >25 dB
Uplink & Downlink Related* DL Tx Power Reduction 90%* Real Capacity Increase > 2

944 ■ 19 9 8 A N N U A L R E V I E W O F C O M M U N I C A T I O N S
W I R E L E S S
ment that can be expected deploying a 12-element array as-suming R3.5 range-dependent attenuation in a suburban en-vironment. Note that for SINR improvements in excess of thestated SNR improvement, there must be the requisite amountof interference present. Also, the reduction in base stationemissions relates to traffic channels and does not account forbroadcast channel requirements associated with many mobilesystem protocols. In this light, it is interesting to reflect on thepossible impact of intelligent antenna technology on the de-velopment of standards for future wireless telecommunica-tion systems.
Conclusions
There is a growing need for improvements that increase cov-erage, capacity, and quality in many wireless communicationsystems. Optimal exploitation of new dimensions through in-
telligent antenna technology has the potential to meet theseneeds while providing operators the ability to offer newvalue-added services to their customers. Successful field testshave been and continue to be conducted demonstrating thatSDMA/IntelliCell technology in particular can deliver the im-provements wireless operators are seeking. These improve-ment promise to provide high-quality, low-cost wirelesscommunications for developing nations around the worldwhere basic communication services for a large number of theworld’s citizens are sorely needed.
Works Cited
1 Stanford University, Second Workshop on Smart Antennas in WirelessMobile Communications, Stanford University, Stanford, CA, July 1995.
2 Stanford University, Third Workshop on Smart Antennas in WirelessMobile Communications, Stanford University, Stanford, CA, July 1996.

19 9 8 A N N U A L R E V I E W O F C O M M U N I C A T I O N S ■ 945
D E N N I S G . S W E E N E Y
There is a vast number of wireless devices and opportunitiesbeyond the high profile personal communications services(PCS) and cellular. Federal Communications Commission(FCC) Part 15 rules permit low power wireless operationwithout a license. The devices that operate under Part 15 arealready ubiquitous as garage door openers, keyless entry,radio-controlled toys, and cordless phones. Sophisticatedwireless local area networks and spread spectrum devicesthat operate under Part 15 are beginning to emerge. Thispaper will explore the frequencies, power levels, and applica-tions that govern Part 15 devices. While no license is required,Part 15 rules do require device authorization. Basic authoriza-tion issues will be addressed.
Introduction
The cellular and PCS market has gotten the lion’s share of thepublicity in the wireless revolution. This is rightly so becauseof the money invested in these services. However, there is awireless revolution much closer to home. The cordless tele-phone has become ubiquitous along with radio controlledtoys, garage door openers, and home automation and secu-rity devices, to name just a few. Wireless local area networksare now available. Most of these devices have one thing incommon: they operate under the FCC Part 15 rules1 and theyrequire no license.
Part 15 devices have a wide range of applications:
• automotive keyless entry and security devices
• residential home automation, security, and communica-tions devices such as cordless phones and “baby moni-tors.” High-speed wireless home communications is onthe horizon.
• entertainment wireless and remote-controlled games and toys
• commercial radio frequency (RF) tags, remote data col-lection, point of sale devices, local area networking de-vices
• embedded radio radio links used to replace a wired con-nection in an existing system
An interesting exercise is for an individual to identify theshort-range wireless devices in use around him or her. Suchdevices are surprisingly ubiquitous and almost all of themoperate under Part 15 rules. A highly desirable feature of Part15 devices is that they require no license. While they requireno license, they do require FCC certification before sale.
Part 15 devices tend to be simple, low power, short-range sys-tems. The keyless entry devices popular with new cars have arange in the order of meters, and the transmitter and its powersupply are simple enough to fit into the key chain fob. Thereare exceptions. The IEEE 802.11 networking standard allowssophisticated computer networking with Part 15 radio sys-tems. It is also possible to operate point-to-point microwavesystems with tens of kilometer range under Part 15 rules.
Spectrum Sharing and Part 15 Devices
Part 15 rules define three types of devices: intentional, uninten-tional, and incidental radiators. An intentional radiator inten-tionally generates RF energy and emits it either by radiation orinduction in the course of its operation. This is a “transmitter”regardless of the frequency or power level. An unintentionalradiator also generates RF energy, but it is for use within thedevice with no intention that it be radiated. Examples are mi-crowave ovens and TV receiver local oscillators. Incidental ra-diators generate RF energy only as a byproduct of operation.Some types of motors are incidental radiators. This paper willdeal primarily with intentional radiators.
A basic principle of operation under Part 15 rules is spectrumsharing. Operation of any Part 15 device is subject to the con-dition that it causes no harmful interference. In addition, itmust accept interference from any other source includingother Part 15 devices. This means that Part 15 devices are atthe bottom of the radio hierarchy. Because Part 15 devicesmust accept interference from any source, it is impossible toguarantee a particular level of performance.
This will become more of a problem as these devices prolifer-ate. The non-interference requirement may be difficult to ap-preciate when that new $300 wireless widget does not workdue to interference. This has been the object of some contro-versy as not-so-close neighbors’ phone calls and bills have be-
License-Free Wireless Operation UnderFCC Part 15 RulesDennis G. Sweeney Center for Wireless Telecommunications, Bradley Department of Electrical Engineering,Virginia Tech
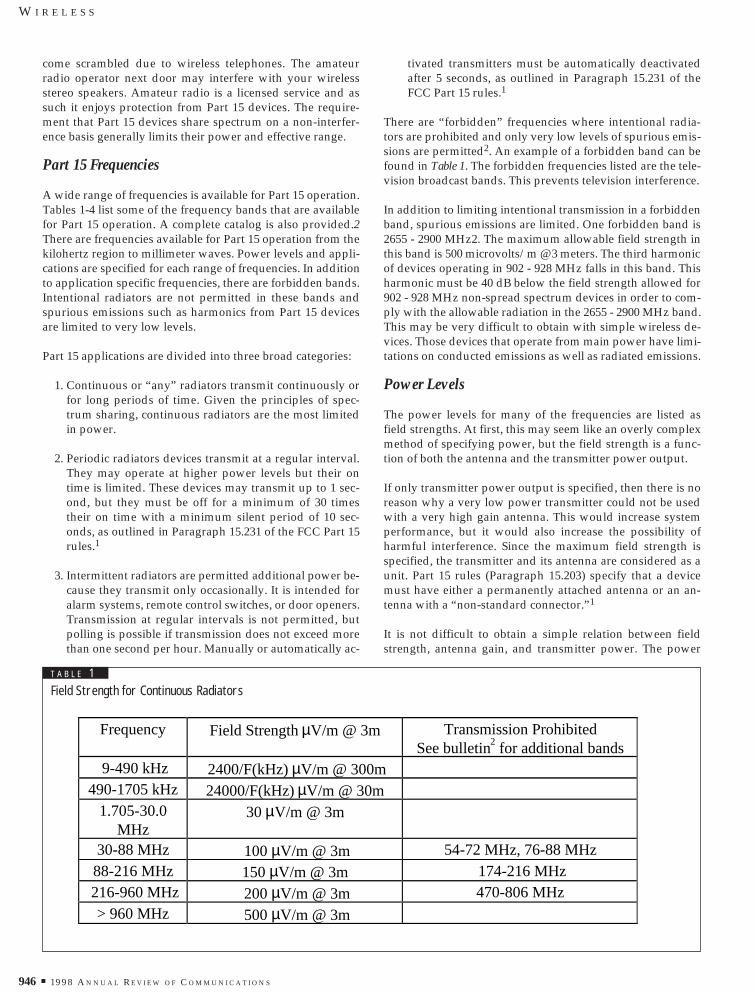
946 ■ 19 9 8 A N N U A L R E V I E W O F C O M M U N I C A T I O N S
W I R E L E S S
come scrambled due to wireless telephones. The amateurradio operator next door may interfere with your wirelessstereo speakers. Amateur radio is a licensed service and assuch it enjoys protection from Part 15 devices. The require-ment that Part 15 devices share spectrum on a non-interfer-ence basis generally limits their power and effective range.
Part 15 Frequencies
A wide range of frequencies is available for Part 15 operation.Tables 1-4 list some of the frequency bands that are availablefor Part 15 operation. A complete catalog is also provided.2There are frequencies available for Part 15 operation from thekilohertz region to millimeter waves. Power levels and appli-cations are specified for each range of frequencies. In additionto application specific frequencies, there are forbidden bands.Intentional radiators are not permitted in these bands andspurious emissions such as harmonics from Part 15 devicesare limited to very low levels.
Part 15 applications are divided into three broad categories:
1. Continuous or “any” radiators transmit continuously orfor long periods of time. Given the principles of spec-trum sharing, continuous radiators are the most limitedin power.
2. Periodic radiators devices transmit at a regular interval.They may operate at higher power levels but their ontime is limited. These devices may transmit up to 1 sec-ond, but they must be off for a minimum of 30 timestheir on time with a minimum silent period of 10 sec-onds, as outlined in Paragraph 15.231 of the FCC Part 15rules.1
3. Intermittent radiators are permitted additional power be-cause they transmit only occasionally. It is intended foralarm systems, remote control switches, or door openers.Transmission at regular intervals is not permitted, butpolling is possible if transmission does not exceed morethan one second per hour. Manually or automatically ac-
tivated transmitters must be automatically deactivatedafter 5 seconds, as outlined in Paragraph 15.231 of theFCC Part 15 rules.1
There are “forbidden” frequencies where intentional radia-tors are prohibited and only very low levels of spurious emis-sions are permitted2. An example of a forbidden band can befound in Table 1. The forbidden frequencies listed are the tele-vision broadcast bands. This prevents television interference.
In addition to limiting intentional transmission in a forbiddenband, spurious emissions are limited. One forbidden band is2655 - 2900 MHz2. The maximum allowable field strength inthis band is 500 microvolts/m @ 3 meters. The third harmonicof devices operating in 902 - 928 MHz falls in this band. Thisharmonic must be 40 dB below the field strength allowed for902 - 928 MHz non-spread spectrum devices in order to com-ply with the allowable radiation in the 2655 - 2900 MHz band.This may be very difficult to obtain with simple wireless de-vices. Those devices that operate from main power have limi-tations on conducted emissions as well as radiated emissions.
Power Levels
The power levels for many of the frequencies are listed asfield strengths. At first, this may seem like an overly complexmethod of specifying power, but the field strength is a func-tion of both the antenna and the transmitter power output.
If only transmitter power output is specified, then there is noreason why a very low power transmitter could not be usedwith a very high gain antenna. This would increase systemperformance, but it would also increase the possibility ofharmful interference. Since the maximum field strength isspecified, the transmitter and its antenna are considered as aunit. Part 15 rules (Paragraph 15.203) specify that a devicemust have either a permanently attached antenna or an an-tenna with a “non-standard connector.”1
It is not difficult to obtain a simple relation between fieldstrength, antenna gain, and transmitter power. The power
Frequency Field Strength µV/m @ 3m Transmission ProhibitedSee bulletin2 for additional bands
9-490 kHz 2400/F(kHz) µV/m @ 300m490-1705 kHz 24000/F(kHz) µV/m @ 30m
1.705-30.0MHz
30 µV/m @ 3m
30-88 MHz 100 µV/m @ 3m 54-72 MHz, 76-88 MHz88-216 MHz 150 µV/m @ 3m 174-216 MHz
216-960 MHz 200 µV/m @ 3m 470-806 MHz> 960 MHz 500 µV/m @ 3m
T A B L E 1Field Strength for Continuous Radiators

19 9 8 A N N U A L R E V I E W O F C O M M U N I C A T I O N S ■ 947
D E N N I S G . S W E E N E Y
flux density in space is given by:
•EMBED “Equation” \* mergeformat watts/m2(1)
where h is the impedance of free space (120p) and E is thefield strength in volts/meter. The power required to createthis flux is:
•EMBED “Equation” \* mergeformat (2)
where EIRP is the effective isotropic radiated power and Dis the distance from the radiator. The 4pD2 factor is thespherical spreading loss as the wave propagates out intospace. EIRP can be obtained by:
•EMBED “Equation” \* mergeformat (3)
where Pt is the transmitter power and Gt is the transmitter
antenna gain. Combining (1), (2), and (3) results in:
•EMBED “Equation” \* mergeformat watts(4)
If the antenna gain is 1 and the measurement distance is 3meters, (4) results in:
•EMBED “Equation” \* mergeformat watts(5)
There are two notable exceptions to this philosophy of settingfield strength. The first is specifying the transmitter powerand antenna size at very low frequencies. In the 160 - 190 kHzband, the wavelength is approximately 1.7 km. Part 15 rules(Paragraph 15.217)1 limits the antenna, transmission line, andground lead to maximum length of 15 meters. It is extremelydifficult to make an efficient antenna this short at this wave-length. Interestingly, hobbyists have occupied this band andproduced some stunning results even under the Part 15 limi-tations. They have communicated up to several hundred kilo-
Periodic Radiators Intermittent Radiators
Frequency Field StrengthµV/m @ 3 m
Max SpuriousEmission
µV/m @ 3 m
Field StrengthµV/m @ 3 m
Max SpuriousEmission
µV/m @ 3 m
40.66-40.7MHz
1000 100 2250 225
70-130MHz
500 50 1250 1250
130-174 MHz 500-15001 50-1501 1250-37501 125-3751
174-260 MHz 1500 150 3750 75260-470 MHz 1500-50001 150-5001 3750-125001 375-12501
> 470 MHz 5000 500 12500 12501Linear interpolation See bulletin2 for forbidden bands
T A B L E 2Field Strength for Periodic and Intermittent Radiators
Frequency Field Strength or Power Application Paragraph1
902 - 928MHz
1 watt (EIRP < 6 dBW)
50,000 µV/m @ 3 m
spreadspectrum
any
15.247
15.249
2.40 - 2.4835GHz
1 watt (1 dB tx pwr reductionfor each 3 dB increase in
antenna gain above EIRP 6dBW)
50,000 µV/m @ 3 m
spreadspectrum
any
15.247
15.249
5.725 - 5.850GHz
1 watt (no EIRP limit) spreadspectrum
15.247
T A B L E 3Industrial, Scientific, Medical (ISM) Band Part 15 Radiators

948 ■ 19 9 8 A N N U A L R E V I E W O F C O M M U N I C A T I O N S
W I R E L E S S
meters. More mundane applications are carrier current de-vices such as intercoms.
The second exception is the 1 watt transmitter power permit-ted in the 902 - 928, 2400 - 2483.5, and 5725 - 5850 MHz bandsfor spread spectrum devices. These bands are referred to asthe industrial, scientific, medical (ISM) bands. The ISM bandsare listed in Table 3. So many services occupy the 902 - 928MHz allocation that it has been referred to as the “kitchensink” band.3 Common microwave ovens operate at 2450MHz under ISM rules. A number of manufacturers are nowmaking chip sets that are aimed at the relatively high powerlimits for unspread operation in the ISM band.4
Since Part 15 rules effectively limit transmitter field strength,the only way to improve system performance is by improv-ing the performance of the receiving system. There is no limiton receiver sensitivity or receiver antenna gain. However, thegreatest cost in most simple systems is in the receiver.
Spread Spectrum
High power spread spectrum is permitted in the ISM bandsbecause spread spectrum is intended to minimize interferenceby reducing energy density. Paragraph 15.4271 limits spreadspectrum devices to either frequency hoppers or direct se-quence devices. A good introduction to spread spectrumtechniques is provided by Robert C. Dixon.5
Frequency hopping spread spectrum (FHSS) is shown inFigure 1. It transmits for a short period of time on each of anumber of carrier frequencies chosen pseudorandomly. Thehopper transmits for only a short period on any one fre-quency thus reducing the possibility of interference.
For FHSS, a minimum of 25 kHz or the 20-dB bandwidth ofeach channel, whichever is greater, must separate the carrierfrequencies. For 902 MHz systems, when the maximum 20-dBchannel bandwidth is 250 kHz or less, a minimum of 50 hop-ping frequencies is required. The average dwell time on anyone frequency cannot exceed 0.4 seconds in 20 seconds. Thisis an average of 2.5 hops per second, which is considered a
Frequency
F I G U R E 1Frequency Hopping Spread Spectrum
FrequencySynthesizer
Data Modulator
Data
Regular Transmitter
F I G U R E 2Conventional, Direct Sequence Spread Spectrum, UWB Transmitters
FrequencySynthesizer
Data Modulator
Data
Spreading Code
DSSS TransmitterUWB Transmitter
Data
PulseGenerator
Filter

19 9 8 A N N U A L R E V I E W O F C O M M U N I C A T I O N S ■ 949
D E N N I S G . S W E E N E Y
slow hop system [5]. If the 20-dB channel bandwidth isgreater than 250 kHz, a minimum of 25 hopping frequencies isallowed. The average dwell is limited to 0.4 seconds in a 10-second period. The maximum 20-dB bandwidth for 902-MHzsystems is 500 kHz.
Power levels up to 1 watt are permitted for 902 MHz systemswith 50 or more frequency hops. The maximum EIRP (prod-uct of antenna gain and transmitter power) is 6 dBW (4watts). Systems using less than 50 hops are limited to 0.25watts or 0 dBW EIRP.
Frequency hoppers for 2400 and 5725 MHz can operate with20 dB channel bandwidths up to 1 MHz, but they must hop toa minimum of 75 different frequencies. The average dwelltime must be 0.4 seconds or less in a 30-second period.Direct sequence spread spectrum (DSSS) is created by modu-lating a signal with pseudorandom spreading code. Thespreading code has the correlation properties of white noise,but the code repeats periodically. Figure 2 contains a block di-agram for a DSSS transmitter.
Figure 3 shows the spectrum of a DSSS signal. The signal be-fore and after spreading contains the same energy. Thespreading causes the signal to occupy a greater bandwidth soit has lower energy in a given bandwidth. This reduces thepotential for interference. The ratio of the spread bandwidthto baseband bandwidth is the processing gain.
Part 15 specifies that the minimum processing gain for aDSSS signal must be 10 dB. In addition, the minimum spreadbandwidth between 6 dB points on the transmitted spectrumis 500 kHz.
DSSS 902 MHz systems are limited to 1 watt of transmitterpower or the EIRP must be less than 6 dBW (4 watts), whichever is greater. FHSS and DSSS systems at 2400 MHz are alsolimited to 1-watt maximum transmitter power, but higherEIRPs are permitted. The transmitter power must be reducedby 1 dB for every 3 dB of additional antenna gain that resultsin an EIRP greater than 6 dBW. For example, a 0.1-watt trans-mitter could operate with a 36-dB antenna. This antennawould result in an EIRP 30 dB greater than 6dBW; therefore,
Signal before spread
Signal after spread
Frequency
F I G U R E 3Direct Sequence Spread Spectrum
Signal before spread
Frequency
Spread Spectrum
Ultra Wideband
F I G U R E 4Effect of Spread Spectrum and UWB Transmission of a Signal

950 ■ 19 9 8 A N N U A L R E V I E W O F C O M M U N I C A T I O N S
W I R E L E S S
the transmitter must be reduced 10 dB to 0.1 watt. The combi-nation of a 36-dB antenna and the 0.1-watt transmitter resultsin an EIRP of 26 dBW. There is no EIRP limit in the 5725 -5850 MHz band. These relatively high power limits permitsystems that rival point-to-point microwave to operate underPart 15 rules.
The higher power permitted under the spread spectrum rulesoffers the potential for long range systems. The major limita-tion on spread spectrum is its complexity.
Unlicensed Personal Communications Service (PCS) andNational Information Infrastructure (NII) Devices
Two new unlicensed services are now permitted under Part15 rules. The first is unlicensed personal communications ser-vice (PCS) devices. These devices are intended to provide awide range of mobile and fixed communications services toindividuals and businesses.
Unlicensed PCS operates in the 1910-1930 MHz and the 2390-
2400 MHz bands. Currently, 1910-1930 MHz is occupied bythe private operational-fixed microwave service (OFS). OFS isslated to be moved from this band to make space for unli-censed PCS.
Unlicensed PCS is intended primarily as a digital mediumand it has a spectrum sharing etiquette to minimize interfer-ence. The Part 15 outline of this etiquette is beyond the scopeof this paper, but it can be found in Paragraph 15.301-15.323.
The second new service is the unlicensed NationalInformation Infrastructure (U-NII) operating in the 5.15-5.35GHz and 5.725-5.825 GHz bands. These devices are intendedto provide high data rate digital communications for individ-uals, businesses, and institutions. The salient features of U-NII devices are listed in Table 5.
Frequency Field Strength or Power Application Paragraph1
160 - 190 kHz 1 watt input (limitedantenna)
any 15.217
510 - 1705 kHz 0.1 watt input (limitedantenna)
any 15.219
26.96 - 27.28 MHz 10000 µV/m @ 3 m any 15.22743.71 - 44.49 MHz46.60 - 46.98 MHz48.75 - 49.51 MHz49.66 - 49.82 MHz49.90 - 50.00 MHz
10000 µV/m @ 3 m cordlessphones
15.233
49.82 - 49.90 MHz 10000 µV/m @ 3 m cordless phoneor any
15.233
T A B L E 4Miscellaneous Radiators
Frequency Maximum PeakPower
Max SpectralDensity
MaximumEIRP
Comment
5.15-5.25 GHz 50 mW 2.5 mW/MHz 23 dBm(200 mW)
Indoor operationonly
5.25-5.35 GHz 250 mW 12.5 mW/MHz 30 dBm(1 watt)
5.725-5.825 GHz 1 watt 50 mW/MHz 6 dBW(4 watts)
Transmission must cease in the absence of information to transmit or in the event of operationalfailure.
T A B L E 5U-NII Transmitters

19 9 8 A N N U A L R E V I E W O F C O M M U N I C A T I O N S ■ 951
D E N N I S G . S W E E N E Y
Ultra Wide Band
Ultra wide band (UWB) is an emerging technology that haspotential for short-range high data rate systems. UWB may beviewed as a kind of “super” spread spectrum. The function ofthe spread in spread spectrum is to lower the energy density.The ultra wide bandwidth of UWB results in very low energydensity. This low energy density reduces its interference po-tential and makes it relatively immune to frequency selectiveor multipath fading. Figure 4 provides an example of a UWBspectrum.
UWB cannot operate under current Part 15 rules. It is difficultto restrict the bandwidth of UWB so it does not transmit inthe forbidden bands. While UWB emissions may be lowenough to meet emission limits in the forbidden bands, UWBis an intentional radiator. Intentional radiators are not permit-ted in the forbidden bands. The FCC is being lobbied to per-mit UWB because of its low power and spectrum sharingproperties
UWB is defined as any signal whose fractional bandwidth isgreater than 0.25:5
Fractional Bandwidth EMBED “Equation” \* mergeformat (6)
where EMBED “Equation” \* mergeformat is the highestfrequency of the UWB spectrum and EMBED “Equation” \*mergeformat is the lowest frequency in the UWB spectrum.There is no defined center frequency. UWB is also referred toas baseband, impulse, or non-sinusoidal radio.
Although UWB was referred to as “super” spread spectrum, itis not truly a spread spectrum signal. Spread spectrum sig-nals are generated by taking a narrow band signal and broad-ening it either by frequency hopping or by direct sequencemodulation. Spread spectrum signals have a defined centerfrequency, and they generally do not fit the fractional band-width definition of UWB. The bandwidth of the UWB signal isinherent to its process of generation.
This difference can be seen in Figure 2, which shows block dia-grams for conventional, DSSS, and UWB transmitters. In theconventional and DSSS transmitters, information is modu-lated onto a carrier frequency. The UWB transmitter employs afast rise time pulse generator. Rise times are generally lessthan 1 nsec. The result is a broad flat spectrum that has speciallines at the data rate. The filter defines the signal bandwidth.
The transmitted signal is a small number of cycles at the filtercenter frequency. The limiting case is where the signal is asingle cycle, thus its description as impulse or non-sinusoidal.Modulation is accomplished by pulse position modulation(PPM), and spectral lines can be removed by psuedonoisecoding the input data stream.6
The UWB transmitter is a direct conversion from data to RF.While the peak power of the pulses may be very high, the av-erage power is low. These two factors result in a simple lowpower transmitter with the potential for high data rates. UWB
receivers employ high speed samplers, tunnel diodes, oravalanche transistor pulse detectors.5 Conventional synthe-sizers, mixers, and intermediate amplifiers are not needed.UWB transmitters, receivers, and antennas are a fruitful areafor development.
Authorization
No license is required for devices that operate under Part 15rules, but these devices must be authorized before they can belegally sold in the United States. There are various authoriza-tion procedures:7 verification; notification; certification; typeacceptance, and registration. Additionally, there are labelingrequirements for each of these authorization procedures.
For verification, a manufacturer or importer of a device musthave measurements performed to insure the technical com-pliance of the device. A measurement report must be retainedand the FCC may request that the report be submitted.Verification is a self-authorizing process. Business computerequipment and TV/FM receivers fall in this category.
Notification requires that an application for authorization besubmitted to the FCC. A measurement report must be re-tained and submitted on request. Point-to-point microwaveand broadcast transmitters require notification.
Certification requires the submission to the FCC of a technicaldescription of the device and a report that shows its compli-ance with technical standards. This is the most involved ofthe authorization processes. All Part 15 intentional radiatorsas well as some unintentional radiators require certification.Among unintentional radiators requiring certification are su-perregenerative detectors. Such detectors are often used ingarage door openers, radio controlled toys, and other lowcost wireless applications, but they can be potent radiators ifnot properly designed.
Type acceptance is similar to certification, but it applies totransmitters for licensed services such as the citizen’s band orland mobile equipment, including cellular telephones.Registration applies to telephone equipment that is connectedto the public switched telephone network.
The FCC does not perform the testing required for authoriza-tion, and it does not approve testing labs. However, labs thatdo compliance testing must file a description of their mea-surement facilities with the FCC. The FCC maintains a list ofthese labs.

952 ■ 19 9 8 A N N U A L R E V I E W O F C O M M U N I C A T I O N S
W I R E L E S S
Conclusions
The applications for Part 15 unlicensed wireless devices arelimited only by the imagination. Current rules in the UnitedStates allow a wide choice of frequencies for these applica-tions, but there are significant limitations on power so thatthese devices will produce a minimum of interference to li-censed services. The significant power permitted spread spec-trum devices opens a whole range of medium rangeapplications such as wireless local area networks.
While no license is required for Part 15 operation, Part 15 de-vices must be certified for technical compliance before sale.The complexity of this process may represent a significant ob-stacle for low volume applications.
This paper is intended as an introduction to Part 15 devices.The regulatory environment is continually changing, and therequirements and procedures outlined.1,7 These must be care-fully studied and observed before a Part 15 device can bemarketed.
References1. Federal Communications Commission Rules, 47 CFR, Part 15. Available:
www.fcc.gov/oet/info/rules.
2. Understanding the FCC Regulations for Low-Power, Non-LicensedTransmitters, OET Bulletin, No 63, October 1993, edited and reprintedFebruary 1996. Available: www.fcc.gov/oet/info/documents/bul-letins/#63.
3. Kobb, Bennett Z., Spectrum Guide, Third Edition, New Signals Press, FallsChurch, VA, 1996, p.114.
4. RF Microdevices, (www.RFMD.com) and RF Monolithics (www.rfm.com),to name just two.
5. Dixon, Robert C., Spread Spectrum Systems, Third Edition, John Wiley &Sons, New York, 1994.
5. Bennett, C. Leonard and Gerald F. Ross, “Time-Domain Electromagneticsand Its Applications,” Proceedings of the IEEE 66 (March 1966): 299-318.
6. Win, Mo Z., Ji-Her Ju, Ziaoxin Qiu, Victor O. K. Li, and Robert A. Scholtz,“ATM Based Ultra-Wide Bandwidth Multiple-Access Radio Network ForMultimedia PCS,” IEEE Fourth Annual Network+Introp Conference, May1997: 101-108.
7. The FCC Equipment Authorization Program for Radio Frequency Devices,OET Bulletin No. 61, December 1992. Available:www.fcc.gov/oet/info/documents/bulletins/#63.

19 9 8 A N N U A L R E V I E W O F C O M M U N I C A T I O N S ■ 953
Over-the-air service provisioning (OTASP) is a capabilitythat allows permanent memory in a mobile unit to be pro-grammed “over-the-air” by the service provider via auto-mated processing. This automated processing means thatnone of the traditional manual processing techniques, suchas using a keypad on the handset or using a handset cradleapplication, need to be performed. This obviously has manybenefits for the service provider. One is that it does not re-quire an authorized dealer or any third party to distributehandsets. Essentially, the mobile units come from the hand-set provider to the service provider with nothing prepro-grammed except an equipment serial number (ESN).Associated with that ESN are some other pieces of data likea subscriber provisioning code (which is a lock on that hand-set) and possibly an authentication key (A-Key) that vali-dates the handset to the network. These are the only pieces ofinformation that must be recorded when units are receivedfrom the handset manufacturer. The total programmingprocess, programming the handset as well as doing sub-scriber provisioning on the network, can be completely con-trolled by the service provider in an automated manner,without manual intervention.
Figure 1 shows a reference model for a typical architecture tosupport the OTASP feature. IS-41, revision D is the interfacethat is currently being used most, and there are some vendorproprietary issues in terms of interfacing from the OTA func-tion (OTAF) box to the customer service center as well as
from the home location register (HLR) based on the networkequipment that is chosen for specific functions within a net-work. This will, though, be the reference model that will beused to outline a typical call-flow scenario in support of anOTASP activation call.
Network Components
There are five basic OTASP network components, each withtheir own functions. The customer service center (CSC) pro-vides an operator with voice communication with the mobilesubscriber. It also controls the provisioning actions via com-munications with the OTAF and provides an interface to theHLR for subscriber record manipulations. This is where thebilling system would be located. It would include pieceswithin the front end of a call flow like the call distributor, thecomputer telephony integration (CTI) component which is re-quired to support an OTA call, and the software within thecall center that enables the customer service representative tocommunicate through the OTAF box to the handset.
The second component is the OTAF, which handles networkcommunication to the HLR/AC and mobile switching center(MSC) and/or visitor’s location register (VLR). The OTAFalso formats OTASP messages for the mobile station.Essentially, it is brokering the data feed to the handset. Theserving MSC/VLR, then, controls the voice communicationsbetween the mobile subscriber and the CSC as well as provid-
Over-the-Air Service ProvisioningAndrew TaylorProduct ManagerLucent Technologies
Customer Service
MSC
OTAF
Home Location Register (HLR)/
Authentication Center (AC)
IS-41N1 Interface
(SS7)
IS-41Q1 Interface
(SS7)
IS-41D Interface
(SS7)
VendorProprietary
VendorProprietary
HLR/AC may be integratedor stand-alone
Voice Connection(ISUP)
PSTN
F I G U R E 1OTASP Reference Model

954 ■ 19 9 8 A N N U A L R E V I E W O F C O M M U N I C A T I O N S
W I R E L E S S
ing the data connection path between the OTAF and the mo-bile station. The fourth component, the HLR and authentica-tion center (AC) stores subscriber records andauthentication keys. This area also communicates with theOTAF during A-Key exchange procedures. Finally, the mo-bile station (MS) is the handset being provisioned for ser-vice. The MS sends current contents of its permanentmemory when requested by the OTAF and loads the con-tents of its temporary memory when received from theOTAF, as well as committing temporary memory to perma-nent memory as directed by the OTAF.
Standards Status
As with many other areas of telecommunications, the stan-dards for OTASP are undergoing constant review and occa-sional change. OTASP is currently in beta testing at twocustomer sites, and will be operational by the end of 1997,which means that initial standards are still evolving. As ofJune 1997, the standards were as follows:
• Code division multiple access (CDMA) IS-95A/PCS J-STD-008—Air Interface Specifications state that there are nochanges necessary to support OTASP.
• IS-683—OTASP Air Interface Specification was approvedand published in February of 1997, but did not include pro-gramming lock and enhanced roaming. There is currentlya “Revision A” in progress to address these areas.
• IS-41—Network Interface Specification is being worked onby an OTASP focus group formed by TR45.2 in March of1996. One of the things that they have produced is the PN-3769, which describes changes and additions to IS-41-C forOTASP, and which was approved for publication byTR45.2 in May of 1997.
Procedures and Benefits
Over-the-air service provisioning is composed of many fea-tures, and has several attractive benefits. The procedures in-cluded in the feature are as follows:
• call origination, which includes attachment and protocol capability request
• subscriber programming code (SPC) violation• MS data upload• A-Key exchange• SSD update• re-authentication• MS data download• roaming list download• MS data commit• call release
All of these represent, at a high level, some of the call-flowstages that occur during an OTASP call. There are two basictypes of activities—new service activation and provisioning,and provisioning to change the service of an existing cus-tomer. The OTASP is not only for new call origination or newcall activation, but can also support new service featurechanges to existing accounts.
The three main benefits or features within OTASP are pro-gramming lock, enhanced roaming, and A-Key exchange.Programming lock, also referred to as subsidy lock, protectsthe carriers’ investments in mobile phones. It may be that aservice provider is selling handsets that are subsidized (i.e.,below cost) as a part of a marketing or subscription plan. Thisprovider would want to guarantee that the handset beingsold off the shelf could only be provisioned with its service.With the ESN that is sent by the manufacturer, the providercan also get a subscriber provisioning code which has a spe-cific lock associated with that handset. When this is done,only the person or service provider that ordered that handsetknows the lock code and, therefore, only their service can beprovisioned onto that handset.
This is important, as the sales of handsets have increased somuch that suggestions have been made to provide them vianew distribution outlets such as in vending machines, onhome shopping networks, as business promotions, in depart-ment stores, and other places not normally associated withwireless service. These will now be viable distribution mediafor any service provider, because they no longer have to go
MSC
OTAF
Customer ServiceCenter (CSC)
HLR/AC
1. User dials OTASP *FC
2. Origination including ESN, MIN and *FC
5. Voice call, Called DN = Routing number, Calling DN = TRN
3. Serving MSC assigns Temporary Reference Number (TRN)
4. Serving MSC translates *FC to Routing number
6. CSC forwards TRN to OTAF
7. Connect request (TRN)
8. Connect accept (TRN, Session ID)
F I G U R E 2OTASP Call Flow (Origination)

19 9 8 A N N U A L R E V I E W O F C O M M U N I C A T I O N S ■ 955
through the traditional handset provisioning processes norwill they have to engage in costly “authorized dealer” com-pensation agreements. But if all of these places are offering re-tail handsets at low costs, they are obviously hoping to makeup the profits in service sales. Hence, the programming lockprovided through OTASP is essential. Using this, the mobile’smemory must be unlocked before programming by provid-ing the SPC to the mobile, which is only known to theprovider that ordered the units. The lock applies to all pro-gramming methods, including OTASP, keypad, and cradles.Two things should be noted relative to programming lock:the initial OTASP implementation provides SPC validationonly, and implementation is manufacturer-specific, althoughit is available to any vendor.
Enhanced roaming is another benefit to OTASP, which selectsa preferred service provider when roaming. This works bythe customer indicating preferences for service providers dur-ing roaming arrangements and the mobile phone download-ing preferred roaming information during an OTASP session.When roaming, the unit uses this information to select the ap-propriate service provider. Once again, implementation ismanufacturer-specific, but available to any vendor.
Finally, the A-key exchange is a mechanism by which, in acurrent process, the handsets have a default authenticationkey. In the future, it may be possible to assign a unique A-keythat would be programmable over the air using the OTASPfunction. In either scenario, the A-key is programmed intoboth the mobile and the AC during the OTASP call, and theA-Key information remains secure. In an A-Key exchange,the OTAF facilitates communicate between the AC and thehandset. It uses a Diffie-Hellman algorithm where the ACand the unit exchange parameter value and generate the A-Key. The option does exist to preprogram the A-Key, but thisrequires a certain amount of administrative overhead and cre-ates a potential security risk.
New Activation
There are nine steps involved in a simple new service activa-tion scenario:
1. The customer purchases a handset at almost any retailsource deemed viable by the service provider.
2. The directions on the box will indicate a star OTASPfeature code (FC). At this point, there are only twonumbers that the customer is capable of dialing—911service and the FC. That feature code would be uniqueto the service provider and would indicate the numberthat the handset owner should dial to initiate activa-tion of the handset provisioning. This process will alsoput the subscriber on the network, a process that in-cludes setting up the account, the account profile, initi-ating billing, and provisioning the HLR or otherservice nodes that may exist.
3. The voice call based on the number dialed is routed tothe CSC.
4. A virtual data connection is established from the CSC tothe mobile unit via the OTAF and the MSC, even before arepresentative answers the call. At this point, the incom-ing call from the MSC to the CSC only includes a tempo-rary reference number (TRN). The TRN comes from apool of reference numbers that the MSC allocates to calls,and is the number by which the CSC routes through theOTAF and sets up a data link to the handset. Once thehandset link has been established, it is possible to re-trieve information from that handset like the ESN, modelnumber, and firmware version.
5. The programming lock code may be validated via com-mand to the OTAF, and the mobile unit is “unlocked.”
6. The customer service representative (CSR) collects infor-mation from the new subscriber about credit, billing, fea-ture choices, and so on.
7. The mobile phone is programmed via commands to theOTAF.
8. The CSR has the option to continue or disconnect thevoice call. Typically, the call will continue to assign and
A N D R E W T A Y L O R
MSC
OTAF
Customer ServiceCenter (CSC)
HLR/AC
9. Data request (Session ID)
10. Attach (TRN)
12. Response (ESN, MIN)
13. Data response (ESN, MIN)
11. MSC correlates TRN with voice call
14. CSC retrieves customer record (if available) and routes call to attendant
F I G U R E 3OTASP Call Flow (Data Connection)

956 ■ 19 9 8 A N N U A L R E V I E W O F C O M M U N I C A T I O N S
program the mobile identification number (MIN) as wellas enhanced roaming information.
9. The CSC uses a provisioning management system toenter the subscription information and the subscriberrecord in the HLR, billing database, and voice mail/shortmessage service databases if necessary.
Together, these steps represent a high-level activation flow,and Figures 2 through 10 will provide more detail about theprocesses involved. Figures 2 and 3 show the OTASP call-floworigination and data connection, where a temporary referencenumber (TRN) is assigned by the MSC and sent to the CSC.The CSC software will then establish a data link to the hand-set. That data link, a mechanism by which the data is pro-grammed into the handset itself, goes to the OTAF box. Theresponse back from the handset will include an ESN and anMIN. In a new service activation, the MIN being sent is a de-fault MIN, which is mainly a selection of zeros. If the callwere from an existing account, the assigned MIN would besent and the CSC would have the ability to dip into their
billing system or customer database and actually have thecustomer profile available for review. All of this activity hasoccurred before the CSR even answered the phone. In total,there are around sixteen data interchanges which can occurwithin the network in about four to six seconds.
At this point, the attendant would answer the phone call andthe mobile capabilities would be established, as shown inFigure 4. Information is simultaneously moving back andforth between the handset, the CSC, the OTAF, and the MSC.This is the time when the CSR would start negotiation withthe subscriber, getting an account profile set up, doing acredit validation check, deciding which services and featureswere desired, and then validating those requested servicesand features against the handset information being passedback from the OTAF box. The link to the handset is in usethroughout the call-flow process until the call release occurs.As mentioned above, the subscriber provisioning code (SPC),or the subscriber lock would usually be retrieved by the CSCfrom the billing center where the ESN information is stored.Hence, that is where the associated provisioning lock code
W I R E L E S S
MSC
OTAF
Customer ServiceCenter (CSC)
HLR/AC 15. Attendant answers call
24. Mobile information displayed (as needed)
16. Answer17. Voice path established between end user and CSC attendant. Attendant begins collecting customer information (billing, credit, features, etc.)
18. Mobile capabilities request
19. Data( ProtocolCapReq )20. ProtocolCapRequest
21. ProtocolCapResponse 22. Data( ProtocolCapResp )
23. Capabilities response (mobile model, firmware version, OTASP features)
F I G U R E 4OTASP Call Flow (Mobile Capabilities
F I G U R E 5OTASP Call Flow (SPC Validation)
MSC
OTAF
Customer ServiceCenter (CSC)
HLR/AC
25. Attendant - End User dialogue continues
27. Validate SPC (lock code)
28. Data( DownloadReq )29. DownloadRequest
30. DownloadResponse 31. Data( DownloadResp )
32. Validation response(result)
26. Determine corresponding lock code for ESN
33. If SPC validation fails, CSC attendant is notified

19 9 8 A N N U A L R E V I E W O F C O M M U N I C A T I O N S ■ 957
would be stored for that handset, and so the billing center isaccessed to validate the SPC. This process is shown in Figure 5.When validation has been completed, the mobile program-ming can take place, as shown in Figure 6. This process in-volves a series of requests and responses between thehandset, the MSC, the OTAF box, and the CSC. When basicprogramming is finished, the roaming list may be down-loaded, as shown in Figure 7. The final stage of this part of thecall flow is the data commit, shown in Figure 8, which con-firms the fact that all of the necessary provisioning activitieshave occurred within the handset, and that the handset hasbeen provisioned with the requested features and informa-tion. Call release, shown in Figure 9, is simply the process bywhich the session with the handset would be ended after allprovisioning has been acknowledged.
As can be seen in these figures, there are roughly 58 steps in-volved in getting to this point, and all that has been done isthe provisioning of a handset—only a piece of the subscriberprovisioning process. Part of the solution within a CSC, then,is to manage the provisioning of the subscriber on the actual
network. The most important parts of this activation, asshown in Figure 10, are provisioning the subscriber adminis-tration on the HLR, getting information to the billing data-base, and updating the message center, voice mail server, oreven paging services.
In fact, there is only one piece of software within the CSC thatis managing this whole set of events. That piece of softwaremust have the ability to understand the sequence of the callflow specifically as well as the steps that must occur to getfrom a beginning to an end in general. Perhaps the most im-portant thing that the software must do is know what to do ifthings go wrong. Obviously, there is a great deal of softwarefunctionality built into the CSC from a work-flow perspec-tive. If a customer is calling from a car and goes under a tun-nel, losing the OTAF connection in the middle of theprovisioning process, the software must be able to recover. Itmust be able to know the proper steps to take when the HLRhas been updated but the billing database has not. Robustsoftware intelligence is required within that CSC to pull all ofthose pieces together and support the OTAF process where
A N D R E W T A Y L O R
F I G U R E 6OTASP Call Flow (Mobile Programming)
MSC
OTAF
Customer ServiceCenter (CSC)
HLR/AC 34. CSC attendant finishes collecting information from customer and triggers mobile programming
36. Data( DownloadReq )37. DownloadRequest
38. DownloadResponse 39. Data( DownloadResp )
35. Program request (NAM data)
40. Program response (results)
F I G U R E 7OTASP Call Flow (Roaming List Download)
MSC
OTAF
Customer ServiceCenter (CSC)
HLR/AC
42. Data( DownloadReq )43. DownloadRequest
44. DownloadResponse 45. Data( DownloadResp )
41. Roam list download request (roaming data)
46. Roam list response (results)

958 ■ 19 9 8 A N N U A L R E V I E W O F C O M M U N I C A T I O N S
O V E R - T H E - A I R S E R V I C E P R O V I S I O N I N G
all provisioning activities are automated for true “flowthrough” activation.
Business DriversAlthough over-the-air service provisioning is by no means avery simple process, there are a number of business drivers,for both the service provider and the subscriber. For theprovider, it is difficult to quantify the savings exactly, but itshould be possible to figure the cost of individually manuallyprogramming a handset and multiply that number by thenumber of handsets issued. This, then, is the figure that could
be saved. There are other significant benefits to the provideras well. One of these is the wider range of distribution outlets,which could be anything from retail stores to kiosks to homeshopping networks. There are also reduced distribution costssince handsets no longer have to be preprogrammed. Nor aredealers required for handset sales. The costs of typical handsetprovisioning, either through a keypad or through some typeof handset cradle application, are also minimized. OTASPstreamlines customer care as well, because new service acti-vation is automated in many ways that it was not before, andalso includes feature and service updates or enhancements re-
MSC
OTAF
Customer ServiceCenter (CSC)
HLR/AC
55. Voice call release
56. Release
57. Disconnect
58. Acknowledge
MSC
OTAF
Customer ServiceCenter (CSC)
HLR/AC
48. Data( CommitReq )49. CommitRequest
50. CommitResponse 51. Data( CommitResp )
47. Commit request
52. Commit response (result)
53. Attendant notified that mobile programming has successfully completed
54. Attendant tells customer that mobile programming is completed. Mobile will be activated soon. (voice call may be discontinued)
F I G U R E 8OTASP Call Flow (Data Commit)
F I G U R E 9OTASP Call Flow (Call Release)

19 9 8 A N N U A L R E V I E W O F C O M M U N I C A T I O N S ■ 959
A N D R E W T A Y L O R
quested by an established customer. OTASP is even beingused as a marketing vehicle—it is new, extremely convenient,does not require authorized dealers for activation, and sup-ports unique and desirable features like programming lock,enhanced roaming lists, and A-Key exchange.
Of course, there are benefits to the subscriber as well. First,they do not need to go to a specialty store, but can purchase ahandset almost anywhere. Second, they do not need to un-dergo a lengthy, in-house provisioning process. Rather,through OTASP, provisioning can occur anywhere fromhome, car, or the store itself, to an office. It would even be pos-sible to buy and provision a handset from anywhere theywere offered, even if the customer was away from home.Finally, the use of OTASP offers the customer immediate ser-vice and feature activation. The entire process of activating the
handset plus doing the subscriber administration on the HLRand updating billing takes somewhere from ten to twentyminutes, only a portion of that requires the customer’s on-lineparticipation. Obviously, the convenience is exceptional.
In summary, over-the-air service provisioning is an excitingconcept, for suppliers and customers alike. It is still in the de-finition stages, and standards have yet to be fully developed.There are also serious considerations about the technologynecessary for the customer service centers. All of these prob-lems are far from insurmountable, however, and the new fea-tures being introduced through this service, A-Key,programming lock, and enhanced roaming lists, are excitingin and of themselves. As the marketplace grows and as de-ployment grows, there should be many more enhanced fea-tures that could be supported through OTASP.
Billing
Customer ServiceCenter (CSC)
HLR/AC
MessageCenter Voice
59. CSC triggers updates to subscriber record(s).
60. CSC notified of update completion
F I G U R E 1 0OTASP Call Flow (Subscriber Activation)

19 9 8 A N N U A L R E V I E W O F C O M M U N I C A T I O N S ■ 961
Wireless web access technology is a field that combines twovery interesting industries—wireless and the Internet—bothof which have had very high growth rates in the past fewyears. In the last decade when cellular phones first becameavailable, many people thought they were a niche market forbusiness executives who needed to stay in touch at all times.Many people overlooked the potential of this technology.Today, many individuals use cellular phones for diverse rea-sons—to stay in touch, for emergencies, and so on. In com-parison with cellular telephony technology, wireless datacommunication is still at an early stage of growth, but there ismuch room for innovation as well as market expansion.
This paper will provide an overview of the trends not only inwireless data, but also in the wireless industry in general. Itwill then examine some of the current wireless systems thatcan provide data communications, including wireless wide-area and local-area networks, satellite, and local multipoint dis-tribution systems (LMDS). Finally, emerging technologies andfuture trends in wireless communications will be outlined.
Why Wireless?
It may well be asked why anybody would choose a wirelesssolution when there are, in fact, wireline solutions that canprovide a great deal of bandwidth. In the case of World WideWeb access, this may indeed be the most important consider-ation. There are, however, other features that wireless offerswhich wireline service does not. For example, wireless solu-tions have a low infrastructure cost, are attractive for lowtake-rate scenarios, and can offer fast initial deployment.These three attributes may be more important for the serviceprovider than for the subscriber. However, from the user’spoint of view, wireless offers mobility—a very important fea-ture that wireline communications cannot provide.Additionally, wireless has There are other advantages, aswell, including the ability to provide high bandwidth and theintegratione of other broadband services such as digital videobroadcast. Finally, satellite wireless communications can offerdelivery costs independent of transmission distance.
There are several ways to compare different wireless systems.The most important of these are spectrum, bandwidth, andmobility. Spectrum, which can be licensed or unlicensed, is avery valuable resource in connection to wireless communica-tions. Bandwidth, as mentioned above, is essential forInternet access and is how the performance of different sys-
tems is measured. High bandwidth can be either symmetricor asymmetric. Finally, mobility is an advantage offeredsolely by wireless technology. There are fixed wireless sys-tems that do not provide mobility, systems that provide lim-ited mobility (local area), and systems that provide mobilityover within a wide area.
Wireless Technology Spectrum and IndustryAlignment
It is possible to isolate some differences in the way that theindustry is changing. Cellular communications are primar-ily transmitting voice signals. New applications, though, areopening the doors to data and even video transmissions.One of the primary concerns in the case of wireless commu-nications is the integrity of the transmitted ssion signal.Signal Ffading is one of the biggest still a problems in wire-less communications. Signal fading can cause small inter-ruptions and, therefore, the loss of information. This is not amajor limitation forduring some voice communication;,howevertransmissions, and it is a problem that can not beafforded in the case of data communications. In data com-munications, Iit is necessary to provide a system that trans-mits information between two points in a reliable manner.Another concern is increasing changing bandwidth require-ments. Most of the current systems provide low bandwidth,and as technology improves there will be more applicationsthat demand higher bandwidth.
SpectrumOf the differentiators listed above, spectrum may be the mostvaluable resource for wireless communications. Figure 1 pro-vides a limited list of established, transitioning, and emergingindustries and their location in the spectrum. Established in-dustries include cordless telephones, cellular telephones, di-rect broadcast satellites (DBS), and microwave point-to-pointsystems. The part of the industry that is in transition includeswireless cable, which accounts for local multipoint distribu-tion systems (LMDS) and microwave multipoint distributionsystems (MMDS). Other groups that are in transition includewireless LAN/WAN using one of the unlicensed parts of thespectrum, and the land mobile industry (SMR).
When considering spectrum, it is important to understand thecharacteristics of different frequency bands. As can be seen,all of the industry groups in the established and emergingsectors, as well as those in transition, use different frequency
Wireless Web Access Technologies
Gabriel ValdezSenior Technical Staff MemberAT&T Labs

962 ■ 19 9 8 A N N U A L R E V I E W O F C O M M U N I C A T I O N S
bandsies. The higher the frequency, the higher the attenua-tion due to rain and other propagation effectsfactors, and themore difficult it is to provide mobility. Also, the higher thefrequency, the higher the bandwidth that is available.Obviously, this creates an interesting challenge, since ideally itwill be possible to have high bandwidth as well as mobility.In the lower part of the spectrum, then, there is very limitedbandwidth available. For this reason, applications that re-quire higher bandwidth must move to higher frequencyranges, that require more complex technology and for whichcomponents are technology is not as advanced and equip-ment is more expensive.
Many countries are dealing with these same challenges in similarways, and some are choosing different areas of focus. For in-stance, countries such as Canada have been far more aggressiveabout issuing LMDS licenses and will probably deploy thistechnology before the United States. One strong trend in theUnited States is toward the flexible utilization of spectrum.This means moving from the fixed narrowband channeliza-tion of spectrum and modulation schemes, standards, andtechnology mandated by FCC rules (e.g., AM and FM radio)to flexible broadband spectrum licenses, unrestricted chan-nelization and modulation schemes, voluntary standards,and the use of emerging technologies (e.g., PCS and LMDS).
W I R E L E S S
EstablishedIndustry
Industry InTransition
Frequencyin MHz
SpectrumAllocation
1850-1990824-849
851-866
935-940
940-9412.5-2.7 12GHz 38GHz 50GHz
& above
EmergingIndustry
869-894
806-821
46 & 49
896-901
PCSIndustry
MobileSatelliteIndustry
LandMobile Industry
(SMR)
MillimeterWave
Industry
CordlessIndustryCordlessIndustry
930-931
DirectBroadcastSatelliteIndustry
DirectBroadcastSatelliteIndustry
NII/Supernet
5.15 - 5.35, 5.725 - 5875 GHz17 - 20GHz
Fixed Satellite Industry
WirelessCable
Industry
WirelessCable
Industry
27 - 30GHz
MicrowaveIndustry
MicrowaveIndustry
2110-2150
2400-2483
WirelessLAN/WANWireless
LAN/WAN
902-928
CellularIndustryCellularIndustry
F I G U R E 1Wireless Technology Spectrum and Industry Alignment
F I G U R E 2Trends in Wireless Communications Technology
AT&T-ACL-gvSupercomm 97 Presentation
page-3MobilityMobility
Ban
dw
idth
Ban
dw
idth
(Mb
ps)
(Mb
ps)
LMDS
MMDS
Satellite (Fixed)
Wireless Local LoopWireless WAN (ARDIS, Metricom)
Wireless LAN
CDPD/Cellular Circuit
10
1
0.1
0.01
Fixed Local Area Wide Area
Wireless Technology is expanding from a narrowband Mobile environment to broadband fixed services

19 9 8 A N N U A L R E V I E W O F C O M M U N I C A T I O N S ■ 963
This could involve going from the primary use of radio at 10kHz AM and 200 kHz FM, television at 6 MHz VSB, and cel-lular at 30 kHz to the more common use of LMDS at 500MHz or 1000 MHz and personal communications systems(PCS) at 5, 15, or 20 MHz. Not only should this trend in-crease transmission possibilities, but it should also foster thegeneration and use of new technology.
Another important trend in wireless data communications isthe expansion from a narrowband mobile environment tobroadband fixed services (see Figure 2). The first systemsavailable provided a lot of mobility via cellular digital packetdata (CDPD), but could only handle small data rates over awide area. Now wireless technology is expanding from a nar-rowband mobile environment to broadband fixed services.Systems such as LMDS, MMDS, and digital satellite technolo-gies are more common.
Wireless Wide Area Networks
There is a great need in the case of wireless wide area net-works (WAN) for mobility, and optimally there should alsobe high bandwidth as well, but the current systems are verylimited. Figure 3 shows two of the available technologies, cel-lular digital packet data (CDPD) and cellular circuit connec-tion, both based in the cellular network. CDPD is a systembased on packet switching packet switched–type of systemthat provides connectionless service. This means that it is pos-sible to leave a laptop computer with a CDPD modem on allthe time, andbut it will only transmit or receive informationwhen it is requested to do so. or is receiving information. Thisis important, because charges for CDPD use are incurred perkilobit of information transmitted/-received. CDPD, then, al-lows terminal mobility, takes advantage of unused channels,and is ideal for sending and receiving small amounts of infor-
G A B R I E L V A L D E Z
AT&T-ACL-gvSupercomm 97 Presentation
page-44
Cellular Digital Packet Data (CDPD) & Cellular Circuit Connection
DataNetwork
Mobile Transmission Switching Office (MTSO)
Backhaul
Modem Pool ISP
Internet ServiceProvider
Gateway
PSTN
InternetCDPD
CircuitConnection
Cellular Circuit Connection¥ Allows terminal mobility ¥ Uses regular voice channels¥ Charged based on connection time¥ Modem pool provides: - Optimized modem performance - Elimination of handoff retrain - Precise setting of transmit levelsIssues¥ Limited throughput (14.4 kbps)
CDPD¥ Allows terminal mobility ¥ Takes advantage of unused channels¥ Ideal for sending and receiving small amounts of information¥ Priced for each kilobyte transmitted¥ Provides connectionless serviceIssues¥ Limited throughput (19.2 kbps)
Spectrum¥ Cellular Band (~ 800-900 MHz)
F I G U R E 3Wireless Wire Area Network (WAN)
Service Characteristics¥ Wide Area Mobility¥ Micro-cell Architecture¥ Spread Spectrum Transmission¥ Provides connectionless service¥ Flat rate charge¥
Wired Access Point
Network Interconnection
Facility
InternetPC with Wireless Modem
FrameRelay
Spectrum¥ Industrial Scientific Medical (ISM) Band 902-928 MHz
Issues¥ Low power transmission limits coverage¥ Limited throughput (28 kbps)
F I G U R E 4Wireless Wide Area Network (WAN)

964 ■ 19 9 8 A N N U A L R E V I E W O F C O M M U N I C A T I O N S
mation. The major limitation associated with CDPD is that itinvolves a limited throughput of up to 19.2 kbps.
Cellular circuit connection, on the other hand, involves awireless modem connected to a cellular phone. A connec-tion is established between the wireless modem andThis isconnected to a modem pool that is located in the mobiletransmission switching office (MTSO). In this case, themodem pool provides some protocol conversion to optimizethe transmission in the wireless part of the link. Then fromthat modem pool it connects to the rest of the telephony net-work. Cellular circuit connection also allows for terminalmobility, uses regular cellularvoice channels, and ischarged based on connection time. The modem pool pro-vides optimized modem performance, elimination of hand-off retrain, and precise setting of transmit levels. Here again,
the limitation involves bandwidth, with a throughput of upto 14.4 kbps.
Figure 4 provides another example of a wirless WAN—a li-cense-free system, such as that provided by Metricom. Thiscompany is currently providing this service in several cities,includingin the San Francisco Bay area and Seattle amongothers. This technology differs from the two mentioned abovein that it involves more of a micro-cellular environment. Thetendency to move to smaller cells is valid for many differentapplications. The purpose of such a system is to increase ca-pacity by reducing the size of the cell. It is important to notethat this system uses one of the license-free parts of the spec-trum, the industrial scientific medical (ISM) band (902–928MHz). This type of system also offers connectionless serviceand is charged at a flat rate. One of the disadvantages here is
W I R E L E S S
T A B L E 1Summary of Wireless WAN Technologies
F I G U R E 5Wireless Local Area Network (LAN)
CDPD RAM Mobile(Mobitex)
ARDIS (KDT) Ricochet
Data Rate
Modulation
Frequency
Chan. Spacing
Status
Access Method
Transmit Power
19.2 Kbps 8 kbps(19.2 Kbps)
4.8 kbps(19.2 Kbps)
~ 28 kbps
ProductCompany
~ 800 MHz ~ 900 MHz(SMR)
~ 800 MHz(SMR)
~ 915 MHz(902 - 928)
In Service In Service In Service In Service
40 Watt 1 Watt
Unused AMPSChannels
Slotted AlohaCSMA
FH SS(ISM band)
30 KHz 12.5 KHz 25 KHz 160 KHz
GMSK GMSKGMSK GMSK
Motorola MetricomLucent, Nortel,Ericsson, etc.
EricssonMobitex
Operations Characteristics¥ High mobility & wide range¥ Low data rate
AT&T-ACL-gvpage-77
Internet
IEEE 802.11 Features:¥ Spread Spectrum Transmission¥ Authentication¥ Data integrity¥ Registration¥ Security¥ Mixed Data rate support¥ MAC management - Synchronization - Power control - Association/Intra LAN mobility
Service Characteristics¥ In building service¥ Bandwidth - 500 kbps - 2 MbpsIssues¥ Limited coverage ( < 500 ft. )¥ Lack of seamless coverage¥ Lack of frequency reuse limits capacity
Spectrum¥ ISM Band - 902-928Mhz - 2400-2483.5Mhz¥ SuperNet - 5725-5850Mhz
Ethernet orFast-Ethernet
Mobility Server
Router
RadioPort
Laptops or PDA with PCMCIA Modem

19 9 8 A N N U A L R E V I E W O F C O M M U N I C A T I O N S ■ 965
G A B R I E L V A L D E Z
that the allowed transmit power transmission is low, whichlimits coverage, and the throughput is currently limited to ap-prox. (28 kbps).
There are other wireless data systems that currently provideservice, being researched, such as RAM Mobile and , ARDIS,and Ricochet. These are systems that have been available forsome time and were originally used for applications likecredit- card request in a mobile environment. All of these sys-tems share the operations characteristics of offering high mo-bility over a wide areaand a wide range, and they are usefulfor low–data rate transmissions. Table 1 summarizes the char-acteristics of several of these systems.
Wireless Local Area Networks
Another important category of wireless access technology isthe wireless local area network (W-LAN), an example ofwhich is shown in Figure 5. This is still not a mature technol-ogy, although there have been some products available forsome time. The most common standard is IEEE 802.11, whichprovides features such as spread spectrum transmission, userauthentication, data integrity, registration, security, mixeddata rate support, and moves, adds, and changes (MAC)management (i.e., in the areas of synchronization and, powercontrol), and association/intra-LAN mobility. Security is aparticularly important issue in wireless communications, be-cause these networks use a medium that is shared and avail-able to anyone with an antenna. In the case of wireless LAN,the data rates range fromare 500 kbps to 2 Mbps—signifi-cantly higher than with wireless WAN. Several vendors areworking on solutions that may accommodate rates of up to 10Mbps. Some infrared systems are also becoming available.
802.11 uses spread spectrum transmission, which has the ad-vantages of providing some level of security and being resis-tant to interference from other systems and users. Wireless
LAN also has some drawbacks associated with it; the cover-age is limited to 500 feet or less and roaming may not beseamless. In addition, the lack of frequency reuse limits ca-pacity. As with wireless WAN, the goal of wireless LAN is tohave a laptop computer or a personal digital assistant (PDA)with a modem that connects to radio ports.
Asymmetrical High-Speed Digital SatelliteAnother wireless technology that is available is asymmetricalhigh-speed digital satellite (e.g., DirecPC). This system uses asatellite to send information downstream. ,A and an exampleis shown in Figure 6. One important characteristicthing aboutthis system is that it provides asymmetrical service, wherebyrequests are sent through a plain old telephone service(POTS)typical (plain old telephone service) telephone linewith a regular with a plain old telephone service (POTS)modem, over the PSTN and the returned information is sentback through the satellite. This system takes advantage ofsome of the important features of satellite communications,such as the capacity to broadcast large amounts of informa-tion and cover a wide area , (i.e., such as an entire country).Asymmetrical high-speed digital satellite systems offer dis-tance-independent delivery cost and support- data broadcastservices such as stock quotes, news, and so on. The high-power systems allow for the use of small receiving antennadishes. and can be used for software distribution. The systemcan even also integrate digital video broadcast.
Of course, there are also several technical issues with this typeof system because of the asymmetrical transmission. First,since the goal is to deploy a higher-bandwidth communica-tion that utilizes up to 400 kbps in the downlink, the ac-knowledgments requests that are sent back through thetelephone line may exceed the capacity of that line. Hence, itbecomes necessary to use different types of techniques, suchas selective acknowledgment, to overcome the problem.Another very important problem in with satellite communi-
F I G U R E 6Asymmetrical High-Speed Digital Satellite (e.g., DirecPC)
AT&T-ACL-gvpage 8
SatelliteGateway
Internet
Direct BroadcastSatellite (DBS)
Low SpeedReverse link
High SpeedInternet
Connection
High SpeedData Broadcast
ISP
Internet ServiceProvider
Receive-onlyearth station
AsymmetricalService
Gateway
PSTN
Service Characteristics¥ Asymmetrical Service (terrestrial reverse link)¥ Global Coverage (e.g Continental U.S )¥ Distance-independent delivery cost¥ High Power Systems Enable Small Receive Antenna Dishes¥ Supports Data Broadcast Services (stock quotes, news, etc.)¥ Can be used for Software Distribution¥ Can integrate Digital Video Broadcast
Issues¥ High Startup cost¥ Limited TCP throughput due to: - Propagation delay - Low speed reverse link - TCP slow start behavior - Small TCP Buffer in PCÕs
Bandwidth - 400 kbps downlink - 28 kbps uplink
Web Page Request
Web Response (HTML file)

966 ■ 19 9 8 A N N U A L R E V I E W O F C O M M U N I C A T I O N S
W I R E L E S S
cations is the propagation delay. Because the satellite is lo-cated 22,000 miles above the earth, the signal delay is aboutone quarter of a second. While one-fourth of a second maynot seem too important, in the case of computer protocols, itgreatly reduces the throughput of the transmission controlprotocol (TCP) connection. Limited TCP throughput is alsocaused by the low-speed reverse link, TCP slow-start behav-ior, and small TCP buffers in PCs.
Local Multipoint Distribution SystemAs mentioned above, there are other systems that providehigher bandwidth, such as local multipoint distributionsystem (LMDS). This technology is shown in Figure 7.These types of systems are migrating from digital or ana-log video broadcast (VB) to providing two-way communi-cations or digital services. MMDS is very similar to LMDSbut operates at a different frequency with more limitedbandwidth. One of the advantages of LMDS is that, de-pending on the country, there is a large great dealamountof bandwidth or spectrum available. In the case of the
United States, 1.3 GHz is available, which can accommo-date high–data rate services. Essentially, the total capacitywill be determined by the amount of spectrum available.Some of the other positive aspects of LMDS are that it canoffer wide area coverage and integrate telephony and digi-tal VBvideo broadcast.
There are also limitations associated with LMDS. Because ofthe high frequencies being used (in this case, 28 GHz), line-of-sight transmission is required. This means that theremust be an antenna that is capable of “looking at” the trans-mitter, and the signal is greatly attenuated at these frequen-cies. This can be overcome by using directional antennasand having higher power in the transmit end, but in order toprovide a higher percentage of coverage there is a need fora cellular type of architecture. Since the signal does not pen-etrate buildings, there must be several transmitter stationsthat can reach the same user from different points. Even inthese conditions, coverage will only reach about 80 percentof the total number of users.
F I G U R E 7Local Multipoint Distribution System (LNDS)
T A B L E 2Local Access Technology Assessment
AT&T-ACL-gvSupercomm 97 Presentation
page-9
PSTN
VideoHead End
Service Characteristics¥ Large Spectrum available¥ Can provide high bandwidth (> 1.5 Mbps)¥ Capacity Depends on Spectrum Allocation¥ Wide Area Coverage¥ Can integrate Telephony and Digital Video Broadcast
Internet
Spectrum¥ LMDS ~ 1.3 GHz @ 28 Ghz
SONET Ring
BS
BS
BS
Issues¥ Requires Line of Sight¥ Overlapping cells are needed to improve coverage¥ Limited to fixed applications¥ Signal does not penetrate buildings
Local Access Technology(Segmentation Group)
Bandwidth Supported
Metallic Access
Coax Access
Fiber Access
Licensed Spectrum
Unlicensed Spectrum
Satellite
Downstream Data Upstream Data
28.8 144
Twisted Pair (POTS)Twisted Pair (ISDN)ADSLHDSLSDSL
Two-Way Coax
Cable ModemFiber to the Home
Fiber to the CurbCellular/CDPDFixed WirelessWireless Cable (MMDS,2.5GHz)Wireless Cable (LMDS, 28MHz)
ISM (0.9, 2.4 GHz)SuperNet (5.1,5.7 GHz)
Direct BroadcastMobile Satellite ServicesFixed Satellite Services
384128 1.5 2.06404.8
Kbps Mbps
6.1 10 30 155 1.245
Gbps
1019.2
Symmetric Data
64
Voice

19 9 8 A N N U A L R E V I E W O F C O M M U N I C A T I O N S ■ 967
G A B R I E L V A L D E Z
Table 2 provides a basic summary of some of the technologiesdiscussed above, comparing them to wireline technologiessuch as asymmetrical digital subscriber line (ADSL), high–bitrate digital subscriber line (HDSL), cable modems, fiber, andso on. Within the area of wireless communications there are avariety of applications that range from very limited band-width to bandwidth that is on the order of several megabitsper second.
Emerging Trends
There are several technologies that are critical for wirelesscommunications. As mentioned above, the higher the fre-quency, the more complex and expensive the equipment is.This means that there is a need for low-cost, high-frequencydevices. The industry is also looking for low-power trans-ceivers and pico- cellular technology. Effort should also befocused on developing systems that make more efficientuse of the spectrum. This means more advanced channelmodulation schemes and signal/channel processing. Otherkey enabling technologies include smart antennas, digitalradios, self-adapting networks, and distributed processingand switching.
Digital Satellite ServicesThere are a number of digital satellite services that are currentlybeing created that will provide two-way communications asopposed to the asymmetrical solutions mentioned above. Theywill offer voice, data, and video services; higher data rates;higher capacity; and higher frequency operation. This type ofsystem is shown in Figure 8. There are several technologies thatare key to these types of services, including the following:
• higher solar array power • larger satellites • on-board processing • the use of spot beam antennas• higher frequency operation (e.g., Ka band) • new channel coding and error correction schemes• higher-order modulation schemes
The advantage of spot-beam antennas is that they cover avery limited area. Hence, it is possible to employ frequencyreuse—the basic concept of cellular communications—to pro-vide higher capacity. On-board processing is also essential.Most of the current satellites are only “bent pipe”–type de-vices; that is, repeaters in the sky. They receive the signal andsend it back to the earth. With on-board processing, it is pos-sible to recover the signal through modulation and do thingslike switching in the sky.
Potential drawbacks to this type of satellite system includesthe issue of power, since the power that is available in thesatellite is very limited. In addition, there will probably bemultiple service providers contending for the attractive slotsavailable. This type of technology also involves a high startupcost and may have difficulty interworking with terrestrialwireless technologies. Finally, systems such as these have hasyet to meet with worldwide regulatory approval.
Merging of Data Networking and Mobility ApplicationsAnother trend in wireless communications is the merging ofdata networking and mobility applications. The goal is toprovide higher data rates for wireless LAN communicationsand mobility similar to systems such as CDPD. With regardto LAN applications, using wireless transmission would re-duce costs, since there would be no need to install wire orfiber. Also, the networking complexity using combinations ofwired systems is too high. In the case of high-mobility appli-cations, using wireless transmission would meet the need tocommunicate while in motion, allowing a large roamingarea. As yet, there are no wired systems available to answerthese needs.
As mentioned above, one disadvantage of wireless LANstoday is that they are basically isolated into “cells” and usergroups. They do not provide roaming capabilities or a widearea of coverage. They have a small user population, offernon-contiguous coverage, and operate almost solely indoors.Finally, current wireless LANs are slower than Ethernet andaccommodate mostly asynchronous traffic. In the future, withwireless data network services, there should be a larger user
F I G U R E 8Emerging Trends in Wireless Communications Technology: Digital Satellites
Processing/Switching Satellite
SwitchBeamTransceiver
SignalProcessing
Antenna Antenna
BeamTransceiver
SignalProcessing
Features¥ Two-way communications¥ Voice, Data and Video services¥ Higher Data rates¥ Higher capacity¥ Higher Frequency operation (e.g. Ka Band)
Key Technologies¥ Higher Solar Array Power¥ Larger Satellites¥ On-board processing¥ Use of spot beam antennas¥ Higher Frequency operation (e.g. Ka Band)¥ New channel coding and error correction schemes¥ Higher order modulation schemes Potential Issues
¥ Multiple Contenders for Attractive Slots¥ Inter-working with Terrestrial Wireless ¥ High Startup cost¥ Worldwide regulatory approval

968 ■ 19 9 8 A N N U A L R E V I E W O F C O M M U N I C A T I O N S
W I R E L E S S
population utilizing Internet/intranet connectivity, with con-tiguous coverage available in dense areas and in a wider areathat provides roaming capability similar to what is availablefor cellular phones. Wireless data network services will utilizea mix of asynchronous and isochronous traffic and achieveEthernet-compatible speeds.
Advanced Antennas and Radiation Pattern-Management ProcessingAnother new technology in wireless communications in-volves advanced antennas and radiation pattern-manage-ment processing. This type of system is shown in Figure 9.Current cellular networks have different base stations distrib-uted over large cells. There is currently a movement toward asecond generation of microcell systems, where the goal is toincrease the capacity inside onea building or in a campus byusingand provide a smaller area of cells. The third generationis multi-sector antennas, where the signals received from dif-ferent antennas are combined and switched to increase capac-
ity. The fourth generation would involve some adaptive pro-cessing of the signal-receive antenna. In this case, the mode ofthe antenna pattern can be steered to reduce or cancel inter-ference caused by users and, again, increase the capacity.Finally, the fifth generation would involve multi-beamphased arrays and dynamic tracking and acquisition. Thiswould allow for higher processing of the signal as well as ac-tually steering the gain of the antennas in different directionsto point at different users, once again increasing capacity.
Distributed Adaptive Radio SystemsA final important trend in wireless communications technol-ogy is the use of distributed adaptive radio systems. This con-cept is shown in Figure 10. Such a system will utilize today’sinexpensive computing hardware to create a distributed-in-telligence cellular network that is an extension to the wirednetwork and capable of automatic networking, frequencyplanning, and adapting to a changing RF interference envi-ronment. It would make it possible to move from a central-
F I G U R E 9Emerging Trends in Wireless Communications Technology
F I G U R E 1 0Emerging Trends in Wireless Communications Technology: Distributive Adaptive Radio Systems
Rcvr
Antenna ProcessorPicocellPicocell
(Low(LowProcessing)Processing) PicocellPicocell
(Significant(SignificantProcessing)Processing)
4th Generation4th GenerationAdaptive ProcessingAdaptive ProcessingNull-SteeringNull-SteeringInterference CancellationInterference Cancellation
5th Generation5th GenerationMulti-Beam Phased ArraysMulti-Beam Phased ArraysDynamic Tracking/Dynamic Tracking/ Acquisition Acquisition
3rd Generation3rd GenerationMulti-SectorMulti-SectorDynamic Switching/Dynamic Switching/ Combining Combining
PicocellPicocell(Minimal(Minimal
Processing)Processing)
1st GenerationOmnidirectionalDirectional (Sector)Space Diversity
2nd GenerationDistributed ArraysAdaptive EqualizationRake Receivers
LargeCellSystems
Microcell Systems(In-Building
and Outdoor Campus)
Current Systems
Advanced Antennas and Radiation Pattern-Management ProcessingAdvanced Antennas and Radiation Pattern-Management Processing
Advanced Antenna Technologies Enable Higher Spectral Utilization & Capacity
AT&T-ACL-gv3
Distributed Adaptive Radio Systems Distributed Adaptive Radio Systems
Utilize todayÕs inexpensive computing hardware to create a distributed-intelligence cellular network which is an extension to the wired network and capable of automatic networking, frequency planning, and adapting to a changing RF interference environment.
AWireless SystemsWireless Systems
TodayToday
Future WirelessFuture WirelessSystemsSystems
Larger User PopulationNeed for Better QualitySmaller Cells/Various SizesIrregular Cell Shapes Due to Obstacles and Other Propagation Conds.Overlaid CellsIn-Building Systems
GNew Environment:
F
AC
D
B
E
C
D
D
DA G
F
E
G
B
B
G
A
BF
D
19 9 8 A N N U A L R E V I E W O F C O M M U N I C A T I O N S ■ 969
G A B R I E L V A L D E Z
ized system to more a distributed system, where each cell hassome intelligence.
SummaryWireless WAN systems can provide low–data rate mobileconnectivity to the Web. When higher bandwidth is neces-sary, fixed wireless systems can be used. These are capable ofproviding data rates that are comparable to or even higherthan those available through technologies such as ADSL andcable modems. In terms of providing both mobility and highbandwidth, the solution seems to lie in wireless data commu-nications, which are still at an early stage of growth.Fortunately, advances in technology are making possible low-cost, high-performance solutions. Ideally, these will be fo-cused on the eventual full development of wireless datacommunications systems.
The industry faces many challenges in the drive to increasesystem performance and make wireless services comparableto wireline service. There is a need to reduce cost, both interms of operations and service provisioning. Ideally, it willalso be possible to increase capacity through emerging radiotechnologies that increase system capacity, such as smart an-tennas, advanced modulation techniques, and microcellulartechnology. Another essential objective for wireless accesstechnologies is future proofing—chosen technologies must in-volve a robust and flexible network architecture. Finally, andperhaps obviously, everyone involved would like to see morerevenue growth. Hopefully, enhanced services will leverageemerging technologies, and wireless access technologies willreach their full potential, both in terms of services offered andfinancial return.