section p – organic spectroscopy and analysis p3 nfra red...
TRANSCRIPT

Section P – Organic spectroscopy and analysis
P3 INFRA-RED SPECTROSCOPY
Key Notes
Energy absorption in the IR region of the electromagnetic spectrum resultsin the stretching or bending of covalent bonds. More energy is required in astretching vibration than a bending vibration. More energy is required tostretch multiple bonds compared to single bonds. Bonds to light atomsvibrate faster than bonds to heavy atoms.
An IR spectrum is a measure of energy absorption versus the reciprocalwavelength (known as the wavenumber) of the radiation involved. Thehigher the wavenumber the greater the energy involved.
IR energy is only absorbed if the vibration results in a change in dipolemoment.
The fingerprint region contains many peaks and it is not possible to identifythe majority of peaks present in that region. Some peaks associated withparticular functional groups can be identified if they are more intense thantheir neighbors. The fingerprint region is useful when comparing two com-pounds to see if they are identical.
Functional groups display characteristic absorptions at particular regions ofthe IR spectrum allowing the identification of such groups in a molecule.
Related topics Properties of alkenes and alkynes(H2)
Preparation and properties (I2)Properties (J2)Structures and properties (K1)Preparation and physical properties
of alkyl halides (L1)
Properties of alcohols and phenols(M3)
Properties of ethers, epoxide andthioethers (N2)
Spectroscopy (P1)Properties of amines (O2)Chemistry of nitriles (O4)
Introduction
The IR spectrum
Identification offunctional groups
The fingerprintregion
Detectableabsorptions
Introduction Molecules can absorb energy in the infra-red region of the electromagneticspectrum resulting in the increased vibration of covalent bonds. There are twotypes of vibration resulting either in the stretching or the bending of bonds. Thesevibrations occur at specific frequencies (or energies) depending on the bondinvolved. It is useful to think of the bonds as springs and the atoms as weights inorder to rationalize the energy required for such vibrations. There are two factorsaffecting the frequency of vibration – the masses of the atoms and the ‘stiffness’ ofthe bond. Multiple bonds such as double or triple bonds are stronger and stifferthan single bonds and so their stretching vibrations occur at higher frequency (orenergy). The stretching vibration of bonds also depends on the mass of the atoms.The vibration is faster when the bond involves a light atom rather than a heavyatom. Stretching vibrations require more energy than bending vibrations.

The IR spectrum An IR spectrum is a graph of the absorbed energy versus the wavenumber (υ).The wavenumber is the reciprocal of the wavelength (i.e. 1/λ) and is measured inunits of cm−1. It is proportional to the frequency or energy of the radiation and sothe higher the wavenumber, the higher the energy. For example, the absorptionpeak due to the stretching of an alkyne triple bond comes in the region2100–2600 cm−1. This corresponds to a higher energy than the stretchingabsorption of an alkene double bond that is in the range 1620–1680 cm−1.
The stretching vibration for a C-H bond occurs in the region 2853–2962 cm−1,compared to the stretching vibration of a C–O bond which occurs in the finger-print region below 1500 cm−1, illustrating the effect of mass on vibrationalfrequency.
Most stretching vibrations occur in the region 3600–1000 cm−1, whereas bendingvibrations are restricted to the region below 1600 cm−1. The normal range for IRspectra is 4000–600 cm−1.
Detectable Not all vibrations can be detected by infra-red spectroscopy. IR energy is only absorptions absorbed if the vibration leads to a change in the molecule’s dipole moment. Thus,
the symmetrical C=C stretching vibration of ethene does not result in theabsorption of IR energy, and no absorption peak is observed.
The fingerprint For most organic molecules, there are a large number of possible bond vibrations, region and this number increases as the molecule becomes more complex. As a result,
there are usually a large number of peaks observed such that the IR spectrum ofone molecule is almost certain to be different from that of another. The regionwhere most peaks occur is generally below 1500 cm−1 and is called the fingerprintregion. This region is particularly useful when comparing the spectrum of a testcompound against the spectrum of a known compound. If the spectra areidentical this is good evidence that both compounds are identical.
Since the fingerprint region is usually complex with many peaks present,it is not possible to assign the type of vibration associated with each peak unlessa particular peak shows greater intensity over its neighbors or ‘stands alone’.Absorptions for some functional groups such as esters, nitro or sulfonate groupsdo occur in the fingerprint region and can be identified because of their positionand intensity.
Identification of IR spectra are particularly useful for identifying the presence of specific functional functional groups groups in a molecule, since the characteristic vibrations for these groups are
known to occur in specific regions of the IR spectrum. For example, absorptionsdue to the carbonyl stretching of an aldehyde occur in the region 1690–1740 cm−1
whereas the corresponding absorptions for an ester occur in the region1735–1750 cm−1. IR tables can be used to assign the various peaks and hence thefunctional groups present.
P3 – Infra-red spectroscopy 323
Section P – Organic spectroscopy and analysis
P4 PROTON NUCLEAR MAGNETICRESONANCE SPECTROSCOPY
Key Notes
Nmr spectroscopy involves the detection of nuclei. Nuclei are charged spin-ning bodies that have an associated magnetic moment. In proton nmr, anexternal magnetic field is applied to force protons into two possible orien-tations which are not of equal energy. Those nuclei spinning with their mag-netic moments aligned with the field are more stable than those spinningwith their magnetic moments aligned against the field. There is a greaterpopulation of nuclei in the more stable orientation. Applying energy in theform of electromagnetic radiation causes the nuclei to flip or resonatebetween the two orientations resulting in an overall absorption of energy.When the radiation is stopped, the nuclei relax to the more stable popula-tion ratio resulting in an emission of energy. A spectrum can be obtained bymeasuring the energy absorbed or the energy emitted. The energy requiredfor resonance is in the radiofrequency region of the electromagneticspectrum and is equal to the frequency with which the magnetic momentprecesses round the axis of the applied magnetic field. The precessionalfrequency increases if the applied magnetic field is increased. Nmrspectrometers and spectra are defined by the energy required for resonance.
The presence of secondary magnetic fields in a molecule means that non-equivalent protons experience slightly different magnetic fields when theexternal magnetic field is applied. This means that different protons requiredifferent energies for resonance and give different signals in a spectrum.
Electrons are charged spinning bodies, which set up a secondary magneticfield that opposes the applied field and shields the proton. The greater theelectron density around a proton, the greater the shielding and the lessenergy is required for resonance.
The protons which give signals at the right hand side of an nmr spectrumare more shielded than those at the left-hand side and require less energy toresonate. The scale used in nmr is known as the chemical shift which is mea-sured in parts per million relative to the signal for a reference compoundcalled tetramethylsilane.
The position of a signal in the nmr spectrum is affected by the inductiveeffects of various groups. Electron donating groups increase the electrondensity round a neighboring proton and lower the chemical shift. Electronwithdrawing groups have the opposite effect.
Introduction
Secondary magneticfields due to electrons
Secondary magneticfields
The nmr spectrum
Inductive effects onchemical shift

Introduction Of all the spectroscopic methods, nuclear magnetic resonance (nmr) spectroscopyis the most useful in determining the structure and stereochemistry of organiccompounds. Nmr spectroscopy detects the nuclei of atoms in a molecule, and oneof the most useful forms of nmr is the detection of hydrogen atoms. The nucleusof a hydrogen atom is a single proton and so the method is also known as protonnmr. A proton spins around its axis, and whenever a charged body spins, amagnetic field is set up which can be represented by a magnetic dipole moment(Fig. 1a). Under normal conditions, the protons and their magnetic moments arerandomly orientated and so there is no overall magnetic field (Fig. 2a).
However, the situation changes if an external magnetic field is applied to thesample. In Fig. 1b and c an external magnetic field has been applied in the direc-tion of the z-axis. This field interacts with the magnetic moment of the nucleus,forcing the nucleus to spin in only two possible orientations. In Fig. 1b, the nucleusis spinning such that the magnetic moment is pointing in roughly the same
If an unsaturated group is present in a molecule, it is possible to getsecondary magnetic fields due to diamagnetic circulation. This is a result ofthe external magnetic field causing the π electrons to circulate around theaxis of the magnetic field. The effect is large for aromatic rings since six πelectrons are involved, and smaller for groups such as alkenes and ketones.For most unsaturated systems, the secondary magnetic field enhances theapplied magnetic field and increases chemical shift. The protons of aldehy-des and carboxylic acids experience secondary magnetic fields due to dia-magnetic circulation as well as electron withdrawing inductive effects,resulting in very large chemical shifts.
Spin-spin coupling takes place between protons on neighboring carbonatoms if the protons concerned have different chemical shifts. When theprotons on one carbon are in resonance, the protons on the neighboringcarbon are not and each neighboring proton can adopt two possibleorientations. These orientations affect the signal of the proton(s) that are inresonance, resulting in a splitting of the signal. The effect is transmittedthrough bonds rather than through space and decreases in magnitude withthe number of bonds involved, such that coupling does not usually takeplace beyond three bonds. The number of peaks resulting from splitting isone more than the number of neighboring protons. The size of the splittingis called the coupling constant and this is identical for both signals involvedin the coupling.
Integration measures the relative intensity of each signal in the nmr spectrumand is proportional to the number of protons responsible for that signal.
Related topics Properties of alkenes and alkynes(H2)
Preparation and properties (I2)Properties (J2)Structures and properties (K1)Preparation and physical properties
of alkyl halides (L1)
Properties of alcohols and phenols(M3)
Properties of ethers, epoxide andthioethers (N2)
Properties of amines (O2)Spectroscopy (P1)
Spin-spin coupling
P4 – Proton nuclear magnetic resonance spectroscopy 325
Integration
Diamagneticcirculation

direction as the field. The other orientation (Fig. 1c) has the nucleus spinning suchthe dipole moment is pointed roughly against the field. Crucially, these two ori-entations are not of equal energy. The orientation against the field is less stablethan the orientation with the field (Fig. 2b). This is crucial to understanding whywe get an nmr spectrum.
The energy difference between the two orientations is extremely small and sothe energy levels involved are almost equally populated. However, there is aslight excess of nuclei in the more stable energy level, and so if we were to pro-mote these nuclei to the higher energy level, energy would be absorbed and a
326 Section P – Organic spectroscopy and analysis
+
Z axis
Dipole moment
+
Z axis
+
Z axis
Magnetic field
(a) (b) (c)
+
+ + + + +
++++++
+++++
No appliedmagnetic field
‘Against’the field
‘With’the field
Appliedmagnetic field
Energy
(a) (b)
Fig. 1. Orientation of a proton’s magnetic dipole moment; A) No magnetic field B) Alignmentwith magnetic field C) Alignment against magnetic field.
Fig. 2. Energy levels before and after applying an external magnetic field.

spectrum could be measured. Before we look at what energy is required, we shallreturn to our picture of the spinning nucleus. Fig. 1b shows the nucleus spinningwith the field – the more stable orientation. Notice that the dipole moment is notdirectly aligned with the magnetic field, but is at an angle to it. This means thatthe dipole moment experiences a force or a torque, which causes it to rotate or pre-cess around the z-axis (Fig. 3a) like a gyroscope. A gyroscope is a spinning bodywhich, when set at an angle to the vertical axis of gravity, precesses round thatvertical axis. The nucleus is undergoing exactly the same kind of motion. It too isa spinning body but it precesses round the axis of an applied magnetic field. Therate at which the dipole moment precesses round the z-axis is called the Larmorfrequency and is dependant on the strength of the applied magnetic field. If themagnetic field increases, the rate of precession increases.
P4 – Proton nuclear magnetic resonance spectroscopy 327
+
Z axis
Dipolemoment
Larmorfrequencyυ
Magneticfield (Bo)
+
Z axis
Magneticfield (Bo)
Larmorfrequencyυ
Energy+
Z axis
υ = Larmorfrequency
Energy
Z axis
+
Z axis
Energy
(a) (b) (c) (d)
In order to get a spectrum we need to get transitions between the two energylevels. This can be achieved by firing in a burst of energy in the form of electro-magnetic radiation (Fig. 3b). The effect of this energy is to excite the nucleus andto cause it to ‘flip’ such that it is now against the magnetic field (Fig. 3c). Thisorientation is less stable than the original orientation and so the nucleus hasabsorbed energy. It is found that the energy required to do this has the samefrequency as the Larmor frequency. If the electromagnetic radiation is nowstopped, the nucleus relaxes back to the more stable orientation (Fig. 3d). As aresult, energy is emitted. Such energy can be detected and measured leading to asignal in an nmr spectrum. The energy difference between the two orientations isextremely small and is in the radiofrequency region of the electromagneticspectrum. The energy difference is proportional to the Larmor frequency, whichis proportional to the strength of the external applied magnetic field. In amagnetic field of 14 100G, the energy difference is 60 × 106 Hz or 60 MHz. In amagnetic field of 23 500G the energy difference is 100 MHz. NMR spectrometerswork at a specific magnetic field and thus a specific electromagnetic radiation isrequired for resonance. The convention is to identify the spectrometers and theirspectra by the strength of the electromagnetic radiation used (i.e. 60 MHz or100 MHz).
Fig. 3. Larmor frequency and energy transitions.

Secondary At this stage, we can see how a proton is detected by nmr spectroscopy, but if that magnetic fields was all there was to it we would only see one signal for every proton in a
molecule. This would tell us nothing about the structure apart from the fact thatprotons are present. Fortunately, not all protons require the same energy forresonance. This is because there are secondary magnetic fields within themolecule, which influence the magnetic field experienced by each proton.Secondary magnetic fields are produced by the electrons in the molecule and aremuch smaller in magnitude than the applied magnetic field – in the order of 0–10parts per million (ppm). However, they are sufficiently large enough to result indifferent signals for different protons. This means that there should be one signalfor every different (or non-equivalent) proton in the structure. Therefore, it isuseful to identify the number of non-equivalent protons in a molecule in order toidentify the number of signals that should be present in the spectrum. Note thatthe protons in a methyl group are equivalent and do not give separate signalsbecause they are in identical molecular environments. This is also true for theprotons in a CH2 group. (However, there are two situations where the two protonson a CH2 group become non equivalent, i.e. when they are constrained within aring system and when they are next to an asymmetric center.) The size anddirection of secondary magnetic fields depends on electron density, diamagneticcirculation and spin-spin coupling all of which are discussed below.
Secondary Fig. 3a shows an isolated proton spinning and precessing in an applied magnetic magnetic fields field. So far we have only considered the nucleus of the hydrogen atom, but we due to electrons know that electrons must be present. Let us consider the effect of one electron
orbiting the nucleus (Fig. 4). Since the electron is a spinning, charged body, it sets up a secondary magnetic
field of its own (Be, Fig. 4). The secondary magnetic field (Be) opposes the exter-nal magnetic field (Bo). Thus the nucleus is shielded from the external magneticfield. This means the actual magnetic field experienced by the nucleus is reduced(Bo–Be). Since the nucleus experiences a reduced magnetic field, the precessionalor Larmor frequency is reduced. This in turn means that less energy is required tomake that nucleus resonate and give a signal. The greater the electron densityround a proton, the greater the shielding and so the position of a signal in an nmrspectrum can be an indication of electron density in different parts of a molecule.
328 Section P – Organic spectroscopy and analysis
+
Z axis
Bo
Be
Externalmagnetic field
Electron
Fig. 4. Secondary magnetic field from an electron.

The nmr The signals at the right hand side of an nmr spectrum (Fig. 5) are due to protons spectrum having a low precessional frequency while the signals at the left-hand side are due
to protons having a high precessional frequency. Low precessional frequency isassociated with high electron density (shielding) while high precessionalfrequency is associated with low electron density (deshielding). The energyrequired for resonance increases from right to left.
P4 – Proton nuclear magnetic resonance spectroscopy 329
A scale is needed in order to quantify the position of signals in an nmr spec-trum. The scale used in nmr does not have absolute values, but is relative to thesignal of a reference compound called tetramethylsilane (TMS) (Fig. 6). Themethyl protons of TMS are equivalent and give one signal that is defined as thezero point on the scale. The scale is known as the chemical shift and is measuredin parts per million (ppm). What does this mean and why do we not use anabsolute scale, which uses frequency or energy units?
Let us look at what happens if we measure the chemical shift in frequency unitsof hertz. The scale shown in Fig. 5A is for a 60 MHz nmr spectrometer. The 60 MHzrefers to the frequency of the energy required to cause resonance. Thus, the signalat 3 ppm has a Larmor frequency which is 180 Hz faster than the signal due toTMS (180 Hz is 3 ppm of 60 MHz).
However, we could also measure this spectrum using a more powerful nmrspectrometer which results in the protons having precessional frequencies in the
10 9 8 7 6 5Chemical shift (ppm)
Highprecessional
frequency
Low electrondensity
Lowprecessional
frequency
High electrondensity
TMSreference
Chemical shift (Hz)
4 3 2 1 0
600 540 480 420 360 300 240 180 120 6 0
1000 900 800 700 600 500 400 300 200 100 0
A
B
Fig. 5. An nmr spectrum.
Si
CH3
CH3
CH3H3C
Fig. 6. Tetramethylsilane (TMS).

order of 100 MHz (Fig. 5b). In this situation, the signal at 3 ppm is due to a protonthat is precessing 300 Hz faster than the protons for TMS. If we measure the chem-ical shift of this peak in ppm, this would still be 3 ppm, since 300 Hz is 3 ppm of100 MHz. However, if we used a scale measured in Hertz, we would have todefine the power of the nmr spectrometer used. With chemical shift measured inparts per million, the chemical shift will be the same no matter which instrumentis used.
Inductive effects TMS is called an internal reference since it is dissolved in the deuterated solvent on chemical used to dissolve the sample. There is a good reason why TMS is used as an shift internal reference. Silicon has a tendency to ‘repel’ the electrons in the silicon-
carbon bonds such that they are pushed towards the methyl groups (Fig. 6) – aninductive effect. This means that the protons in these methyl groups experience ahigh electron density that shields the nuclei and results in a low chemical shift,lower in fact than the vast majority of nmr signals observed in organic molecules.
330 Section P – Organic spectroscopy and analysis
RO CH3 RO CH3 R C
O
CH3 R C
R
R
CH3 H3C Si
CH3
CH3
CH3R3N CH3
3.8 3.3 3.3 2.2 0.9 0.0
Stronglydeshielded
Stronglyshielded
+
Fig. 7. The inductive effect and chemical shift.
Inductive effects have an important influence on chemical shift. We can see thiswith a series of methyl groups (Fig. 7). Going from right to left we have TMSwhich sets the scale at 0 ppm. Next we have the methyl group of a saturatedhydrocarbon. The alkyl groups of a hydrocarbon also ‘push electrons’ away fromthem and hence increase electron density round a neighboring methyl group.However this inductive effect is not as powerful as the one caused by a siliconatom and so the methyl signals in hydrocarbons usually occur about 0.9 ppm.
In the next case we have a methyl group next to a ketone group. A ketone grouphas an electron withdrawing effect, which reduces the electron density around theneighboring methyl group (deshielding), and so the chemical shift is higher at
10 9 8 7 6 5 4 3 2 1 0
H3CC
O
CH3
Oba
a b
Fig. 8. Nmr spectrum of methyl ethanoate
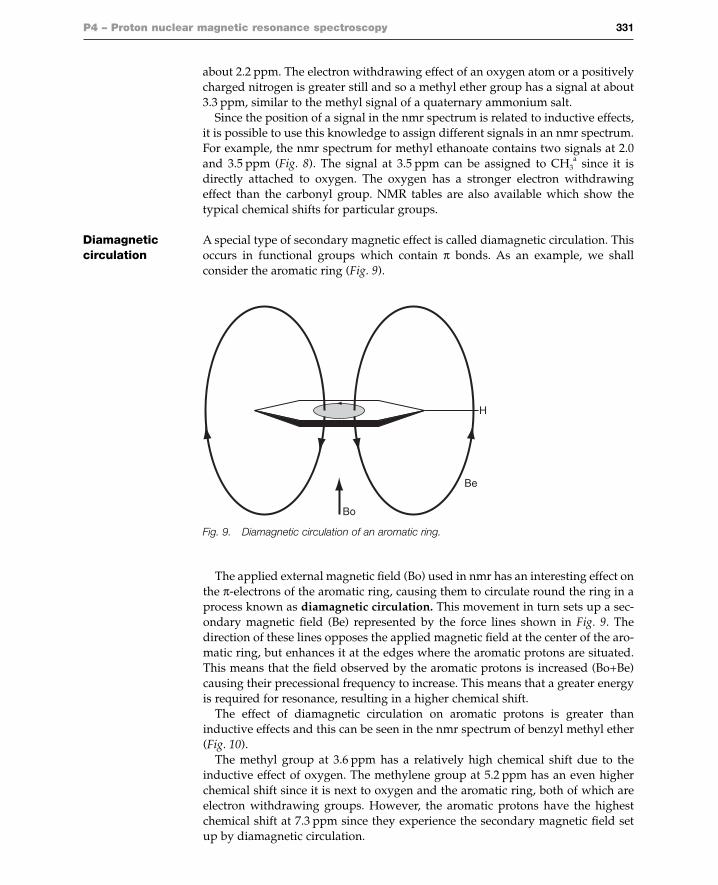
The applied external magnetic field (Bo) used in nmr has an interesting effect onthe π-electrons of the aromatic ring, causing them to circulate round the ring in aprocess known as diamagnetic circulation. This movement in turn sets up a sec-ondary magnetic field (Be) represented by the force lines shown in Fig. 9. Thedirection of these lines opposes the applied magnetic field at the center of the aro-matic ring, but enhances it at the edges where the aromatic protons are situated.This means that the field observed by the aromatic protons is increased (Bo+Be)causing their precessional frequency to increase. This means that a greater energyis required for resonance, resulting in a higher chemical shift.
The effect of diamagnetic circulation on aromatic protons is greater thaninductive effects and this can be seen in the nmr spectrum of benzyl methyl ether(Fig. 10).
The methyl group at 3.6 ppm has a relatively high chemical shift due to theinductive effect of oxygen. The methylene group at 5.2 ppm has an even higherchemical shift since it is next to oxygen and the aromatic ring, both of which areelectron withdrawing groups. However, the aromatic protons have the highestchemical shift at 7.3 ppm since they experience the secondary magnetic field setup by diamagnetic circulation.
P4 – Proton nuclear magnetic resonance spectroscopy 331
H
Be
Bo
Fig. 9. Diamagnetic circulation of an aromatic ring.
about 2.2 ppm. The electron withdrawing effect of an oxygen atom or a positivelycharged nitrogen is greater still and so a methyl ether group has a signal at about3.3 ppm, similar to the methyl signal of a quaternary ammonium salt.
Since the position of a signal in the nmr spectrum is related to inductive effects,it is possible to use this knowledge to assign different signals in an nmr spectrum.For example, the nmr spectrum for methyl ethanoate contains two signals at 2.0and 3.5 ppm (Fig. 8). The signal at 3.5 ppm can be assigned to CH3
a since it isdirectly attached to oxygen. The oxygen has a stronger electron withdrawingeffect than the carbonyl group. NMR tables are also available which show thetypical chemical shifts for particular groups.
Diamagnetic A special type of secondary magnetic effect is called diamagnetic circulation. This circulation occurs in functional groups which contain π bonds. As an example, we shall
consider the aromatic ring (Fig. 9).

Diamagnetic circulation is also possible for other unsaturated systems such asalkenes. However, the diamagnetic circulation for an alkene is much smaller sinceonly two π electrons are circulating within a double bond, and so the effect issmaller. This can be seen in the nmr spectrum of 1,1-diphenylethene where thealkene protons have a smaller chemical shift at 5.2 ppm compared to the aromaticprotons at 7.3 ppm (Fig. 11).
An aldehyde proton also experiences a secondary magnetic field due to dia-magnetic circulation, but in addition there is an inductive effect resulting from theelectron withdrawing effect of the carbonyl group. Thus, an aldehyde protonexperiences two deshielding effects, which means that it has a higher chemicalshift than even an aromatic ring. Typically, the signal appears about 9.6 ppm.
The combined influences of diamagnetic circulation and inductive effects alsoresult in high chemical shifts for the OH of a carboxylic acid where the signal canhave a chemical shift larger than 10 ppm.
For most unsaturated systems, diamagnetic circulation sets up a secondary fieldwhich enhances the applied magnetic field. The exception is alkynes where thesecondary field opposes the applied field and causes shielding.
332 Section P – Organic spectroscopy and analysis
Fig. 10. Nmr spectrum of benzyl methyl ether.
10 9 8 7 6 5 4 3 2 1 0
CH2 CH3
CH2
H
H
HH
H CH3
O
Ar-H
10 9 8 7 6 5 4 3 2 1 0
C
H
H
HH
H H
C
H
H
HH
H H
Fig. 11. NMR spectrum of 1,1-diphenylethene.
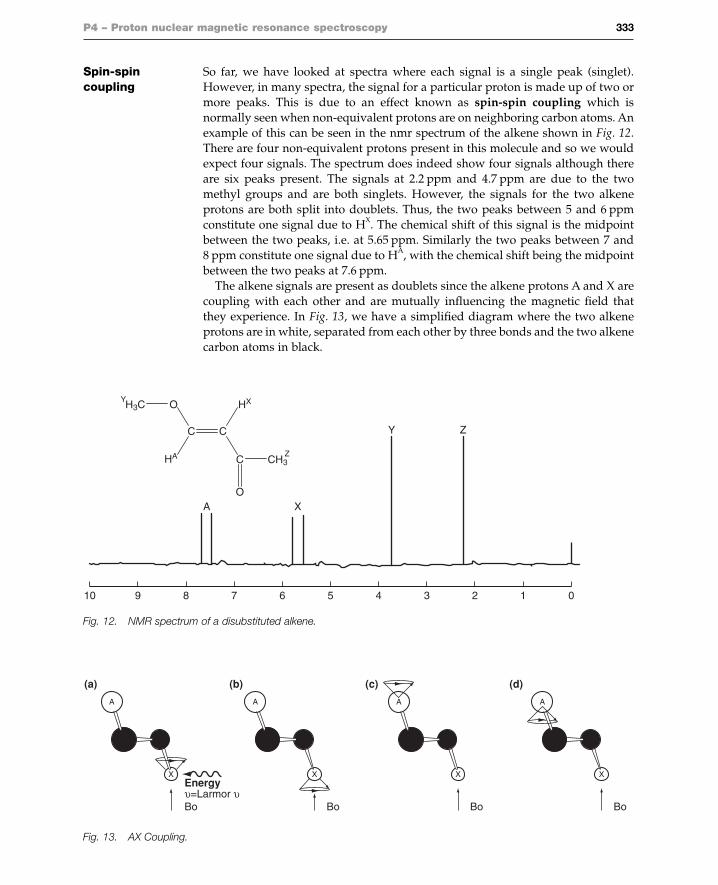
Spin-spin So far, we have looked at spectra where each signal is a single peak (singlet). coupling However, in many spectra, the signal for a particular proton is made up of two or
more peaks. This is due to an effect known as spin-spin coupling which isnormally seen when non-equivalent protons are on neighboring carbon atoms. Anexample of this can be seen in the nmr spectrum of the alkene shown in Fig. 12.There are four non-equivalent protons present in this molecule and so we wouldexpect four signals. The spectrum does indeed show four signals although thereare six peaks present. The signals at 2.2 ppm and 4.7 ppm are due to the twomethyl groups and are both singlets. However, the signals for the two alkeneprotons are both split into doublets. Thus, the two peaks between 5 and 6 ppmconstitute one signal due to HX. The chemical shift of this signal is the midpointbetween the two peaks, i.e. at 5.65 ppm. Similarly the two peaks between 7 and8 ppm constitute one signal due to HA, with the chemical shift being the midpointbetween the two peaks at 7.6 ppm.
The alkene signals are present as doublets since the alkene protons A and X arecoupling with each other and are mutually influencing the magnetic field thatthey experience. In Fig. 13, we have a simplified diagram where the two alkeneprotons are in white, separated from each other by three bonds and the two alkenecarbon atoms in black.
P4 – Proton nuclear magnetic resonance spectroscopy 333
Fig. 12. NMR spectrum of a disubstituted alkene.
10 9 8 7
A X
6 5 4 3 2 1 0
C
HA
C
C CH3Z
Y
O
OH3C HX
Y Z
A
X
υ=Larmor υBo
Energy
Bo
A
X
Bo
A
X
Bo
A
X
(a) (b) (c) (d)
Fig. 13. AX Coupling.

Let us concentrate on proton X in Fig.13a. An external magnetic field Bo forcesthis proton to adopt two possible orientations with the more stable orientationshown in Fig. 13a. Energy having the same frequency as the Larmor frequency isnow applied resulting in resonance and a signal in the nmr spectrum.
So much for proton X, but what is happening to proton A while all this is hap-pening? Applying a magnetic field also forces this proton to adopt two possibleorientations (Figs. 13c and d). However, the precessional frequency for proton A isdifferent from that of proton X since proton A is in a different environment. There-fore, applying energy which has the correct frequency to make proton X resonatewill have no such effect on proton A. This means that the two possible orientationsfor proton A are long lived, and resonance does not take place between them. Thedipole moments associated with these orientations can thus generate a smallmagnetic field that will influence X. So essentially proton A can be viewed as asmall magnet which has two different orientations. The two different magneticfields generated by A are experienced by proton X but it is important to realizethat the effect is not transmitted through space. The nuclei are too far apart fromeach other for that to happen. Instead the effect is transmitted through the threebonds between the two protons. A full explanation of how this happens is notpossible here but the overall effect is that proton A generates two equal but oppos-ing secondary magnetic fields at proton X. The same thing happens in reversewhen energy is applied to resonate proton A. In that situation, proton X does notresonate but has two equal and opposite secondary magnetic effects on A.
Let us look at what happens to the signal for proton A when this coupling takesplace (Fig. 14). If coupling did not place, the signal would be a singlet. Howeverwith coupling, A experiences two different secondary magnetic fields from X andis split into two peaks.
334 Section P – Organic spectroscopy and analysis
8 7 6 5
JXAJAX
HA HX
Neighbouringprotons
Fig. 14. Spin spin coupling.

The peak at higher chemical shift occurs when the secondary field generated byproton X is aligned with the applied field. The peak at lower chemical shift occurswhen the secondary field is against the applied field. Since both effects are equallylikely and of the same magnitude the signal for A is split into a doublet where thepeaks are of equal height and equally shifted from the original chemical shift. Theseparation between the peaks can be measured and is called the coupling con-stant. It is given the symbol J and is measured in hertz rather than ppm. The cou-pling is further specified by defining the coupled protons. Thus, JAX is the couplingconstant between proton A and proton X.
If we look now at the signal for X, the same thing happens except the secondarymagnetic fields are now due to the different orientations of proton A. The cou-pling constant for this signal is JXA and must be equal in magnitude to JAX (Fig. 15).
P4 – Proton nuclear magnetic resonance spectroscopy 335
10 9 8 7
Chem shift Chem shift
6 5 4 3 2 1 0
C
HA
C
C CH3
O
OH3C HX
JXAJAX
Let us now look at a more complicated situation where we have a methyl grouplinked to a methine group (see 1,1-dichloroethane; Fig. 16). In this situation, wehave three identical methyl protons (X) separated by three bonds from one CHproton (A). The spectrum shows two signals. The signal for the methyl protons isa doublet at 1.55 ppm, while the signal for the methine proton is a quartet at5.05 ppm.
We look first of all at the effect the methine proton has on the three equivalentmethyl protons. The methine proton can have two possible orientations – eitherwith the field or against it. The secondary magnetic field associated with theseorientations is transmitted to the methyl protons through the connecting bonds,which means that the methyl protons are influenced by two equal but opposingsecondary magnetic fields. The signal for the methyl protons is split into adoublet.
Let us now consider the influence of the methyl protons on the methine proton.There are several possibilities here. The methyl protons could all be opposed tothe applied field or they could all be aligned with the field. Another possibility isfor two of the protons to be with the field while one is against the field. Note thatthis sort of arrangement is three times more likely than having all the protons
Fig. 15. Coupling constants.

pointing the same way. Finally, two of the protons could be against the field andone could be with the field. Once again the possibility of this kind of arrangementis three times more likely than having all the nuclei pointing the same way. Sincethere are four different ways of orientating the three methyl protons, the signal forthe methine proton is split into four different peaks (a quartet). These peaks willnot be of equal intensity as there is more chance of certain orientations than oth-ers. The relative intensities match the statistical probability of the different orien-tations, i.e. 1 : 3 : 3 : 1.
336 Section P – Organic spectroscopy and analysis
10 9 8 7 6 5 4 3 2 1 0
C
CICI
C
Ha
HXHX
HX
JXAJAX
JAX JAX
Fig. 16. NMR Spectrum of 1,1-dichloroethane.
We can predict the number of peaks in the methine signal (A) and their relativeintensity in the following manner (Fig. 17). If no coupling took place, the signalwould be a singlet. However, there are three neighboring protons due to themethyl group. We shall see what happens when we split the methine signal witheach of these methyl protons in turn. Coupling with one of the methyl protonssplits the signal into a doublet of intensity 1 : 1. Splitting with a second methyl pro-ton splits each of these peaks into a doublet. Since the splitting is identical, the twoinner peaks of each doublet overlap to give a single peak such that we end up witha triplet having an intensity of 1 : 2 : 1. Each of these peaks is now split by the effectof the third methyl proton to give a quartet of ratio 1 : 3 : 3 : 1. The peak at highestchemical shift corresponds to the arrangement where the secondary magneticfield of all three methyl protons is with the applied field and enhancing it. Thepeak at the next highest chemical shift corresponds to the situation where two ofthe methyl protons are with the applied field and the third is against it. The nextpeak has two protons against the applied field and one proton with it. Finally wehave the peak at the lowest chemical shift, which corresponds to the situationwhere the magnetic fields of all three methyl protons oppose the applied field.Note that the chemical shift for the signal is the same as it would have been if nosplitting had occurred (i.e. the middle of the signal). The coupling constants JAX
and JXA are identical for both signals since they are coupled together. It is possible to rationalize the coupling patterns and peak intensities for other
coupling systems in a similar manner, but a quicker method is to use a systemknown as Pascall’s triangle (Fig. 18). To use the triangle, you first identify thenumber of protons that are neighboring the group of interest. This defines whichrow of the triangle is relevant. The row indicates the number of peaks one wouldexpect in the signal and their relative intensity. Consider for example 1,1-dichloroethane (Fig. 16). The methine group has a neighboring methyl group and

so there are three neighboring protons. The relevant row in Pascall’s triangle hasfour entries and so the signal for the methine proton is a quartet with a ratio of1 : 3 : 3 : 1. When we consider the methyl group, it has one neighboring proton andso Pascall’s triangle predicts a doublet of ratio 1 : 1.
Note that the number of peaks in a signal is always one more than the numberof neighboring protons.
It is important to note that coupling can only take place between non-equiva-lent protons of different chemical shifts. Coupling between the protons making upa methyl group is not possible since they are equivalent to each other. Similarly,coupling is not possible between the methyl groups of ethane since these groupscannot be distinguished from each other. It is also important to remember that thecoupling is transmitted through bonds and that the size of this coupling decreaseswith the number of bonds involved. In fact, coupling is rarely seen between pro-tons which are separated from each other by more than three bonds. In effect, this
P4 – Proton nuclear magnetic resonance spectroscopy 337
Split by HX
Split by HX Split by HA
Split by HX
Neighbouringprotons
HA CH3X
JXAJAX
Fig. 17. Splitting pattern for CH–CH3.
111
233
61010
20
0123456
11
45
15
11
6 1
11
45
15
11
61
Number ofneighboring protons
Fig. 18. Pascall’s Triangle.

means that most coupling takes place between non-equivalent protons on neigh-boring carbon atoms.
Integration An nmr spectrum contains another piece of useful information which is calledintegration. Integration measures the intensity of each signal and is proportionalto the number of protons responsible for that signal. Thus, a signal due to a methylgroup will be three times more intense than one due to a methine (CH) group.
The integration signal on the nmr spectrum is the sloping line above the signals(Fig. 19). There is no absolute scale to this line, but the relative heights of the inte-gration over each signal are proportional to the number of protons responsible foreach signal. Note that it is the height increase over the whole signal that shouldbe measured (i.e. you measure the height increase over all the peaks in thecoupling pattern).
Another thing to watch out for is the possibility of OH or NH2 groups beingpresent in a spectrum. These will also be integrated, but can be distinguished fromCH, CH2 and CH3 groups since the protons in the former disappear from thespectrum if the sample is shaken with D2O.
338 Section P – Organic spectroscopy and analysis
Integration(measures area
under each signal)
6.0 5.0 4.0 3.0 2.0 1.0
Fig. 19. Integration.
Section P – Organic spectroscopy and analysis
P5 13C NUCLEAR MAGNETIC RESONANCESPECTROSCOPY
Key Notes
13C nmr spectroscopy is a valuable tool in structural analysis. The 13Cnucleus is only 1.1% naturally abundant and so signals are weaker thanthose present in 1H nmr spectra.
No coupling is seen between 13C nuclei since the chances of neighboringcarbons both being 13C are negligible.
Coupling is possible between 13C and 1H nuclei. However, proton decou-pling is usually carried out by continually resonating all the protons whilethe 13C spectrum is run. This leads to one singlet for each non-equivalentcarbon. Integration of signals is not possible since this process distortssignal intensities.
13C nmr spectra contain singlets over a wider range of chemical shifts than1H nmr meaning that there is less chance of signals overlapping. Directinformation is obtained about the carbon skeleton of a molecule includingquaternary carbons. The number of protons attached to each carbon atomcan be determined by off resonance decoupling or by running DEPTspectra.
The number of signals indicates the number of non-equivalent carbons. Thenumber of protons attached to carbon is determined by methods such asDEPT. The chemical shifts are compared to theoretical chemical shiftsdetermined from nmr tables or software packages.
Related topics Properties of alkenes and alkynes(H2)
Preparation and properties (I2)Properties (J2)Structures and properties (K1)Properties of alcohols and phenols
(M3)
Properties of ethers, epoxides, andthioethers (N2)
Properties of amines (O2)Chemistry of nitriles (O4)Spectroscopy (P1)Proton nuclear magnetic resonance
spectroscopy (P4)
Introduction
Advantages of13C NMR
Coupling between13C and 1H nuclei
Coupling between13C nuclei
Introduction 1H NMR spectroscopy is not the only useful form of nmr spectroscopy. There area large variety of other isotopes which can be used (e.g. 32P, 19F, 2D). However, themost frequently studied isotope apart from 1H is the 13C nucleus. Like protons, 13Cnuclei have a spin quantum number of 1/2. Thus, the same principles whichapply to proton nmr also apply to 13C nmr. However, whereas the 1H nucleus isthe naturally abundant isotope of hydrogen, the 13C nucleus is only 1.1% naturally
Interpreting13C spectra

abundant. This means that the signals for a 13C nmr spectrum are much weakerthan those for a 1H spectrum. In the past, this was a problem since early nmrspectrometers measured the absorption of energy as each nucleus in turn cameinto resonance. This was a lengthy process and although it was acceptable for 1Hnuclei, it meant that it was an extremely lengthy process for 13C nuclei sinceseveral thousand scans were necessary in order to detect the signals above thebackground noise. Fortunately, that problem has now been overcome. Modernnmr spectrometers are much faster since all the nuclei are excited simultaneouslywith a pulse of energy. The nuclei are then allowed to relax back to their groundstate, emitting energy as they do so. This energy can be measured and a spectrumproduced. Consequently, 13C nmr spectra are now run routinely. At this point, youmay ask whether a 13C nmr spectrum also contains signals for 1H nuclei? Theanswer is that totally different energies are required to resonate the nuclei ofdifferent atoms. Therefore, there is no chance of seeing the resonance of an 1Hnucleus and a 13C nucleus within the limited range covered in a typical 1H or 13Cspectrum.
Coupling Unlike 1H nmr where spin spin coupling is observed between different protons, between 13C coupling between different carbon nuclei is not observed in 13C NMR. This is due nuclei to the low natural abundance of 13C nuclei. There is only 1.1% chance of any
specific carbon in a molecule being present as the 13C isotope. For most medium-sized molecules encountered by organic chemists, this effectively means that therewill only be one 13C isotope present in a molecule. The chances of having two 13Cisotopes in the same molecule are extremely small, and the chances of two 13Cisotopes being on neighboring carbons are even smaller, so much so that they arenegligible.
Coupling Although 13C–13C coupling is not seen, it is possible to see coupling between 13C between 13C nuclei and 1H nuclei. This might appear strange since we have already stated that and 1H nuclei 1H signals are not observed in the 13C spectrum. However, it is perfectly logical to
see coupling between 13C and 1H nuclei even if we don’t see the 1H signals. This isbecause the 1H nuclei will still take up two possible orientations in the appliedmagnetic field, each of which produce their own secondary magnetic field (seeTopic P4). In practice, such coupling makes the interpretation of 13C nmr spectradifficult and so 13C spectra are usually run with 13C–1H coupling eliminated. Thisis done by continuously resonating all the proton nuclei while the 13C spectrum isbeing run such that the signal for each non-equivalent carbon atom appears as asinglet. This results in a very simple spectrum that immediately allows you toidentify the number of non-equivalent carbon atoms in the molecule from thenumber of signals present. This process is known as proton decoupling. Onedisadvantage of this technique is that it distorts the intensity of signals and sointegration cannot be used to determine the number of carbon atoms responsiblefor each signal. This distortion is particularly marked for signals due toquaternary carbons, which are much weaker than signals for other types ofcarbons.
Advantages of 13C nmr gives a signal for each non equivalent carbon atom in a molecule and this 13C NMR gives direct information about the carbon skeleton. In contrast, 1H nmr provides
information about the carbon skeleton indirectly and gives no information aboutquaternary carbon atoms such as carbonyl carbons. Another advantage of 13C
340 Section P – Organic spectroscopy and analysis

NMR is the wide range of chemical shifts. The signals are spread over 200 ppmcompared to 10 ppm for protons. This means that signals are less likely to overlap.Moreover, each signal is a singlet. This can also be a disadvantage sinceinformation about neighboring groups is lost. However, there are techniques thatcan be used to address this problem. For example, information about the numberof protons attached to each carbon atom can be obtained by off resonancedecoupling. In this technique, the 13C spectrum is run such that all the protons aredecoupled except those directly attached to the carbon nuclei. Hence, the methylcarbons (CH3) appear as a quartet, the methylene carbons (CH2) appear as atriplet, the methine carbons (CH) appear as a doublet and the quaternary carbons(C) still appear as a singlet.
In practice, off resonance decoupling is rarely used nowadays, since a techniqueknown as DEPT is more convenient and easier to analyze. Unfortunately, it is notpossible to cover the theory behind this technique here. However, a knowledge ofthe theory is not necessary in order to interpret DEPT spectra. Such spectra can berun so that only one type of carbon is detected. In other words, a DEPT spectrumcan be run so that only the methyl signals are detected or the methylene signals,etc. This allows us to distinguish all four types of carbon, but it means that wehave to run four different spectra. There is a quicker way of getting the same infor-mation by only running two spectra. A DEPT spectrum can be run such that itpicks up the methyl and methine carbons as positive signals and the methylenecarbons as negative signals (i.e. the signals go down from the baseline instead ofup). The quaternary carbons are not seen. This one spectrum therefore allows youto identify the quaternary signals by their absence and the methylene signals,which are negative. We still have to distinguish between the methyl signals andthe methine signals, but this can be done by running one more DEPT spectrumsuch that it only picks up the methine carbons.
Interpreting In general, 13C spectra of known structures can be interpreted in the following 13C spectra stages. First, the number of non-equivalent carbon atoms is counted by counting
the number of signals present in the spectrum, excluding those signals due to theinternal reference (TMS at 0 ppm) or the solvent. The signal for CDCl3 is a triplet(1 : 1 : 1) at 77 ppm (caused by coupling to the deuterium atom where I=1).
Second, each signal is identified as CH3, CH2, CH or quaternary using offresonance decoupling or DEPT spectra.
Third, the chemical shifts of the signals are measured, then compared with thetheoretical chemical shifts for the carbons present in the molecule. There are avariety of tables and equations which can help in this analysis but it should benoted that the use of such tables is not as straightforward as for 1H nmr analysis.However, software packages are now available which can calculate the theoreticalchemical shifts for organic structures. These are often incorporated into chemicaldrawing packages such as ChemDraw.
P5 – 13C nuclear magnetic resonance spectroscopy 341

Section P – Organic spectroscopy and analysis
P6 MASS SPECTROSCOPY
Key Notes
A mass spectrum is obtained by ionizing a molecule to give a molecular ion.This is then accelerated through a magnetic field and the ion is deviatedaccording to its mass and charge. Routinely, ionization is carried out byelectron ionization, but chemical ionization and fast atom bombardment aremilder methods. Detecting the molecular ion allows identification of themolecular weight. If this is an odd number it indicates that an odd numberof nitrogen atoms are present.
The pattern of peaks present for a molecular ion can reveal the presence ofchlorine or bromine since there are two naturally occurring isotopes forthese elements. Carbon also has two naturally occurring isotopes (12C and13C) and so a small peak is often observed one mass unit higher than themolecular ion.
The molecular ion is unstable and fragments, producing daughter ions. Thefragmentation patterns that take place are indicative of functional groups inthe molecule. Daughter ions vary in stability and the more stable ones givestronger peaks. The most intense peak in the spectrum is called the basepeak.
The molecular ion and base peak are identified first. Daughter ions are thenidentified and fragmentation patterns determined.
High-resolution mass spectroscopy is used to measure the mass of amolecular ion to four decimal places. This allows the determination of themolecular formula.
Related topics Preparation and properties (I2)Properties (J2)Structure and properties (K1)Preparation and physical properties
of alkyl halides (L1)
Properties of alcohols and phenols(M3)
Spectroscopy (P1)
Introduction
Fragmentationpatterns and
daughter ions
Analysis of a massspectrum
High-resolutionmass spectroscopy
Isotopic ratios
Introduction Mass spectroscopy is useful in the analysis of an organic compound since it canprovide information about the molecular weight, the presence of specific elements(e.g. nitrogen, chlorine or bromine) and the presence of specific functional groups.Put at its simplest, a mass spectrum measures the mass of ions, but to be moreprecise, it is a measure of the mass/charge ratio (m/e). However, the vast majorityof ions detected are singly charged (e=1). In order to obtain a mass spectrum, themolecules of the test compound have to be ionized under reduced pressure. There

are several ways in which this can be carried out, but the most common methodis known as electron ionization (EI).
Electron ionization involves bombarding the test molecule with high-energyelectrons such that the molecule loses an electron and ionizes to give a radicalcation called a molecular ion (also called the parent ion). This molecular ion isthen accelerated through a magnetic field towards a detector. The magnetic fieldcauses the ion to deviate from a straight path and the extent of deviation is relatedto mass and charge (i.e. the lighter the ion the greater the deviation). Assuming acharge of 1, the deviation will then be a measure of the mass. The mass can thenbe measured to give the molecular weight.
The mass of a molecular ion must be even unless the molecule contains an oddnumber of nitrogen atoms. This is because nitrogen is the only ‘organic’ elementwith an even mass number and an odd valency. Therefore, an odd numbered massfor a molecular ion is an indication of the presence of at least one nitrogen atom.
Sometimes, the molecular ion is not observed in the spectrum. This is becauseelectron ionization requires compounds to be vaporized at high temperature andthe molecular ion may fragment before it can be detected. In cases like this, it isnecessary to carry out the ionization under milder conditions such that the mole-cular ion is less likely to fragment (i.e. by chemical ionization or by fast atombombardment). You may ask why these milder conditions are not used routinely.The reason is that fragmentation can give useful information about the structureof the molecule (see below).
The molecular ion peak is usually strong for aromatic amines, nitriles, fluoridesand chlorides. Aromatic and heteroaromatic hydrocarbons will also give intensepeaks if there are no alkyl side chains present greater than a methyl group. How-ever, the peaks for molecular ions can be absent for long chain hydrocarbons,highly branched molecules, and alcohols.
Isotopic ratios The pattern of peaks observed for a molecular ion often indicates the presence ofparticular halogens such as chlorine or bromine. This is because each of theseelements has a significant proportion of two naturally occurring isotopes. Sincethe position of the peaks in the mass spectrum depends on the mass of eachindividual molecular ion, molecules containing different isotopes will appear atdifferent positions on the spectrum. Chlorine occurs naturally as two isotopes(35Cl and 37Cl ) in the ratio 3 : 1. This means that the spectrum of a compoundcontaining a chlorine atom will have two peaks for the molecular ion. The twopeaks will be two mass units apart with a ratio of 3 : 1. For example ethyl chloridewill have two peaks for C2H5
35Cl and C2H537Cl at m/e 64 and 66 in a ratio of 3 : 1.
The naturally abundant isotope for carbon is 12C. However, the 13C isotope isalso present at a level of 1.1%. This can result in a peak one mass unit above themolecular ion. For methane, the relative ratios of the peaks due to 12CH4 and 13CH4
is 98.9 : 1.1, and so the peak for 13CH4 is very small. However, as the number of car-bon atoms increase in a molecule, there is a greater chance of a molecule contain-ing a 13C isotope. For example, the mass spectrum for morphine shows a peak atm/e 308 and a smaller peak at m/e 309 which is about a fifth as intense. The peakat m/e 308 is due to morphine containing carbon atoms of isotope 12. The peak at309 is due to morphine where one of the carbon atoms is 13C (i.e. 13C12C16H18NO3).The intensity of the peak can be rationalized as follows. The natural abundance of13C is 1.1%. In morphine there are 17 carbon atoms and so this increases thechances of a 13C isotope being present by a factor of 17. Hence, the peak at 309 isapproximately 18% the intensity of the molecular ion at 308.
P6 – Mass spectroscopy 343
Fragmentation The molecular ion is not the only ion detected in a mass spectrum. The molecular patterns and ion is a high-energy species, which fragments to give daughter ions that are also daughter ions detected in the spectrum. At first sight, fragmentation may seem to be a random
process, but fragmentation patterns are often characteristic of certain functionalgroups and demonstrate the presence of those groups.
Due to fragmentation, a mass spectrum contains a large number of peaks ofvarying intensities. The most intense of these peaks is known as the base peak andis usually due to a relatively stable fragmentation ion rather than the molecularion. Examples of stable ions are the tertiary carbonium (R3C
+), allylic (=C-CR2+),
benzylic (Ar-CR2+), aromatic (Ar+), oxonium (R2O
+) and immonium (R3N+) ions.
It is not possible to explain every peak observed in a mass spectrum and onlythe more intense ones or those of high mass should be analyzed. These will be dueto relatively stable daughter ions. Alternatively, a fragmentation may result in astable radical. The radical being neutral is not observed, but the other half of thefragmentation will result in a cation which is observed.
Many fragmentations give a series of daughter ions that are indicative of aparticular functional group. In other words, the molecular ion fragments to adaughter ion, which in turn fragments to another daughter ion and so on.
The intensity of a peak may sometimes indicate a favored fragmentation route.However, care has to be taken since intense peaks can arise due to different frag-mentation routes leading to the same ion, or be due to different fragmentationions of the same m/e value.
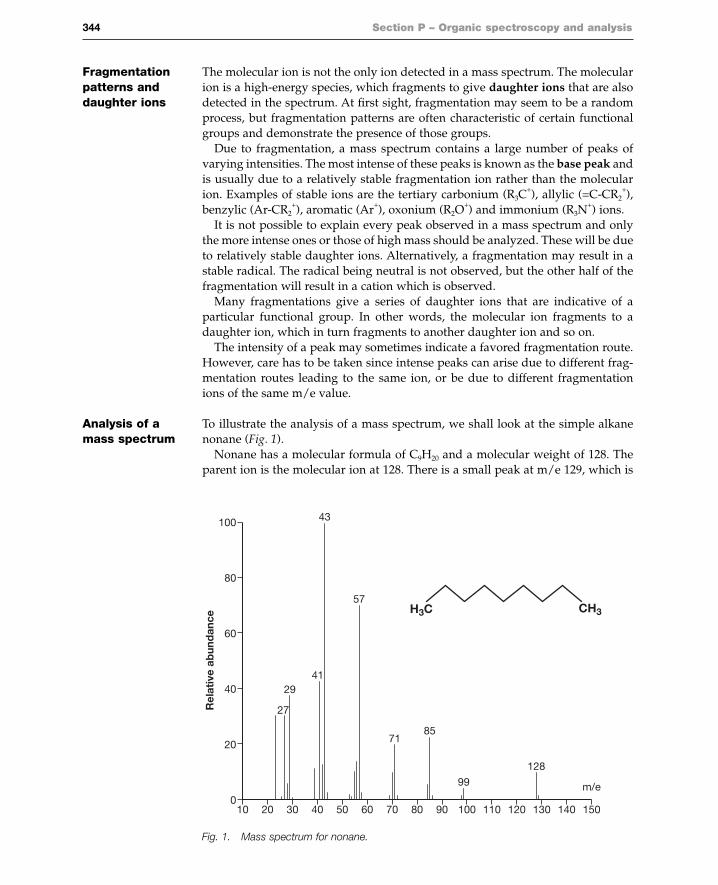
Analysis of a To illustrate the analysis of a mass spectrum, we shall look at the simple alkane mass spectrum nonane (Fig. 1).
Nonane has a molecular formula of C9H20 and a molecular weight of 128. Theparent ion is the molecular ion at 128. There is a small peak at m/e 129, which is
344 Section P – Organic spectroscopy and analysis
10 20
27
2941
57
7185
99
128
m/e
43
30 40 50 60 70 80 90 100 110 120 130 140 150
100
80
60
40
20
0
Rel
ativ
e ab
und
ance
CH3H3C
Fig. 1. Mass spectrum for nonane.

due to a molecule of nonane containing one 13C isotope (i.e. 12C813CH20). The nat-
ural abundance of 13C is 1.1%. Therefore the chances of a 13C isotope being presentin nonane are 9 × 1.1% = 9.9%.
The base peak is at m/e 43. This is most likely a propyl ion [C3H7]+. There are
peaks at m/e 29, 43, 57, 71, 85 and 99. These peaks are all 14 mass units apartwhich corresponds to a CH2 group. The presence of a straight chain alkane is oftenindicated by peaks which are 14 mass units apart (Fig. 2).
P6 – Mass spectroscopy 345
43 71 99
295785
CH3H3C
The characteristic peaks for a straight chain alkane are 14 mass units apart, butthis does not mean that the chain is being ‘pruned’ one methylene unit at a time.Decomposition of carbocations occurs with the loss of neutral molecules such asmethane, ethene and propene, and not by the loss of individual methylene units.For example, the daughter ion at m/e 99 can fragment with loss of propene to givethe ion at m/e 57. The daughter ion at m/e 85 can fragment with loss of ethene orpropene to give the ions at m/e 57 and m/e 43 respectively. The daughter ion atm/e 71 can fragment with loss of ethene to give the ion at m/e 43.
There are significant peaks at m/e 27 and m/e 41. These peaks result fromdehydrogenation of the ions at m/e 29 and m/e 43 respectively. The peak at m/e41 can also arise from the ion at m/e 57 by loss of methane.
The most intense peaks in the mass spectrum are at m/e 43 and m/e 57. Theions responsible for these peaks [C3H7]
+ and [C4H9]+ can arise from primary frag-
mentations of the molecular ion itself, as well as from secondary fragmentationsof daughter ions (m/e 99 to m/e 57; m/e 85 to m/e 43; m/e 71 to m/e 43).
In mass spectroscopy, the ions responsible for particular peaks are enclosed insquare brackets. This is because it is not really possible to specify the exact struc-ture of an ion or the exact location of the charge. The ionization conditions used inmass spectroscopy are such that fragmentation ions can easily rearrange to formstructures more capable of stabilizing the positive charge. For example, the frag-mentation ion at m/e 57 arising from primary fragmentation is a primary carbo-cation, but this can rearrange to the more stable tertiary carbocation (Fig. 3).
High-resolution The molecular weight is measured by mass spectroscopy and is usually measured mass as a whole number with no decimal places. However, it is possible to measure the spectroscopy molecular weight more accurately (high resolution mass spectroscopy) to four
Fig. 2. Fragmentations for nonane (Fragmentations are indicated by the dotted lines. Thesolid line at the end of each dotted line points to the part of the molecule which provides theion observed in the spectrum.).
H3CH3C
CH3 CH3CH3
CH3
57
Rearrangement+
+
Fig. 3. Rearrangement of a primary carbocation to a tertiary carbocation.

decimal places and establish the molecular formula. Consider the molecules CO,N2, CH2N and C2H4. All of these molecules have the same molecular weight of 28and in a normal mass spectrum would produce a molecular ion of that value. In ahigh-resolution mass spectrum, the molecular ion is measured to four decimalplaces and so we have to consider the accurate atomic masses of the componentatoms. The accurate mass values for the ions are as follows:
CO+ = 12C16O+ Accurate mass = 12.0000 + 15.9949 = 27.9949N2
+ = 14N2+ Accurate mass = 28.0061
CH2N+ = 12C1H2
14N+ Accurate mass = 12.0000 + 2.0156 + 14.0031 = 28.0187C2H4
+ = 12C21H4
+ Accurate mass = 24.0000 + 4.0313 = 28.0313
If the measured mass of the molecular ion is 28.0076, this would be in line withthe theoretical accurate mass for nitrogen (i.e. 28.0062). Note that the peak beingmeasured in the mass spectrum is for the molecular ion. This ion contains themost abundant isotope of all the elements present. For example, the molecular ionfor carbon monoxide is made up of 12C and 16O only. There are no molecules pre-sent containing 13C or 17O since these would occur at a higher position in the massspectrum. Therefore, the theoretical values for the molecular weight are calculatedusing the atomic weights for specific isotopes and not the accurate atomic weightsof the elements as they occur in nature. The latter (relative atomic weights) takethe relative abundances of the different isotopes into account and will be differentin value. For example, the accurate atomic weight of the carbon isotope 12C is12.0000 and this is the value used for calculating the accurate mass of a molecularion. The accurate relative atomic weight of carbon is higher at 12.011 due to thepresence of the isotope 13C.
346 Section P – Organic spectroscopy and analysis