section iv – stream stability assessment
TRANSCRIPT

EAST PLUM CREEK WATERSHED MASTER PLAN PRELIMINARY DESIGN REPORT
19
Section IV – Stream Stability Assessment


EAST PLUM CREEK WATERSHED MASTER PLAN PRELIMINARY DESIGN REPORT
20
IV. Stream Stability Assessment
Stream Stability Methodology
General Concepts
Natural channels, such as East Plum Creek, consist of a natural movable channel bed that will transition over time through meanders of the low flow channel, deposition of point bars, and infrequent straightening from larger flood events. A natural flowing stream that transports sediment is usually in equilibrium, with no long term trend towards aggregation or degradation (USBR 1987). This equilibrium condition implies that the sediment transport rate into a channel reach is the same sediment transport rate out of the channel reach.
Changes to the contributing watershed or the channel itself can impact the sediment transport capability of the stream. For developing areas, urbanization in the surrounding watershed can cause an increase in peak runoff, changes in channel slopes or in sediment load (USDCM 2006). These changes cause a state of influx from the natural, stable characteristics of the stream.
Reducing the sediment load in a stream can alter it from a stable channel to one that causes degradation until it reestablishes equilibrium. The reduction in sediment load can create conditions that are conducive to channel instability, such as, widening of the channel banks (erosion), deepening of the channel bottom (degradation) and changes in channel gradient.
Increases in sediment load can cause deposition of debris and sediment (aggradation) and can force changes in flow characteristics such as increased meander or braiding.
There is a fine balance reached in a stable stream. If the stream is aggrading, the newly applied sediment can destroy fish habitats. Conversely, if the stream is degrading, it can jeopardize hydraulic structures by scouring the foundations or result in a loss of micro organisms essential to a healthy habitat.
Standards of Practice
A stable channel design can be achieved using many approaches. One common approach is to reinforce a channel so that the maximum bed shear stress does not exceed the critical shear stress, ensuring that the channel bed does not move. This is most commonly done with channel lining procedures such as riprap or concrete. A second is to compute the bed discharge load or sediment transport rate at equilibrium and make modifications to ensure a similar carrying capacity is available through the adjacent reaches. This study will focus on the latter of the two approaches.
Many different studies have been performed to determine the sediment carrying capacity of a natural stream. Most of this research can be summarized in two distinct approaches. The first was pioneered by Einstein (1950), in which the total bed material discharge is divided into the bed load discharge and suspended-load discharge and then summed to estimate total sediment discharge. The second method is a determination of total sediment discharge as a function of hydraulic variables such as velocity, slope, and depth (Sturm 2002).
The Urban Drainage Storm Water Criteria Manual (UDSWCM) does not contain a recommended standard of practice to solve for sediment transport in a natural channel. There are general guidelines presented in Volume 1 of the UDSWCM that suggest to focus on the channel behavior historically, currently, and predict for the future to make a complete assessment of the channel’s stability. UDSWCM also presents
general guidelines for longitudinal slopes of constructed channels, but does not have criteria to calculate a stable slope or sediment carrying capacity of a natural channel such as East Plum Creek.
The approach presented in this report will consider historical and current observations utilizing aerial photography, a comprehensive site review, and an analytical analysis. A site review combined with an analytical analysis will be used to determine a stable channel slope, while the aerial photography will be used to determine head cutting, meander patterns, and variations in the floodplain from the past to present. For this analysis, the sediment supply from upstream coming into the Study Area is equal to the stable sediment transport capacity of the channel.
Summary of Approach
To apply the standards of practice and general concepts of a stream stability assessment to East Plum Creek, the study area was divided into six separate reaches. Each reach was analyzed according to the three different types of evaluation listed below:
• Site Review: The Site Review was conducted to observe the existing conditions within the project area. This review was conducted during September 17th and 18th, in the year 2007. Field maps were used to note observations and photograph locations.
• Historic Analysis: Aerial imagery from 1937, 1967, and 2006 were obtained and reviewed to determine migration patterns of the low flow channel and flood banks.
• Analytical Analysis: An Analytical Analysis was performed to establish the sediment capacity coming into the study area. From the site review, the upstream undeveloped areas were assumed to be at equilibrium and were used as a baseline for a stable sediment load. Computational hydraulics were applied to determine the stable slope that will carry the equilibrium sediment load.
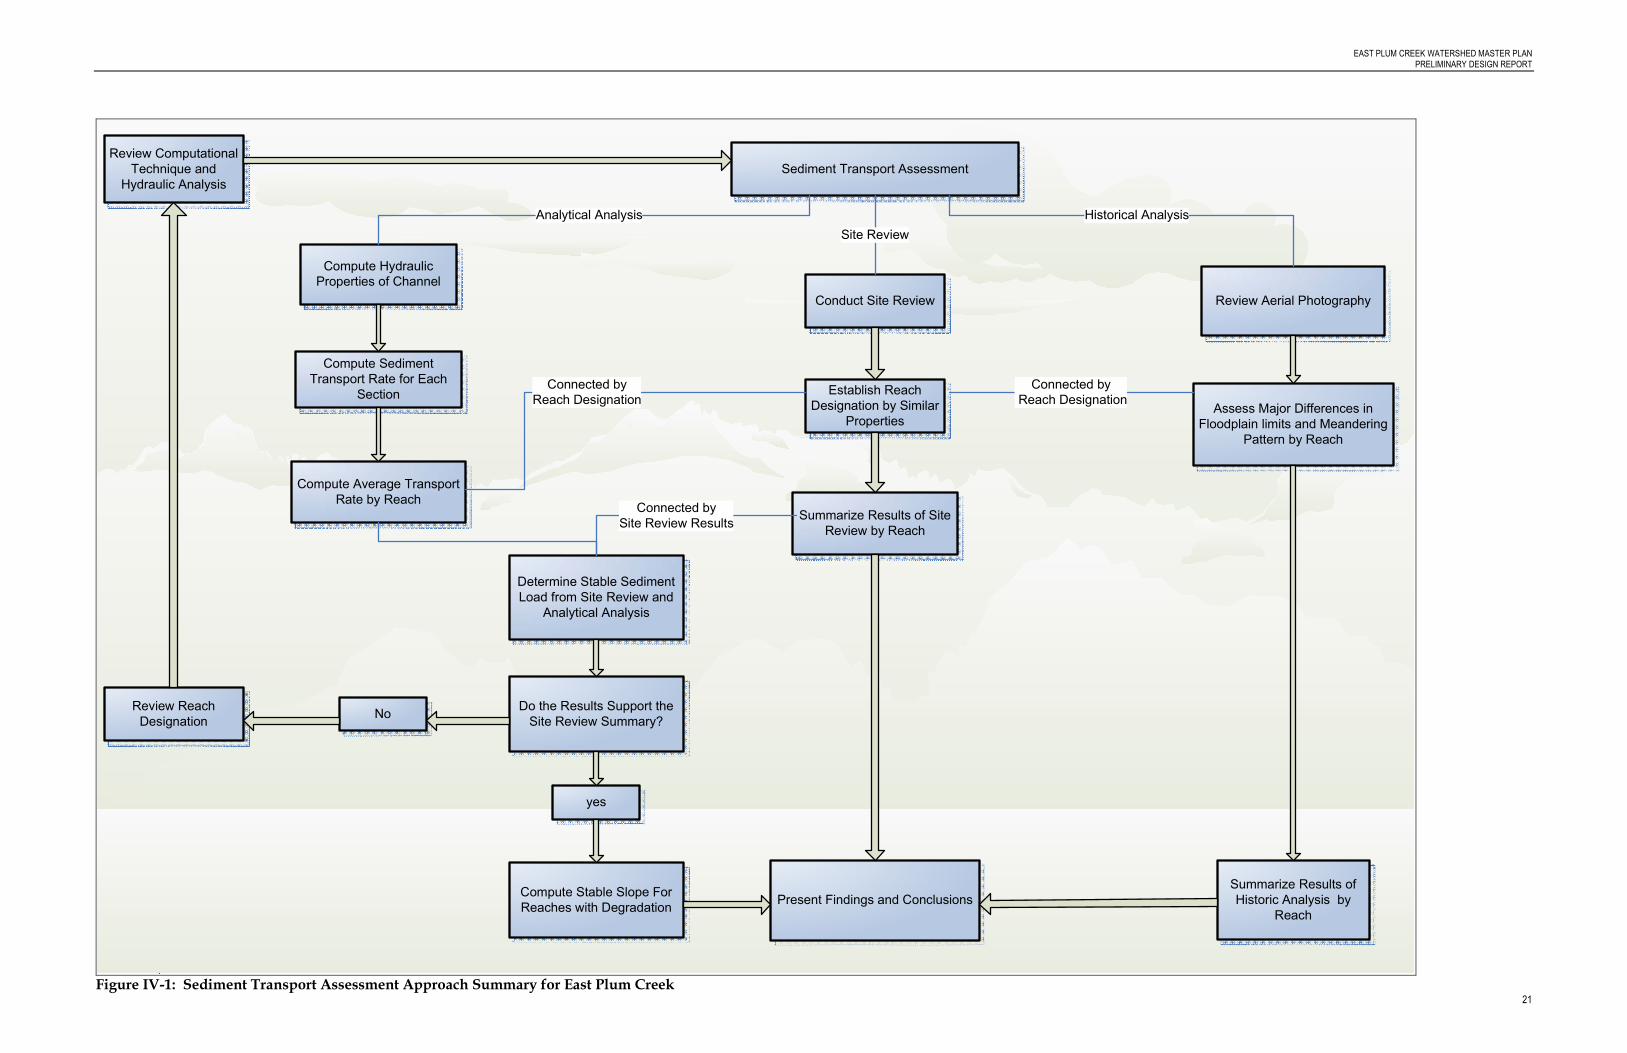
The approach to establish a qualitative and quantitative assessment of stream stability and sediment transport for East Plum Creek is summarized in Figure IV-1 below. As shown in the flow diagram, the selection of reach designation from the site review is an important decision for the whole assessment. Reach designations were determined by similarities in hydraulic characteristics, channel degradation, bank erosion, and hydraulic structures.
EAST PLUM CREEK WATERSHED MASTER PLAN PRELIMINARY DESIGN REPORT
21
Compute Hydraulic
Properties of Channel
Compute Sediment
Transport Rate for Each
Section
Compute Average Transport
Rate by Reach
Sediment Transport Assessment
Analytical Analysis
Conduct Site Review
Site Review
Review Aerial Photography
Historical Analysis
Establish Reach
Designation by Similar
Properties
Summarize Results of Site
Review by Reach
Assess Major Differences in
Floodplain limits and Meandering
Pattern by Reach
Summarize Results of
Historic Analysis by
Reach
Connected by
Reach Designation
Connected by
Reach Designation
Determine Stable Sediment
Load from Site Review and
Analytical Analysis
Compute Stable Slope For
Reaches with DegradationPresent Findings and Conclusions
Do the Results Support the
Site Review Summary?
Connected by
Site Review Results
yes
NoReview Reach
Designation
Review Computational
Technique and
Hydraulic Analysis
Figure IV-1: Sediment Transport Assessment Approach Summary for East Plum Creek

EAST PLUM CREEK WATERSHED MASTER PLAN PRELIMINARY DESIGN REPORT
22
Reach Description
Reaches were established to match certain characteristics within East Plum Creek and the surrounding watershed. Below are descriptions of the reach characteristics, a plan view of the reaches and their locations are shown in Figures IV-2 and IV-3.
Reach 1 Reach 1 is approximately 1.6 miles long and is located in the upper most reach in this study. The reach is located within active agricultural land and is bounded upstream by the limit of the Town boundary and downstream by Crystal Valley Parkway. The floodplain ranges in width from approximately 180 feet to 350 feet and has a gentle meander pattern. The low flow channel bed material is predominantly sand with small gravel sized particles. Much of the low flow channel is braided with deposition on the inside bends of meanders. The width and flow depth of the low flow channel varied from approximately 5 ft to 10 ft and 0.5 ft to 1.5 ft, respectively.
Vegetation within the floodplain of Reach 1 is dominated by a mixture of riparian grasses, forbs, and shrubs intermixed with pockets of woodlands. Plant composition and diversity are fairly variable along the reach, and species diversity and abundance appear to be higher in sections with less channel erosion. The stream channel supports intermittent herbaceous and scrub-shrub fringe wetlands that typically extend between 1 to 20 feet from the channel banks. Extensive wetland development beyond the channel fringe appears to be limited by the incised channel banks found along parts of the reach. Many of the wetlands are dominated by woody species such as sandbar willow (Salix exigua). Herbaceous wetlands are often dominated by sedges (Carex spp.). Noxious weeds in Reach 1 include Canada thistle (Cirsium arvense), Russian olive (Elaeagnus angustifolia), Russian knapweed (Acroptilon repens), and musk thistle (Carduus nutans).
Soil classifications within the flood plain of Reach 1 are predominately Type C soils of the Fondis series (FoB, Fod, and Fu). With some Type B soils classified as Newlin Gravelly Sandy Loam (NeE) and the Bresser Sandy Loam (BrB).
Reach 2 Reach 2 is approximately 1.6 miles long and is just downstream of Reach 1 and is within the upper reach of the study area. The reach begins downstream of Crystal Valley Parkway and ends to the east of Brookside Circle and South Wilcox Street. The reach is bounded to west by mostly open space, highways, and a few commercial developments and to the east by low to medium density single family development. The floodplain ranges from 300 feet to 400 feet and has a gentle meander pattern. The low flow channel bed material is predominantly sand with small gravel sized particles. Much of the low flow channel is braided with deposition on the inside bends of meanders. The width and flow depth of the low flow channel varied from approximately 5 ft to 10 ft and 0.5 ft to 1.5 ft, respectively.
Vegetation within the floodplain of Reach 2 is dominated by a mixture of riparian grasses, forbs, and shrubs intermixed with pockets of woodlands. Plant composition and diversity are fairly uniform. The stream channel supports intermittent herbaceous and scrub-shrub fringe wetlands that typically extend between 1 to 10 feet from the channel banks. Some small wetland areas exist beyond the immediate banks of the channel, but extensive wetland development beyond the channel fringe appears to be limited by the incised channel banks. Many of the wetlands are dominated by woody species such as sandbar willow (Salix exigua). Herbaceous wetlands are often dominated by sedges (Carex spp.). Noxious weeds in Reach 2 include Canada thistle (Cirsium arvense), Russian olive (Elaeagnus angustifolia), Russian knapweed (Acroptilon repens), and musk thistle (Carduus nutans).
Soil classifications within the flood plain of Reach 2 are predominately Type B soils classified as Newlin Gravelly Sandy Loam (NeE) and the Bresser Sandy Loam (BrB).
Reach 3 Reach 3 is approximately 1.1 miles long and is located upstream of the downtown area. The reach begins downstream of Reach 2 and ends at the confluence of East Plum Creek and Sellers Gulch. The reach is bounded to the west by mostly open space, highways, and a few commercial developments and to the east by low to medium density single family development and sparse commercial development. The floodplain ranges from 200 feet to 400 feet and has a gentle meander pattern. The low flow channel bed material is predominantly sand with small gravel sized particles. Much of the low flow channel is braided with deposition on the inside bends of meanders. The width and depth of the low flow channel varies from approximately 5 ft to 10 ft and 0.5 ft to 1.5 ft, respectively.
Vegetation within the floodplain of Reach 3 is dominated by a mixture of riparian grasses, forbs, and shrubs intermixed with pockets of woodlands. Plant composition and diversity are variable. The stream channel supports mostly continuous herbaceous and scrub-shrub fringe wetlands that typically extend between 1 to 10 feet from the channel banks, with most of the wetlands concentrated near the northern end of the reach. Some small wetland areas exist beyond the immediate banks of the channel, but extensive wetland development beyond the channel fringe appears to be limited by the incised channel banks. Many of the wetlands are dominated by woody species such as sandbar willow (Salix exigua). Herbaceous wetlands are often dominated by sedges (Carex spp.). Noxious weeds in Reach 3 include Canada thistle (Cirsium arvense), Russian olive (Elaeagnus angustifolia), Russian knapweed (Acroptilon repens), yellow toadflax (Linaria vulgaris), and musk thistle (Carduus nutans). This reach is part of a wetland augmentation area, and good wetland and riparian habitat for Preble’s meadow jumping mouse (Zapus hudsonius preblei) and other species extend throughout the reach.
Soil classifications within the flood plain of Reach 3 are predominately Type B soils classified as Newlin Gravelly Sandy Loam (NeE) and the Bresser Sandy Loam (BrB).
Reach 4 Reach 4 is the shortest reach with a length of approximately 0.6 miles. The reach is located through the center of downtown. The reach begins downstream of the confluence of East Plum Creek and Sellers Gulch and ends at the East Wolfensberger Road. The reach is bounded to west by single family and commercial developments and to the east by downtown Castle Rock. The floodplain ranges from 100 feet to 150 feet and has a gentle meander pattern. The low flow channel bed material is predominantly sand with small gravel sized particles. The floodplain has been encroached and is bounded with supported rock gabion walls. The width and depth of the low flow channel varied from approximately 5 ft to 10 ft and 0.5 ft to 1.5 ft, respectively.
Vegetation within the floodplain of Reach 4 is dominated by a mixture of riparian grasses, forbs, and shrubs intermixed with pockets of woodlands. Plant composition and diversity is fairly uniform. The stream channel supports continuous herbaceous and scrub-shrub fringe wetlands that typically extend between 10 to 20 feet from the channel banks. Many large wetland areas exist beyond the immediate banks of the channel, which are likely influenced by the small dams that raise the local water table, relatively high natural groundwater conditions and/or occasional overbank flooding. Many of the wetlands are dominated by woody species such as sandbar willow (Salix exigua). Herbaceous wetlands are often dominated by sedges (Carex spp.). Noxious weeds in Reach 4 include Canada thistle (Cirsium arvense), Russian olive (Elaeagnus angustifolia), Russian knapweed (Acroptilon repens), and musk thistle (Carduus

EAST PLUM CREEK WATERSHED MASTER PLAN PRELIMINARY DESIGN REPORT
23
nutans). This reach is part of a wetland augmentation area, and there is an abundance of good wetland and riparian habitat for Preble’s meadow jumping mouse (Zapus hudsonius preblei) and other species.
Soil classifications within the flood plain of Reach 4 are predominately Type B soils classified as Newlin Gravelly Sandy Loam (NeE) and the Bresser Sandy Loam (BrB).
Reach 5 Reach 5 is the longest reach measuring at approximately 3 miles. The reach begins downstream of East Wolfensberger Road and ends about ¾ of a mile downstream of Meadows Parkway. The reach is bounded to west and east be open space and single family developments. The floodplain ranges from 200 feet to 400 feet and has a gentle meander pattern. The low flow channel bed material is predominantly sand with small gravel sized particles. The width and flow depth of the low flow channel varied from approximately 5 ft to 10 ft and 0.5 ft to 1.5 ft, respectively.
Vegetation within the floodplain of Reach 5 is dominated by a mixture of riparian grasses, forbs, and shrubs intermixed with pockets of woodlands. Plant composition and diversity are fairly variable, often-times in correlation with the level of channel erosion. The stream channel supports mostly continuous herbaceous and scrub-shrub fringe wetlands that typically extend between 1 to 20 feet from the channel banks. Some small wetland areas exist beyond the immediate banks of the channel, which are likely influenced by the small dams that raise the local water table, relatively high natural groundwater conditions and/or occasional overbank flooding. Many of the wetlands are dominated by woody species such as sandbar willow (Salix exigua). Herbaceous wetlands are often dominated by sedges (Carex spp.). Noxious weeds in Reach 5 include Canada thistle (Cirsium arvense), Russian olive (Elaeagnus angustifolia), Russian knapweed (Acroptilon repens), yellow toadflax (Linaria vulgaris), and musk thistle (Carduus nutans). There is a riparian/wetland mitigation area south of the Meadows Parkway Bridge with some planted willows and other shrubs that appear to be only partially successful. Part of this reach is within a wetland augmentation area, and good wetland and riparian habitat is available for Preble’s meadow jumping mouse (Zapus hudsonius preblei) and other species.
Soil classifications within the flood plain of Reach 5 are comprised of Type B soils classified as Newlin Gravelly Sandy Loam (NeE) and the Bresser Sandy Loam (BrB) and Type C soils of the Fondis series (FoB, Fod, and Fu).
Reach 6 Reach 6 is the last reach within the study area measuring at approximately 1.2 miles long. The reach begins downstream of Reach 5 and ends at the downstream limit of the Town boundary. The reach is bounded to west and east be open space and single family developments. The floodplain ranges from 200 feet to 400 feet and has a gentle meander pattern. The low flow channel bed material is predominantly sand with small gravel sized particles. The width and flow depth of the low flow channel varied from approximately 5 ft to 10 ft and 0.5 ft to 1.5 ft, respectively.
Vegetation within the floodplain of Reach 6 is dominated by a mixture of riparian grasses, forbs, and shrubs intermixed with pockets of woodlands. Although plant composition and diversity are fairly uniform throughout the reach, species diversity and abundance appear to be higher in sections with less channel erosion. The stream channel supports intermittent herbaceous and scrub-shrub fringe wetlands that typically extend between 1 to 5 feet from the channel banks. Some small wetland areas exist beyond the immediate banks of the channel, but extensive wetland development beyond the channel fringe appears to be limited by the incised channel banks found along much of the reach. Many of the wetlands are dominated by woody species such as sandbar willow (Salix exigua). Some of the sandbar willows that were over 50 feet from the channel appear to be dying back, perhaps from diminished availability of groundwater as the channel has become more incised over time. Herbaceous wetlands are often dominated by sedges (Carex spp.). Noxious weeds observed in Reach 6 include Canada thistle (Cirsium arvense), Russian olive (Elaeagnus angustifolia), Russian knapweed (Acroptilon repens), and musk thistle (Carduus nutans). A red-tailed hawk (Buteo jamaicensis) was observed at the site about one-half mile south of the water treatment facility located at the northern end of the reach. Soil classifications within the flood plain of Reach 6 are predominately Type C soils of the Fondis series (FoB, Fod, and Fu). With some Type B soils classified as Newlin Gravelly Sandy Loam (NeE) and the Bresser Sandy Loam (BrB).

EAST PLUM CREEK WATERSHED MASTER PLAN PRELIMINARY DESIGN REPORT
24
Figure IV-2 Reaches 1 to 3 on East Plum Creek
Figure IV-3 Reaches 4 to 6 on East Plum Creek


EAST PLUM CREEK WATERSHED MASTER PLAN PRELIMINARY DESIGN REPORT
25
Engineering Analysis
Site Review
A comprehensive site review was necessary to support any conclusions or implications that may result from the aerial review and the analytical analysis. East Plum Creek was observed for channel degradation, channel bank erosion and instability, extreme degradation, and for areas where East Plum Creek may be cutting into private property, or threatening hydraulic structures.
In general, channel degradation, bank erosion, and undercutting of hydraulic structures became more pronounced the further downstream the site review was conducted. At the beginning in Reach 1, channel degradation and minor bank erosion were only found around hydraulic structures. As the site review progressed, extreme bank erosion and undercutting of hydraulic structures was found to be more common. At the end of the site review, the channel was consistently incised 4 to 5 feet from channel degradation. The following sections describe the findings for each of the six reaches.
Reach 1 The far upstream portion of Reach 1 was a stable channel with little channel degradation or bank erosion except for locations around hydraulic structures. The first location of a hydraulic structure was at the crossing of East Plum Creek and a dirt road that leads to a quarry. After this crossing, portions of the upstream reach are experiencing invert degradation, most likely from a 72-inch Corrugated Metal Pipe CMP that is concentrating and accelerating the low flows. At the 72 inch CMP a drop in invert elevation of 8 ft has occurred at the downstream end of the structure. This is shown in Exhibit IV-1.
Exhibit IV-1. Channel Degradation from 72-inch CMP
The channel downstream of this structure is incised with 5 to 6 foot banks that are primarily composed of sandy gravel and are very steep with sparse vegetation as shown in Exhibit IV-2. The second hydraulic structure in Reach 1 is a residential bridge crossing located near the midpoint of the reach. The residential bridge has signs of invert degradation of approximately 1 to 2 feet as shown in Exhibit IV-3.
Exhibit IV-2. East Plum Creek Downstream of 72 inch CMP
Exhibit IV-3. Residential Bridge on East Plum Creek
Aside from areas around hydraulic structures, the overall stability of Reach 1 appeared to be. For most of the reach, the channel banks are laid back at a natural slope and contain a healthy amount of vegetation. Exhibit IV-4 shows a typical section of Reach 1 that is not located near hydraulic structures.
Signs of Channel Degradation at Residential Bridge

EAST PLUM CREEK WATERSHED MASTER PLAN PRELIMINARY DESIGN REPORT
26
Exhibit IV-4: Typical Section of Reach 1 not Located near Hydraulic Structures
The latter reaches of Reach 1 continue to remain stable, with sandy banks laid back at a natural slope and healthy vegetation. Exhibit IV-5 shows the last stretch of Reach 1 with the new Crystal Valley Parkway Bridge in the backdrop. The location of the bridge marks the beginning of Reach 2.
Exhibit IV-5: Latter Part of Reach 1
Reach 2 The upper end of Reach 2 is the beginning of local development within the study area. East of the low flow channel of East Plum Creek are newly built single family residences and a large golf course. Reach 2
is the first location to exhibit major bank erosion and consistent channel degradation. Hydraulic structures located in the tributaries to Reach 2 were undercut and deteriorating.
Reach 2 starts near the newly constructed Crystal Valley Parkway Bridge. The supporting piers of the bridge are properly protected with 2- to 3-foot riprap. Just past the bridge is another, older bridge crossing that exhibited channel degradation of 3 to 4 feet. The channel between these two structures is showing signs of bank erosion, which is captured in Exhibit IV-6 below.
Exhibit IV-6: Beginning of Reach 2
Most of the low flow channel in Reach 2 exhibits channel degradation of about 2 to 3 feet. The banks of the low flow channel are incised and too steep to maintain healthy amounts of vegetation. In areas where East Plum Creek is adjacent to the banks of the floodplain, major bank erosion has occurred. Exhibits IV-7 and IV-8 show a typical low flow channel section and an area exhibiting major bank erosion, respectively.
Tributaries that flow from the east into East Plum Creek are showing signs of severe erosion and undercutting. Some areas appear that the channel has head cut up the tributary nearly causing failure to existing culverts. Exhibit IV-9 shows a culvert that passes flows under the existing railroad tracks. An attempt to stop the back cutting up the tributary has been made by placing railroad tracks and sheets of wood downstream of the culvert.

EAST PLUM CREEK WATERSHED MASTER PLAN PRELIMINARY DESIGN REPORT
27
Exhibit IV-7: Typical low flow Channel Section for Reach 2
Exhibit IV-8: Major Bank Erosion on East Plum Creek
Exhibit IV-9: Head Cutting on a Tributary to East Plum Creek
Locations in East Plum Creek that are downstream from tributaries with extreme erosion and degradation appear to have more stable banks and minimal channel degradation. This is likely caused from the sediment load entering from the tributary and balancing the sediment load in East Plum Creek. Exhibit IV-10 shows a section of East Plum Creek downstream of a tributary that was showing signs of extreme erosion.
Exhibit IV-10: Typical Section Downstream of Tributaries on East Plum Creek
EAST PLUM CREEK WATERSHED MASTER PLAN PRELIMINARY DESIGN REPORT
28
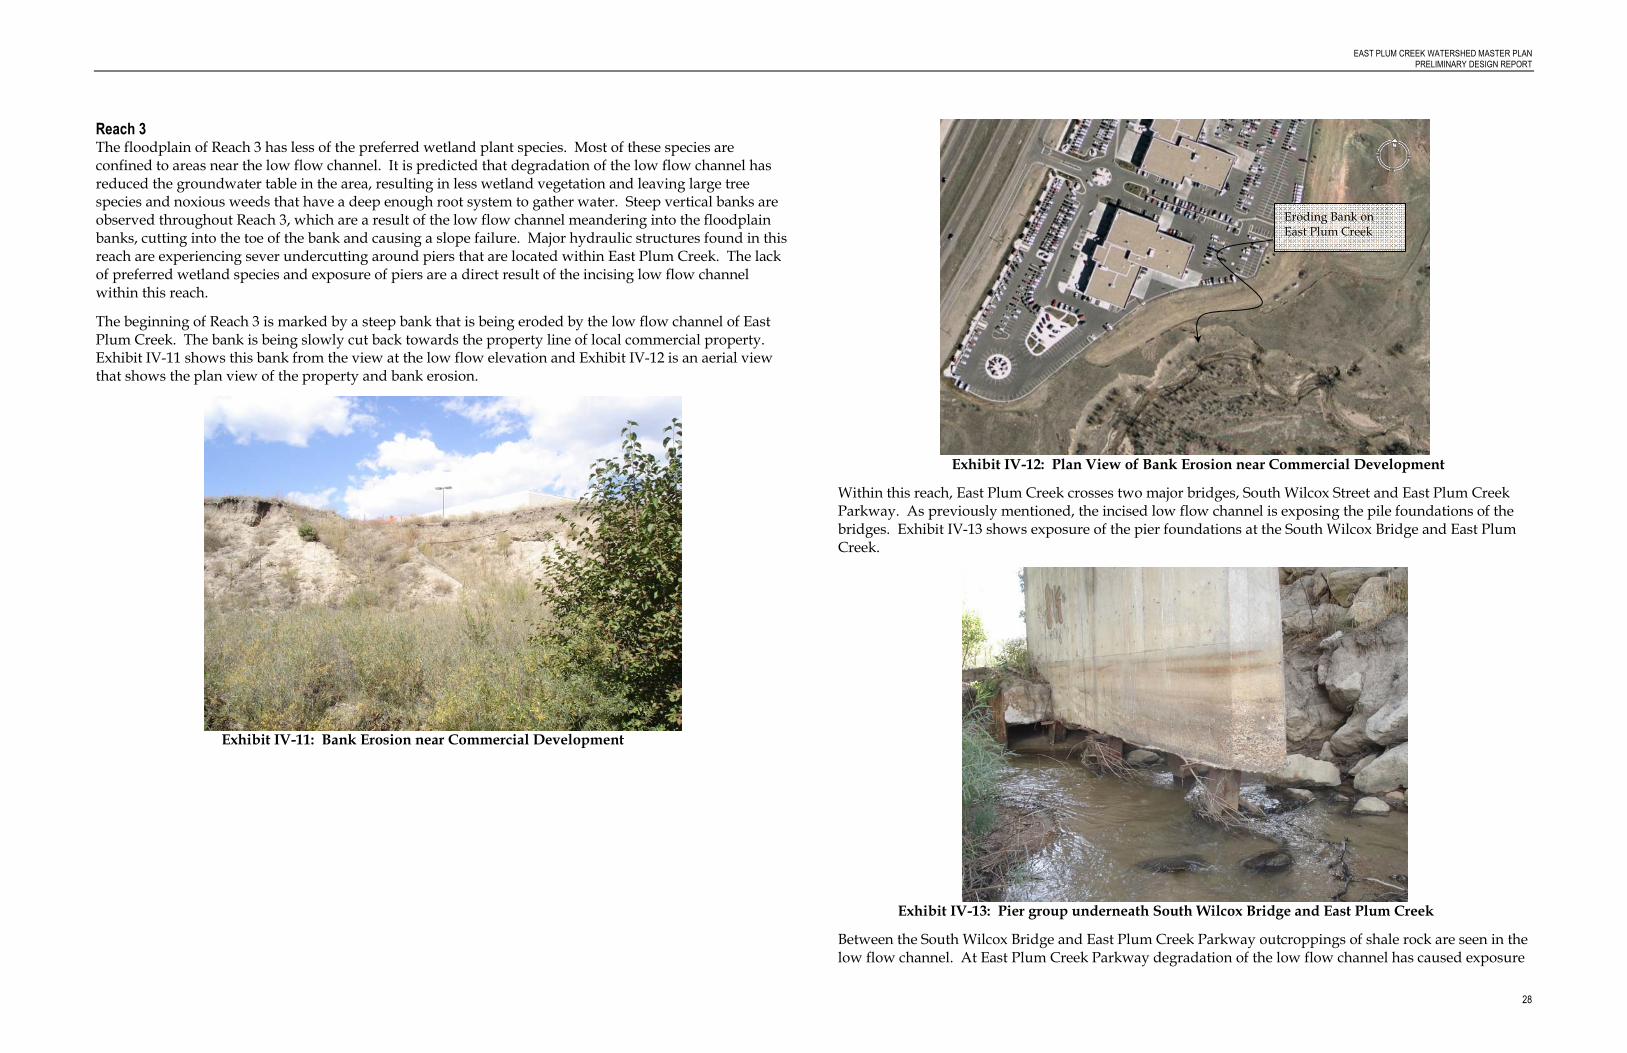
Reach 3 The floodplain of Reach 3 has less of the preferred wetland plant species. Most of these species are confined to areas near the low flow channel. It is predicted that degradation of the low flow channel has reduced the groundwater table in the area, resulting in less wetland vegetation and leaving large tree species and noxious weeds that have a deep enough root system to gather water. Steep vertical banks are observed throughout Reach 3, which are a result of the low flow channel meandering into the floodplain banks, cutting into the toe of the bank and causing a slope failure. Major hydraulic structures found in this reach are experiencing sever undercutting around piers that are located within East Plum Creek. The lack of preferred wetland species and exposure of piers are a direct result of the incising low flow channel within this reach.
The beginning of Reach 3 is marked by a steep bank that is being eroded by the low flow channel of East Plum Creek. The bank is being slowly cut back towards the property line of local commercial property. Exhibit IV-11 shows this bank from the view at the low flow elevation and Exhibit IV-12 is an aerial view that shows the plan view of the property and bank erosion.
Exhibit IV-11: Bank Erosion near Commercial Development
Exhibit IV-12: Plan View of Bank Erosion near Commercial Development
Within this reach, East Plum Creek crosses two major bridges, South Wilcox Street and East Plum Creek Parkway. As previously mentioned, the incised low flow channel is exposing the pile foundations of the bridges. Exhibit IV-13 shows exposure of the pier foundations at the South Wilcox Bridge and East Plum Creek.
Exhibit IV-13: Pier group underneath South Wilcox Bridge and East Plum Creek
Between the South Wilcox Bridge and East Plum Creek Parkway outcroppings of shale rock are seen in the low flow channel. At East Plum Creek Parkway degradation of the low flow channel has caused exposure
Eroding Bank on East Plum Creek

EAST PLUM CREEK WATERSHED MASTER PLAN PRELIMINARY DESIGN REPORT
29
to the bridge’s pier foundations similar to Wilcox Bridge. Exhibit IV-14 shows the exposed piers under East Plum Creek Parkway Bridge.
Exhibit IV-14: Exposed Piers under East Plum Creek Parkway Bridge
Between the two bridges and the confluence with Sellers Gulch, East Plum Creek parallels Interstate 25 (I-25). Bank stabilization is found along the latter part of this reach where East Plum Creek runs against the Interstate’s embankment. The channel shows continuous signs of degradation causing steep incised banks. Towards the latter part of Reach 3 the low flow channel is on average 4 to 5 feet incised.
Reach 4 Reach 4 begins at the confluence of East Plum Creek and Sellers Gulch and ends at the Wolfensberger Bridge. There is a recreational trail neighboring East Plum Creek throughout the reach. This reach is unique since it has been restored through a Habitat Conservation Plan (HCP) for the Preble’s Jumping Mouse, which was a joint effort by the Colorado Department of Transportation (CDOT), U.S. Fish and Wildlife Service (USFWS), Federal Highway Association (FHWA), and the U.S. Army Corps of Engineers (USACE). The improvements include a series of check structures that were installed as part of the HCP, which have kept the low flow channel stable and maintained a healthy groundwater table to support endogenous wetland species of plants. An example of these check structures is shown in Exhibit IV-15.
Within this reach East Plum Creek passes under two major bridges, I-25 and 5th street Bridge. No scour of hydraulic structures or exposure of pier foundations was found within this reach. Although the low flow channel has been stabilized with the HCP improvements, the floodplain banks are consistently very steep and unstable and will likely continue to erode with higher flow rates. Exhibit IV-16 shows a section of bank at the edge of the floodplain in Reach 4.
Exhibit IV-15: Check Structures Installed as Part of the HCP
Exhibit IV-16: Section of Floodplain Bank within Reach 4
Reach 5 Past the HCP improvements of Reach 4, East Plum Creek once again exhibits signs of degradation and bank erosion. The only major hydraulic structure within this reach is at the downstream end where Meadows Parkway crosses East Plum Creek. At this location there was no observed scour around the bridge piers. Exhibit IV-17 depicts a typical section of the low flow channel in Reach 5. The degradation of

EAST PLUM CREEK WATERSHED MASTER PLAN PRELIMINARY DESIGN REPORT
30
the low flow channel is causing steep, incised banks that can not hold vegetation. The lowered groundwater table results in a scarcity of the preferred wetland plant species.
Exhibit IV-17: Typical Channel Section for Reach 5
Locations where the low flow channel has meandered out to the floodplain banks are showing signs of severe bank erosion that have resulted from slope failure. Exhibit IV-18 shows a typical bank failure seen in Reach 5.
Exhibit IV-18: Bank Failure in Reach 5
Reach 6 Reach 6 spans from the end of Reach 5 to the downstream limit of the study area. The channel and floodplain characteristics are similar to that of Reach 5. Some minor differences are the steep floodplain banks that reach heights of 10 to 20 feet above the low flow channel. Exhibit IV-19 is a typical section where the low flow channel has meandered out to the floodplain banks. The erosion has caused slope failure and is slowly progressing towards private property, which is shown by the barb wire fence on the right.
Exhibit IV-19: Typical Section with Low Flow Channel at Floodplain Banks
Aerial Review
Historic aerial photographs were analyzed to assess the performance of East Plum over a period of time. Three unique time periods of historic photographs were chosen for this analysis; these years were 1934, 1967, and 2005. The 1934 photographs were used to get an estimate of the original meander pattern of the stream. The 1967 photographs provided insight as to how East Plum Creek was changed as a result of the 1965 flood event. The 2005 photographs provide a near current state of East Plum Creek.
Meander patterns of the three historic aerial photographs are shown in Exhibits IV-20, IV-21, and IV-22. General interpretations of these photographs are discussed below.
Reach 1
The upstream portion of Reach 1 shows a significant difference in the meander patterns from 1934, 1965, and 2005. According the to 1934 aerial photograph, East Plum Creek used to have a more pronounced meander pattern of the low flow channel and the floodplain limits. It was also observed that the floodplain is narrower and more closely follows the low flow channel. The pattern is typical of a perennial stream with a stable natural slope and moderate deviations in peak flow rates.

EAST PLUM CREEK WATERSHED MASTER PLAN PRELIMINARY DESIGN REPORT
31
The 1967 photographs show a significant straightening of the low flow channel and floodplain. The 2005 photograph shows floodplain limits similar to 1967. The low flow channel of East Plum Creek has reestablished a natural meander pattern similar to 1937 within the floodplain limits.
In general, it appears that the 1965 flood had a significant impact on the floodplain of East Plum Creek. The newly cut banks have most likely confined the low flow channel since that event.
Reach 2 The 1934 floodplain is similar in width and meander to the 1967 and 2005 floodplain. In some areas, the 1934 floodplain is wider than both the 1967 and 2005 floodplain. As with Reach 1, the 1967 photographs show a significant straightening and widening of the floodplain.
1934 exhibits a noticeable difference in the low flow channel compared to 2005. The low flow channel meanders within the floodplain banks but does not come as close to the banks as 2005. From the site review it was noted that close meandering of the low flow channel to the floodplain banks is causing significant erosion and slope failure near property lines. The resolution of the historic aerial photographs does not allow for a close analysis of the banks.
Reach 3 The 1967 photographs show the widened floodplain banks following I-25. The floodplain banks of the 1934 photographs extend into what is now commercial development. Encroachment through the Town and near bridges creates similar floodplain limits and low flow meandering between the 2005 and 1967 photographs.
Reach 4 The floodplains for the three photographs at this location are predominately controlled by the location of I-25. The 1934 photographs show a different alignment of I-25 compared to what is seen today and was seen in 1967. The floodplain widths and low flow meandering appear similar between the three photographs.
Reach 5 As East Plum Creek turns west of the I-25 corridor, similar situations that were observed in Reach 1 and 2 are observed in Reach 5. The meander of the 1934 floodplain is more pronounced than 2005 and 1967. The 1965 flood had an apparent straightening of the floodplain. The 2005 low flow channel seems to be cutting into the floodplain banks more often than what was seen in 1934.
Reach 6 Within Reach 6 East Plum Creek becomes somewhat confined by the State Highway 85 (SH-85) to the northeast and railroad tracks to the southwest. The aerial photographs imply that these structures have existed since 1934. The floodplain limits appear to be more narrow than the 1967 and 2005 floodplain limits. The consistent straightening of the floodplain after the 1965 flood is observed in Reach 6 as well.
Figure IV-4: Historic Comparison of East Plum Creek for Reaches 1 and 2

EAST PLUM CREEK WATERSHED MASTER PLAN PRELIMINARY DESIGN REPORT
32
Figure IV-5: Historic Comparison of East Plum Creek for Reaches 3, 4, and part of 5
Figure IV-6: Historic Comparison of East Plum Creek for Reaches 5 and 6

EAST PLUM CREEK WATERSHED MASTER PLAN PRELIMINARY DESIGN REPORT
33
Analytical Analysis
The best methods to predict sediment transport characteristics can be difficult and hard to quantify. The overall process and information required to perform typical sediment transport analysis is time consuming and extensive. A practical application for sediment transport is presented in the report titled Design Guidelines and Criteria of Channels and Hydraulic Structures on Sandy Soil, which was written for the UDFCD in Denver Colorado. The determination of sediment transport is presented as a power relationship between sediment transport rate and velocity and depth. Equation 1 presents this relationship.
32
1CC
vycq = (1)
Where, q = sediment transport rate in cfs/foot, y = flow depth in feet, v = flow velocity in feet per second, c1, c2, and c3 are constants that are defined in Table IV-1 below.
TABLE IV-1
Constants for Sediment Transport Equation taken from (Simons and Associates 1981)
Soil Classification
Size (mm)
Geometric Mean (mm) C1 C2 C3
Very Fine Sand 0.062 - 0.125 0.088 58.50 x 10⁻⁶
1.040 3.20
Fine Sand 0.125 - 0.250 0.177 21.40 x 10⁻⁶
0.837 3.59
Medium Sand 0.250 - 0.500 0.354 6.47 x 10⁻⁶
0.535 4.05
Coarse Sand* 0.500 - 1.00 0.707 2.90 x 10⁻⁶
0.239 4.36
Very Coarse Sand 1.000 - 2.000 1.41 2.37 x 10⁻⁶
-0.044 4.44
*Selected Values for this Study
Geotechnical investigations were not conducted as part of this study. For computational purposes, a constant value of coarse sand is sufficient to represent the sediment transport rate through the study area. Exhibit IV-20 shows a representative soil grain diameter and the pen is placed as a tool to estimate grain size from the photograph. The analytical process is used to estimate the incoming sediment load, the stable sediment load for East Plum Creek within the Study Area, and then to determine a stable slope that will minimize degradation.
Exhibit IV-20: Representative Grain Size for East Plum Creek
Sediment Transport Calculations
Equation 1 was applied to each cross section of a detailed hydraulic analysis using Hydraulic Engineering Center River Analysis Software (HEC-RAS) model of East Plum Creek. The values produced from this analysis were input into Equation 1 to compute the sediment transport rate at each section.
The natural construct of East Plum Creek includes a sandy stream bed and a floodplain that consists of woodlands and plant species. For most of East Plum Creek, the banks on the low flow channel will be overtopped during a 2 to 5 year event. Since the sediment carrying capacity of East Plum Creek is mostly within the low flow channel, the flow depth and channel velocity were assumed to be the depth from the low flow channel to the water surface and the velocity of the main channel. Local accelerations and backwater effects due to hydraulic structures and varying channel geometry created a set of highly skewed sediment transport results. The power relationship of Equation 1 suggests that small changes in velocity can lead to large differences in the computation of the sediment transport rate.
To determine a baseline sediment carrying capacity the data were analyzed by taking the geometric mean of the sediment transport rate for each reach. The geometric mean has an advantage over the arithmetic mean since it is less affected by very small or very large values within a skewed data set. The power relationship of Equation 1 and the results from the hydraulic analysis are more accurately represented by using the mathematical properties of the geometric mean to compute a baseline sediment transport rate value.
Figures IV-7, IV-8, and IV-9 show the computed values for sediment transport rates for each event along each reach. Also shown in the below figures are the computed values of sediment transport for each cross section and a 5 point moving trend. The 5 point moving trend is intended to reflect any changes within a reach that are not observed by the overall reach transport rate value.

EAST PLUM CREEK WATERSHED MASTER PLAN PRELIMINARY DESIGN REPORT
34
The 2, 10, and 100-year peak flow rates for the future conditions were taken from the companion East Plum Creek Watershed Baseline Hydrology and are summarized in Table IV-2.
TABLE IV-2
East Plum Creek Peak Flow Rates taken from East Plum Creek Watershed Baseline Hydrology Report (CH2M HILL 2007)
Future Condition Peak Flow Rates (cfs)
Junction ID Station ID* 2-YR 10-YR 100-YR
EPC-8 57440 1,910 6,380 14,810
EPC-9 50300 1,980 7,250 16,950
EPC-10 32100 2,840 7,450 17,340
EPC-11 24400 3,210 7,720 18,050
EPC-12 5820 4,170 8,110 18,230
*First station to which the flow rate is applied

EAST PLUM CREEK WATERSHED MASTER PLAN PRELIMINARY DESIGN REPORT
35
Future Condtition Sediment Transport Calculations
East Plum Creek
0.00E+00
1.00E-01
2.00E-01
3.00E-01
0100002000030000400005000060000
Stationing
Tra
nsp
ort
Rate
(cfs
/fo
ot)
2 yr 2 yr geometric mean 5-point Geometric Mean
Reach 3Reach 1 Reach 2
Reach 4 Reach 5 Reach 6
Figure IV-7: Sediment Transport Rate using 2-year Peak Flow Rates


EAST PLUM CREEK WATERSHED MASTER PLAN PRELIMINARY DESIGN REPORT
36
Future Condtition Sediment Transport Calculations
East Plum Creek
0.00E+00
1.00E-01
2.00E-01
3.00E-01
4.00E-01
5.00E-01
6.00E-01
7.00E-01
8.00E-01
9.00E-01
1.00E+00
0100002000030000400005000060000
Stationing
Tra
nsp
ort
Rate
(cfs
/fo
ot)
10 yr 10 yr geometric mean 5-point Geometric Mean
Reach 3Reach 1 Reach 2
Reach 4 Reach 5 Reach 6
Figure IV-8: Sediment Transport Rate using 10-year Peak Flow Rates


EAST PLUM CREEK WATERSHED MASTER PLAN PRELIMINARY DESIGN REPORT
37
Future Condtition Sediment Transport Calculations
East Plum Creek
0.00E+00
5.00E-01
1.00E+00
1.50E+00
2.00E+00
0100002000030000400005000060000
Stationing
Tra
nsp
ort
Rate
(cfs
/fo
ot)
100 yr 100 yr geometric mean 5-point Geometric Mean
Reach 3Reach 1 Reach 2
Reach 4 Reach 5 Reach 6
Figure IV-9: Sediment Transport Rate using 100-year Peak Flow Rates


EAST PLUM CREEK WATERSHED MASTER PLAN PRELIMINARY DESIGN REPORT
38
Stable Slope Calculations
The computation of a stable slope from the sediment transport analysis required a quantitative understanding of the sediment transport rate results that are presented in the previous figures. Notice that for the 2, 10, and 100-year flow rates the geometric mean for the transport rate of Reach 1 and 4 are similar, with most deviation occurring for the 100-year peak flow rates. From the site review, Reach 1 was still in a mostly natural state with minor degradation as a result of hydraulic structures. Reach 4 spanned the length of the HCP improvements, which included check structures to stabilize the channel slope and raise the groundwater table. The similarities between the sediment transport rate values and the site characteristics allowed for the determination of the sediment transport value that would create a stable slope on East Plum Creek within the study area. Table IV-3 presents the stable sediment transport rate assumed for this study.
TABLE IV-3
Stable Slope Sediment Transport Rate Values for East Plum Creek
Flow Rates Stable Transport Rate Value
(cfs/ft)
2-YR 0.0074
10-YR 0.0311
100-YR 0.0792
Knowing the sediment transport rate that creates a stable channel is pertinent in calculating a stable channel slope. Figures 3-25 to 3-27 were used to select channel cross sections that have a transport rate equal to the geometric mean transport rate for that reach. Representative cross sections were also determined by their relationship to the friction slope and normalized n value. These criteria for each section are not always the same for each flow rate and a different representative cross section within a reach for different flow rates. The stationing of these cross sections for the 2, 10, and 100-year flow rates are presented in Table IV-4.
TABLE IV-4
Cross Sections Representative of Baseline Sediment Transport Value
Representative Cross Sections from HEC RAS Model
Reach ID 2-YR Station ID 10-YR Station ID 100-YR Station ID
Reach 2 42381 44400 45764
Reach 3 37890 35810 36777
Reach 5 27681 20956 27681
Reach 6 4354 9005 9005
.
The hydraulic properties of these sections were analyzed to determine the change in slope that will be required to match the stable transport rate. To do this, an optimization model was created to calculate normalized sections and determine a slope that would carry the stable sediment transport rate defined in Table 3-3.
In functional form, the value for velocity in an open channel assuming uniform flow can be written as, v~f(Sf, A, n) and A~f(y) In which, Sf = friction slope, A = cross sectional area of flow, n = Manning’s roughness value, and y = flow depth. The process to create a normalized cross section and solve for a stable slope is outlined in the following steps:
1. Determine hydraulic characteristics and sediment transport rate of representative sections 2. Create a normalized section that has the same velocity and depth 3. Back calculate a normalized roughness value for the normalized section 4. Use optimization model to solve the normalized section such that the calculated sediment transport
rate equals the stable sediment transport rate
Results
Results of the analytical assessment allow the computation of a stable slope for East Plum Creek. The stable sediment load from Reach 1 was applied to Reaches 2, 3, 5 and 6 determined that the stable sediment load is approximately the value of the sediment transport capacity of Reach 1. This transport rate was applied to determine the stable channel slope for each reach under the 2, 10, and 100-year flow rates. These values are included in Table IV-5 below:
TABLE IV-5
Stable Slope Computation for the 2, 10, and 100-Year Flow Rates
2-YR Initial Conditions 2-YR Stable Conditions
Reach ID
Channel Flow
Depth (ft)
Channel Velocity (ft/sec)
Energy Slope (ft/ft)
n (normalized)
Normalized Depth
(ft)
Normalized Velocity (ft/sec)
Stable Channel
Slope (ft/ft)
Stable Slope
(%)
2 5.63 5.74 0.006 0.05 5.60 5.50 0.006 0.60%
3 7.46 6.52 0.005 0.04 4.53 5.56 0.006 0.59%
5 8.44 6.57 0.005 0.04 3.92 5.61 0.007 0.65%
6 7.61 6.85 0.008 0.05 6.15 5.47 0.006 0.60%
Average 0.61%
10-YR Initial Conditions 10-YR Stable Conditions
Reach ID
Channel Flow Depth
(ft)
Channel Velocity (ft/sec)
Energy Slope (ft/ft)
n (normalized)
Normalized Depth
(ft)
Normalized Velocity (ft/sec)
Stable Channel
Slope (ft/ft)
Stable Slope
(%)
2 7.71 8.31 0.007 0.04 8.04 7.50 0.006 0.57%
3 11.39 12.92 0.009 0.03 6.22 7.60 0.005 0.50%
5 9.54 8.91 0.007 0.03 8.18 7.49 0.005 0.53%
6 8.39 8.45 0.007 0.04 7.58 7.52 0.006 0.61%
Average 0.55%
100-YR Initial Conditions 100-YR Stable Conditions

EAST PLUM CREEK WATERSHED MASTER PLAN PRELIMINARY DESIGN REPORT
39
TABLE IV-5
Stable Slope Computation for the 2, 10, and 100-Year Flow Rates
2-YR Initial Conditions 2-YR Stable Conditions
Reach ID
Channel Flow
Depth (ft)
Channel Velocity (ft/sec)
Energy Slope (ft/ft)
n (normalized)
Normalized Depth
(ft)
Normalized Velocity (ft/sec)
Stable Channel
Slope (ft/ft)
Stable Slope
(%)
2 5.63 5.74 0.006 0.05 5.60 5.50 0.006 0.60%
Reach ID
Channel Flow Depth
(ft)
Channel Velocity (ft/sec)
Energy Slope (ft/ft)
n (normalized)
Normalized Depth
(ft)
Normalized Velocity (ft/sec)
Stable Channel
Slope (ft/ft)
Stable Slope
(%)
2 10.16 10.86 0.007 0.03 8.49 9.26 0.006 0.58%
3 17.48 15.43 0.013 0.03 10.98 9.13 0.005 0.53%
5* 14.56 10.57 0.005 0.03 12.65 9.06 0.004 0.44%
6 11.66 10.28 0.007 0.04 10.40 9.16 0.006 0.57%
Average 0.53%
*The optimization model converged on two separate solutions the upper stable slope value equaled 0.67% and the lower stable slope value equaled 0.42%. The lesser of the two values was taken.
Non-linear optimization models, such as the one used for this study, have a tendency to converge on local maxima or minima as solutions that satisfy all constraints and optimality. A value of 0.40% was used as a beginning point for iterations to solve the objective function. Reach 5 for the 100 year iterations showed the most instability and converged at two different solutions. For this case, the lower of the two values was chosen.
Summary
A qualitative and quantitative analysis was performed to determine the sediment transport rate and stable sediment transport rate for East Plum Creek within the Town limits of Castle Rock, Colorado. A site review, historic assessment, and analytical analysis were used to separate East Plum Creek into six defined reaches.
From the site review two reaches were determined to be representative of a stable slope for East Plum Creek. The furthest upstream Reach, Reach 1, had not been largely affected by development within the watershed and the Reach through downtown, Reach 4, had undergone improvements designed to stabilize the channel within a defined HCP. The site review revealed that channel degradation, bank erosion, and undercutting of hydraulic structures became more pronounced the further downstream the site review was conducted. At the beginning in Reach 1, channel degradation and minor bank erosion were only found around hydraulic structures. At the end of the site review, the channel was consistently incised 4 to 5 feet from channel degradation.
The analytical computations from Reach 1 were compared to Reach 4 and were found to be similar. Having the analytical computations match observations from the site review strengthened the assumption to use Reach 1 to define the stable sediment load. A channel slope that can carry this load through the study area was assumed to be the slope that would create a stable channel.
Given that Reach 1 defined the stable sediment load analytical computations were used to determine a stable slope for Reaches 2, 3, 5, and 6 based on that stable transport rate. The average of the stable slope computations for the 2, 10, and 100-year flow rates are presented in Table IV-6.
TABLE IV-6
Average Stable Slope by Reach
Reach ID Average Stable
Slope
Reach 2 0.58%
Reach 3 0.54%
Reach 5 0.54%
Reach 6 0.59%
Overall Average by Reach 0.56%
Concepts used for the computation of sediment transport innately include a margin of error. In general, the methods used in this assessment provide the concept of a target slope that will reduce degradation and aggradation of the main channel. The less degradation in the main channel the higher the groundwater table will be and more vegetation will grow to protect the banks, thus reducing bank erosion. The findings of this study suggest that a stable slope for East Plum Creek within the study area is between 0.5% and 0.6%.