section 6: key performance indicators · claims where a court finds the insured employer breached...
TRANSCRIPT
Section 6: Key Performance Indicators92 Additional Key Performance Indicator information94 Key Performance Indicators
91
Financial statements and notes
GGG ChecklistIntroduction Agency in focus Scheme performance
Report on operations
Opportunities and challenges
Disclosures and legal compliance
Key performance indicators
Additional Key Performance Indicator information
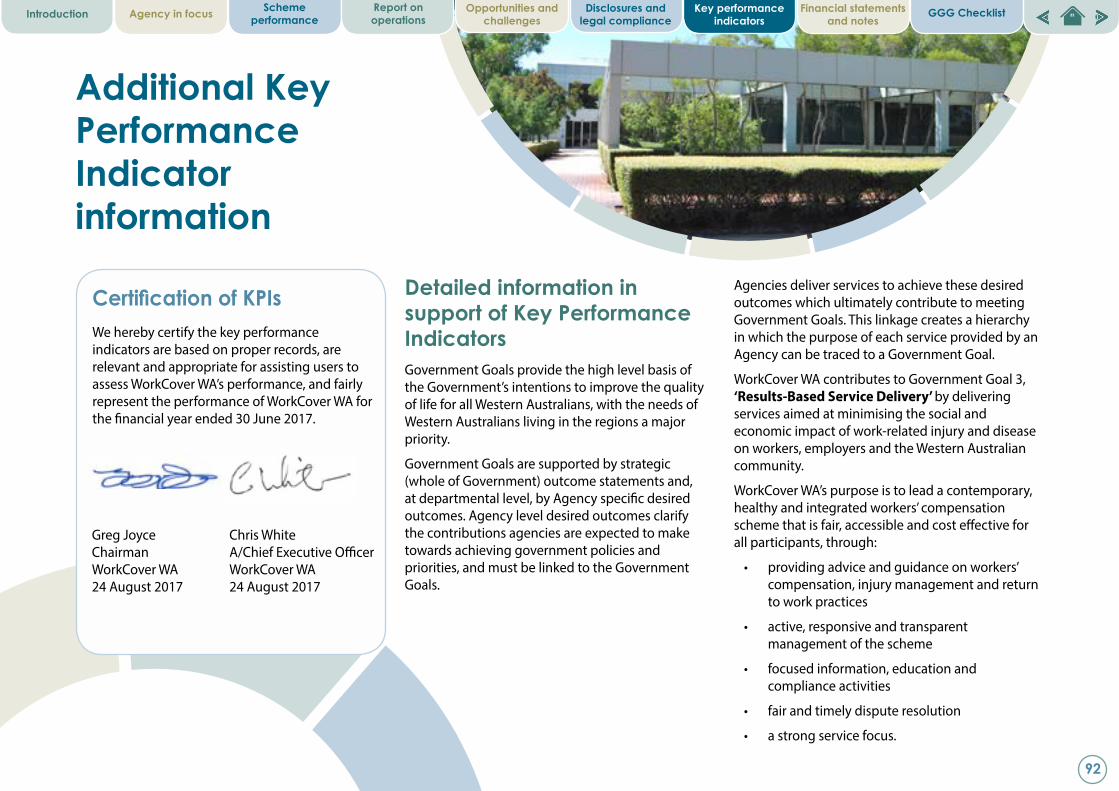
Greg Joyce Chairman WorkCover WA 24 August 2017
Chris White A/Chief Executive Officer WorkCover WA 24 August 2017
Certification of KPIsWe hereby certify the key performance indicators are based on proper records, are relevant and appropriate for assisting users to assess WorkCover WA’s performance, and fairly represent the performance of WorkCover WA for the financial year ended 30 June 2017.
Detailed information in support of Key Performance IndicatorsGovernment Goals provide the high level basis of the Government’s intentions to improve the quality of life for all Western Australians, with the needs of Western Australians living in the regions a major priority.
Government Goals are supported by strategic (whole of Government) outcome statements and, at departmental level, by Agency specific desired outcomes. Agency level desired outcomes clarify the contributions agencies are expected to make towards achieving government policies and priorities, and must be linked to the Government Goals.
Agencies deliver services to achieve these desired outcomes which ultimately contribute to meeting Government Goals. This linkage creates a hierarchy in which the purpose of each service provided by an Agency can be traced to a Government Goal.
WorkCover WA contributes to Government Goal 3, ‘Results-Based Service Delivery’ by delivering services aimed at minimising the social and economic impact of work-related injury and disease on workers, employers and the Western Australian community.
WorkCover WA’s purpose is to lead a contemporary, healthy and integrated workers’ compensation scheme that is fair, accessible and cost effective for all participants, through:
• providing advice and guidance on workers’ compensation, injury management and return to work practices
• active, responsive and transparent management of the scheme
• focused information, education and compliance activities
• fair and timely dispute resolution
• a strong service focus.
92
Financial statements and notes
GGG ChecklistIntroduction Agency in focus Scheme performance
Report on operations
Opportunities and challenges
Disclosures and legal compliance
Key performance indicators
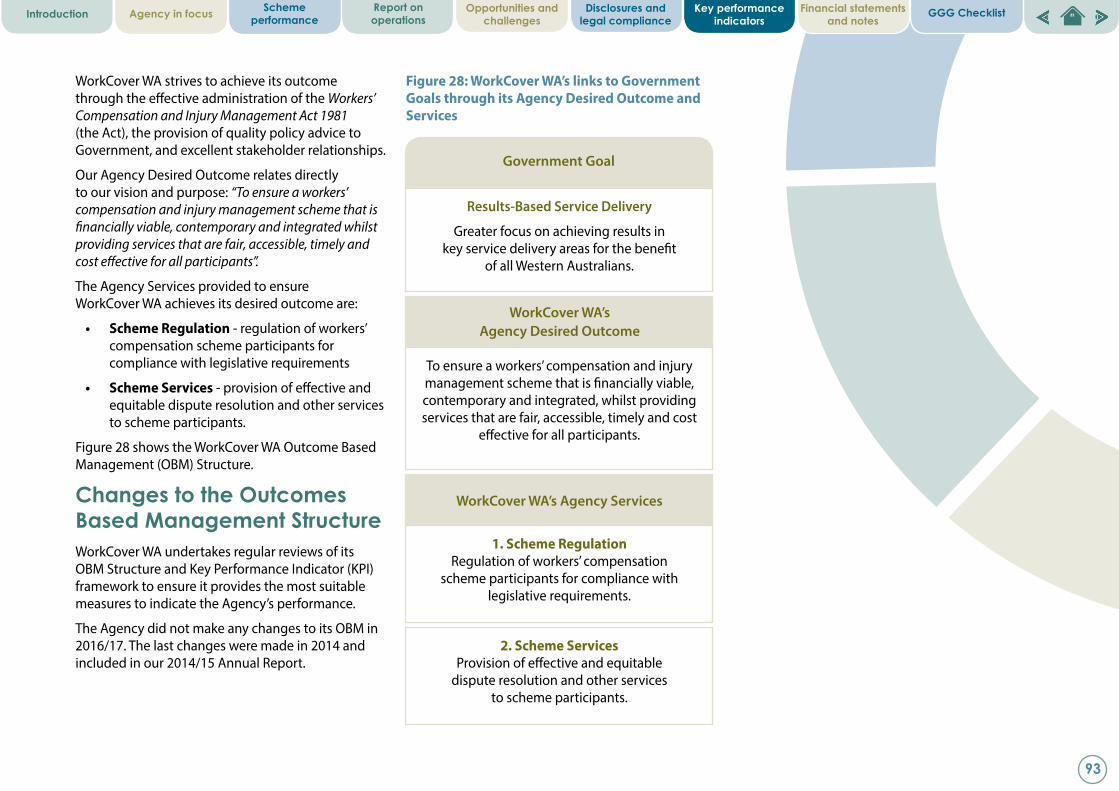
Results-Based Service Delivery
Greater focus on achieving results in key service delivery areas for the benefit
of all Western Australians.
Government Goal
WorkCover WA’s Agency Desired Outcome
WorkCover WA’s Agency Services
To ensure a workers’ compensation and injury management scheme that is financially viable, contemporary and integrated, whilst providing services that are fair, accessible, timely and cost
effective for all participants.
1. Scheme Regulation Regulation of workers’ compensation
scheme participants for compliance with legislative requirements.
2. Scheme Services Provision of effective and equitable
dispute resolution and other services to scheme participants.
Figure 28: WorkCover WA’s links to Government Goals through its Agency Desired Outcome and Services
WorkCover WA strives to achieve its outcome through the effective administration of the Workers’ Compensation and Injury Management Act 1981 (the Act), the provision of quality policy advice to Government, and excellent stakeholder relationships.
Our Agency Desired Outcome relates directly to our vision and purpose: “To ensure a workers’ compensation and injury management scheme that is financially viable, contemporary and integrated whilst providing services that are fair, accessible, timely and cost effective for all participants”.
The Agency Services provided to ensure WorkCover WA achieves its desired outcome are:
• Scheme Regulation - regulation of workers’ compensation scheme participants for compliance with legislative requirements
• Scheme Services - provision of effective and equitable dispute resolution and other services to scheme participants.
Figure 28 shows the WorkCover WA Outcome Based Management (OBM) Structure.
Changes to the Outcomes Based Management Structure WorkCover WA undertakes regular reviews of its OBM Structure and Key Performance Indicator (KPI)framework to ensure it provides the most suitable measures to indicate the Agency’s performance.
The Agency did not make any changes to its OBM in 2016/17. The last changes were made in 2014 and included in our 2014/15 Annual Report.
93
Financial statements and notes
GGG ChecklistIntroduction Agency in focus Scheme performance
Report on operations
Opportunities and challenges
Disclosures and legal compliance
Key performance indicators
Key Performance Indicators
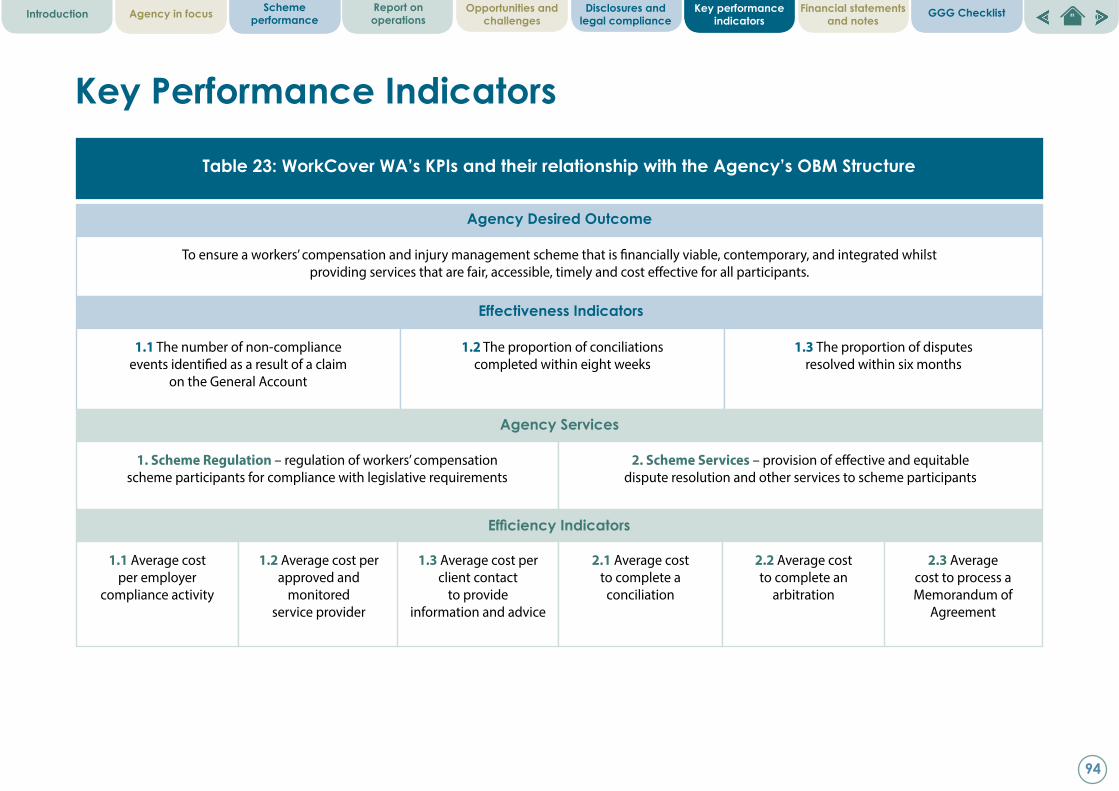
To ensure a workers’ compensation and injury management scheme that is financially viable, contemporary, and integrated whilst providing services that are fair, accessible, timely and cost effective for all participants.
Table 23: WorkCover WA’s KPIs and their relationship with the Agency’s OBM Structure
Agency Desired Outcome
1.1 The number of non-compliance events identified as a result of a claim
on the General Account
1.2 The proportion of conciliations completed within eight weeks
1.3 The proportion of disputes resolved within six months
Effectiveness Indicators
1. Scheme Regulation – regulation of workers’ compensation scheme participants for compliance with legislative requirements
2. Scheme Services – provision of effective and equitable dispute resolution and other services to scheme participants
1.1 Average cost per employer
compliance activity
2.3 Average cost to process a Memorandum of
Agreement
1.2 Average cost per approved and
monitored service provider
1.3 Average cost per client contact
to provide information and advice
2.1 Average cost to complete a
conciliation
2.2 Average cost to complete an
arbitration
Agency Services
Efficiency Indicators
94
Financial statements and notes
GGG ChecklistIntroduction Agency in focus Scheme performance
Report on operations
Opportunities and challenges
Disclosures and legal compliance
Key performance indicators
Summary of Key Performance Indicators
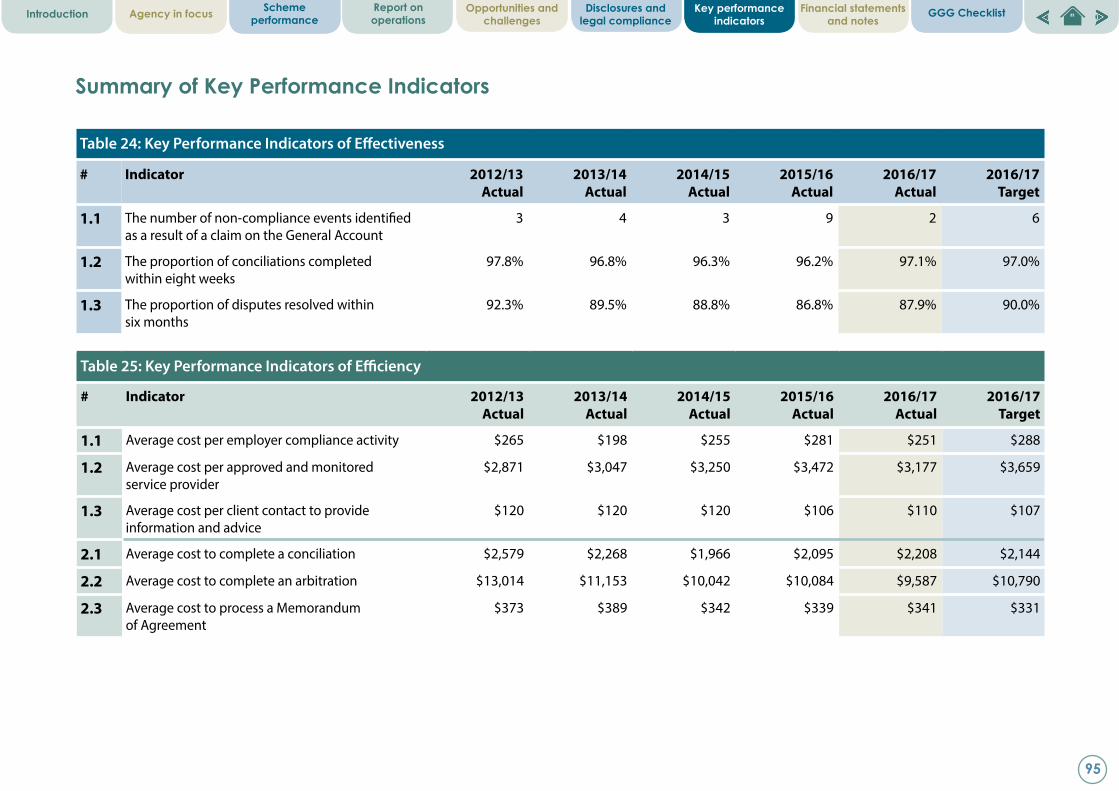
Table 24: Key Performance Indicators of Effectiveness
# Indicator 2012/13 Actual
2013/14 Actual
2014/15 Actual
2015/16 Actual
2016/17Actual
2016/17 Target
1.1 The number of non-compliance events identified as a result of a claim on the General Account
3 4 3 9 2 6
1.2 The proportion of conciliations completed within eight weeks
97.8% 96.8% 96.3% 96.2% 97.1% 97.0%
1.3 The proportion of disputes resolved within six months
92.3% 89.5% 88.8% 86.8% 87.9% 90.0%
Table 25: Key Performance Indicators of Efficiency
# Indicator 2012/13 Actual
2013/14 Actual
2014/15 Actual
2015/16 Actual
2016/17Actual
2016/17 Target
1.1 Average cost per employer compliance activity $265 $198 $255 $281 $251 $288
1.2 Average cost per approved and monitored service provider
$2,871 $3,047 $3,250 $3,472 $3,177 $3,659
1.3 Average cost per client contact to provide information and advice
$120 $120 $120 $106 $110 $107
2.1 Average cost to complete a conciliation $2,579 $2,268 $1,966 $2,095 $2,208 $2,144
2.2 Average cost to complete an arbitration $13,014 $11,153 $10,042 $10,084 $9,587 $10,790
2.3 Average cost to process a Memorandum of Agreement
$373 $389 $342 $339 $341 $331
95
Financial statements and notes
GGG ChecklistIntroduction Agency in focus Scheme performance
Report on operations
Opportunities and challenges
Disclosures and legal compliance
Key performance indicators
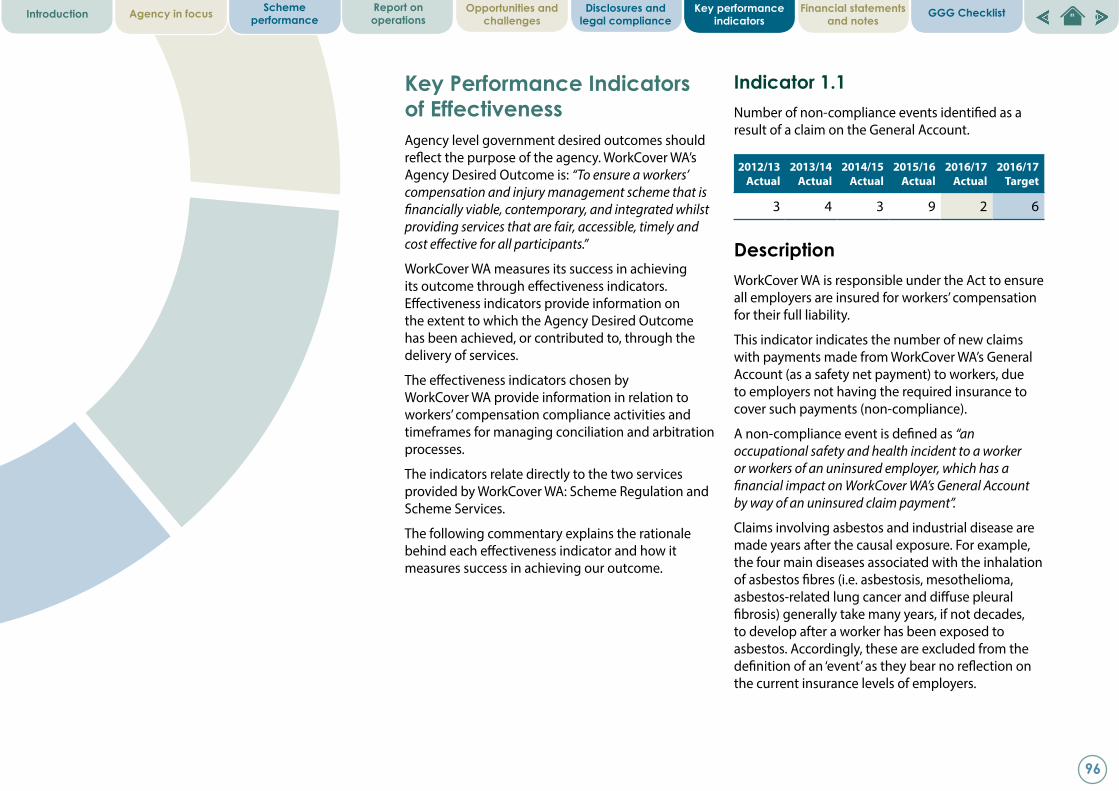
Indicator 1.1 Number of non-compliance events identified as a result of a claim on the General Account.
DescriptionWorkCover WA is responsible under the Act to ensure all employers are insured for workers’ compensation for their full liability.
This indicator indicates the number of new claims with payments made from WorkCover WA’s General Account (as a safety net payment) to workers, due to employers not having the required insurance to cover such payments (non-compliance).
A non-compliance event is defined as “an occupational safety and health incident to a worker or workers of an uninsured employer, which has a financial impact on WorkCover WA’s General Account by way of an uninsured claim payment”.
Claims involving asbestos and industrial disease are made years after the causal exposure. For example, the four main diseases associated with the inhalation of asbestos fibres (i.e. asbestosis, mesothelioma, asbestos-related lung cancer and diffuse pleural fibrosis) generally take many years, if not decades, to develop after a worker has been exposed to asbestos. Accordingly, these are excluded from the definition of an ‘event’ as they bear no reflection on the current insurance levels of employers.
Key Performance Indicators of EffectivenessAgency level government desired outcomes should reflect the purpose of the agency. WorkCover WA’s Agency Desired Outcome is: “To ensure a workers’ compensation and injury management scheme that is financially viable, contemporary, and integrated whilst providing services that are fair, accessible, timely and cost effective for all participants.”
WorkCover WA measures its success in achieving its outcome through effectiveness indicators. Effectiveness indicators provide information on the extent to which the Agency Desired Outcome has been achieved, or contributed to, through the delivery of services.
The effectiveness indicators chosen by WorkCover WA provide information in relation to workers’ compensation compliance activities and timeframes for managing conciliation and arbitration processes.
The indicators relate directly to the two services provided by WorkCover WA: Scheme Regulation and Scheme Services.
The following commentary explains the rationale behind each effectiveness indicator and how it measures success in achieving our outcome.
2012/13 Actual
2013/14 Actual
2014/15 Actual
2015/16 Actual
2016/17Actual
2016/17 Target
3 4 3 9 2 6
96
Financial statements and notes
GGG ChecklistIntroduction Agency in focus Scheme performance
Report on operations
Opportunities and challenges
Disclosures and legal compliance
Key performance indicators
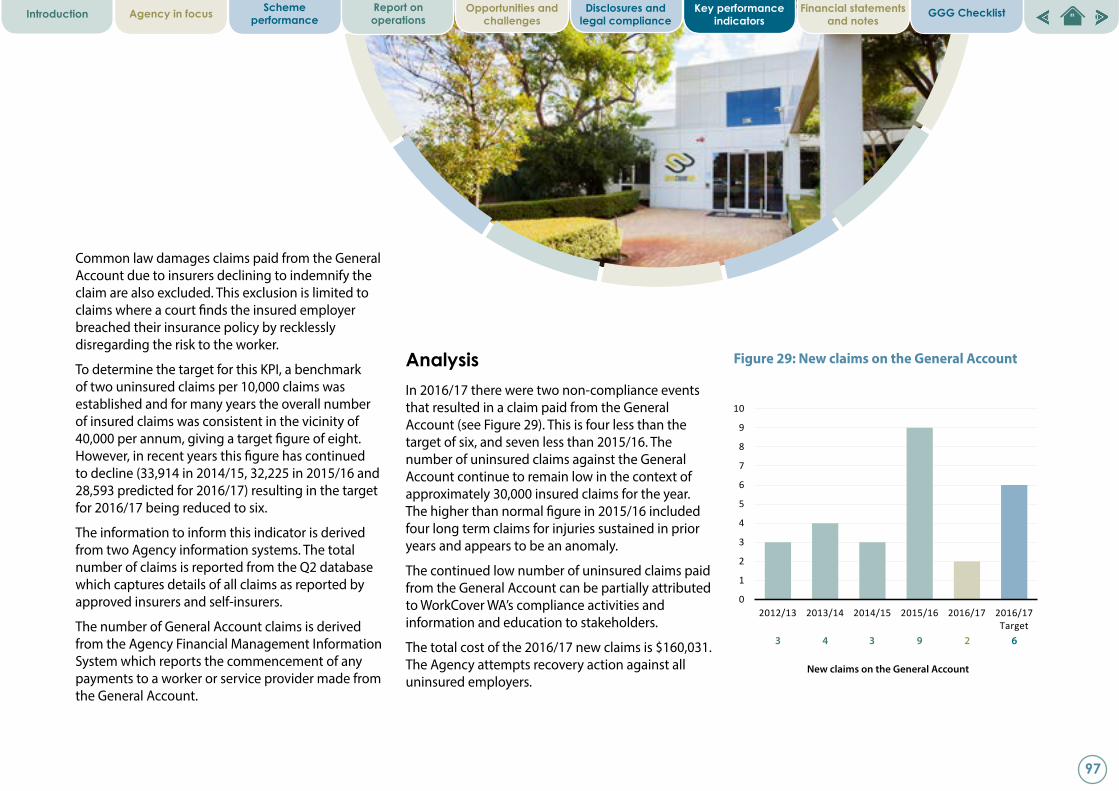
Common law damages claims paid from the General Account due to insurers declining to indemnify the claim are also excluded. This exclusion is limited to claims where a court finds the insured employer breached their insurance policy by recklessly disregarding the risk to the worker.
To determine the target for this KPI, a benchmark of two uninsured claims per 10,000 claims was established and for many years the overall number of insured claims was consistent in the vicinity of 40,000 per annum, giving a target figure of eight. However, in recent years this figure has continued to decline (33,914 in 2014/15, 32,225 in 2015/16 and 28,593 predicted for 2016/17) resulting in the target for 2016/17 being reduced to six.
The information to inform this indicator is derived from two Agency information systems. The total number of claims is reported from the Q2 database which captures details of all claims as reported by approved insurers and self-insurers.
The number of General Account claims is derived from the Agency Financial Management Information System which reports the commencement of any payments to a worker or service provider made from the General Account.
Analysis In 2016/17 there were two non-compliance events that resulted in a claim paid from the General Account (see Figure 29). This is four less than the target of six, and seven less than 2015/16. The number of uninsured claims against the General Account continue to remain low in the context of approximately 30,000 insured claims for the year. The higher than normal figure in 2015/16 included four long term claims for injuries sustained in prior years and appears to be an anomaly.
The continued low number of uninsured claims paid from the General Account can be partially attributed to WorkCover WA’s compliance activities and information and education to stakeholders.
The total cost of the 2016/17 new claims is $160,031. The Agency attempts recovery action against all uninsured employers.
Figure 29: New claims on the General Account
New claims on the General Account
3 4 3 9 2 6
2012/13 32013/14 42014/15 32015/16 92016/17 22016/17 Target 6
0
1
2
3
4
5
6
7
8
9
10
2012/13 2013/14 2014/15 2015/16 2016/17 2016/17 Target
97
Financial statements and notes
GGG ChecklistIntroduction Agency in focus Scheme performance
Report on operations
Opportunities and challenges
Disclosures and legal compliance
Key performance indicators
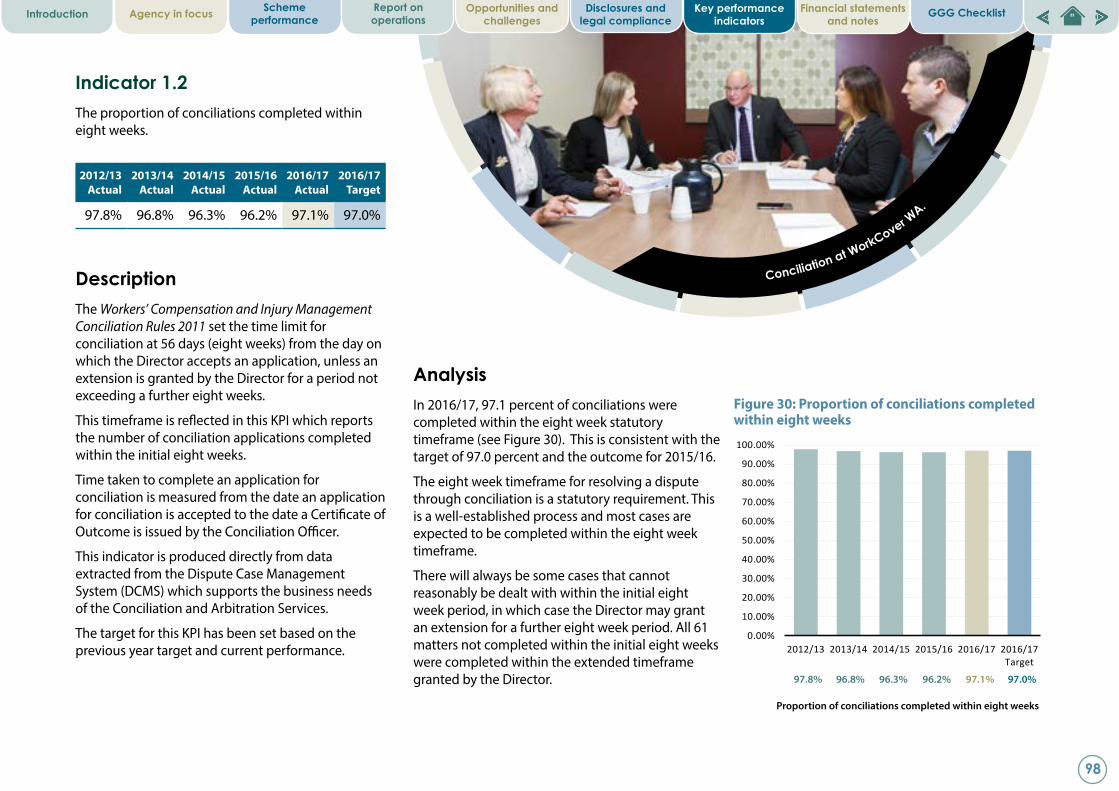
Analysis In 2016/17, 97.1 percent of conciliations were completed within the eight week statutory timeframe (see Figure 30). This is consistent with the target of 97.0 percent and the outcome for 2015/16.
The eight week timeframe for resolving a dispute through conciliation is a statutory requirement. This is a well-established process and most cases are expected to be completed within the eight week timeframe.
There will always be some cases that cannot reasonably be dealt with within the initial eight week period, in which case the Director may grant an extension for a further eight week period. All 61 matters not completed within the initial eight weeks were completed within the extended timeframe granted by the Director.
Figure 30: Proportion of conciliations completed within eight weeks
Indicator 1.2 The proportion of conciliations completed within eight weeks.
DescriptionThe Workers’ Compensation and Injury Management Conciliation Rules 2011 set the time limit for conciliation at 56 days (eight weeks) from the day on which the Director accepts an application, unless an extension is granted by the Director for a period not exceeding a further eight weeks.
This timeframe is reflected in this KPI which reports the number of conciliation applications completed within the initial eight weeks.
Time taken to complete an application for conciliation is measured from the date an application for conciliation is accepted to the date a Certificate of Outcome is issued by the Conciliation Officer.
This indicator is produced directly from data extracted from the Dispute Case Management System (DCMS) which supports the business needs of the Conciliation and Arbitration Services.
The target for this KPI has been set based on the previous year target and current performance.
2012/13 Actual
2013/14 Actual
2014/15 Actual
2015/16 Actual
2016/17Actual
2016/17 Target
97.8% 96.8% 96.3% 96.2% 97.1% 97.0%
Conciliation at WorkCover WA.
Proportion of conciliations completed within eight weeks
97.8% 96.8% 96.3% 96.2% 97.1% 97.0%
2012/13 97.80%2013/14 96.80%2014/15 96.30%2015/16 96.20%2016/17 97.10%2016/17 Target 97.00%
0.00%
10.00%
20.00%
30.00%
40.00%
50.00%
60.00%
70.00%
80.00%
90.00%
100.00%
2012/13 2013/14 2014/15 2015/16 2016/17 2016/17 Target
98
Financial statements and notes
GGG ChecklistIntroduction Agency in focus Scheme performance
Report on operations
Opportunities and challenges
Disclosures and legal compliance
Key performance indicators
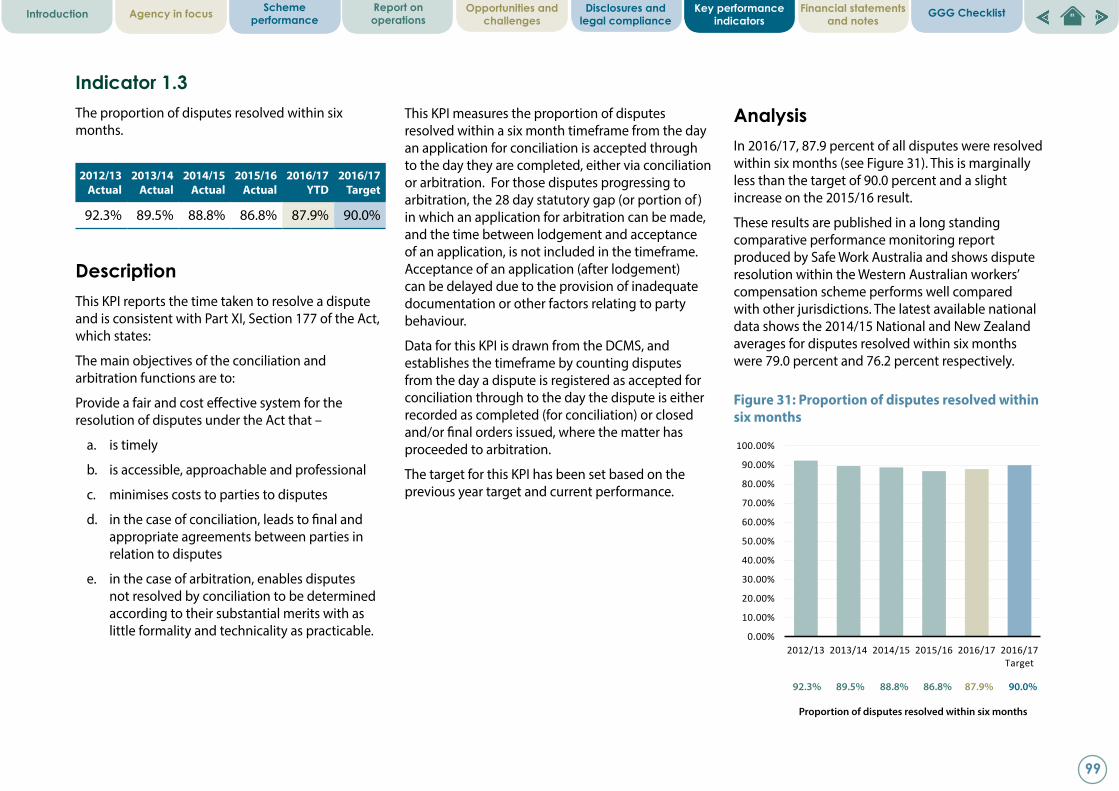
Indicator 1.3The proportion of disputes resolved within six months.
DescriptionThis KPI reports the time taken to resolve a dispute and is consistent with Part XI, Section 177 of the Act, which states:
The main objectives of the conciliation and arbitration functions are to:
Provide a fair and cost effective system for the resolution of disputes under the Act that –
a. is timely
b. is accessible, approachable and professional
c. minimises costs to parties to disputes
d. in the case of conciliation, leads to final and appropriate agreements between parties in relation to disputes
e. in the case of arbitration, enables disputes not resolved by conciliation to be determined according to their substantial merits with as little formality and technicality as practicable.
This KPI measures the proportion of disputes resolved within a six month timeframe from the day an application for conciliation is accepted through to the day they are completed, either via conciliation or arbitration. For those disputes progressing to arbitration, the 28 day statutory gap (or portion of ) in which an application for arbitration can be made, and the time between lodgement and acceptance of an application, is not included in the timeframe. Acceptance of an application (after lodgement) can be delayed due to the provision of inadequate documentation or other factors relating to party behaviour.
Data for this KPI is drawn from the DCMS, and establishes the timeframe by counting disputes from the day a dispute is registered as accepted for conciliation through to the day the dispute is either recorded as completed (for conciliation) or closed and/or final orders issued, where the matter has proceeded to arbitration.
The target for this KPI has been set based on the previous year target and current performance.
Analysis In 2016/17, 87.9 percent of all disputes were resolved within six months (see Figure 31). This is marginally less than the target of 90.0 percent and a slight increase on the 2015/16 result.
These results are published in a long standing comparative performance monitoring report produced by Safe Work Australia and shows dispute resolution within the Western Australian workers’ compensation scheme performs well compared with other jurisdictions. The latest available national data shows the 2014/15 National and New Zealand averages for disputes resolved within six months were 79.0 percent and 76.2 percent respectively.
2012/13 Actual
2013/14 Actual
2014/15 Actual
2015/16 Actual
2016/17YTD
2016/17 Target
92.3% 89.5% 88.8% 86.8% 87.9% 90.0%
Figure 31: Proportion of disputes resolved within six months
Proportion of disputes resolved within six months
2012/13 92.30%2013/14 89.50%2014/15 88.80%2015/16 86.80%2016/17 87.90%2016/17 Target 90.00%
0.00%
10.00%
20.00%
30.00%
40.00%
50.00%
60.00%
70.00%
80.00%
90.00%
100.00%
2012/13 2013/14 2014/15 2015/16 2016/17 2016/17 Target
92.3% 89.5% 88.8% 86.8% 87.9% 90.0%
99
Financial statements and notes
GGG ChecklistIntroduction Agency in focus Scheme performance
Report on operations
Opportunities and challenges
Disclosures and legal compliance
Key performance indicators
Key Indicators of EfficiencyEfficiency indicators relate Agency services to the level of resource inputs required to deliver them. The efficiency indicators for WorkCover WA are focused on financial resources and provide a per-unit cost.
There are three efficiency indicators chosen for each of the two Agency services. These indicators measure the overall unit costs of delivering the core services of dispute resolution and regulation of scheme participants.
Allocation of Agency costsTo ensure accurate allocations of costs to the KPIs across the Agency, a formal Agency cost mapping model is used. The cost allocation model is used to determine overheads and to allocate costs across the Agency’s divisions and six efficiency KPIs and is reviewed for accuracy every two years. Budget figures used in the costing model are consistent with the Agency’s approved budget.
Direct costs for each activity are allocated to individual cost centres within the relevant business units in the first instance. Indirect costs (overheads) easily attributed to Full Time Equivalent (FTE) positions, such as payroll tax, superannuation, workers compensation and employee entitlements, are allocated across all Agency cost centres on an FTE basis. Other overheads, such as rates, water, electricity and depreciation of buildings, are allocated according to the floor space specifically allocated to an area.
In order to account for all Agency costs, expenditure from cost centres that are not attributed directly to a KPI is allocated across all KPIs on an FTE basis. Calculation methodologies referred to below for both target and actual figures include allocated overheads through the cost mapping model.
Certain expenditure and revenue in relation to the payment and subsequent recovery of workers’ compensation claims are not incorporated into the KPI calculation data. This is due to the nature of these transactions and the fact that WorkCover WA has no control over General Account and Supplementation Fund claims, which if included, would unduly skew key KPI data (for 2016/17 this represents 10 percent of the total expenditure consistent with the representation for 2015/16).
Service 1: Scheme Regulation – regulation of workers’ compensation scheme participants for compliance with legislative requirements
As part of its responsibilities in administering the Act, WorkCover WA has responsibility to ensure the efficient and effective operation of the workers’ compensation scheme by monitoring compliance of employers, insurers and others participating in or affected by the scheme.
The following KPIs measure the costs of providing these activities.
Advice and Assistance Offi c
er Carl S
mith
.
100
Financial statements and notes
GGG ChecklistIntroduction Agency in focus Scheme performance
Report on operations
Opportunities and challenges
Disclosures and legal compliance
Key performance indicators
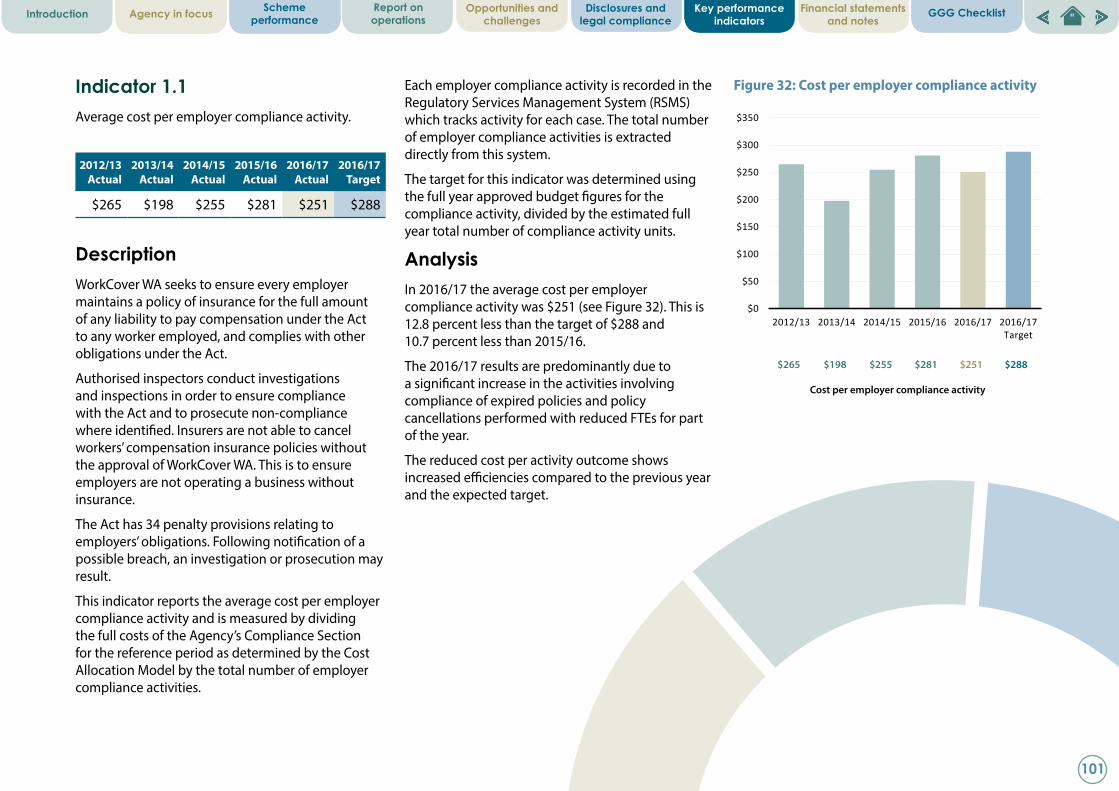
Indicator 1.1Average cost per employer compliance activity.
DescriptionWorkCover WA seeks to ensure every employer maintains a policy of insurance for the full amount of any liability to pay compensation under the Act to any worker employed, and complies with other obligations under the Act.
Authorised inspectors conduct investigations and inspections in order to ensure compliance with the Act and to prosecute non-compliance where identified. Insurers are not able to cancel workers’ compensation insurance policies without the approval of WorkCover WA. This is to ensure employers are not operating a business without insurance.
The Act has 34 penalty provisions relating to employers’ obligations. Following notification of a possible breach, an investigation or prosecution may result.
This indicator reports the average cost per employer compliance activity and is measured by dividing the full costs of the Agency’s Compliance Section for the reference period as determined by the Cost Allocation Model by the total number of employer compliance activities.
Each employer compliance activity is recorded in the Regulatory Services Management System (RSMS) which tracks activity for each case. The total number of employer compliance activities is extracted directly from this system.
The target for this indicator was determined using the full year approved budget figures for the compliance activity, divided by the estimated full year total number of compliance activity units.
Analysis In 2016/17 the average cost per employer compliance activity was $251 (see Figure 32). This is 12.8 percent less than the target of $288 and 10.7 percent less than 2015/16.
The 2016/17 results are predominantly due to a significant increase in the activities involving compliance of expired policies and policy cancellations performed with reduced FTEs for part of the year.
The reduced cost per activity outcome shows increased efficiencies compared to the previous year and the expected target.
2012/13 Actual
2013/14 Actual
2014/15 Actual
2015/16 Actual
2016/17Actual
2016/17 Target
$265 $198 $255 $281 $251 $288
Figure 32: Cost per employer compliance activity
Cost per employer compliance activity
2012/13 $2652013/14 $1982014/15 $2552015/16 $2812016/17 $2512016/17 Target $288
$0
$50
$100
$150
$200
$250
$300
$350
2012/13 2013/14 2014/15 2015/16 2016/17 2016/17 Target
$265 $198 $255 $281 $251 $288
101
Financial statements and notes
GGG ChecklistIntroduction Agency in focus Scheme performance
Report on operations
Opportunities and challenges
Disclosures and legal compliance
Key performance indicators
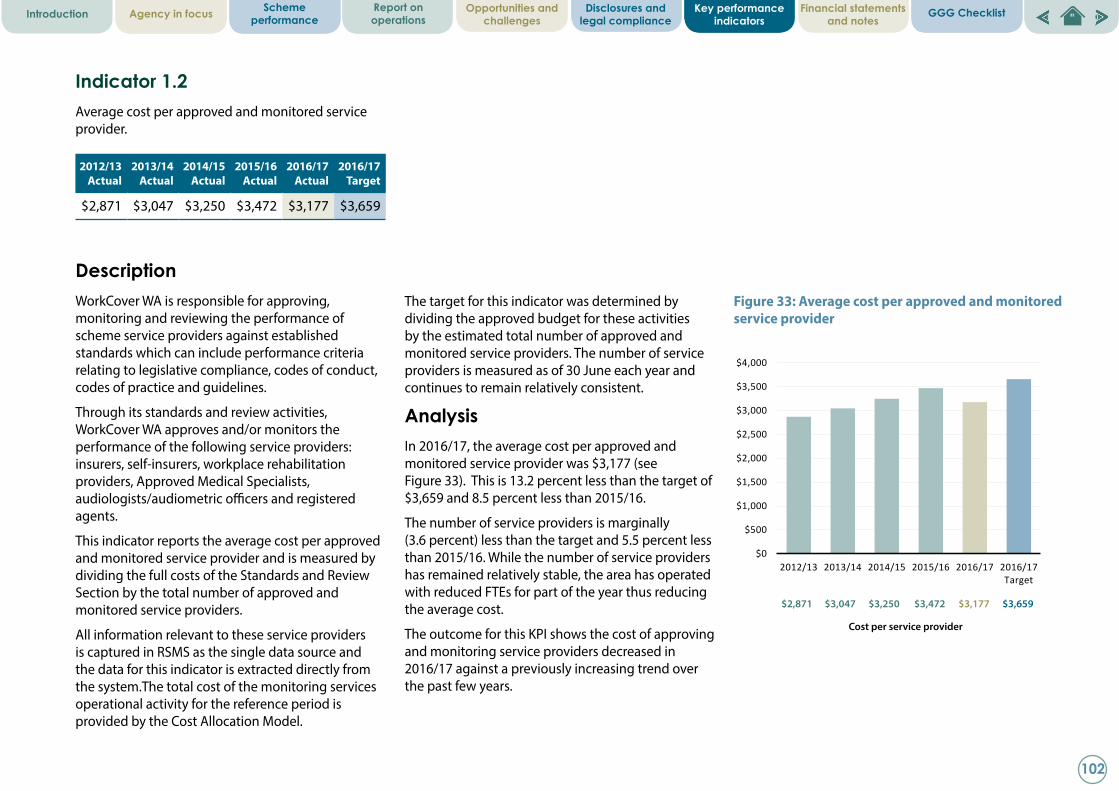
Indicator 1.2Average cost per approved and monitored service provider.
DescriptionWorkCover WA is responsible for approving, monitoring and reviewing the performance of scheme service providers against established standards which can include performance criteria relating to legislative compliance, codes of conduct, codes of practice and guidelines.
Through its standards and review activities, WorkCover WA approves and/or monitors the performance of the following service providers: insurers, self-insurers, workplace rehabilitation providers, Approved Medical Specialists, audiologists/audiometric officers and registered agents.
This indicator reports the average cost per approved and monitored service provider and is measured by dividing the full costs of the Standards and Review Section by the total number of approved and monitored service providers.
All information relevant to these service providers is captured in RSMS as the single data source and the data for this indicator is extracted directly from the system.The total cost of the monitoring services operational activity for the reference period is provided by the Cost Allocation Model.
The target for this indicator was determined by dividing the approved budget for these activities by the estimated total number of approved and monitored service providers. The number of service providers is measured as of 30 June each year and continues to remain relatively consistent.
Analysis In 2016/17, the average cost per approved and monitored service provider was $3,177 (see Figure 33). This is 13.2 percent less than the target of $3,659 and 8.5 percent less than 2015/16.
The number of service providers is marginally (3.6 percent) less than the target and 5.5 percent less than 2015/16. While the number of service providers has remained relatively stable, the area has operated with reduced FTEs for part of the year thus reducing the average cost.
The outcome for this KPI shows the cost of approving and monitoring service providers decreased in 2016/17 against a previously increasing trend over the past few years.
2012/13 Actual
2013/14 Actual
2014/15 Actual
2015/16 Actual
2016/17Actual
2016/17 Target
$2,871 $3,047 $3,250 $3,472 $3,177 $3,659
Figure 33: Average cost per approved and monitored service provider
Cost per service provider
$2,871 $3,047 $3,250 $3,472 $3,177 $3,659
2012/13 $2,8712013/14 $3,0472014/15 $3,2502015/16 $3,4722016/17 $3,1772016/17 Target $3,659
$0
$500
$1,000
$1,500
$2,000
$2,500
$3,000
$3,500
$4,000
2012/13 2013/14 2014/15 2015/16 2016/17 2016/17 Target
102
Financial statements and notes
GGG ChecklistIntroduction Agency in focus Scheme performance
Report on operations
Opportunities and challenges
Disclosures and legal compliance
Key performance indicators
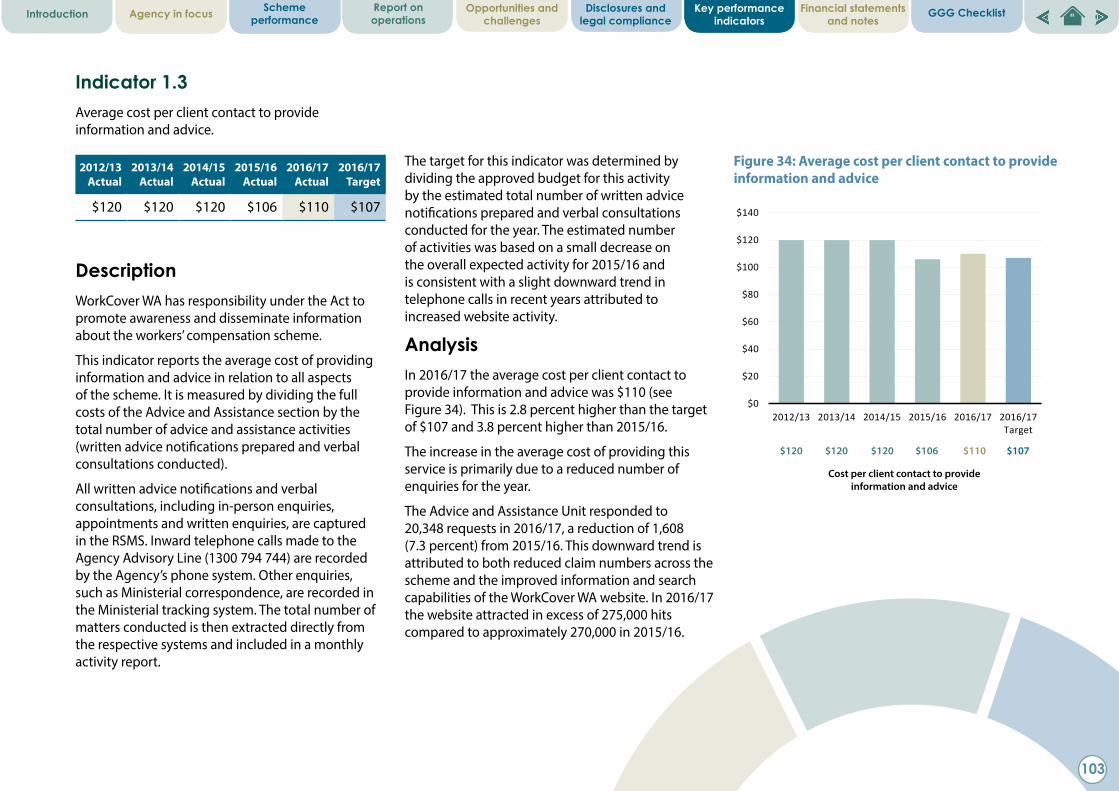
Indicator 1.3Average cost per client contact to provide information and advice.
DescriptionWorkCover WA has responsibility under the Act to promote awareness and disseminate information about the workers’ compensation scheme.
This indicator reports the average cost of providing information and advice in relation to all aspects of the scheme. It is measured by dividing the full costs of the Advice and Assistance section by the total number of advice and assistance activities (written advice notifications prepared and verbal consultations conducted).
All written advice notifications and verbal consultations, including in-person enquiries, appointments and written enquiries, are captured in the RSMS. Inward telephone calls made to the Agency Advisory Line (1300 794 744) are recorded by the Agency’s phone system. Other enquiries, such as Ministerial correspondence, are recorded in the Ministerial tracking system. The total number of matters conducted is then extracted directly from the respective systems and included in a monthly activity report.
The target for this indicator was determined by dividing the approved budget for this activity by the estimated total number of written advice notifications prepared and verbal consultations conducted for the year. The estimated number of activities was based on a small decrease on the overall expected activity for 2015/16 and is consistent with a slight downward trend in telephone calls in recent years attributed to increased website activity.
Analysis In 2016/17 the average cost per client contact to provide information and advice was $110 (see Figure 34). This is 2.8 percent higher than the target of $107 and 3.8 percent higher than 2015/16.
The increase in the average cost of providing this service is primarily due to a reduced number of enquiries for the year.
The Advice and Assistance Unit responded to 20,348 requests in 2016/17, a reduction of 1,608 (7.3 percent) from 2015/16. This downward trend is attributed to both reduced claim numbers across the scheme and the improved information and search capabilities of the WorkCover WA website. In 2016/17 the website attracted in excess of 275,000 hits compared to approximately 270,000 in 2015/16.
2012/13 Actual
2013/14 Actual
2014/15 Actual
2015/16 Actual
2016/17Actual
2016/17 Target
$120 $120 $120 $106 $110 $107
Figure 34: Average cost per client contact to provide information and advice
Cost per client contact to provide information and advice
$120 $120 $120 $106 $110 $107
2012/13 $1202013/14 $1202014/15 $1202015/16 $1062016/17 $1102016/17 Target $107
$0
$20
$40
$60
$80
$100
$120
$140
2012/13 2013/14 2014/15 2015/16 2016/17 2016/17 Target
103
Financial statements and notes
GGG ChecklistIntroduction Agency in focus Scheme performance
Report on operations
Opportunities and challenges
Disclosures and legal compliance
Key performance indicators
Service 2: Scheme Services - provision of effective and equitable dispute resolution and other services to scheme participants
The Conciliation and Arbitration Services provide a fair and cost effective system for the resolution of disputes that is timely, accessible, approachable and professional, and minimises costs to parties to disputes through either conciliation or arbitration.
The Agency is also responsible for recording the finalisation of workers’ compensation claims through the registration of Memoranda of Agreement (MoAs) and the processing of documents submitted in relation to settlement of common law actions initiated in the District Court.
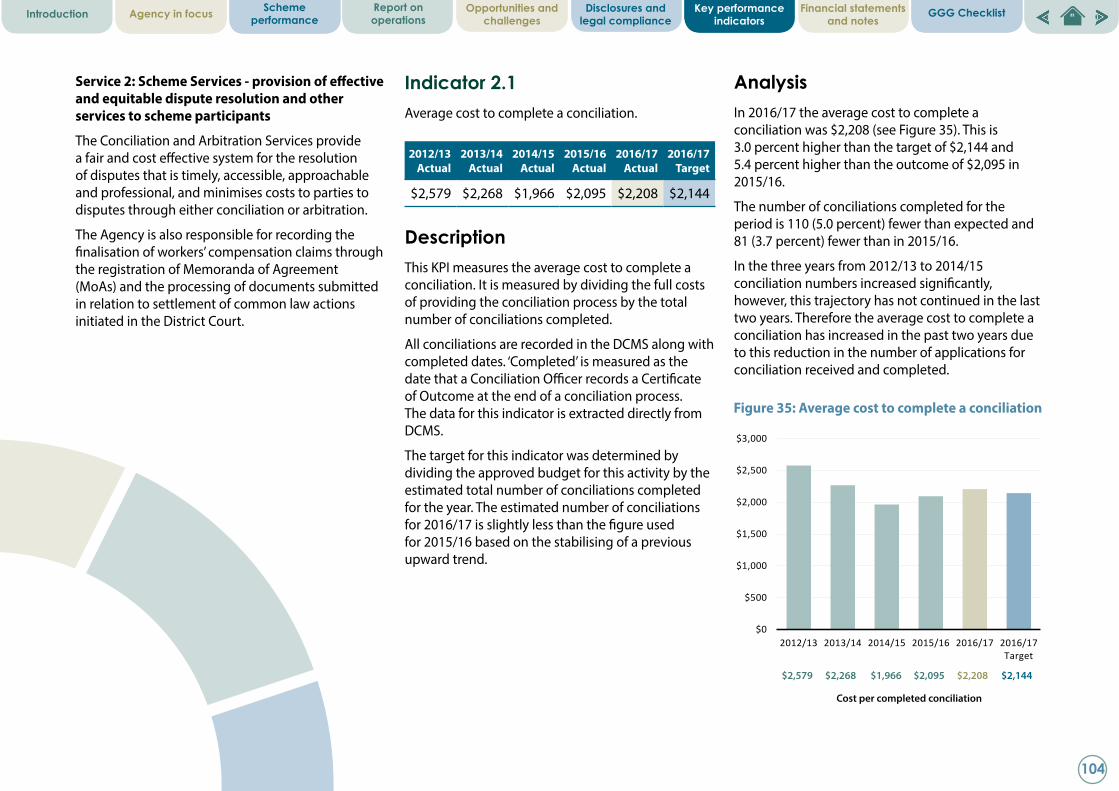
Indicator 2.1Average cost to complete a conciliation.
DescriptionThis KPI measures the average cost to complete a conciliation. It is measured by dividing the full costs of providing the conciliation process by the total number of conciliations completed.
All conciliations are recorded in the DCMS along with completed dates. ‘Completed’ is measured as the date that a Conciliation Officer records a Certificate of Outcome at the end of a conciliation process. The data for this indicator is extracted directly from DCMS.
The target for this indicator was determined by dividing the approved budget for this activity by the estimated total number of conciliations completed for the year. The estimated number of conciliations for 2016/17 is slightly less than the figure used for 2015/16 based on the stabilising of a previous upward trend.
2012/13 Actual
2013/14 Actual
2014/15 Actual
2015/16 Actual
2016/17Actual
2016/17 Target
$2,579 $2,268 $1,966 $2,095 $2,208 $2,144
Analysis In 2016/17 the average cost to complete a conciliation was $2,208 (see Figure 35). This is 3.0 percent higher than the target of $2,144 and 5.4 percent higher than the outcome of $2,095 in 2015/16.
The number of conciliations completed for the period is 110 (5.0 percent) fewer than expected and 81 (3.7 percent) fewer than in 2015/16.
In the three years from 2012/13 to 2014/15 conciliation numbers increased significantly, however, this trajectory has not continued in the last two years. Therefore the average cost to complete a conciliation has increased in the past two years due to this reduction in the number of applications for conciliation received and completed.
Figure 35: Average cost to complete a conciliation
Cost per completed conciliation
$2,579 $2,268 $1,966 $2,095 $2,208 $2,144
2012/13 $2,5792013/14 $2,2682014/15 $1,9662015/16 $2,0952016/17 $2,2082016/17 Target $2,144
$0
$500
$1,000
$1,500
$2,000
$2,500
$3,000
2012/13 2013/14 2014/15 2015/16 2016/17 2016/17 Target
104
Financial statements and notes
GGG ChecklistIntroduction Agency in focus Scheme performance
Report on operations
Opportunities and challenges
Disclosures and legal compliance
Key performance indicators
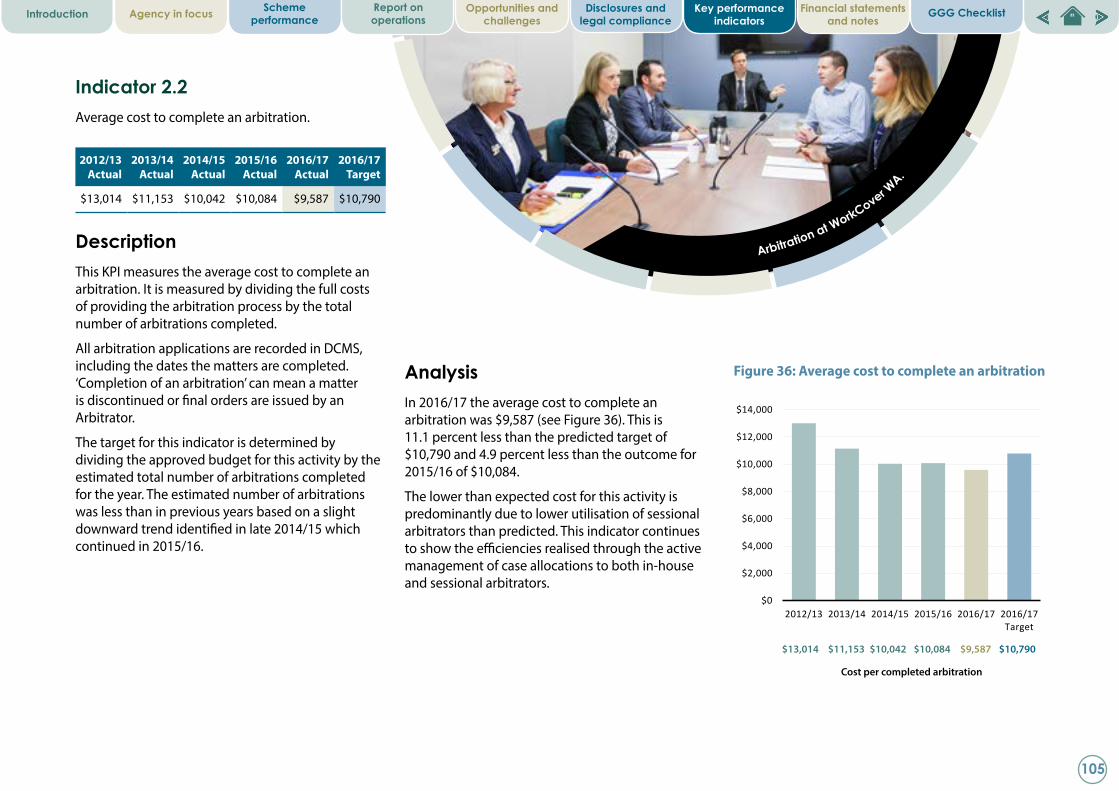
Indicator 2.2Average cost to complete an arbitration.
DescriptionThis KPI measures the average cost to complete an arbitration. It is measured by dividing the full costs of providing the arbitration process by the total number of arbitrations completed.
All arbitration applications are recorded in DCMS, including the dates the matters are completed. ‘Completion of an arbitration’ can mean a matter is discontinued or final orders are issued by an Arbitrator.
The target for this indicator is determined by dividing the approved budget for this activity by the estimated total number of arbitrations completed for the year. The estimated number of arbitrations was less than in previous years based on a slight downward trend identified in late 2014/15 which continued in 2015/16.
2012/13 Actual
2013/14 Actual
2014/15 Actual
2015/16 Actual
2016/17Actual
2016/17 Target
$13,014 $11,153 $10,042 $10,084 $9,587 $10,790
Analysis In 2016/17 the average cost to complete an arbitration was $9,587 (see Figure 36). This is 11.1 percent less than the predicted target of $10,790 and 4.9 percent less than the outcome for 2015/16 of $10,084.
The lower than expected cost for this activity is predominantly due to lower utilisation of sessional arbitrators than predicted. This indicator continues to show the efficiencies realised through the active management of case allocations to both in-house and sessional arbitrators.
Figure 36: Average cost to complete an arbitration
Arbitration at WorkCover W
A.
Cost per completed arbitration
$13,014 $11,153 $10,042 $10,084 $9,587 $10,790
2012/13 $13,0142013/14 $11,1532014/15 $10,0422015/16 $10,0842016/17 $9,5872016/17 Target $10,790
$0
$2,000
$4,000
$6,000
$8,000
$10,000
$12,000
$14,000
2012/13 2013/14 2014/15 2015/16 2016/17 2016/17 Target
105
Financial statements and notes
GGG ChecklistIntroduction Agency in focus Scheme performance
Report on operations
Opportunities and challenges
Disclosures and legal compliance
Key performance indicators
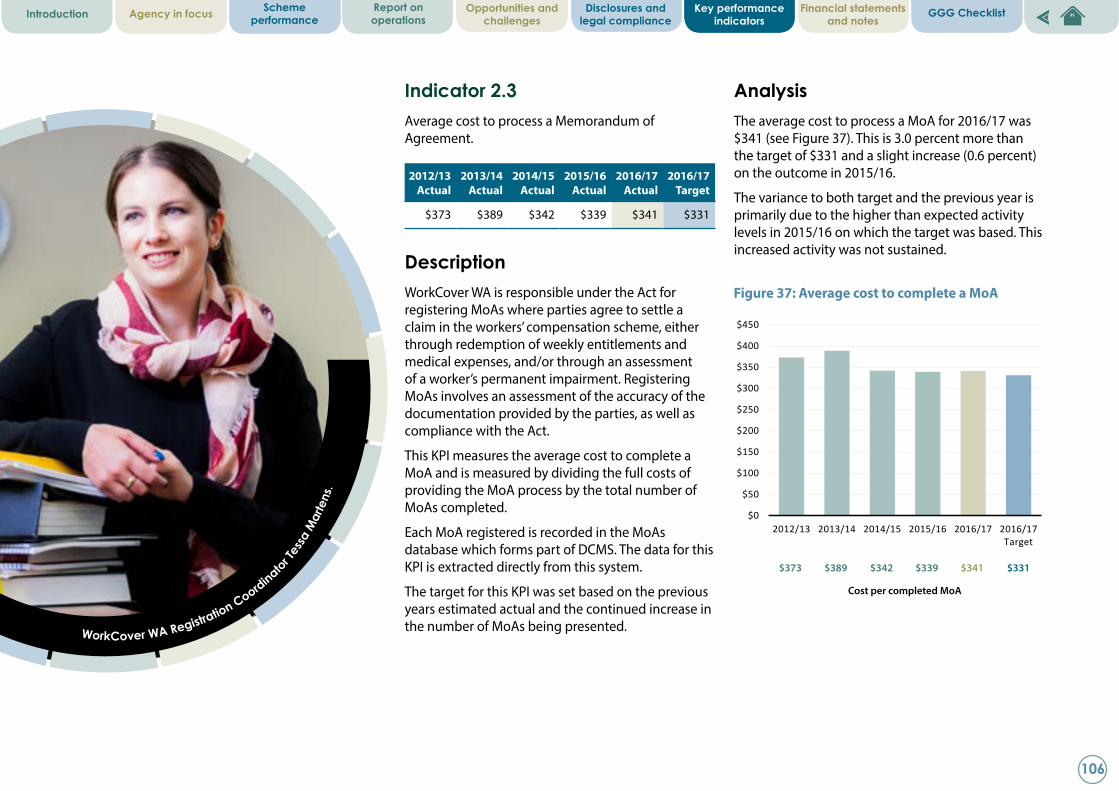
Indicator 2.3Average cost to process a Memorandum of Agreement.
DescriptionWorkCover WA is responsible under the Act for registering MoAs where parties agree to settle a claim in the workers’ compensation scheme, either through redemption of weekly entitlements and medical expenses, and/or through an assessment of a worker’s permanent impairment. Registering MoAs involves an assessment of the accuracy of the documentation provided by the parties, as well as compliance with the Act.
This KPI measures the average cost to complete a MoA and is measured by dividing the full costs of providing the MoA process by the total number of MoAs completed.
Each MoA registered is recorded in the MoAs database which forms part of DCMS. The data for this KPI is extracted directly from this system.
The target for this KPI was set based on the previous years estimated actual and the continued increase in the number of MoAs being presented.
2012/13 Actual
2013/14 Actual
2014/15 Actual
2015/16 Actual
2016/17Actual
2016/17 Target
$373 $389 $342 $339 $341 $331
Analysis The average cost to process a MoA for 2016/17 was $341 (see Figure 37). This is 3.0 percent more than the target of $331 and a slight increase (0.6 percent) on the outcome in 2015/16.
The variance to both target and the previous year is primarily due to the higher than expected activity levels in 2015/16 on which the target was based. This increased activity was not sustained.
Figure 37: Average cost to complete a MoA
WorkCover WA Registration Coordinator T
essa
Mar
tens
.
Cost per completed MoA
$373 $389 $342 $339 $341 $331
2012/13 $3732013/14 $3892014/15 $3422015/16 $3392016/17 $3412016/17 Target $331
$0
$50
$100
$150
$200
$250
$300
$350
$400
$450
2012/13 2013/14 2014/15 2015/16 2016/17 2016/17 Target
106
Financial statements and notes
GGG ChecklistIntroduction Agency in focus Scheme performance
Report on operations
Opportunities and challenges
Disclosures and legal compliance
Key performance indicators